Preliminary Analysis of Price Data -...
21
Preliminary Analysis of Price Data Directorate General Internal Market Economic and Evaluation Unit B3 13 July 2004
Transcript of Preliminary Analysis of Price Data -...

Preliminary Analysis of Price Data
Directorate General Internal Market
Economic and Evaluation Unit B3
13 July 2004

2
TABLE OF CONTENTS
1. INTRODUCTION....................................................................................................... 3
2. DISTRIBUTION OF PRICES OF NON-BRANDED GOODS ................................. 5
3. PRICE DISTRIBUTION OF WELL KNOWN, PAN-EUROPEAN PRODUCTS ................................................................................................................ 6
4. PRICE DISPERSION.................................................................................................. 8
5. COUNTRY ORDER BASED ON NATIONAL PRICES ........................................ 12
6. PRICES IN DIFFERENT OUTLET TYPES............................................................ 16
7. THE EFFECT OF SHOP TYPE ON COUNTRY ORDER...................................... 17
8. THE INTRODUCTION OF THE EURO ................................................................. 19
9. CONCLUSIONS ....................................................................................................... 20

3
1. INTRODUCTION
Price comparisons are good indicators of integration and market performance. If the Internal Market is functioning efficiently, the free circulation of goods and services should ensure that the prices paid do not differ greatly from country to country.
As a follow up to previous exercises on monitoring and benchmarking price differences in the Internal Market1, DG Markt commissioned a survey of the prices of 82 products in 14 EU Member States over a period of three years (see Box 1 for details). Ultimately, the objective of the exercise is to investigate price differences within the European Union and to understand the limits of, or barriers to, price convergence.
This working paper2 discusses the analysis performed to date on the new data set and should be regarded as “a work in progress”. DG Markt intends to publish a more detailed paper at a later date.
The analysis starts with price comparisons for subsets of non-branded and Pan-European goods across the 14 EU countries. The behaviour of these prices over time, and changes in their dispersion are discussed. We also present an initial ranking of the EU 14, showing in which countries goods appear to be cheapest and comparing the cost of a common sub-set of products across both the EU 14 and the US. The impact of the distribution channel on the prices paid is then considered, measuring the difference between prices paid when goods are purchased in a supermarkets and more traditional outlets. We end with a brief discussion of the introduction of the Euro and some summary conclusions of the analysis to date. In all instances, the prices used are the price in Euros across the various countries, BEFORE the addition of VAT.
1 The latest of these “Price differences for supermarket goods in Europe” can be found at http://europa.eu.int/comm/internal_market/en/update/economicreform/2002-05-price_en.pdf
2 This paper is an internal working document of the Internal Market Directorate General. The views presented in this document do therefore not necessarily reflect the views of the Commission.

4
Box 1: The Data
The analysis presented here is based on retail prices collected by AC Nielsen in the 14 Member States of the European Union (excluding Luxembourg) and the United States for the period September 2000 to August 2003. The data set provides prices for 82 different products covering a wide range of groceries, items of personal care and cleaning products. Prices are collected mainly by means of bar code scanners, complemented by data from shop audits and consumer panels.
For each product, prices for up to four different brands have been collected. Within these four brands, wherever possible the data set includes information on both Pan-European brands and generic brands. Pan-European brands are defined as brands which can be found in four of the big five countries (Germany, United Kingdom, Spain, France and Italy) plus in five other countries; generic brands are brands which do not fulfil this criterion.
Furthermore, for each of these brands there is price information for two different size types. The popular size is the one with the greatest sales volume for the brand under consideration, and even within a brand this may vary considerably across countries, reflecting differences in consumer choices and national marketing strategies. The consistent size is a size representation of a brand which can be found in most of the countries. Whilst the consistent and popular sizes can be identical, in most cases they are not. For the analysis presented here, only comparable size presentations have been considered. To enable comparisons across products and countries, prices have then been converted to unit prices, i.e. prices per kilogram, litre or piece.
Example: For the product “Colas”, the data set includes information for each country on two Pan-European brands, Coke and Pepsi. Additionally, the data set provides information on generic brands which are only available locally, such as Koningsbronnen Cola in Belgium or Olvi Cola in Finland. In Germany, Coke sells best in one litre bottles, whilst in the UK the most popular size is two litres. A consistent size of Coke, available in most countries, is the 1.5 litre bottle.
The data set also reflects price variation between different shop types by providing average prices for each product in different kinds of outlet (e.g. supermarkets, hypermarkets, more traditional stores such as small corner shops). Similarly, prices are available for different regions in each country, enabling the analysis of regional differences.
Prices are available as averages for each given time period, weighted by volume of sales. This means that they are representative of what consumers pay on average for the product under consideration in each Member State. These prices are usually not identical with off-the-shelf prices, as averages also take into consideration special promotional offers like “buy two, get one free”. The analysis presented here refers to VAT free Euro prices only, although price data in local currency and including VAT has also been collected.

5
2. DISTRIBUTION OF PRICES OF NON-BRANDED GOODS
The AC Nielson data covers a wide range of every day, household products. For a selection of common non-branded products, Figure 1 shows the dispersion of supermarket prices across Europe for the most recent year, where the middle price, the EU median has been set to the value 100. For each product the grey shaded area shows the distribution of 75% of the countries; in addition the maximum and minimum prices are indicated.
As can be seen, the overall price range for a product can vary significantly. The prices of goods such as Frozen Fish, UHT half-fat milk and Honey fall within a relatively narrow range; other products such as Ground Coffee, Dry Soups and Sugar have quite large differences between the maximum and minimum prices found in the EU 14. This dispersion is just as marked when we consider the distribution of 75% of the countries (the grey shaded areas) – for Rice and Flour the overall range of prices is fairly similar, but the grey area for Flour is smaller than that of Rice, with more countries being placed above the median value.
Looking at where the maximum and minimum prices occur, we see that these honours are shared by eight different countries in each case, with some countries being present in both lists. Overall, 12 of the 14 EU countries are represented in this list of just 17 products. For example, whilst prices in Finland are highest for four of the goods presented below, they are also lowest for four of them; Ireland has four of the highest prices, but none of the lowest and vice versa for Portugal. In some analysis presented later, countries have been ranked according to their prices for the data available on up to 82 products – here we present only a sub-set of goods, and as we can see, prices are distributed with varying degrees of dispersion across the various countries.
Figure 1: Price Dispersion of Selected Non-branded Goods in Supermarket Outlets September 2002 – October 2003
SE
FR
FIIT
IE
FI
UK
FR
BE
EL
FIIE
IE
FI
IESESE
PT
SENL
ES
SEITFI
FI
ES
FIDE
BE
FI
NLPTPTPT
0
50
100
150
200
250
300
Rice Flour KitchenRolls
WashingUp
Detergents
GroundCoffee
InstantCoffee
UHT HalfFat
Butter Soups Dry FrozenFish
Ice Cream MineralWater
Sparkling
Hair Spray BabyFoods
TinnedPineapple
Honey Sugar
Product
Inde
xed
Pric
e
Source: DG MARKT based on AC Nielsen

6
3. PRICE DISTRIBUTION OF WELL KNOWN, PAN-EUROPEAN PRODUCTS
For a variety of reasons, there are some products in our data set which have almost global, not just European recognition e.g. Coca Cola. For such goods, where the brand name ensures a certain homogeneity within the product (apart possibly from the size in which it is sold) it is interesting to compare differences in the actual prices (measured in Euros before VAT) paid in each country. For a selection of such goods, Table 1 shows the price in each country as a Percentage of the EU 14 average (median) price.
As can be seen, for some of these brands prices can vary considerably between countries. For example, in Finland, the price of Evian is just over twice the EU 14 average, whilst in France it is just over 60%. Three products, Evian, Perrier, and Pampers have a range between the maximum and minimum prices of more than 100% i.e. the price in the most expensive country is at least the price in the cheapest country plus the EU 14 average price! Even for products such as Twix, Haagen Dazs and Gillette Disposable Razors, where the difference in prices across countries is relatively low, the price difference between the cheapest and the most expensive countries is still over half the EU 14 average price.
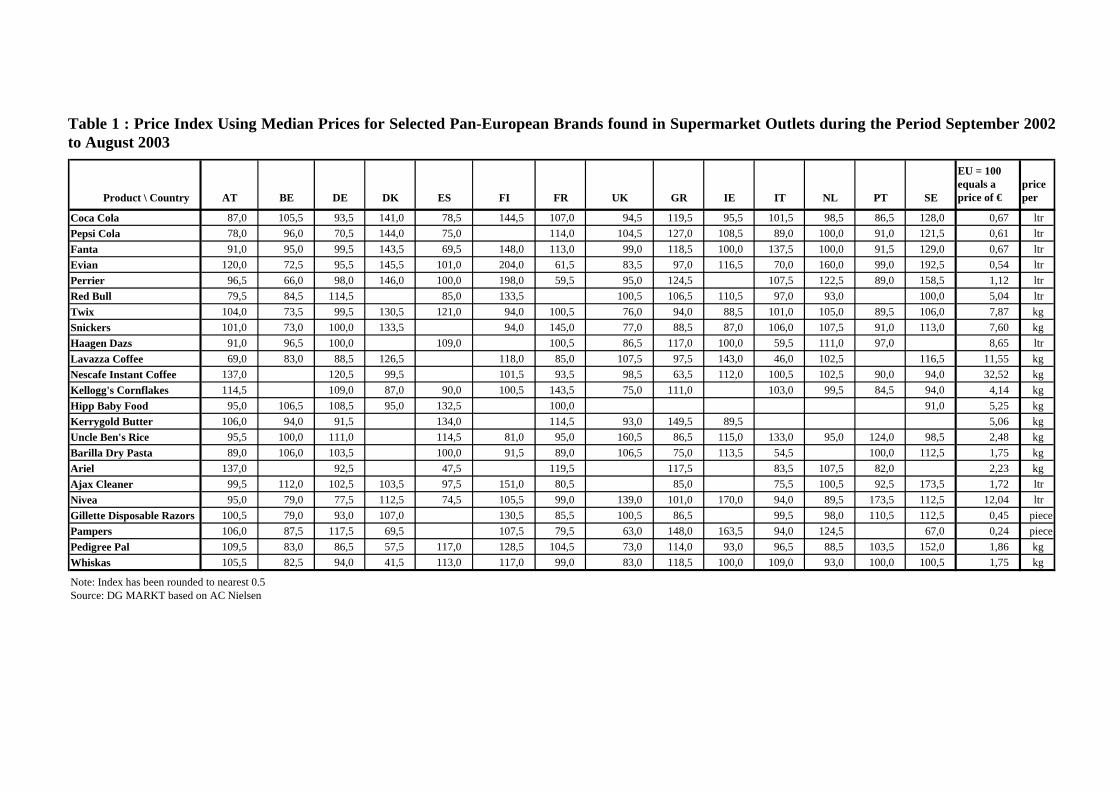
Table 1 : Price Index Using Median Prices for Selected Pan-European Brands found in Supermarket Outlets during the Period September 2002 to August 2003
Product \ Country AT BE DE DK ES FI FR UK GR IE IT NL PT SE
EU = 100 equals a price of €
price per
Coca Cola 87,0 105,5 93,5 141,0 78,5 144,5 107,0 94,5 119,5 95,5 101,5 98,5 86,5 128,0 0,67 ltrPepsi Cola 78,0 96,0 70,5 144,0 75,0 114,0 104,5 127,0 108,5 89,0 100,0 91,0 121,5 0,61 ltrFanta 91,0 95,0 99,5 143,5 69,5 148,0 113,0 99,0 118,5 100,0 137,5 100,0 91,5 129,0 0,67 ltrEvian 120,0 72,5 95,5 145,5 101,0 204,0 61,5 83,5 97,0 116,5 70,0 160,0 99,0 192,5 0,54 ltrPerrier 96,5 66,0 98,0 146,0 100,0 198,0 59,5 95,0 124,5 107,5 122,5 89,0 158,5 1,12 ltrRed Bull 79,5 84,5 114,5 85,0 133,5 100,5 106,5 110,5 97,0 93,0 100,0 5,04 ltrTwix 104,0 73,5 99,5 130,5 121,0 94,0 100,5 76,0 94,0 88,5 101,0 105,0 89,5 106,0 7,87 kgSnickers 101,0 73,0 100,0 133,5 94,0 145,0 77,0 88,5 87,0 106,0 107,5 91,0 113,0 7,60 kgHaagen Dazs 91,0 96,5 100,0 109,0 100,5 86,5 117,0 100,0 59,5 111,0 97,0 8,65 ltrLavazza Coffee 69,0 83,0 88,5 126,5 118,0 85,0 107,5 97,5 143,0 46,0 102,5 116,5 11,55 kgNescafe Instant Coffee 137,0 120,5 99,5 101,5 93,5 98,5 63,5 112,0 100,5 102,5 90,0 94,0 32,52 kgKellogg's Cornflakes 114,5 109,0 87,0 90,0 100,5 143,5 75,0 111,0 103,0 99,5 84,5 94,0 4,14 kgHipp Baby Food 95,0 106,5 108,5 95,0 132,5 100,0 91,0 5,25 kgKerrygold Butter 106,0 94,0 91,5 134,0 114,5 93,0 149,5 89,5 5,06 kgUncle Ben's Rice 95,5 100,0 111,0 114,5 81,0 95,0 160,5 86,5 115,0 133,0 95,0 124,0 98,5 2,48 kgBarilla Dry Pasta 89,0 106,0 103,5 100,0 91,5 89,0 106,5 75,0 113,5 54,5 100,0 112,5 1,75 kgAriel 137,0 92,5 47,5 119,5 117,5 83,5 107,5 82,0 2,23 kgAjax Cleaner 99,5 112,0 102,5 103,5 97,5 151,0 80,5 85,0 75,5 100,5 92,5 173,5 1,72 ltrNivea 95,0 79,0 77,5 112,5 74,5 105,5 99,0 139,0 101,0 170,0 94,0 89,5 173,5 112,5 12,04 ltrGillette Disposable Razors 100,5 79,0 93,0 107,0 130,5 85,5 100,5 86,5 99,5 98,0 110,5 112,5 0,45 piecePampers 106,0 87,5 117,5 69,5 107,5 79,5 63,0 148,0 163,5 94,0 124,5 67,0 0,24 piecePedigree Pal 109,5 83,0 86,5 57,5 117,0 128,5 104,5 73,0 114,0 93,0 96,5 88,5 103,5 152,0 1,86 kgWhiskas 105,5 82,5 94,0 41,5 113,0 117,0 99,0 83,0 118,5 100,0 109,0 93,0 100,0 100,5 1,75 kg
Note: Index has been rounded to nearest 0.5Source: DG MARKT based on AC Nielsen

Figure 2 displays the same information in a different way. For a selection of the branded products presented in Table 1, the graph shows the dispersion of prices across Europe. As with the non-branded products the middle price, the EU median, has been set equal to 100 and the grey shaded area shows the distribution of 75% of the countries. The maximum and minimum prices are indicated, as are the countries where they occur.
For this selection of 15 branded products only Germany and Holland are not present in the countries with prices at the extreme ends of the range. The maximum prices are shared between nine countries, as are the minimum, with six countries appearing in both lists. Finland is the most expensive country for a number of branded beverages; prices for the selected brands are often the lowest in Spain and Italy. But, countries are not consistently at the upper or the lower end of the scale. In the UK, for example, Kellogg’s Cornflakes are somewhat cheap compared to the EU median, whereas Uncle Ben’s rice is relatively expensive.
The graph also shows that the dispersion of prices varies considerably between products, even though the brands selected are homogenous products, sold in comparable sizes. As can be seen, it is not enough to focus only on the minimum and maximum prices. For Ajax Cleaner and Nivea Body Care, the total range is about the same. But actually, the price dispersion is less for Ajax, where three quarters of the prices are much closer to the EU median, as can be seen by the grey shaded area.
Figure 2: Price Dispersion of Selected Branded Goods in Supermarket Outlets September 2002 – October 2003
DKUK
BEESITFI
IT
UKELIT
BEAT
FRES
ES
SEIE
FI
PTSEUK
IE
FRAT
ELDKFI
FI
FI FI
0
50
100
150
200
250
Coca Cola Fanta Evian Red Bull Twix HaagenDazs
NescafeInstantCoffee
Kellogg'sCornflakes
Barilla DryPasta
UncleBen's Rice
AjaxCleaner
Nivea GilletteDisposable
Razors
Pampers PedigreePal
Product
Inde
xed
Pric
e
Source: DG MARKT based on AC Nielsen
4. PRICE DISPERSION
As well as the absolute difference in prices across countries, the data set allows us to display developments over time. Apart from any general increase in the price

9
level, it is of special interest to look at how the dispersion of prices across the EU 14 has changed over time. As expected, the change in the coefficient of variation, a measure for the dispersion of prices around the mean, gives no uniform picture across products. For the selection of well known brands, we find products whose prices in 2003 vary more than they did in 2000, like Coca Cola or Snickers (see Figure 3). For another group of brands, like Twix, Uncle Ben’s rice or Gillette disposable razors, we observe that prices moved closer together over time.
Figure 3: Changes in Coefficient of Variation over Time (Pan-European Brands)
Coefficient of Variation Increases over Time
0
10
20
30
40
50
01/2001-04/2001
09/2001-12/2001
05/2002-08/2002
01/2003-04/2003
Time
Coe
ffici
ent o
f Var
iatio
n
Pampers
Pedigree
Snickers
Coca Cola
Pepsi Cola
Kellogg's
Haagen Dazs
Coefficient of Variation Decreases over Time
0
10
20
30
40
50
01/2001-04/2001
09/2001-12/2001
05/2002-08/2002
01/2003-04/2003
Time
Coe
ffic
ient
of V
aria
tion
Marlboro
Uncle Ben's
Nescafe Instant
Twix
GilletteDisposables
Source: DG MARKT based on AC Nielsen
Among others, competitive conditions are one reason for prices to differ between countries. If differences between prices are large, this can be an indication of rather separated markets where prices are not very related. It can be argued that in separated markets it might be easier to push through price increases. Thus, high price dispersion might be observed in combination with price increases.
If we look at our selection of well known brands, this can not be confirmed (cf. Figure 4). Quite to the contrary, we see a negative correlation of these two variables. Brands with the lowest dispersion like Barilla Dry Pasta, Pepsi or Snickers show the highest average price increase of around 4 to 6% per year. The high price dispersion of Evian and Perrier at the other end of the scale is not surprising. These mineral waters have to be produced at source, and transport costs for these brands are therefore significant. Accordingly, they are least expensive in France, their country of origin, and more expensive in the countries furthest from their source (e.g. Denmark, Finland and Sweden).
Price convergence is unattractive to the consumer if it goes hand in hand with significant price increases. Figure 5 shows that this is not necessarily the case. For the brands with quite high price dispersion in 2000 and convergence over time (Nivea, Ajax, Evian and Uncle Ben’s), we observe rather moderate price increases or even reduced prices over time. A lower average price in combination with reduced dispersion implies that downward pressure on prices has been bigger in high price countries.

10

11
Figure 4: Dispersion and Change in Prices – Pan-European Brands
Source: DG MARKT based on AC Nielsen
Figure 5: Change in Dispersion vs. Change in Prices – Pan-European Brands
Source: DG MARKT based on AC Nielsen
It is those brands with initially low price dispersion for which we observe an increase in the average price over time. For most of those products we also detect a divergence of prices.
CokePepsi
Fanta
Evian
Perrier
Twix Snickers
Haagen Dazs
Lavazza
Nescafe
Kellogg's
Uncle Ben's
Barilla Dry Pasta
Ajax Cleaner Nivea
Gillette
Pampers
Pedigree Whiskas
0
20
40
60
80
Coefficient of Variation 2000-2001
-4 -2 0 2 4 6 Average Change in Prices 2000-2003
Evian
Perrier
Uncle Ben's
Ajax Cleaner
Nivea
Pampers
Coke
Pepsi
FantaTwix
Snickers
Haagen Dazs
Lavazza
Nescafe
Kellogg's
Barilla Dry Pasta
Gillette
Pedigree
Whiskas
-4
-2
0
2
4 Average Change in Coefficient of Variation 2000-2003
-4 -2 0 2 4 6 Average Change in Prices 2000-2003
High Dispersion in 2000 Low Dispersion in 2000 Fitted values Fitted values

12
Similar analysis for the selection of non-branded goods is shown in Figure 6. Here the price dispersion in 2000 has been separated into four categories – high, medium high, medium low and low. For the products where price dispersion was initially high or medium high we see that prices have tended to reduce over time. Products which started out with medium low dispersion also have a slightly downward sloping price trend over time. However the goods which had a low price dispersion in 2000 have tended to show price increases over the period observed.
Figure 6: Change in Dispersion vs. Change in Prices – Non Branded Products
-10
-50
5A
vera
ge C
hang
e in
Coe
ff. o
f Var
. 200
0-20
03
-5 0 5 10 15 20Average Price Change 2000-2003
High Dispersion in 2000 Medium High Dispersion in 2000 Medium Low Dispersion in 2000 Low Dispersion in 2000
Fitted values Fitted values Fitted values Fitted values
Source: DG MARKT based on AC Nielsen
5. COUNTRY ORDER BASED ON NATIONAL PRICES
For a lot of people the most important question is still “Where do I go to pay less?” Using this data set it has been possible to rank the 14 EU countries according to the prices paid for a common set of up to 82 goods3. Here the prices considered are the
3 It should be noted that the number of products for which prices are available differs between countries and over time. Products, brands or size representations are continually being launched and withdrawn from markets, so information on prices for the complete period of three years is not always available. To take these differences in the number of products into account, the ranking has been conducted using an index which looks at the difference between the number of times the prices of products in Country i are higher or lower compared to the prices are available for that product in other countries, divided by the total number of prices that are higher or lower. The country ranking 1 has the lowest price observed, the one with 11 (maximum number of countries in year 1) or 14 (maximum number of countries in years 2 and 3) has the highest.

13
national annual average prices4 in Euros before the addition of VAT, and as such they take into account the prices paid in the range of outlet types available in each country. It should be noted that as there are few product prices available for Italy in Year 1 and there is no data for Spain or the United Kingdom, the number of countries being ranked in that year is just 11. In Years 2 and 3 all 14 countries are ranked.
As can be seen from Figure 7, overall national prices appear to be lowest in Germany and Spain, followed by Belgium and Denmark. Ireland is consistently the most expensive country, followed by Finland and Greece. Most countries do not dramatically change their position in the table over time, only moving up or down one slot over time. However in some countries, this movement is more marked – for example Portugal, starts off as one of the three cheapest countries in Year 1, but moves to a more mid-table position; France moves from average (sixth out of eleven) in Year 1 to relatively expensive by Year 3.
The low position of countries such as Denmark and Sweden in this ranking is perhaps surprising. The above analysis uses national average product prices (excl. VAT), which are influenced by the mix of all branded and non-branded variants on sale within a given country. In both Denmark and Sweden there appear to be many non-branded cheaper goods with relatively high market share, which are reducing the average national product price. If we focused simply on branded goods, these two countries would be in the more expensive ranks.
4 For each product in each country, the time series of price observations start at slightly different points of time. In this section on country order, time periods are referred to as Year 1 to Year 3. Here, for each product and each country e.g. Year 3 refers to the most recent year for which price data is available. Hence, in this section Year 3 contains prices over the period July 2002 to November 2003.

14
Figure 7 : Ranking of EU 14 over Time
Ranking of EU 14 Based on Prices Paid for up to 82 Products
0 1 2 3 4 5 6 7 8 9 10 11 12 13 14
DEESBEDKPTNLATSEIT
FRUKELFIIE
Cou
ntry
Rank
Year 3Year 2Year 1
Source: DG MARKT based on AC Nielsen
It has also been possible to compare the price paid for a “basket”5 of goods available in all 14 EU countries and in the US. Again the national annual average prices for each product were used, meaning that the price in a country is influenced by various factors, including the mixture of distribution outlets available. Each country’s rank has been calculated by comparing its total price for the basket to the average price of the basket across the 15 countries under consideration. Looking at the results for the most recent period, Germany and Spain are again the cheapest countries, costing around 80% of the average price and Ireland is the most expensive, costing nearly 1.4 times the average. Only five countries, Greece, Great Britain, France, Italy and Ireland cost more than the average. However there has been some marked movement in the order of the EU countries for this subset of goods compared to their positions for the larger product set. Belgium ranks five places higher (excluding the position of the US) for this basket of goods than for the full data set where it has prices available for 77 out of a possible 82 products. Similarly Italy has moved four places higher in the order and is now the second most expensive country rather than being in the middle order. Finland and Greece have both dropped several places, moving from the top three most expensive countries into the middle order. On this occasion the US is ranked third cheapest, with a total price very similar to that of the Netherlands.
Figure 8: Total Price of Basket of 24 Goods Available in EU 14 and US for Year 3
5 The goods were selected simply by checking for which products prices were available in all 15 countries.

15
Source: DG MARKT based on AC Nielsen
It is also interesting to consider the price dispersion of these goods within the EU and the US. Data is available for 12 regions in the US, making it possible to calculate the cost of this basket of goods in each region. As we have seen, for the 14 EU countries, prices range between 0.8 and 1.4 times the average price of the basket in the 15 countries. In the US, this range is much narrower, between 0.8 and 1.10. As a result, the coefficient of variation in the EU 14 is about double that of the US. This seems to imply that there is still room for convergence in the prices of these goods within Europe.
0,0
0,2
0,4
0,6
0,8
1,0
1,2
1,4
DE ES USA NL PT DK AT SE BE FI EL UK FR IT IE
Country
Pric
e In
dex
(Cou
ntry
Pri
ce /
Ave
rage
Pr
ice
for
all C
ount
ries
)
Below Average Price

16
Figure 9: Comparison of Coefficients of Variation Across EU 14 and Within US for “Basket” of Goods
0,00 0,10 0,20 0,30 0,40 0,50 0,60
Soups (Wet)Ketchup
ButterMargarine
MayonnaiseDog Food (Wet)Ground Cof feeInstant Cof fee
Carbonated Drinks (Cola)Carbonated Drinks (Non-Cola)
BeerHair Conditioners
Nappies (Baby Diapers)Body Care
ToothpastePantyliners
Toilet TissueKitchen Rolls
Auto Dishw ashWashing-Up Detergent
Laundry DetergentToilet Cleaners
Multi-Purpose Cleaners
Coe
ffici
ent o
f Var
iatio
n
Product
USRegionalCoefficientof Variation
EUCoefficientof Variation
Source: DG MARKT based on AC Nielsen
6. PRICES IN DIFFERENT OUTLET TYPES
Within a country, prices can vary according to the different outlet types where goods are sold. For example, each outlet type has different purchasing strategies, can expect different economies of scale, is open different hours, resulting in a wide range of factors which affect the prices at which goods are sold. As each country has a different mixture of outlet types, these factors can significantly affect the national price calculated for an individual country. Within the current data set, prices are available for each product according to where it has been bought, with shop types ranging from hypermarkets and supermarkets to more traditional local stores and discounters.
For the Pan-European goods discussed above, the prices found in supermarket and traditional outlet types have been compared (see Figure 10). In general, the EU median price in the traditional outlet is higher than that found in supermarkets – which is to be expected given the different economies of scale that supermarkets can obtain. However, it is interesting to look at the dispersion of prices for the same products between different outlet types. As the graphs show, the dispersion of prices in traditional stores is often smaller than that seen in supermarkets. But this is all at a European level – it is more informative to consider the price changes within a country, where the true impact of the different distribution channels is felt.

17
Figure 10 : Comparison of Price Dispersion for a Set of Pan-European Brands
Source: DG MARKT based on AC Nielsen
Looking at the price dispersion within individual countries, it is clear that in the majority of Member States, supermarket prices for these goods are lower than those found in traditional stores (81% of prices for this sub-set of brands are cheaper in supermarkets). However, for all these products there is at least one country where the price in a traditional store is lower than the one reported in its supermarkets. In Belgium and Greece all these goods are cheaper in the supermarkets; in Austria, Italy, Portugal and Sweden just one good out of those selected is cheaper in the traditional store. Only in Denmark are the prices cheaper in traditional stores more often than not (of the 11 goods with prices in Denmark, 7 are cheaper in the traditional outlets). In Spain, for the 12 goods with prices, the differences are evenly split – 6 goods are cheaper in supermarkets, 6 in traditionals.
In general the price differences within a country are small – the majority (83%) are less than ±50 Eurocents, although for a small proportion (4%) the differences are more than ±€2. The maximum price difference is found in Portugal, where instant coffee is nearly €6.5 more expensive on average in traditional outlets compared to supermarkets. Spain shows the smallest range of price differences between the two outlets, at less than 1€, followed by Austria. Interestingly, of the 15 goods presented here, the maximum changes within a country, or the changes greater than €1 all occur in just five goods – Twix, Haagen Dazs, Nescafe Instant Coffee, Kellogg’s Cornflakes and Nivea.
7. THE EFFECT OF SHOP TYPE ON COUNTRY ORDER
Above we discussed the ranking of the EU 14 countries based on the national annual average prices, which takes into account the individual break down of the various distribution outlets available within each country. Since the composition of the market differs in each country, it is also worth looking at the ordering of
SE FI
FI
FI SE
NL
AT
AT
BE
UK
SE
IE
IE
IESE
DK
UK
UK
ESIT
FI
ITUK
GR
IE
UKAT
FRESES
0
50
100
150
200
Coca Cola Fanta Evian Red Bull Tw ix HaagenDazs
NescafeInstantCof fee
Kellogg'sCornf lakes
UncleBen's Rice
Barilla DryPasta
AjaxCleaner
Nivea GilletteDisposable
Razors
Pampers PedigreePal
Product
Inde
xed
Pric
eTraditionals
SE
IE
FI
PTSE
UK
IE
FR
AT
UK
GRDK
FI
FIFI
ESES
FR
ATBE
IT GR
UKIT
FI
IT ES BE
UKDK
Supermarkets

18
countries when prices are considered for comparable outlet types. In the following section, we present results based on the average annual prices found in supermarkets and hypermarkets6. Figure 11 illustrates the changes in position of countries when the Year 3 prices for national, hypermarket and supermarket data are ranked.
Looking first at the ranking of countries based on the average annual prices observed in Hypermarkets, and comparing this with the order obtained using national data, it appears that there are quite significant differences in the positions of some of the countries. For example, Sweden is one of the lowest price countries based on hypermarket prices (ranked three in Years 2 and 3), but is towards the more expensive end of the table when national prices are used (ranked ninth and eighth in Years 2 and 3). The United Kingdom and Italy also seem to have lower prices in hypermarkets relative to the other countries, and in comparison to their positions in the ranking using national averages. The greatest change is for Belgium which is in amongst the three cheapest countries in all years for the national price ranking, but is considerably higher in the hypermarket ordering. The Netherlands and Austria also rank in the more expensive countries for hypermarkets, relative to their positions in the national order. Again, there is little change in the position of the countries at the extremes of the scales – Spain and Germany occupy the top (cheaper) positions in both the national and hypermarket orders; Ireland is consistently the most expensive, followed by Finland and Greece.
The movements are less marked when we compare a country’s position in the rankings using national prices to their position when supermarket prices are used. This implies that in most countries supermarket outlets are the most common, or contribute the greatest volume of sales. Most countries positions do not change, or only move up or down one place – only in Denmark in Year 3 do we see an increase of two places (in this year, Denmark is 6th in the supermarket table, compared to 4th in the national).
6 As there are no hypermarkets in Ireland, the figures for Multiples have been substituted.

19
Figure 11 : Comparison of Country Ranks in Year 3 by Outlet Type
Year 3
0
2
4
6
8
10
12
14
DE ES DK BE NL PT SE AT UK IT FR FI EL IECountry
Ran
k
National
Hypermarket
Supermarket
Source: DG MARKT based on AC Nielsen
8. THE INTRODUCTION OF THE EURO
Whilst the data available here covers the period both before and after the introduction of the Euro, the time series available is too short to draw any concrete conclusions about the overall effect of the introduction of a single currency. However the data set does not appear to show any significant short term changes in prices due to the switch to a single currency. Monthly prices for most goods show no apparent disturbance around the date of introduction for the Euro; rather they appear to continue follow their trend. As yet we have not been able to discern any erratic price behaviour over this period. This remains an area where more analysis will be carried out at a later point and the real long term impact of the Euro on prices and price dispersion will only be assessed over a longer period.
Figure 12 illustrates this price behaviour for a sample of branded goods in a variety of different Euro-zone countries.

20
Figure 12: Product Prices over Time (Covering the Introduction of the Euro)
70
80
90
100
110
120
130
24/09/2000 26/02/2001 31/07/2001 2/01/2002 6/06/2002 8/11/2002 12/04/2003 14/09/2003
Date
Pric
e In
dex
09/2
000
= 10
0
Baygon Insecticide - FRVittel - FRApollinaris - ESSprite - DENestle Nesquik - BECalgonit Tablets - DEPepsi - FI
€ - Introduction 1 January 2002
Source: DG MARKT based on AC Nielsen
9. CONCLUSIONS
At present the conclusions coming out of this paper are mixed, showing that prices still vary considerably within the EU 14 for certain products, but appearing more homogeneous for others. Changes in price dispersion over time are also variable. Different competitive practises in countries may partially explain the price differences, but other factors are also contributing – including the mixture of retail outlets; issues relating to the distribution and delivery of products; market separation and consumer preferences.
The initial country rankings show some interesting results; comparison with the US indicates that markets are not performing as well as they could in the EU because price divergence is much wider in Europe. It will be interesting to compare these findings to the results from analysing price dispersion across the different regions of the EU 14 countries.
As expected, outlet type influences the prices paid, with the lower prices generally being found in the larger shop types, which can command greater economies of scale and reduced overhead costs. Again further analysis by retail outlet is planned, as data have been collected for many different types of outlet, some of which are particular to given countries.
Whilst no overall concrete conclusions about the introduction of the Euro can be drawn from this data set, it would appear that in the short term, the introduction of a single currency has not caused any significant changes in the prices of the goods studied here.

21
As was mentioned at the start of this paper, this analysis remains very much a work in progress. The data set provides us with a significant amount of potential information on the functioning of markets in the EU 14, and DG Markt will be working further over the coming months to examine the impact of the internal market in key areas such as price convergence.