Prefeasibility Study Of The Missing Links Of Dakar - Ndjamena And ...
239
AFRICAN UNION PREFEASIBILITY ST DAKAR - NDJAME SERVICES FINAL REPORT FUNDING: NEPAD - IPPF 2, Ru Tuni Tél. E-ma Site UNION AFRICAINE UNIÃO AFRICANA UDY OF THE MISSING LINKS OF NA AND NDJAMENA - DJIBOUTI NOVEMBER 2011 ue des Métiers – Z.I. 1080 s Carthage Cedex / TUNISIE : + 216 70 839 100 – Fax : + 216 70 837 112 ail : [email protected] web : www.studi.com.tn
Transcript of Prefeasibility Study Of The Missing Links Of Dakar - Ndjamena And ...
AFRICAN UNION
PREFEASIBILITY STDAKAR - NDJAMESERVICES
FINAL REPORT
FUNDING: NEPAD - IPPF
2, RuTuniTél. E-maSite
UNION AFRICAINE
UNIÃO AFRICANA
UDY OF THE MISSING LINKS OFNA AND NDJAMENA - DJIBOUTI
NOVEMBER 2011
ue des Métiers – Z.I. 1080s Carthage Cedex / TUNISIE: + 216 70 839 100 – Fax : + 216 70 837 112ail : [email protected] : www.studi.com.tn
Prefeasibility study of the missing links of Final report Dakar – N’djamena and N’djamena ‐ Djibouti links November 2011
STUDI INTERNATIONAL page 1
Table of contents 1 Reminder of the study objectives .................................................................................................................................... 10 2 Summary of the terms of reference ................................................................................................................................ 14 3 Objectives and content of the report .............................................................................................................................. 15 4 Reminder of road and rail missing links, performance of existing railway lines and seaports served by the corridor ....... 16
4.1 Road component .............................................................................................................................. 16 4.2 Railway component .......................................................................................................................... 19 4.3 The issue of overload, non‐physical barriers and transport facilitation ................................................. 20
4.3.1 Overload issue ............................................................................................................................................................ 20 4.3.2 Non‐physical barriers ................................................................................................................................................. 21 4.3.3 Transport facilitation .................................................................................................................................................. 23
4.4 Performance of the existing railway lines ........................................................................................... 26 4.4.1 Dakar Bamako railway ................................................................................................................................................ 26 4.4.2 Burkina Faso – Ivory Coast railway ............................................................................................................................. 27 4.4.3 The Djibouti‐Ethiopian railway ................................................................................................................................... 27
4.5 Performances of seaports served by the corridor ................................................................................ 28 4.5.1 Dakar Autonomous Port ............................................................................................................................................. 28 4.5.2 Port of Djibouti ........................................................................................................................................................... 32
5 Summary of the main socioeconomic indicators of the ten countries crossed by the corridor ......................................... 35 5.1 Senegal ........................................................................................................................................... 35
5.1.1 Socio‐demographic indicators .................................................................................................................................... 35 5.1.2 Macro‐economic aggregates ...................................................................................................................................... 36 5.1.3 Sectoral performances ............................................................................................................................................... 36 5.1.4 Foreign trade .............................................................................................................................................................. 37 5.1.5 Development prospects ............................................................................................................................................ 39
5.2 Mali ................................................................................................................................................ 39 5.2.1 Socio‐demographic Indicators .................................................................................................................................... 39 5.2.2 Macro‐economic aggregates ...................................................................................................................................... 39 5.2.3 Sectoral performances ............................................................................................................................................... 40 5.2.4 Foreign trade .............................................................................................................................................................. 41 5.2.5 Development prospectsDevelopment prospects ....................................................................................................... 41
5.3 Burkina Faso .................................................................................................................................... 41 5.3.1 Socio‐demographic indicators .................................................................................................................................... 41 5.3.2 Macro‐economic aggregates ...................................................................................................................................... 42 5.3.3 Sectoral performances ............................................................................................................................................... 43 5.3.4 Foreign trade .............................................................................................................................................................. 43 5.3.5 Development prospects ............................................................................................................................................. 44
5.4 Niger ............................................................................................................................................... 45 5.4.1 Socio‐demographic indicators .................................................................................................................................... 45 5.4.2 Macro‐economic aggregates ...................................................................................................................................... 45 5.4.3 Sectoral performances ............................................................................................................................................... 46 5.4.4 Foreign trade .............................................................................................................................................................. 46 5.4.5 Development prospects ............................................................................................................................................. 46
5.5 Nigeria ............................................................................................................................................ 46 5.5.1 Socio‐demographic indicators .................................................................................................................................... 46 5.5.2 Macro‐economic aggregates ...................................................................................................................................... 47 5.5.3 Sectoral performances ............................................................................................................................................... 48 5.5.4 Foreign trade .............................................................................................................................................................. 48 5.5.5 Development prospects ............................................................................................................................................. 48
5.6 Cameroon ........................................................................................................................................ 49 5.6.1 Socio‐demographic indicators .................................................................................................................................... 49 5.6.2 Macro‐economic aggregates ...................................................................................................................................... 49 5.6.3 Sectoral performances ............................................................................................................................................... 50 5.6.4 Foreign trade .............................................................................................................................................................. 51 5.6.5 Development prospects ............................................................................................................................................. 51
5.7 Chad ............................................................................................................................................... 51 5.7.1 Socio‐demographic indicators .................................................................................................................................... 51
Prefeasibility study of the missing links of Final report Dakar – N’djamena and N’djamena ‐ Djibouti links November 2011
STUDI INTERNATIONAL page 2
5.7.2 Macro‐economic aggregates ...................................................................................................................................... 52 5.7.3 Sectoral performances ............................................................................................................................................... 53 5.7.4 Foreign trade .............................................................................................................................................................. 54 5.7.5 Development prospects ............................................................................................................................................. 54
5.8 Sudan .............................................................................................................................................. 54 5.8.1 Socio‐demographic indicators .................................................................................................................................... 54 5.8.2 Macro‐economic aggregates ...................................................................................................................................... 55 5.8.3 Sectoral performances ............................................................................................................................................... 56 5.8.4 Foreign trade .............................................................................................................................................................. 56
5.9 Ethiopia ........................................................................................................................................... 56 5.9.1 Socio‐demographic indicators .................................................................................................................................... 56 5.9.2 Macro‐economic aggregates ...................................................................................................................................... 57 5.9.3 Sectoral performances ............................................................................................................................................... 57 5.9.4 Foreign trade .............................................................................................................................................................. 58 5.9.5 Development programs ............................................................................................................................................. 58
5.10 Djibouti ........................................................................................................................................... 58 5.10.1 demographic indicators ......................................................................................................................................... 58 5.10.2 Macro‐economic aggregates ................................................................................................................................. 59 5.10.3 Sectoral performances .......................................................................................................................................... 60 5.10.4 Foreign trade ......................................................................................................................................................... 60 5.10.5 Development prospects ........................................................................................................................................ 61
6 Summary of the transport demand on the corridor in the very long term ....................................................................... 62 6.1 Methodology ................................................................................................................................... 62 6.2 Trade in 2008 ................................................................................................................................... 63 6.3 GDP Projection in the very long term ................................................................................................. 64 6.4 Evaluation of trade in the very long term ........................................................................................... 65
6.4.1 Base situation ............................................................................................................................................................. 65 6.4.2 Project situation ......................................................................................................................................................... 65
6.5 Transport demand in the very long term ‐ The international component .............................................. 66 6.5.1 Road alternative ......................................................................................................................................................... 66 6.5.2 Railway alternative ..................................................................................................................................................... 68 6.5.3 Road and railway alternatives .................................................................................................................................... 70
6.6 Transport demand in the very long term ‐ intra‐country component .................................................... 70 6.6.1 Evaluation of the normal traffic ................................................................................................................................. 71 6.6.2 Evaluation of the generated traffic ............................................................................................................................ 73 6.6.3 Evaluation of the diverted traffic ............................................................................................................................... 74
7 Methodology of the third and fourth activities ............................................................................................................... 75 7.1 Methodology of the third activity ...................................................................................................... 75
7.1.1 Preamble .................................................................................................................................................................... 75 7.1.2 Design and development of a geographic database .................................................................................................. 76 7.1.3 Identification and prioritization of constraints .......................................................................................................... 76 7.1.4 Identification of topographic corridors ...................................................................................................................... 76 7.1.5 Determination of corridor’s layout of lesser constraints ........................................................................................... 76 7.1.6 Evaluation of the developments costs ....................................................................................................................... 76 7.1.7 Choice of the best alternative of the railway corridor’s layout .................................................................................. 76 7.1.8 Evaluation of the rolling stock cost ............................................................................................................................ 76
7.2 Methodology of the fourth activity .................................................................................................... 77 8 Critical Analysis of current road standards and tracks gauge of the ten Countries covered by the corridor ...................... 79
8.1 Road standards ................................................................................................................................ 79 8.2 Railway standards ............................................................................................................................ 79
8.2.1 Tracks gauge ............................................................................................................................................................... 80 8.2.2 Rolling stock ............................................................................................................................................................... 82 8.2.3 Compatibility of operation systems ........................................................................................................................... 82
8.3 Recommendations relating to the road component ............................................................................ 82 8.4 Recommendations relating to the railway component ........................................................................ 83
8.4.1 Gauge and permissible load ....................................................................................................................................... 83 8.4.2 Rolling stock ............................................................................................................................................................... 83 8.4.3 Transshipment centers ............................................................................................................................................... 83 8.4.4 Criteria for the equipment and standardization choice ............................................................................................. 84
9 Main geometric standards of a railway layout design ..................................................................................................... 85 9.1 Horizontal alignment ........................................................................................................................ 85
Prefeasibility study of the missing links of Final report Dakar – N’djamena and N’djamena ‐ Djibouti links November 2011
STUDI INTERNATIONAL page 3
9.1.1 Conditions of the horizontal routes layout’s establishment ...................................................................................... 85 9.1.2 Selected main characteristics ..................................................................................................................................... 85 9.1.3 Principles for setting trains speeds limit on curve ..................................................................................................... 85
9.2 Longitudinal section ......................................................................................................................... 86 9.2.1 Maximum gradient ..................................................................................................................................................... 86 9.2.2 Compatibility between longitudinal section and horizontal alignment ..................................................................... 86
9.3 Cross section .................................................................................................................................... 86 10 Identification and prioritization of constraints, identification of topographic corridors ................................................... 87
10.1 Preamble ......................................................................................................................................... 87 10.2 Design of the geographic database .................................................................................................... 87
10.2.1 Data collection ...................................................................................................................................................... 87 10.2.2 Data dictionary ...................................................................................................................................................... 89
10.3 Identification and prioritization of constraints .................................................................................... 90 10.4 Identification of topographic corridors ............................................................................................... 90
11 Analysis of the Road component of the Missing links of TAH 5 and 6 .............................................................................. 91 11.1 Missing links of TAH 5 and 6 .............................................................................................................. 91 11.2 Current development level ............................................................................................................... 92
11.2.1 Cameroonian section (85 km) ............................................................................................................................... 92 11.2.2 Chadian Section (166 km) ...................................................................................................................................... 92 11.2.3 Sudanese Section (611 km) ................................................................................................................................... 93 11.2.4 Ethiopian Section (565 km) ................................................................................................................................... 95 11.2.5 Djiboutian Section (100 km) .................................................................................................................................. 97
11.3 Compatibility of the demand compared with the current level of development and recommendations .. 99 11.3.1 General design principles ...................................................................................................................................... 99 11.3.2 Development of the Cameroonian and Sudanese section’s missing links ........................................................... 100 11.3.3 Development of the missing links of the Chadian section ................................................................................... 101 11.3.4 Development of the Ethiopian section’s missing links ........................................................................................ 103 11.3.5 Development of the Djiboutian section’s missing links ....................................................................................... 105
11.4 Developments’ cost ........................................................................................................................ 106 12 development of the layout corridors of less constraints of the Missing links related to the trans‐Sahelian railway ....... 108
12.1 Preamble ....................................................................................................................................... 108 12.2 Geometric sketches ........................................................................................................................ 108 12.3 Description of the layout corridor variants ....................................................................................... 109
12.3.1 Section 1 : Bamako – Bougouni – Sikasso – Ouangolodougou (569 km) ............................................................. 110 12.3.2 Section 2 : Kaya – Dori – Niamey (397 km) .......................................................................................................... 110 12.3.3 Section 3 : Niamey – Dosso – Sokoto – Kaura Namoda (450 km) ........................................................................ 111 12.3.4 Section 4 : Maiduguri ‐ Ndjamena (270 km) ........................................................................................................ 112 12.3.5 Section 5 : N’djaména – Nyala (1150 km according to a first alternative and 1288 km according to a second variant) 112 12.3.6 Section 6: Sennar – Addis Ababa (850 km according to a first alternative and 1050 km according to a second alternative) ............................................................................................................................................................................ 113
12.4 Development Cost of the railway missing links ................................................................................. 114 12.5 Development cost of the existing network of standard gauge corridor ............................................... 116 12.6 Transshipment centers ................................................................................................................... 116 12.7 Railway connection with Doraleh port in Djibouti ............................................................................. 116 12.8 Bridges .......................................................................................................................................... 117
12.8.1 Location ............................................................................................................................................................... 117 12.8.2 Type ..................................................................................................................................................................... 119 12.8.3 Longitudinal section ............................................................................................................................................ 119 12.8.4 Cost ..................................................................................................................................................................... 119
12.9 Choice of the alternative ................................................................................................................. 119 12.10 Investments for the construction of railways missing links (in meter or narrow gauge) and rehabilitation cost of existing railway lines ....................................................................................................................... 119 12.11 Evaluation of the rolling material cost .............................................................................................. 120
12.11.1 Railway operation ............................................................................................................................................... 120 12.11.2 Evaluation of the carriage stock and costs of the rolling stock ........................................................................... 121 12.11.3 Determination of the cost of the ton.kilometre (TK) ........................................................................................... 123
13 Economic Evaluation ..................................................................................................................................................... 125 13.1 Road alternative ............................................................................................................................. 125 13.2 Railway alternative ......................................................................................................................... 126
Prefeasibility study of the missing links of Final report Dakar – N’djamena and N’djamena ‐ Djibouti links November 2011
STUDI INTERNATIONAL page 4
13.3 Road and railway alternative ........................................................................................................... 127 13.3.1 Road component ................................................................................................................................................. 127 13.3.2 Railway component ............................................................................................................................................. 128
13.4 Recommandations ......................................................................................................................... 130 13.5 Implementation schedule ............................................................................................................... 130
14 Risks analysis ................................................................................................................................................................ 135 15 Conclusion .................................................................................................................................................................... 139 16 Terms of reference of the following stages ................................................................................................................... 146
16.1 Road component ............................................................................................................................ 146 16.2 Railway component ........................................................................................................................ 167
17 Appendices ................................................................................................................................................................... 182 17.1 Status of the Transafrican 5 in 2011 ................................................................................................. 182
17.1.1 Missing links in 2003 of the Transafrican 5 and new characteristics in 2011 ...................................................... 182 17.1.2 Situation of the rest of the Transafrican 5 road network (2011) ......................................................................... 184
17.2 State of the Transafrican 6 in 2011 .................................................................................................. 186 17.2.1 Missing links in 2003 of the Transafrican 6 and new characteristics in 2011 ...................................................... 186 17.2.2 State of the rest of the Transafrican 6 road network (2011) ............................................................................... 192
17.3 Project fact sheets road component ................................................................................................ 195 17.3.1 Technico‐ economic, detailed engineering feasibility study and preparation of bidding documents of the Transafrican 5 ‐ Cameroonian Section – Fotokol Maltam Section (85 km) ............................................................................ 195 17.3.2 Construction of the Transafrican 5 ‐ Chadian Section – Abeche Adre section Sudan Border (166 km) .............. 196 17.3.3 Technico ‐ economic, detailed engineering feasibility study and preparation of bidding document of the Transafrican 6. Sudanese Section – Chad border El Geneina Section (25 km) ....................................................................... 197 17.3.4 Technico ‐ economic, detailed engineering feasibility study and preparation of bidding document of the Transafrican 6. Sudanese Section – El Geneina – Zalingei Section (150 km) ......................................................................... 198 17.3.5 Technico ‐ economic, detailed engineering feasibility study and preparation of bidding document of the Transafrican 6. Sudanese Section – Nyala Ennouhoud Section (436 km) .............................................................................. 199 17.3.6 Technico ‐ economic, detailed engineering feasibility study and preparation of bidding documents of the Transafrican 6. Ethiopian Section – Werota Weldiya Section (300 km) ................................................................................. 200 17.3.7 Technico ‐ economic, detailed engineering feasibility study and preparation of bidding documents of the Transafrican 6. Ethiopian Section ‐ Weldiya – Dese Section (120 km) ................................................................................... 201 17.3.8 Technico ‐ economic, detailed engineering feasibility study and preparation of bidding documents of the Transafrican 6. Ethiopian Section ‐ Dese Kembolcha Section (25 km) .................................................................................. 202 17.3.9 Technico ‐ economic, detailed engineering feasibility study and preparation of bidding documents of the Transafrican 6. Ethiopian Section ‐ Kembolcha – Bati Section (42 km) ................................................................................. 203 17.3.10 Technico ‐ economic, detailed engineering feasibility study and preparation of bidding documents of the Transafrican 6. Ethiopian Section ‐ Bati Mille Section (78 km) ............................................................................................. 204 17.3.11 Technico ‐ economic, detailed engineering feasibility study and preparation of bidding documents of the Transafrican 6. Djiboutian Section ‐ Gallafi – Dikhil Section (100 km) ................................................................................... 205 17.3.12 Technico ‐ economic, detailed engineering feasibility study and preparation of bidding documents of the Transafrican 6. Djiboutian Section ‐ Section MP 71 – MP 120 ............................................................................................... 206
17.4 Projects fact sheets railway compnent ............................................................................................. 207 17.4.1 Feasibility study of Dakar Djibouti corridor – Railway component – Dosso Kaura Namoda Section (360 km) ... 207 17.4.2 Feasibility study of Dakar Djibouti corridor – Railway component – Maiduguri N’djamena Section (270 km) ... 208 17.4.3 Feasibility study of Dakar Djibouti corridor – Railway component –N’djamena ‐ Ati Section (370 km) .............. 209 17.4.4 Feasibility study of Dakar Djibouti corridor – Railway component –Ati Chad border/Sudan Section (440 km) .. 210 17.4.5 Feasibility study of Dakar Djibouti corridor – Railway component –Chad border/Sudan ‐ Nyala Section (340 km) 211 17.4.6 Feasibility study of Dakar Djibouti corridor – Railway component – Damazin – Sudan Border/Ethiopia – Mendi Section (430 km) .................................................................................................................................................................... 212 17.4.7 Feasibility study of Dakar Djibouti corridor – Railway component –Mendi – Addis Abeba Section (420 km) .... 213
17.5 Profitability indicators road component ........................................................................................... 214 17.6 Profitability indicators railway component ....................................................................................... 215 17.7 Map of constraints ......................................................................................................................... 216
Prefeasibility study of the missing links of Final report Dakar – N’djamena and N’djamena ‐ Djibouti links November 2011
STUDI INTERNATIONAL page 5
List of acronyms APFZ : Port and Free Zone Authority
ECA : United Nations’ Economic Commission for Africa
ECOWAS : Economic Community of West African States
ECCAS : Economic Community of Central African States
REC: Regional Economic Community
COMESA : Common Market for Eastern and Southern Africa
DCW : Digital Chart of the World
DPW : Dubaï Port World
FASTRAC : Transit’s Facilitation and Securing Programme in Central Africa
GGW : Great Green Wall
IGAD : InterGovernemental Authority on Development
NEPAD : New Partnership for Africa’s Development
PAD : Dakar Autonomous Port
DIAP : Djibouti International Autonomous Port
RPTTFWA : Regional Project of Transport and Transit Facilitation in West Africa
LBT : Little Blue Train
RCFM : Local Board of Malian Railway
ICR : Ivorian Company of Railways
GIS : Geographic Information System
ICATR : International Company of African Transport by Rail
PNP : Planning’s National Plan
SOPAFER‐B : Company of Railway Heritage ‘s Managment of Burkina Faso
SRTM : Shuttle Radar Topography Mission
TAH : TransAfrican Highways
TIPAC : Inter‐States Transit of the Central Africa Countries
AU: African Union
AUR : African Union of Railways
Prefeasibility study of the missing links of Final report Dakar – N’djamena and N’djamena ‐ Djibouti links November 2011
STUDI INTERNATIONAL page 6
LIST OF FIGURES Figure 1. Map of the population density of the countries crossed by the TAH 5 and 6 .............................................. 10 Figure 2. Population (2006) of the ten countries crossed by the TAH 5 and 6 and the Trans‐Sahelian railway ............ 10 Figure 3. Layout of The Great Green Wall ...................................................................................................................... 12 Figure 4. Map of land use of the countries crossed by the Transafricans Highways 5 and 6 ........................................ 13 Figure 5. Block diagram of the study .............................................................................................................................. 14 Figure 6. Road component. Missing links of Dakar Djibouti corridor (2011) ................................................................. 18 Figure 7. Linear evolution of the road missing links of Dakar – Djibouti corridor (2003 – 2011) .................................. 18 Figure 8. Linear of the Missing links of the Dakar – Djibouti corridor – Railway component ........................................ 20 Figure 9. Mapping of abnormal practices followed by the OPA in West Africa ............................................................. 22 Figure 10. Example of a station juxtaposed to Cinkassé, at the border between Burkina Faso and Togo .................... 24 Figure 11. Aerial view of Dakarautonomous port .......................................................................................................... 29 Figure 12. Site of Dakar future port ............................................................................................................................... 30 Figure 13. . Evolution of the average waiting time in the roadstead (2008 – 2009) at the Port of Dakar ..................... 30 Figure 14. Evolution of the average time of trucks service (2008‐2009) at the Port of Dakar ...................................... 30 Figure 15. Evolution of total traffic at Dakar autonomous port (2005 – 2009) ............................................................. 31 Figure 16. Share (%) of traffic segments managed by Dakar autonomous port (2005 – 2009) .................................... 31 Figure 17. Strategic position of the port of Djibouti ...................................................................................................... 32 Figure 18. General view of port facilities in Djibouti ...................................................................................................... 32 Figure 19. Overview of the new container terminal of Doraleh .................................................................................... 33 Figure 20. Evolution of total traffic in Djibouti port (2003 – 2009) ................................................................................ 33 Figure 21. Ethiopian imports volume (expressed in %) by transit Port (1992 – 2003) ................................................... 34 Figure 22. Evolution of Ethiopian transit traffic (2003 – 2009) via Djibouti port ........................................................... 34 Figure 23. Evolution of Senegalese foreign trade (in Millions FCFA) ............................................................................. 37 Figure 24. Structure (by value) of Senegalese exports by continent (2004 – 2008) ...................................................... 38 Figure 25. Structure (in value) of Senegalese imports by continent (2004 – 2008) ....................................................... 38 Figure 26. Growth rate by industry in Mali (2006 – 2009) ............................................................................................. 40 Figure 27. Evolution of Burkina Faso transit by port of the sub‐region (2001 ‐ 2010) .................................................. 44 Figure 28. Allocation of growth rates by sector in Cameroon (%) ................................................................................. 50 Figure 29. Growth rate of Chadian GDP (1999 – 2009) .................................................................................................. 52 Figure 30. Growth (%) of Djiboutian GDP (2000 – 2010) ............................................................................................... 59 Figure 31. Origin of imports of Djibouti’s ports in 2008 ................................................................................................. 60 Figure 32. Exports destination of Djibouti ports in 2008 ............................................................................................... 61 Figure 33. Direct and expanded influence areas of the corridor ................................................................................... 62 Figure 34. Projeted GDP (Millions US $) in the very long term (2040), according to two growth scenarios (in millions US$) ................................................................................................................................................................................ 64 Figure 35. General approach of research of railways’ layout corridor with fewer constraints ..................................... 75 Figure 36. Cross section in a cutting type ...................................................................................................................... 86 Figure 37. Transafrican 5. Cameroonian Section ‐ Fotokol Maltam Section (85 km) ..................................................... 92 Figure 38. Chadian Section ‐ Abeche Adre Sudan border Section (166 km) .................................................................. 93 Figure 39. Transafrican 6. Sudanese Section – Chad border – El Geneina section (25 km) .......................................... 94 Figure 40. Transafrican 6. Sudanese Section – El Geneina – Zalingei section (150 km) ................................................ 94 Figure 41. Transafrican 6. Sudanese Section –Nyala – Ennouhoud Section (436 km) .................................................. 95 Figure 42. Transafrican 6. Ethiopian Section – Werota – Weldiya Section (436 km) ................................................... 95 Figure 43. Transafrican 6. Ethiopian Section – Weldiya – Dese Section (120 km) ........................................................ 96 Figure 44. Transafrican 6. Ethiopian Section – Dese – Kembolcha Section (25 km) ..................................................... 96 Figure 45. Transafrican 6. Ethiopian Section – Kembolcha – Bati section (42 km) ....................................................... 97 Figure 46. Transafrican 6. Ethiopian Section – Bati – Mille Section (78 km) ................................................................. 97 Figure 47. Transafrican 6. Djiboutian Section – Gallafi – Dikhil Section (100 km) ........................................................ 98 Figure 48. Transafrican 6. Djiboutian Section – General view of Gallafi – Dikhil Section .............................................. 98 Figure 49. Typical cross section of the current sections – Missing links– Cameroonian and Sudanese sections ........ 101 Figure 50. Typical cross‐section in current section ‐ Missing links – Chadian Section ................................................. 102 Figure 51. Typical cross‐section in the villages and the dense urban crossings ‐ Missing links – Chadian Section ...... 102 Figure 52. Typical cross section in difficult terrain ‐ Missing links ‐ Ethiopian Section ................................................ 104 Figure 53. Typical cross section for the valleys crossings ‐ Missing links ‐ Ethiopian Section ...................................... 104 Figure 54. Typical cross section in current section – Missing links– Djibouti ............................................................... 105 Figure 55. Variants of the Trans‐Sahelian railway layout–Chadian Section ................................................................. 109
Prefeasibility study of the missing links of Final report Dakar – N’djamena and N’djamena ‐ Djibouti links November 2011
STUDI INTERNATIONAL page 7
Figure 56. Variants of the Trans‐Sahelian railway layout –Sudano‐Ethiopian Section ................................................ 109 Figure 57. Railway layout of Bamako – Bougouni – Sikasso – Ouangolodougou section (569 km) ............................. 110 Figure 58. Railway layout of Kaya – Dori – Niamey section (397 km) .......................................................................... 110 Figure 59. Railway layout of Niamey – Dosso – sokoto – Kaura Namoda section (450 km) ........................................ 111 Figure 60. Railway layout of Maiduguri – N’djaména section (270 km) ...................................................................... 112 Figure 61. Railway layout of N’djamena – Nyala section (1150 km according to a first alternative and 1288 km according to a second alternative) ............................................................................................................................... 113 Figure 62. Railway ayout of Sennar – Addis Abeba section (850 km according to a first alternative and 1050 km according to a second variant) ..................................................................................................................................... 113 Figure 63. Map of Ethiopian railway network .............................................................................................................. 114 Figure 64. Connection of the existing railway layout to Doraleh port in Djibouti ....................................................... 117 Figure 65. Bridge on Niger river in Bamako (1500 ml) ................................................................................................. 117 Figure 66. Bridge in Niger river in Niamey (1500 ml) ................................................................................................... 118 Figure 67. Bridge on the Logone in N’djaména (500 ml) ............................................................................................. 118 Figure 68. Length of the missing links of Dakar Djibouti corridor ‐ Railway Component ............................................ 140 Figure 69. Implementation State (March 2010) of development works of Bamako ‐ Dakar Corridor by the South ... 183 Figure 70. View on the Transafrican 5 ‐ Kedougou ‐ Saraya ‐ Faleme Section (2011) ................................................. 184 Figure 71. View on the Transafrican 5 –Burkinabé Section – Portion of the RN4 – Ouagadougou – Fada N’gourma (2011) ........................................................................................................................................................................... 185 Figure 72. View of the structure on the Nakambé – Deteriorated and narrow structure ........................................... 185 Figure 73. View on the Transafrican 6 – Chadian section (Massaguet – Ngoura – Bokoro) ........................................ 187 Figure 74. View on the Transafrican 6 –Chadian Section (Bokoro – Arboutchatak) .................................................... 187 Figure 75. View on the Transafrican 6. Chadian Section (Arboutchatak – Mongo) ..................................................... 188 Figure 76. View on the Transafrican 6. Chadian Section (Mongo – Mangalmé) .......................................................... 188 Figure 77. View on the Transafrican 6. Chadian Section (Mangalmé – Oum Hajer) .................................................... 189 Figure 78. View on the Transafrican 6. Chadian Section (Oum Hajer – Am himédé) ................................................... 189 Figure 79. View on the Transafrican 6. Chadian Section (Am Himédé ‐ Abéché) ........................................................ 190 Figure 80. View on the Transafrican 6. Chadian Section (Abéché – Adré – Frontière Sudan) ..................................... 190 Figure 81. View on the Transafrican 6. Djiboutian Section (Dikhil – MILEAGE POINT 157) ......................................... 191 Figure 82. View on the Transafrican 6. Djiboutian Section (MP 157 – MP 220) .......................................................... 191 Figure 83. View on the Transafrican 6. Djiboutian Section (MP 200 – Dikhil) ............................................................. 192 Figure 84. View on the Transafrican 6. Djiboutian Section (Djibouti – MP 71) ............................................................ 193 Figure 85. View on the Transafrican 6. Djiboutian Section (MP 71 – MP 81) .............................................................. 193 Figure 86. View on the Transafrican 6. Djiboutian Section (MP 81 – Dikhil) ............................................................... 194
Prefeasibility study of the missing links of Final report Dakar – N’djamena and N’djamena ‐ Djibouti links November 2011
STUDI INTERNATIONAL page 8
LIST OF TABLES Table 1. Missing links (2003) of the Transafrican 5 ........................................................................................................ 16 Table 2. Missing links (2003) of the Transafrican 6 ........................................................................................................ 17 Table 3. Linear of the Missing links of the railway component of Dakar Djibouti corridor (2011) ................................ 19 Table 4. Evolution of Malian transit traffic (2005‐2009) at Dakar port .......................................................................... 31 Table 5. Evolution of the Senegalese population over the last twenty years ................................................................ 35 Table 6. The development of GDP structure in Senegal (2005 ‐ 2008) .......................................................................... 36 Table 7. Growth rate of Senegal GDP by sector (2006 ‐ 2008) ...................................................................................... 36 Table 8. Major African countries suppliers of Senegal ................................................................................................... 38 Table 9. Evolution of Malian GDP structure ................................................................................................................... 41 Table 10. Evolution of Niger population of (1990‐2010) ............................................................................................... 45 Table 11. Niger Macro‐economic indicators (2008 – 2011) ........................................................................................... 45 Table 12. Evolution of Nigerian population (1990‐2010) ............................................................................................... 47 Table 13. Nigeria macro‐economic indicators (2008 – 2011) ........................................................................................ 48 Table 14. Budget balance of Cameroon (in % of GDP) ................................................................................................... 50 Table 15. Structure of Chadian GDP excluding oil (2007 – 2009) .................................................................................. 53 Table 16. Evolution of average annual growth rate of Sudanese population (1973 – 2018) ......................................... 55 Table 17. Indicators of economic growth of Sudan (2008 – 2012) ................................................................................ 55 Table 18. Evolution of Ethiopian population (1990 – 2010) .......................................................................................... 56 Table 19. Ethiopia ‐ Macro‐economic indicators (2008 – 2011) .................................................................................... 57 Table 20. Distribution of resident population in Djibouti by region and environment (2009) ...................................... 59 Table 21. Inward cargo at Djiboutian ports (2006 – 2009) ............................................................................................ 60 Table 22. Outward cargo at Djiboutian ports (2006 – 2009) ......................................................................................... 61 Table 23. 2008 Trading (in billion US$) between countries crossed by the corridor and with neighboring Countries and projections in 2040 for the situation without projet .............................................................................................. 65 Table 24. 2008 Trading in (in billion US$) between countries crossed by the corridor and with the neighboring countries and projections in 2040 for the situation with project ‐Road component .................................................... 66 Table 25. 2008 Trading (in billion US$) between countries crossed by the corridor and with neighboring countries and projections in 2040 for the situation with projet ‐ Railway component ................................................................. 66 Table 26. Road traffic (in 2030 and 2040) on the Dakar Djibouti corridor (2 traffic directions included) – Road alternative ‐ International component .......................................................................................................................... 67 Table 27. Railway traffic (2030 and 2040) on the Dakar Djibouti corridor –International Component – Railway alternative ‐ Direction Dakar ‐ Djibouti .......................................................................................................................... 69 Table 28. . Railway traffic ( 2030 and 2040) on the Dakar Djibouti corridor –International Component – Railway alternative – Direction Djibouti ‐ Dakar ......................................................................................................................... 69 Table 29. Railway traffic (2030 and 2040) on the Dakar Djibouti corridor (2 directions) – Railway alternative‐ International Component .............................................................................................................................................. 69 Table 30. Road traffic (in 2030 and 2040) on the Dakar Djibouti corridor (2 traffic directions) – Road and railway alternative ‐ International component .......................................................................................................................... 70 Table 31. Railway traffic (in 2030 and 2040) on Dakar Djibouti corridor (2 traffic directions) – Road and railway alternative ‐ International component .......................................................................................................................... 70 Table 32. Normal intra‐Country road traffic (2040) on the missing links of the corridor .............................................. 72 Table 33.Traffic structure by vehicle type (2010) on the missing links of the corridor ‐ Intra‐country Component ..... 72 Table 34. Gains in vehicles’ operating costs on the missing links of the corridor .......................................................... 73 Table 35. Intra‐Countries induced road traffic (2040) on the missing links of the corridor .......................................... 73 Table 36. Intra‐Countries diverted road traffic (2040) on the missing links of the corridor .......................................... 74 Table 37. Vector layers making up the database ........................................................................................................... 88 Table 38. Road missing links of the corridor Dakar Djibouti (2011) ............................................................................... 91 Table 39. Bridges on the Chadian section .................................................................................................................... 103 Table 40. Developments cost of the road missing links ............................................................................................... 106 Table 41. Development cost of basic infrastructure (Million U.S. $) by railway missing link and by alternative in standard road ............................................................................................................................................................... 115 Table 42. Installation cost of railway centers and security installations (Million U.S. $) per alternative and per missing link in standard gauge .................................................................................................................................................. 115 Table 43. Total cost per development alternative of the railway missing links (Millions US $) in standard gauge ..... 115 Table 44. The total development cost in standard gauge of the Trans‐Sahelian existing railway network ................ 116
Prefeasibility study of the missing links of Final report Dakar – N’djamena and N’djamena ‐ Djibouti links November 2011
STUDI INTERNATIONAL page 9
Table 45. Cost of construction of basic infrastructure (Million US $) by rail missing link and by alternative, in meter or narrow gauge ............................................................................................................................................................... 120 Table 46. Cost of rehabilitation of existing railway lines ............................................................................................. 120 Table 47. Railway alternatives – Number of the rolling stock, cost of acquisition – Trend scenario – Horizon 2040 . 123 Table 48. Railway alternative – Number of rolling stock, acquisition cost – High scenario – Horizon 2040 ............... 123 Table 49. Economic cost of the ton.kilometre – Trend and scenarios – Horizon 2040 ................................................ 124 Table 50. Opportunity cost (in Millions US $, 2011) of the missing links ..................................................................... 125 Table 51. Return rate and net present value (10 %, Millions US $) of the road missing links of the corridor Dakar – Djibouti – Road alternative .......................................................................................................................................... 126 Table 52. Sensitivity tests (of the IRR) – Trend scenario – Road missing links of the corridor Dakar Djibouti – Road alternative .................................................................................................................................................................... 126 Table 53. Average atmospheric emission coefficients of lorries, trains and boats (in gram/ton/km) and costs in ton/km ......................................................................................................................................................................... 127 Table 54. Return rate and net present value (10 %, Millions US $) of the railway missing links of the corridor Dakar – Djibouti – Railway Alternative ...................................................................................................................................... 127 Table 55. Return rate and net present value (Millions US $) of the road missing links of the corridor Dakar – Djibouti – Road and railway alternative .................................................................................................................................... 128 Table 56. Sensitivity tests (of the IRR) – Trend scenario – Road missing links of the corridor Dakar Djibouti – Road and railway alternative ....................................................................................................................................................... 128 Table 57. Return rate and net present value (10 %, Millions US $) of the railway missing links of the corridor Dakar – Djibouti – Road and railway alternative ....................................................................................................................... 128 Table 58. Implementation schedule of railway missing links ....................................................................................... 133 Table 59. Risks control matrix ...................................................................................................................................... 137 Table 60. Linear of road missing links (2011) of Dakar Djibouti Corridor .................................................................... 140 Table 61. Development cost (million USD) of the road missing links (2011) of Dakar Djibouti Corridor ..................... 142 Table 62. Development cost (million USD) of railway missing links (2011) of Dakar Djibouti Corridor ....................... 143 Table 63. The total development cost of standard gauge of the Trans‐Sahelian existing railway network ................ 143 Table 64. Transafricaine 5. Etat d’exécution (Janvier 2011) des travaux d’aménagement du tronçon routier Saraya – Falémé – Kita ‐ Kati ...................................................................................................................................................... 184
Prefeasibility study of the missing links of Final report Dakar – N’djamena and N’djamena ‐ Djibouti links November 2011
STUDI INTERNATIONAL page 10
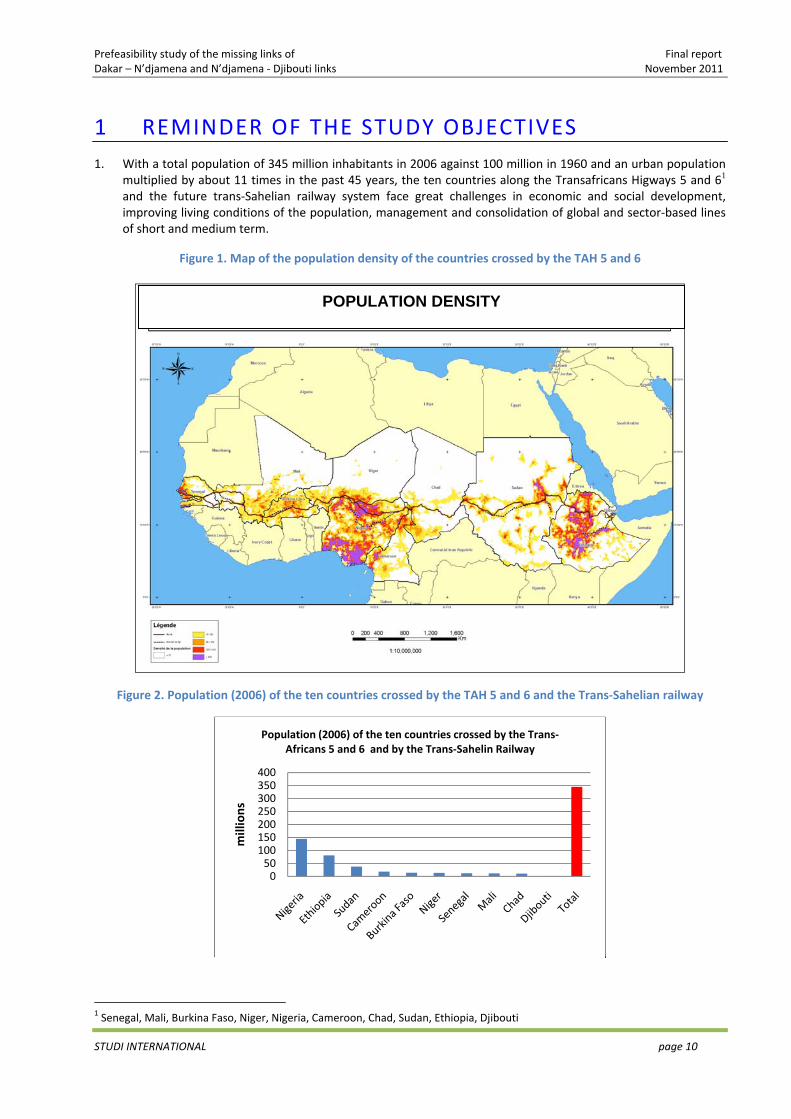
1 REMINDER OF THE STUDY OBJECTIVES 1. With a total population of 345 million inhabitants in 2006 against 100 million in 1960 and an urban population
multiplied by about 11 times in the past 45 years, the ten countries along the Transafricans Higways 5 and 61 and the future trans‐Sahelian railway system face great challenges in economic and social development, improving living conditions of the population, management and consolidation of global and sector‐based lines of short and medium term.
Figure 1. Map of the population density of the countries crossed by the TAH 5 and 6
Figure 2. Population (2006) of the ten countries crossed by the TAH 5 and 6 and the Trans‐Sahelian railway
1 Senegal, Mali, Burkina Faso, Niger, Nigeria, Cameroon, Chad, Sudan, Ethiopia, Djibouti
050100150200250300350400
millions
Population (2006) of the ten countries crossed by the Trans‐Africans 5 and 6 and by the Trans‐Sahelin Railway
POPULATION DENSITY
Prefeasibility study of the missing links of Final report Dakar – N’djamena and N’djamena ‐ Djibouti links November 2011
STUDI INTERNATIONAL page 11
2. The very substantial progress made in health care have led to a very appreciable decline in mortality, while the birth rate has remained among the highest rates in the world, which has been at the root of an exceptional population growth, the trend observed over the past 45 years come close to 2.7 % on average.
3. Globally, economic growth for these ten countries has experienced three major periods:
the 60s and 70s with a GDP growth exceeding that of the population, resulting in a rise in living standards,
the period of the 80s and 90s, with a GDP growth less than or equal to the population, where in the best case, it results in a stagnation of living standards,
The period of 2000s which presents for many countries, comparable features to those levels of the 60s and 70s, that is to say, again an overall improvement in living standards, with mixed results at the end of the years 2008 and 2009, related to the international financial crisis.
4. This development, generally positive, found a guarantor in a context characterized by two interrelated factors: (i) the significant growth of world demand for certain products such as metals and (ii) the emergence of opportunities for funding outside the conventional circuits of European and / or American origin.
5. In addition, new trends are emerging for local processing of raw materials to meet three objectives: (a) minimize transportation costs becoming increasingly high due to the impact of energy rising prices, (b) decentralize activities, also seeking lower costs, (c) respond to local demand for products needed for its investment needs.
6. The ten countries show a political will to contribute to the creation of a united, integrated and prosperous Africa, advantageously inserted into the world economy and taking advantage from the synergies and complementarities between their various economies. This trend requires the existence of a vision for infrastructure policy in general and transport in particular, which gives priority, in the priority choices, the options promoting regional and continental integration.
7. In the current situation, the transport sector at the ten countries is generally characterized by a network suffering from dilapidated state of its infrastructure, low density, weak handling and maintenance equipment, insufficient financial resources in infrastructure and inefficient control and management capacities. Moreover, the interconnection of transport infrastructure is reduced with preponderance for road transport although it is not always the cheapest.
8. The railway, in addition to its low pollution, its safety, its economy in energy consumption, its role in the development and improvement of access, has many important assets, including those relating to the regularity, punctuality, and safety. It is also recognized that for the mass transport and the transport of heavy‐weight, this mode provides a means of transport at the almost ideal lowest cost. To this are added the greater comparative advantages highlighted by the environmental concerns and the negative impacts caused by traffic congestion, the emission of greenhouse gas emissions, noise disturbance, injury and material damages related to an insufficient control of road accidents.
9. Enhance the economic potential of the ten countries requires the identification and development of missing links in road and railway between Dakar and Djibouti, and which is in the current situation, an obstacle to the advent of an integrated transport system.
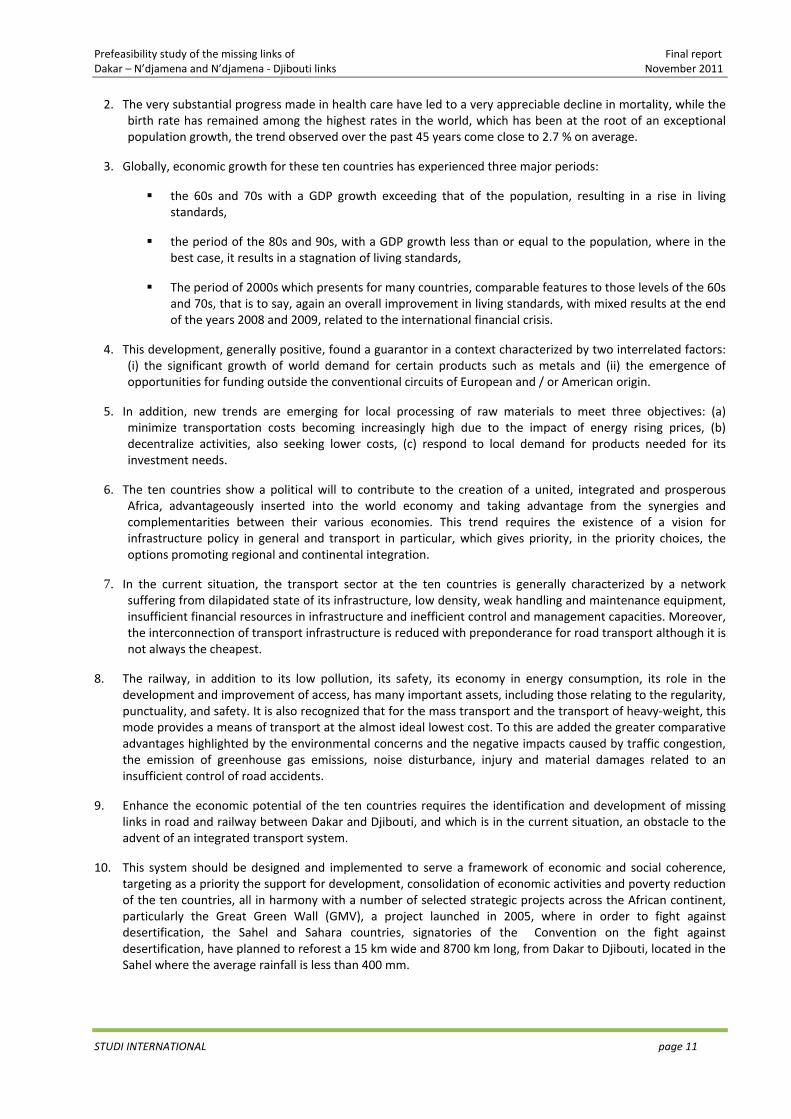
10. This system should be designed and implemented to serve a framework of economic and social coherence, targeting as a priority the support for development, consolidation of economic activities and poverty reduction of the ten countries, all in harmony with a number of selected strategic projects across the African continent, particularly the Great Green Wall (GMV), a project launched in 2005, where in order to fight against desertification, the Sahel and Sahara countries, signatories of the Convention on the fight against desertification, have planned to reforest a 15 km wide and 8700 km long, from Dakar to Djibouti, located in the Sahel where the average rainfall is less than 400 mm.
Prefeasibility study of the missing links of Final report Dakar – N’djamena and N’djamena ‐ Djibouti links November 2011
STUDI INTERNATIONAL page 12
Figure 3. Layout of The Great Green Wall
11. The project, which comes especially in the context of the NEPAD initiative, a program of the African Union adopted in Lusaka, Zambia in 2001, is thus meant to support the promotion and implementation of different sector strategies (agriculture, industry, forestry, mining, ...), respecting a certain number of consultation requirements and being part of a Long‐term vision of the transportation system evolution at the national, regional and continental levels, based on a consideration of the costs (often high) of investment required by the leveling and integration of such a network and the constraints of completion time constraints, funding needs and the implementing of the transport actors in the region.
Prefeasibility study of the missing links of Final report Dakar – N’djamena and N’djamena ‐ Djibouti links November 2011
STUDI INTERNATIONAL page 13
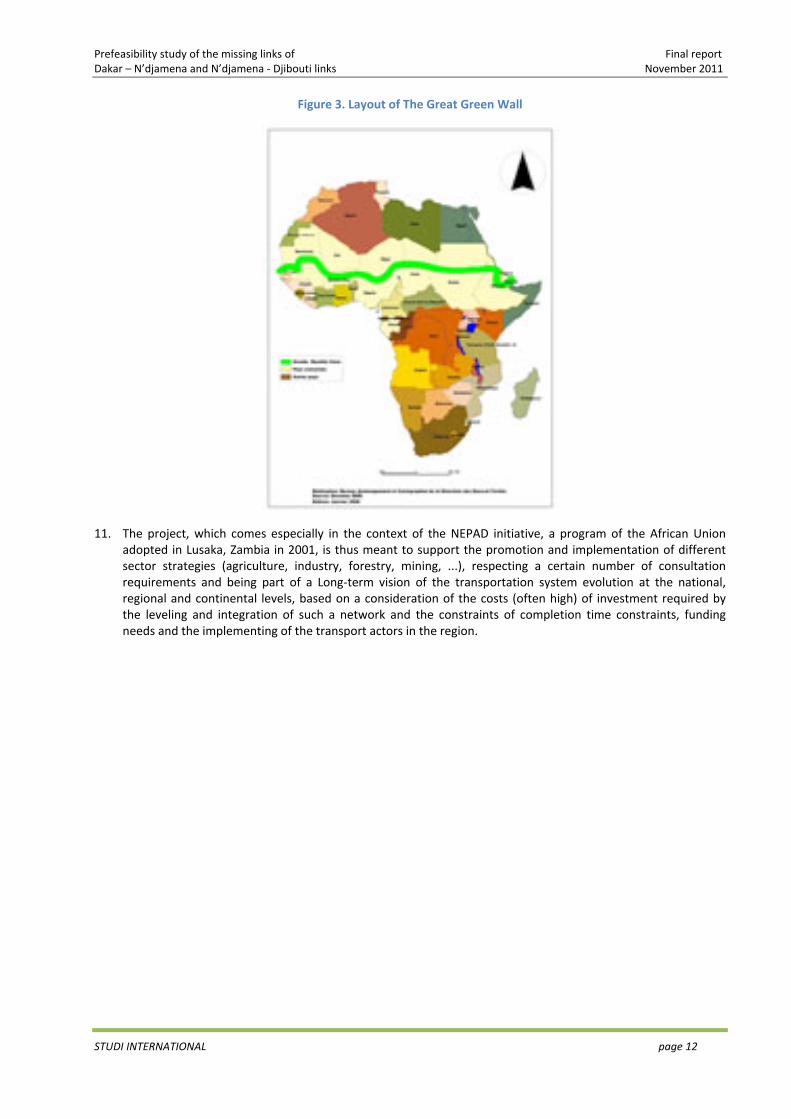
Figure 4. Map of land use of the countries crossed by the Transafricans Highways 5 and 6
12. The Transafricans 5 and 6 and the future Trans‐Sahelian railway also benefit from a valuable asset, that of having at their ends, two ports, Dakar and Djibouti, corresponding to two platforms having experienced significant momentum during the recent years and that are widely open on the African continent, Europe and Asia.
13. The study examines the prefeasibility of the missing links of the Transafricans 5 and 6 and the Trans‐Sahelian railway. It aims to analyze strategically the overall travel demand for transport on these missing links and provide recommendations on the implementation of the most appropriate development option in terms of designing, technical standards and organization.
14. It is part of the African projects considered as integrator ones, aiming to support innovative approaches to mobilize the necessary resources for the infrastructure development along regional corridors.
15. For the railway, the general principles in this area will be identified through a number of options for the rail system, of which the main ones include :
‐ The rail transport will have to irrigate the large activity areas of activity in the crossed countries, especially the capitals,
‐ The areas of activity causing a heavy traffic of goods (especially mining) must be branched to the railway system,
‐ The layout and equipment of the lines of the future network must be adjusted to the transit traffic needs,
‐ The principle of developing electrified lines must be considered in the development process of the transport system,exchanges between the road and rail transport systems (intermodality) will have to be facilitated through the development of common nodes allowing a reductions in the travel times and loads.
Prefeasibility study of the missing links of Final report Dakar – N’djamena and N’djamena ‐ Djibouti links November 2011
STUDI INTERNATIONAL page 14
2 SUMMARY OF THE TERMS OF REFERENCE
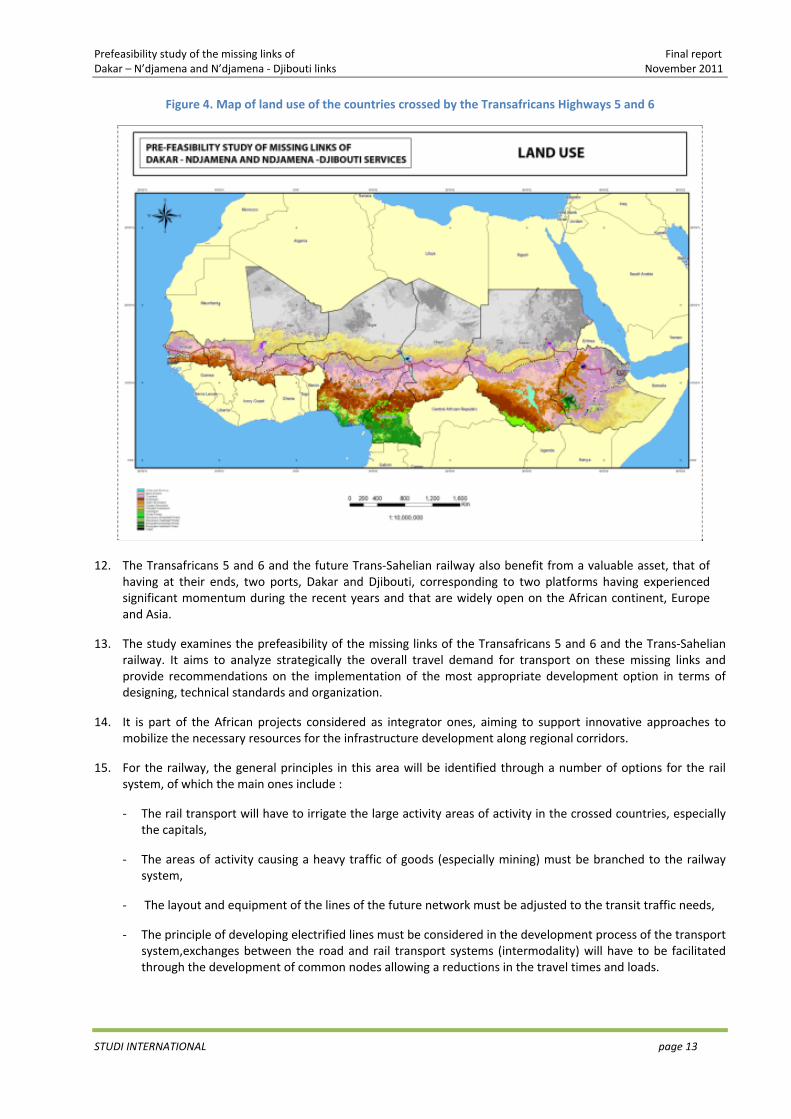
16. The study is mainly based on four main activities
Activity 1 : General framework of development, planning and regional and continental integration strategies
Activity 2 : Scenarios of long‐term development, planning options and projections of traffic flows on the missing links
Activity 3 : Finding the layout corridor s of fewer constraints and identifying the best layout corridor
Activity 4 : Analysis of the best layout corridor , profitability estimation and risk assessment, planning of the following steps’ implementation, drafting the terms of reference of the upcoming phases
Figure 5. Block diagram of the study
17. The durations of activities are as follows : (i) Activities 1 and 2 : 8 weeks (ii) Validation of activities 1 and 2 : T1 (iii) Activities 3 and 4 : T1 +8 weeks (iv) Validation of activities 3 and 4 : T2 (v) Definitive final report : T2 + 2 weeks
18. The project management of the study is provided by the African Union, in consultation with the countries crossed by the corridor and the concerned regional economic communities, especially ECOWAS, ECCAS, COMESA and IGAD.
Prefeasibility study of the missing links of Final report Dakar – N’djamena and N’djamena ‐ Djibouti links November 2011
STUDI INTERNATIONAL page 15
3 OBJECTIVES AND CONTENT OF THE REPORT
19. This report aims to propose different alternatives to the development of the missing links of the Dakar – Djibouti corridor, relating to its two components (road and rail), in order to estimate the correspondent costs, conduct economic evaluation and risk’s investigations, provide a schedule for the implementation of the development and develop terms of reference for the following phases.
20. A reminder of the road and rail missing links as well as the performance of existing railway lines and seaports (Dakar, Djibouti) served by the corridor, will be a first section. It is followed by a reminder of the main socio‐economic characteristics of the ten countries crossed by the corridor (second section), the demand for transport in the very long term (third section) as well as well as the methodology used by the third and fourth activities (fourth section)
21. The fifth section is devoted to a critical analysis of the road and rail standards in force in the ten countries along the corridor, followed by recommendations. As for the sixth section, it is intended to recall the main geometrical features (horizontal alignment, longitudinal section and cross section) for the design of a layout of a railway line.
22. The seventh section identifies and prioritizes the various constraints (physical, natural, ..) along the corridor. It also focuses on the identification of topographic corridors in favor for including the corridors of railway line. A geographic information system was designed within this framework and entirely implemented by the Consultant within this framework, to facilitate the analysis, processing and interpretations derived from the various crossings of the vector layers that compose the system. This will be useful in particular in the development of the railway line corridors, called corridors of "less stress", obtained from the hierarchical constraints and topographic corridors.
23. The eighth section focuses on road improvements in the corridor’s missing links and their associated costs, followed by the proposed corridors of rail missing links’ line, their corresponding costs, the choice of the best alternative at the techno‐economic and environmental levels as well as the needs’ assessment related to the rolling stock and their respective costs.
24. The ninth section is dedicated to the economic evaluation of the structure, for the three following alternatives: (i) development of the road missing links, (ii) development of the rail missing links and (iii) simultaneous development of road and rail missing links followed by a performance schedule of the following phases and recommendations for the management of risks associated with the investment (tenth section).
25. Drafting terms of reference of the following phases will finally be the eleventh and final section.
Prefeasibility study of the missing links of Final report Dakar – N’djamena and N’djamena ‐ Djibouti links November 2011
STUDI INTERNATIONAL page 16
4 REMINDER OF ROAD AND RAIL MISSING LINKS, PERFORMANCE OF EXISTING RAILWAY LINES AND SEAPORTS SERVED BY THE CORRIDOR
4.1 Road component
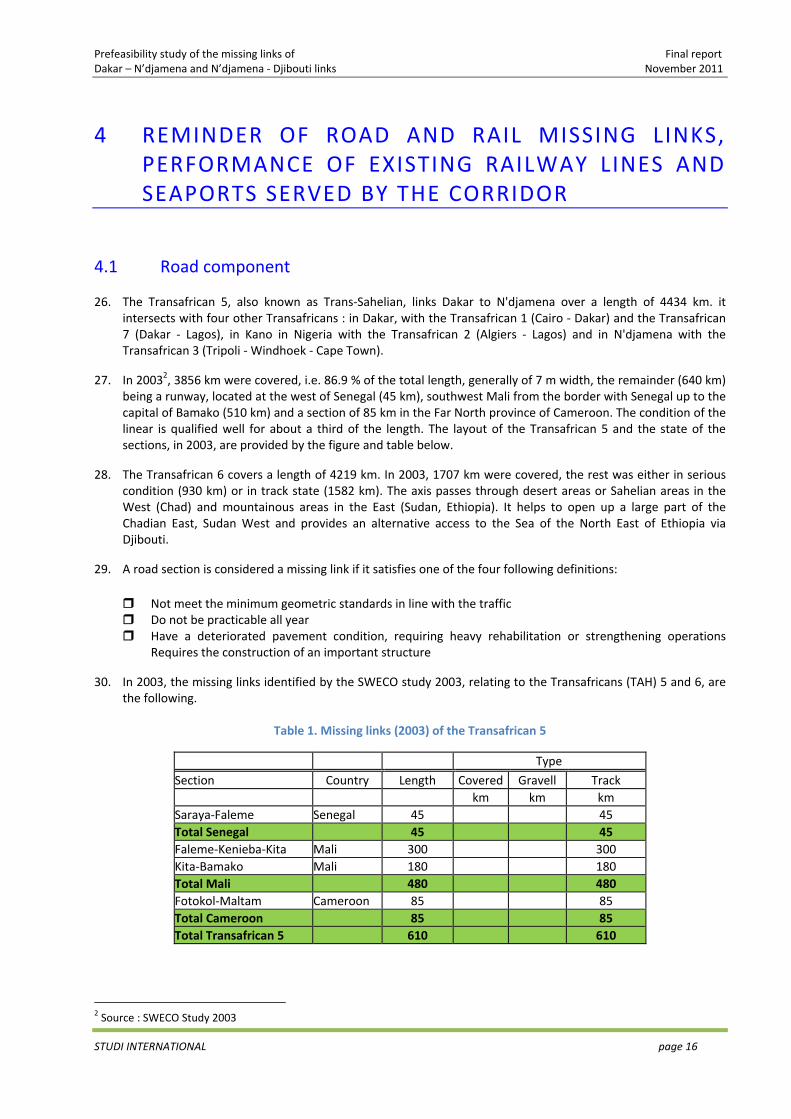
26. The Transafrican 5, also known as Trans‐Sahelian, links Dakar to N'djamena over a length of 4434 km. it intersects with four other Transafricans : in Dakar, with the Transafrican 1 (Cairo ‐ Dakar) and the Transafrican 7 (Dakar ‐ Lagos), in Kano in Nigeria with the Transafrican 2 (Algiers ‐ Lagos) and in N'djamena with the Transafrican 3 (Tripoli ‐ Windhoek ‐ Cape Town).
27. In 20032, 3856 km were covered, i.e. 86.9 % of the total length, generally of 7 m width, the remainder (640 km) being a runway, located at the west of Senegal (45 km), southwest Mali from the border with Senegal up to the capital of Bamako (510 km) and a section of 85 km in the Far North province of Cameroon. The condition of the linear is qualified well for about a third of the length. The layout of the Transafrican 5 and the state of the sections, in 2003, are provided by the figure and table below.
28. The Transafrican 6 covers a length of 4219 km. In 2003, 1707 km were covered, the rest was either in serious condition (930 km) or in track state (1582 km). The axis passes through desert areas or Sahelian areas in the West (Chad) and mountainous areas in the East (Sudan, Ethiopia). It helps to open up a large part of the Chadian East, Sudan West and provides an alternative access to the Sea of the North East of Ethiopia via Djibouti.
29. A road section is considered a missing link if it satisfies one of the four following definitions:
Not meet the minimum geometric standards in line with the traffic Do not be practicable all year Have a deteriorated pavement condition, requiring heavy rehabilitation or strengthening operations
Requires the construction of an important structure
30. In 2003, the missing links identified by the SWECO study 2003, relating to the Transafricans (TAH) 5 and 6, are the following.
Table 1. Missing links (2003) of the Transafrican 5
Type
Section Country Length Covered Gravell Track km km km Saraya‐Faleme Senegal 45 45 Total Senegal 45 45 Faleme‐Kenieba‐Kita Mali 300 300 Kita‐Bamako Mali 180 180 Total Mali 480 480 Fotokol‐Maltam Cameroon 85 85 Total Cameroon 85 85 Total Transafrican 5 610 610
2 Source : SWECO Study 2003
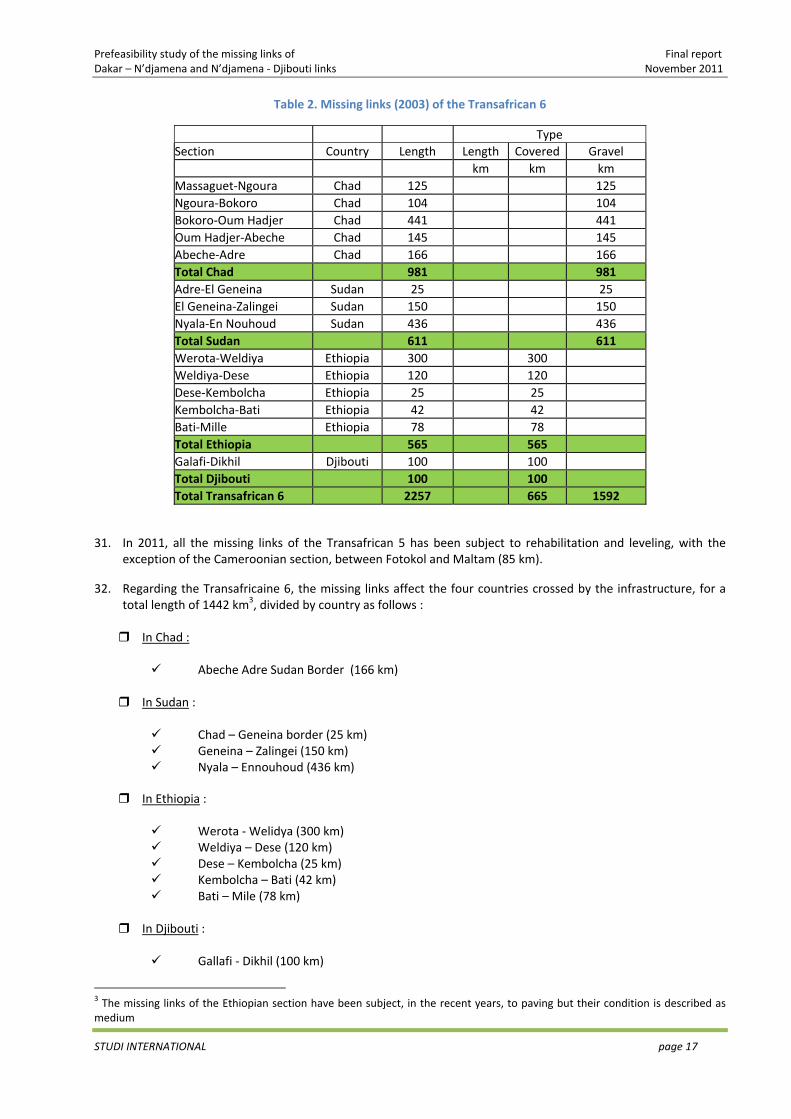
Prefeasibility study of the missing links of Final report Dakar – N’djamena and N’djamena ‐ Djibouti links November 2011
STUDI INTERNATIONAL page 17
Table 2. Missing links (2003) of the Transafrican 6
Type Section Country Length Length Covered Gravel km km km Massaguet‐Ngoura Chad 125 125 Ngoura‐Bokoro Chad 104 104 Bokoro‐Oum Hadjer Chad 441 441 Oum Hadjer‐Abeche Chad 145 145 Abeche‐Adre Chad 166 166 Total Chad 981 981 Adre‐El Geneina Sudan 25 25 El Geneina‐Zalingei Sudan 150 150 Nyala‐En Nouhoud Sudan 436 436 Total Sudan 611 611 Werota‐Weldiya Ethiopia 300 300 Weldiya‐Dese Ethiopia 120 120 Dese‐Kembolcha Ethiopia 25 25 Kembolcha‐Bati Ethiopia 42 42 Bati‐Mille Ethiopia 78 78 Total Ethiopia 565 565 Galafi‐Dikhil Djibouti 100 100 Total Djibouti 100 100 Total Transafrican 6 2257 665 1592
31. In 2011, all the missing links of the Transafrican 5 has been subject to rehabilitation and leveling, with the exception of the Cameroonian section, between Fotokol and Maltam (85 km).
32. Regarding the Transafricaine 6, the missing links affect the four countries crossed by the infrastructure, for a total length of 1442 km3, divided by country as follows :
In Chad :
Abeche Adre Sudan Border (166 km)
In Sudan :
Chad – Geneina border (25 km) Geneina – Zalingei (150 km) Nyala – Ennouhoud (436 km)
In Ethiopia :
Werota ‐ Welidya (300 km) Weldiya – Dese (120 km) Dese – Kembolcha (25 km) Kembolcha – Bati (42 km) Bati – Mile (78 km)
In Djibouti :
Gallafi ‐ Dikhil (100 km)
3 The missing links of the Ethiopian section have been subject, in the recent years, to paving but their condition is described as medium
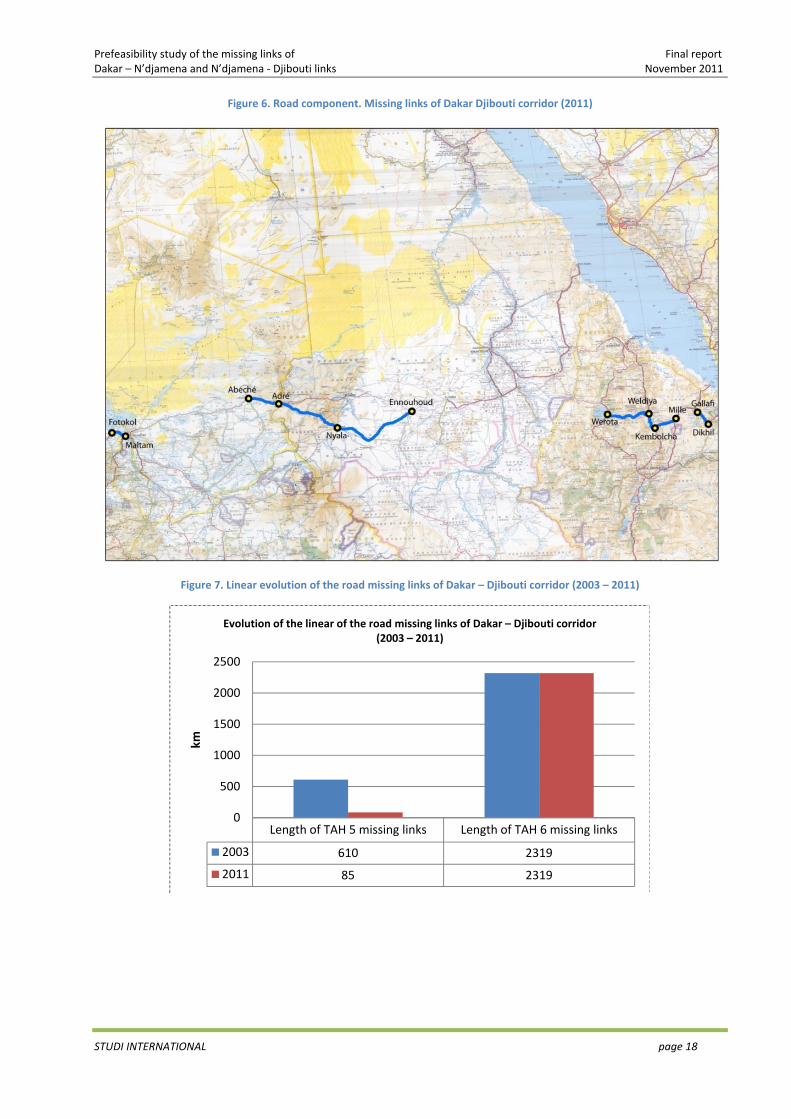
Prefeasibility study of the missing links of Final report Dakar – N’djamena and N’djamena ‐ Djibouti links November 2011
STUDI INTERNATIONAL page 18
Figure 6. Road component. Missing links of Dakar Djibouti corridor (2011)
Figure 7. Linear evolution of the road missing links of Dakar – Djibouti corridor (2003 – 2011)
Length of TAH 5 missing links Length of TAH 6 missing links
2003 610 2319
2011 85 2319
0
500
1000
1500
2000
2500
km
Evolution of the linear of the road missing links of Dakar – Djibouti corridor (2003 – 2011)
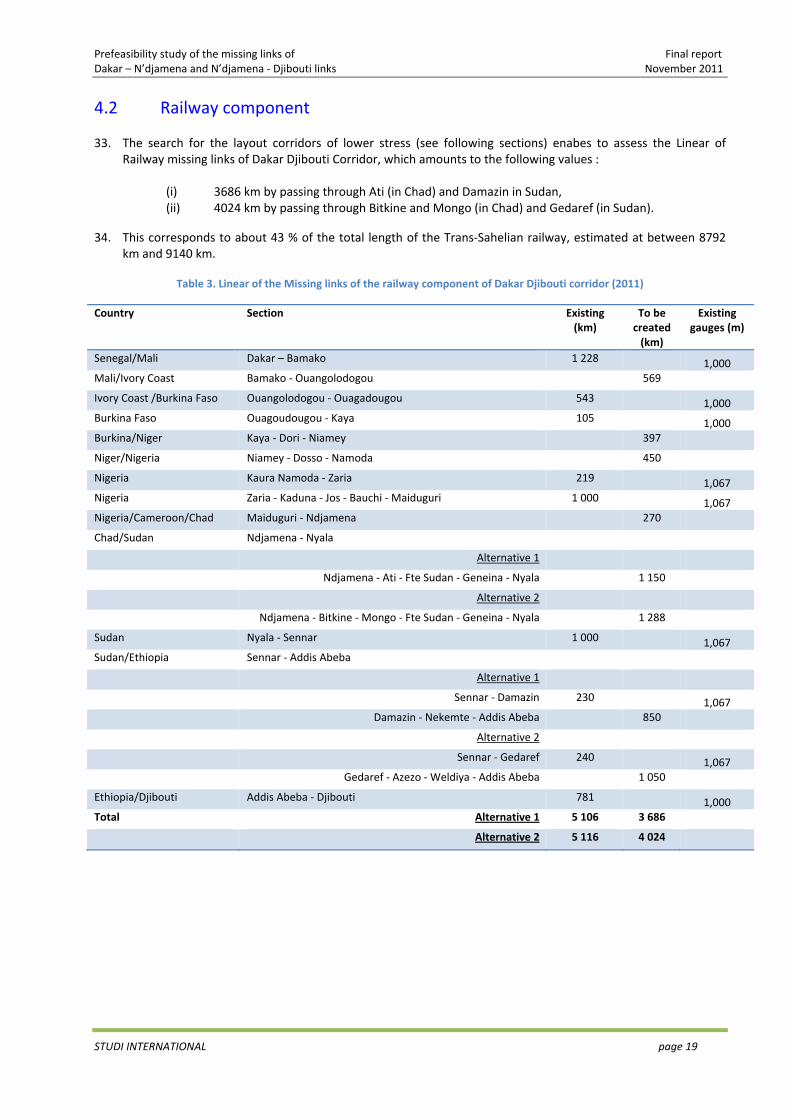
Prefeasibility study of the missing links of Final report Dakar – N’djamena and N’djamena ‐ Djibouti links November 2011
STUDI INTERNATIONAL page 19
4.2 Railway component
33. The search for the layout corridors of lower stress (see following sections) enabes to assess the Linear of Railway missing links of Dakar Djibouti Corridor, which amounts to the following values :
(i) 3686 km by passing through Ati (in Chad) and Damazin in Sudan, (ii) 4024 km by passing through Bitkine and Mongo (in Chad) and Gedaref (in Sudan).
34. This corresponds to about 43 % of the total length of the Trans‐Sahelian railway, estimated at between 8792 km and 9140 km.
Table 3. Linear of the Missing links of the railway component of Dakar Djibouti corridor (2011)
Country Section Existing (km)
To be created (km)
Existing gauges (m)
Senegal/Mali Dakar – Bamako 1 228 1,000 Mali/Ivory Coast Bamako ‐ Ouangolodogou 569 Ivory Coast /Burkina Faso Ouangolodogou ‐ Ouagadougou 543 1,000 Burkina Faso Ouagoudougou ‐ Kaya 105 1,000 Burkina/Niger Kaya ‐ Dori ‐ Niamey 397 Niger/Nigeria Niamey ‐ Dosso ‐ Namoda 450 Nigeria Kaura Namoda ‐ Zaria 219 1,067 Nigeria Zaria ‐ Kaduna ‐ Jos ‐ Bauchi ‐ Maiduguri 1 000 1,067 Nigeria/Cameroon/Chad Maiduguri ‐ Ndjamena 270 Chad/Sudan Ndjamena ‐ Nyala
Alternative 1 Ndjamena ‐ Ati ‐ Fte Sudan ‐ Geneina ‐ Nyala 1 150 Alternative 2 Ndjamena ‐ Bitkine ‐ Mongo ‐ Fte Sudan ‐ Geneina ‐ Nyala 1 288
Sudan Nyala ‐ Sennar 1 000 1,067 Sudan/Ethiopia Sennar ‐ Addis Abeba Alternative 1 Sennar ‐ Damazin 230 1,067 Damazin ‐ Nekemte ‐ Addis Abeba 850 Alternative 2 Sennar ‐ Gedaref 240 1,067 Gedaref ‐ Azezo ‐ Weldiya ‐ Addis Abeba 1 050 Ethiopia/Djibouti Addis Abeba ‐ Djibouti 781 1,000 Total Alternative 1 5 106 3 686
Alternative 2 5 116 4 024
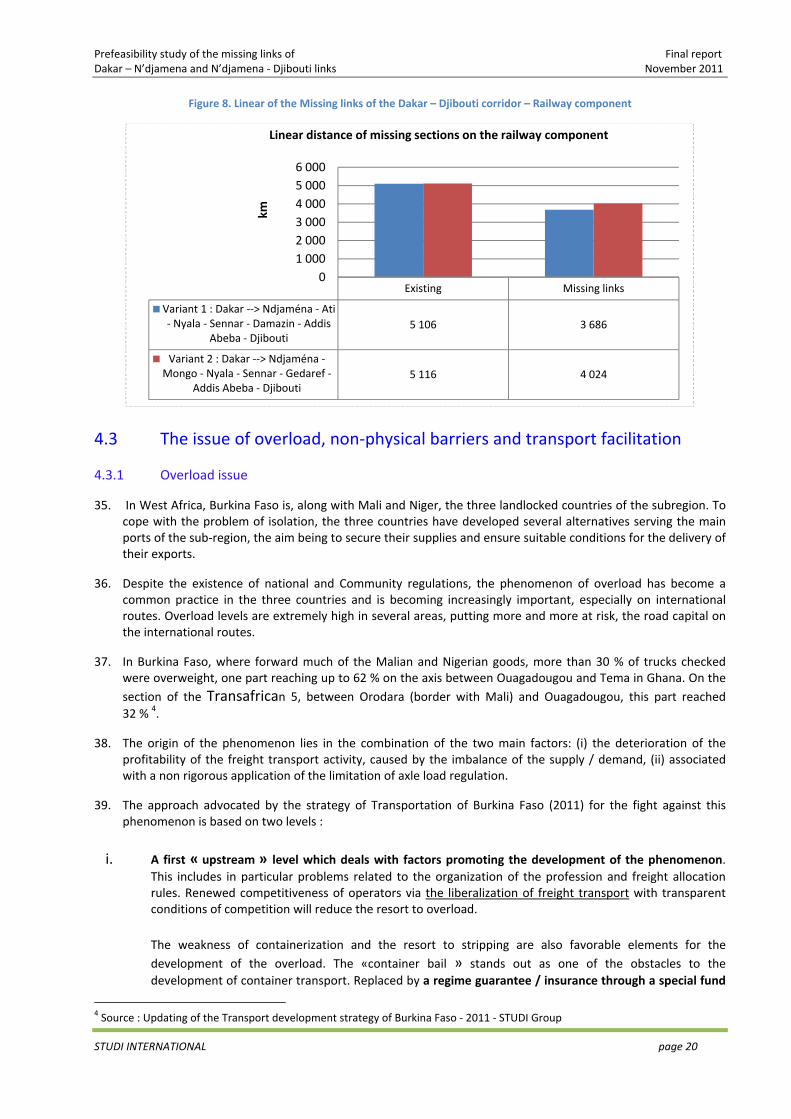
Prefeasibility study of the missing links of Final report Dakar – N’djamena and N’djamena ‐ Djibouti links November 2011
STUDI INTERNATIONAL page 20
Figure 8. Linear of the Missing links of the Dakar – Djibouti corridor – Railway component
4.3 The issue of overload, non‐physical barriers and transport facilitation
4.3.1 Overload issue
35. In West Africa, Burkina Faso is, along with Mali and Niger, the three landlocked countries of the subregion. To cope with the problem of isolation, the three countries have developed several alternatives serving the main ports of the sub‐region, the aim being to secure their supplies and ensure suitable conditions for the delivery of their exports.
36. Despite the existence of national and Community regulations, the phenomenon of overload has become a common practice in the three countries and is becoming increasingly important, especially on international routes. Overload levels are extremely high in several areas, putting more and more at risk, the road capital on the international routes.
37. In Burkina Faso, where forward much of the Malian and Nigerian goods, more than 30 % of trucks checked were overweight, one part reaching up to 62 % on the axis between Ouagadougou and Tema in Ghana. On the section of the Transafrican 5, between Orodara (border with Mali) and Ouagadougou, this part reached 32 % 4.
38. The origin of the phenomenon lies in the combination of the two main factors: (i) the deterioration of the profitability of the freight transport activity, caused by the imbalance of the supply / demand, (ii) associated with a non rigorous application of the limitation of axle load regulation.
39. The approach advocated by the strategy of Transportation of Burkina Faso (2011) for the fight against this phenomenon is based on two levels :
i. A first « upstream » level which deals with factors promoting the development of the phenomenon.
This includes in particular problems related to the organization of the profession and freight allocation rules. Renewed competitiveness of operators via the liberalization of freight transport with transparent conditions of competition will reduce the resort to overload.
The weakness of containerization and the resort to stripping are also favorable elements for the development of the overload. The «container bail » stands out as one of the obstacles to the development of container transport. Replaced by a regime guarantee / insurance through a special fund
4 Source : Updating of the Transport development strategy of Burkina Faso ‐ 2011 ‐ STUDI Group
Existing Missing links
Variant 1 : Dakar ‐‐> Ndjaména ‐ Ati ‐ Nyala ‐ Sennar ‐ Damazin ‐ Addis
Abeba ‐ Djibouti5 106 3 686
Variant 2 : Dakar ‐‐> Ndjaména ‐Mongo ‐ Nyala ‐ Sennar ‐ Gedaref ‐
Addis Abeba ‐ Djibouti5 116 4 024
01 0002 0003 0004 0005 0006 000
km
Linear distance of missing sections on the railway component
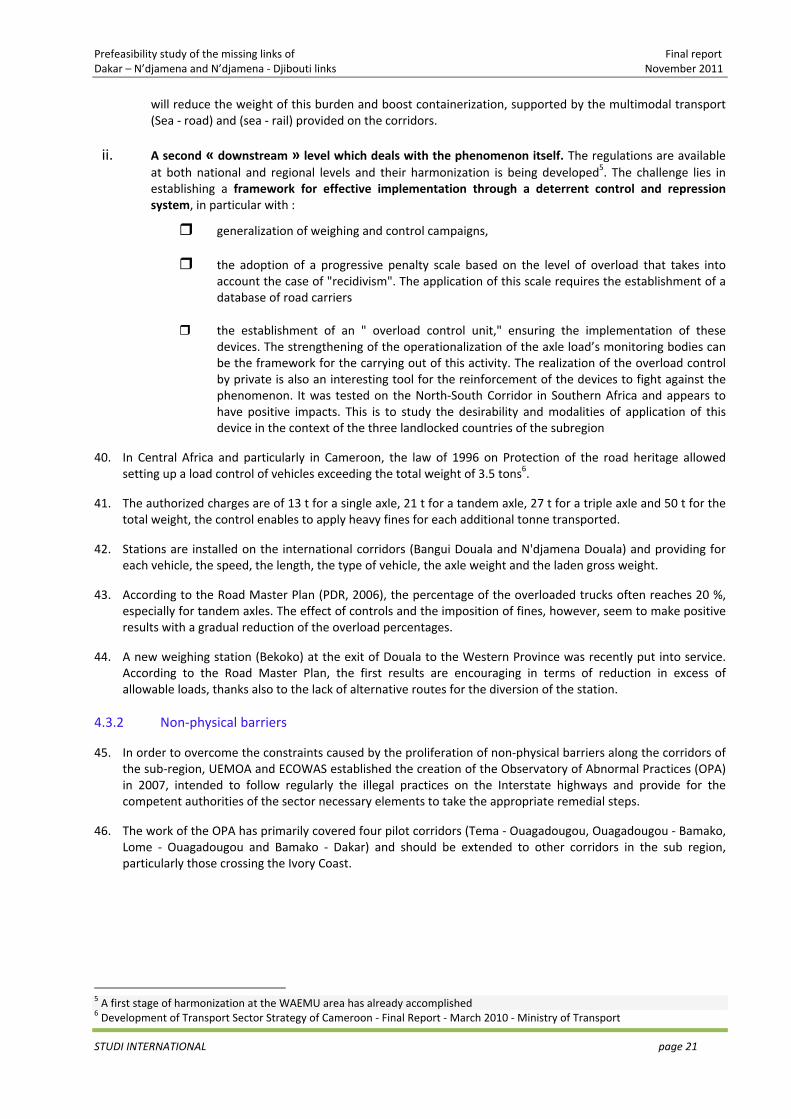
Prefeasibility study of the missing links of Final report Dakar – N’djamena and N’djamena ‐ Djibouti links November 2011
STUDI INTERNATIONAL page 21
will reduce the weight of this burden and boost containerization, supported by the multimodal transport (Sea ‐ road) and (sea ‐ rail) provided on the corridors.
ii. A second « downstream » level which deals with the phenomenon itself. The regulations are available
at both national and regional levels and their harmonization is being developed5. The challenge lies in establishing a framework for effective implementation through a deterrent control and repression system, in particular with :
generalization of weighing and control campaigns,
the adoption of a progressive penalty scale based on the level of overload that takes into account the case of "recidivism". The application of this scale requires the establishment of a database of road carriers
the establishment of an " overload control unit," ensuring the implementation of these
devices. The strengthening of the operationalization of the axle load’s monitoring bodies can be the framework for the carrying out of this activity. The realization of the overload control by private is also an interesting tool for the reinforcement of the devices to fight against the phenomenon. It was tested on the North‐South Corridor in Southern Africa and appears to have positive impacts. This is to study the desirability and modalities of application of this device in the context of the three landlocked countries of the subregion
40. In Central Africa and particularly in Cameroon, the law of 1996 on Protection of the road heritage allowed setting up a load control of vehicles exceeding the total weight of 3.5 tons6.
41. The authorized charges are of 13 t for a single axle, 21 t for a tandem axle, 27 t for a triple axle and 50 t for the total weight, the control enables to apply heavy fines for each additional tonne transported.
42. Stations are installed on the international corridors (Bangui Douala and N'djamena Douala) and providing for each vehicle, the speed, the length, the type of vehicle, the axle weight and the laden gross weight.
43. According to the Road Master Plan (PDR, 2006), the percentage of the overloaded trucks often reaches 20 %, especially for tandem axles. The effect of controls and the imposition of fines, however, seem to make positive results with a gradual reduction of the overload percentages.
44. A new weighing station (Bekoko) at the exit of Douala to the Western Province was recently put into service. According to the Road Master Plan, the first results are encouraging in terms of reduction in excess of allowable loads, thanks also to the lack of alternative routes for the diversion of the station.
4.3.2 Non‐physical barriers
45. In order to overcome the constraints caused by the proliferation of non‐physical barriers along the corridors of the sub‐region, UEMOA and ECOWAS established the creation of the Observatory of Abnormal Practices (OPA) in 2007, intended to follow regularly the illegal practices on the Interstate highways and provide for the competent authorities of the sector necessary elements to take the appropriate remedial steps.
46. The work of the OPA has primarily covered four pilot corridors (Tema ‐ Ouagadougou, Ouagadougou ‐ Bamako, Lome ‐ Ouagadougou and Bamako ‐ Dakar) and should be extended to other corridors in the sub region, particularly those crossing the Ivory Coast.
5 A first stage of harmonization at the WAEMU area has already accomplished 6 Development of Transport Sector Strategy of Cameroon ‐ Final Report ‐ March 2010 ‐ Ministry of Transport
Prefeasibility study of the missing links of Final report Dakar – N’djamena and N’djamena ‐ Djibouti links November 2011
STUDI INTERNATIONAL page 22
Figure 9. Mapping of abnormal practices followed by the OPA in West Africa
47. The OPA publishes a quarterly report presenting the results of surveys undertaken along the four pilot corridors. Examination of the evolution of the three indicators monitored7 over the period 2007 ‐ 2009, shows that although their values remain relatively high, the overall trend is downward, heralding a gradual reduction of non‐physical barriers. The relative youth of the institution (only three years) does not accurately measure the impact of the introduction of this device on the transport demand.
48. The gendarmerie, police, customs and collection agents of tax on the overload have the highest levels of responsibility in the levying of illegal taxes. However, those implicated in first are the gendarmerie and police, for almost all international routes being measures.
49. In central Africa, the creation of an observatory of abnormal practices on the corridor Douala – N’djamena – Bangui has recently been subject to a study8 financed by the European Union
50. The main key indicators selected cover the following elements: (i) profile of drivers, (ii) duration analysis, (iii) analysis of controls and stops, (iv) path cost analysis, (v) status and characteristics of vehicle and (vi) reported accidents.
51. Many relevant results were identified by the survey, in particular:
cumbersomeness of administrative procedures and trade facilitation along the corridor,
a generalization of abnormal practices,
the large number of checkpoints per 100 km : 3.3 on the Corridor Douala ‐ Ndjamena (4.7 on the Douala – Bangui axis).
52. On the corridor Douala ‐ N'Djamena, the following reported elements by the 2009 survey confirm the constraints and difficulties observed by the international carriers:
verification of not relevant documents and the control of about 15 % of vehicles verification of not relevant documents and the control of about 15 % of vehicles illegal taxes reaching on average 64% of the total amount paid by the carrier,
7 Number of inspections per 100 km, value of illegal taxes by 100 km and average delay per 100 km 8 Observatory of abnormal practices ‐ Douala Bangui and Douala N'djamena Corridors ‐ Summary Report ‐ Europaid/125506/D/SER/RCE ‐ November 2009
Prefeasibility study of the missing links of Final report Dakar – N’djamena and N’djamena ‐ Djibouti links November 2011
STUDI INTERNATIONAL page 23
The most involved public services in the illicit perceptions are the police and gendarmerie,
a total control duration of about seven hours for a period of active traffic of 1.4 days.
53. Concerning the administration of the observatory, three scenarios are proposed: (i) management of the takeover bid fully insured by CEMAC, (ii) autonomous takeover bid is exclusively in charge of information processing, (iii) autonomous takeover bid in charge of information collection, processing and dissemination. The annual operating cost of the takeover bid by scenario amounts to 250 000 € for scenario 1, 180 000 € for scenario 2 and about 400 000 € for scenario 3.
54. Regarding financial support for the operation of the takeover bid, the carriers will have to secure financing of the takeover bid by 50 % at cruising speed (fifth year)9 , supported by donors to the tune of 20 % and a flow of takeover bid (20 %) by carrying out certain activities, especially the development of certain studies for professionals, publication selling products, conducting training sessions and possibly response to tender offers on a number of topics for which the takeover bid has competencies.
4.3.3 Transport facilitation
55. The countries of West Africa have received strong support from the World Bank to finance the Regional Project of Transport and Transit Facilitation in West Africa (PRFTTAO).
56. The PRFTTAO includes the three following components:
Component 1 : Improvement of road infrastructure of West Africa corridors
It is mainly to improve the quality and increase the capacity of West African corridors’ sections for national and international traffic. This affects several actions: (i) rehabilitation and strengthening of critical sections, (ii) Construction of rest areas and multifunctional platforms, (iii) implementation of measures to mitigate the social and environmental impact where civil engineering works are undertaken, (iv) implementation of a specific action plan to fight against HIV / AIDS and (v) design and implementation of specific action plans for road safety.
Component 2 : Measures to facilitate transport and transit along the corridors of West African
This is mainly to strengthen the capacity of customs and transport entities along the West African corridors, with the aim to improve the monitoring, management and safety of goods’ transportation in transit. A number of actions are retained by the program, the main are the following:
(iii) leveling and strengthening the information of the information and communication technologies, in particular the interconnection of customs systems (SYDONIA + +, ..) of the subregion countries,
(iv) extension of the current system of goods’ monitoring on all the corridors, (v) increased resources alloted to mobile customs and authorities responsible for transport, (vi) Customs capacity building for the monitoring and control of the traffic along the corridors.
Component 3 : Project management, Monitoring and Evaluation
This relates to the support of management, monitoring and evaluation of the project by (i) strengthening national and inter‐country coordination as well as (ii) the support for the revision of textbooks that apply to the project activities.
9 It is not to create new taxes but to ensure an optimal allocation of existing taxes dedicated to the various structures of support for the sector
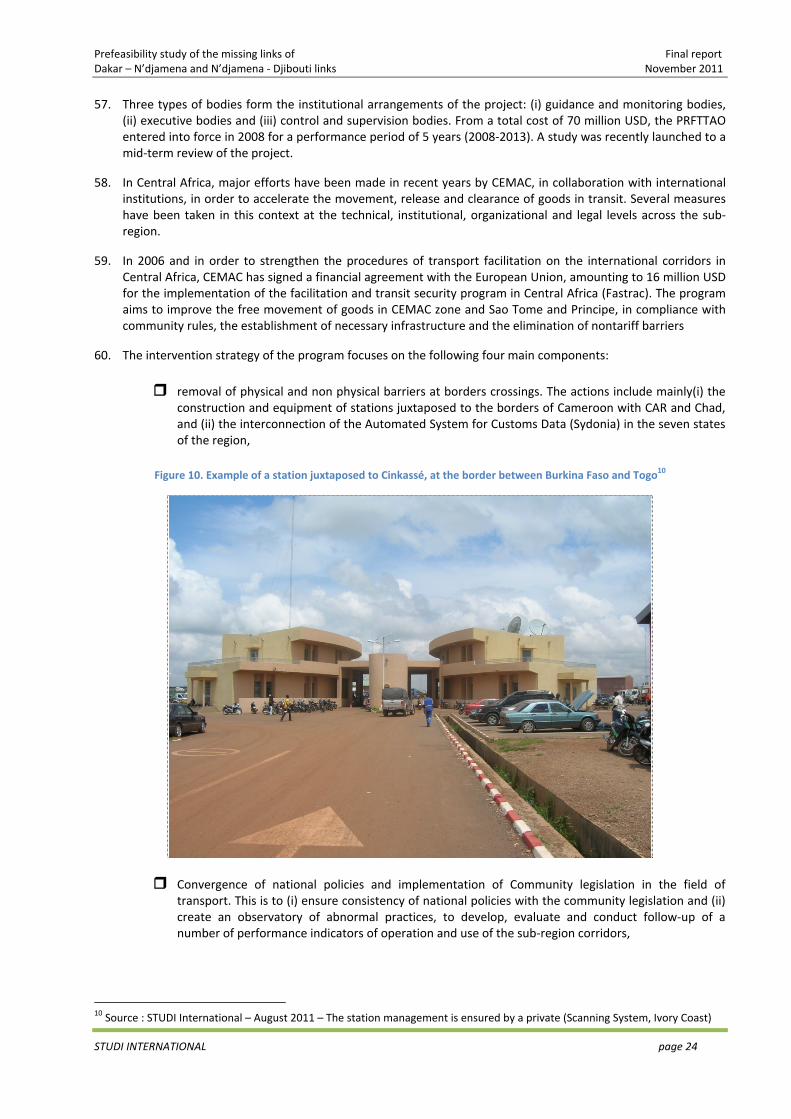
Prefeasibility study of the missing links of Final report Dakar – N’djamena and N’djamena ‐ Djibouti links November 2011
STUDI INTERNATIONAL page 24
57. Three types of bodies form the institutional arrangements of the project: (i) guidance and monitoring bodies, (ii) executive bodies and (iii) control and supervision bodies. From a total cost of 70 million USD, the PRFTTAO entered into force in 2008 for a performance period of 5 years (2008‐2013). A study was recently launched to a mid‐term review of the project.
58. In Central Africa, major efforts have been made in recent years by CEMAC, in collaboration with international institutions, in order to accelerate the movement, release and clearance of goods in transit. Several measures have been taken in this context at the technical, institutional, organizational and legal levels across the sub‐region.
59. In 2006 and in order to strengthen the procedures of transport facilitation on the international corridors in Central Africa, CEMAC has signed a financial agreement with the European Union, amounting to 16 million USD for the implementation of the facilitation and transit security program in Central Africa (Fastrac). The program aims to improve the free movement of goods in CEMAC zone and Sao Tome and Principe, in compliance with community rules, the establishment of necessary infrastructure and the elimination of nontariff barriers
60. The intervention strategy of the program focuses on the following four main components:
removal of physical and non physical barriers at borders crossings. The actions include mainly(i) the construction and equipment of stations juxtaposed to the borders of Cameroon with CAR and Chad, and (ii) the interconnection of the Automated System for Customs Data (Sydonia) in the seven states of the region,
Figure 10. Example of a station juxtaposed to Cinkassé, at the border between Burkina Faso and Togo10
Convergence of national policies and implementation of Community legislation in the field of transport. This is to (i) ensure consistency of national policies with the community legislation and (ii) create an observatory of abnormal practices, to develop, evaluate and conduct follow‐up of a number of performance indicators of operation and use of the sub‐region corridors,
10 Source : STUDI International – August 2011 – The station management is ensured by a private (Scanning System, Ivory Coast)
Prefeasibility study of the missing links of Final report Dakar – N’djamena and N’djamena ‐ Djibouti links November 2011
STUDI INTERNATIONAL page 25
improvement of the chain of regional transit, (i) by the operational implementation of the procedure TIPAC11,(ii) capacity building of operators and (iii) the improvement of intermodal interfaces,
Carry out transversal actions, on capacity building of stakeholders and taking into account the gender issue, the issue of HIV / AIDS as well as the elements relating to road safety of carriers and populations bordering the corridors.
61. The creation of juxtaposed stations must be accompanied by a number of actions, some have been recommended by the PIDA study (2011):
Need for harmonization of data recording forms of transit traffic (customs documentation)
prior harmonization of customs procedures, an adequate and appropriate spatial coverage of ICT networks, training and capacity‐building of agents and customs authorities,
In the medium / long term: Creating prepayment and pre‐discharge / pre‐crossing mechanism of transit traffic, in particular by means of appropriate network connections enabling from the outset of the vehicle to notify at the station and in advance the arrival of the vehicle, the type and amount of carried cargo, so as to allow at the time of the vehicle passage by the border crossing a simple quick check of the information previously provided, at the origine of the transit traffic flow
In the medium / long term: development of GPS tracking system for the advanced signaling as the transit traffic approaches the borders and at the same time, the monitoring of potential hazards,
Establishment of analytical tools and risks management:
o The GPS is one of these means, o Establish a database that can be queried / interfaced with the computerized customs
system, providing information on customers who previously committed offences or fraud on the origin of the dubious goods or the value of the goods. The interfacing of the customs system to be placed at the border crossing with the database can alert customs services, ensure the efficiency and speed up procedures for risk management.
62. Despite the significant efforts undertaken under these two programs, some key parameters must be removed as to reduce transportation costs and transit times. These are mainly the following :
reducing waiting times in the warehouses of the sub‐region ports in particular and port transit times in general,
improving contracts organization of maritime and road transport services, consolidation of shippers bargaining power, improving logistics appropriate to transit traffic and reducing the number of control experienced by carriers, especially at import,
application of sanitary and technical packaging standards of products for export.
63. At the bilateral level, several agreements were signed between the landlocked countries (Chad, CAR) and the coastal countries, on the conditions of transport and processing of goods in transit. Cameroon has signed especially with Chad and the CAR, a number of conventions governing the transport of goods in transit, but nonetheless observes a number of constraints, particularly related to the shortcomings of cooperation and coordination between the different national organizations responsible for freight management.
11 Inter‐States Transit of Central Africa countries
Prefeasibility study of the missing links of Final report Dakar – N’djamena and N’djamena ‐ Djibouti links November 2011
STUDI INTERNATIONAL page 26
4.4 Performance of the existing railway lines
4.4.1 Dakar Bamako railway
64. Until September 2003, the railroad Dakar ‐ Bamako, of 1228 km long, was operated by two parastatal companies : The National Company of Railways of Senegal (SNCS), manager of a linear of 644 km and the National Board of Railways of Mali (RCFM) operating on the Malian part (584 km).
65. In October 2003, after a process of international competitiveness, a private operator (CANAC‐GETMA) becomes the dealer and a new company, TRANSRAIL has emerged on the basis of a full concession for 25 years, resuming the activities of Senegal and Mali Railways.
66. The convention focused on (i) the technical and commercial operation of freight and passenger transport services on the conceded rail network, (ii) the maintenance, renewal and development of railway infrastructure and (iii) Land administration of the conceded right‐of‐way. Rail infrastructure, including work done by the dealer, will remain state property in the territory where they operate.
67. Over the five (5) years of the concession (2004‐2009), an investment volume estimated at 31 billion FCFA was expected of which 25 billion FCFA on external funding and 6 billion FCFA on own funds, for tracks’ levelling and purchase of new equipment and rolling stock12.
68. The operation began with a circulation system of unit trains, which had originally brought back rotation (return) of wagons to an average of 7 days. Passenger traffic, on the other hand, is operated under the responsibility of the operators RCFM and PTB SA through conventions of infrastructure use.
69. The overall results of traffic remain, however, mixed over the period 2004‐2006. The transport plan is disadvantaged by the cash position that no longer allows the concessionaire to stock up regularly with supplies and parts, which obliged it, in addition, to postpone its maintenance. This resulted in a decrease in the availability of rolling stock, especially locomotives. The delay in the investment program of infrastructure as well as in the current maintenance programs, have also increased the number of incidents of road, especially derailments.
70. In 2007, negotiations for the revival of the concession have been conducted (in Paris) with the introduction of a new reference operator (Vecturis), the release of an amount of 8 billion FCFA for the relief of the company and Vecturis’ commitment to ensuring a medium‐term credit of 2.5 billion FCFA. Malian and Senegalese States pledged to assist the concessionaire to take actual possession of the railway heritage of the conceded network.
71. Analysis of the results of the last five years shows a relative stability of freight traffic on Dakar‐Bamako international axis. However, the national transport of Senegalese freight with the difficulties of chemical industries of Senegal (ICS) have negatively impacted the business, passing from an annual tonnage shipped by rail track of 133,000 tons in 2004 to 50,000 tons in 2009.
72. Concerning passenger traffic and despite the fact that the concession covers the technical and commercial operation of rail transport service for freight and passenger on the conceded rail network, Transrail has shown since the beginning a reluctance to make passenger transport, wishing to concentrate on freight transportation segment, considered the most profitable.
73. Thus, with the reduction of trains’ number, this has contributed to the worsening of the isolation of several towns and villages in Senegal and Mali and has hurt the image of the concession. The four weekly rotations of international passenger traffic are reduced to two with a lack of consistency and a quality of service needed to be strengthened and consolidated.
74. The measures taken by both countries to boost this segment of traffic are still handicapped by the absence of a genuine desire of Transrail to respect its commitments, despite the fact that all guarantees have been granted by the concession agreement to, in deficit case, claim compensation for public service mission.
12 Source : Etude du plan de développement ferroviaire du Sénégal – 2007 – STUDI International
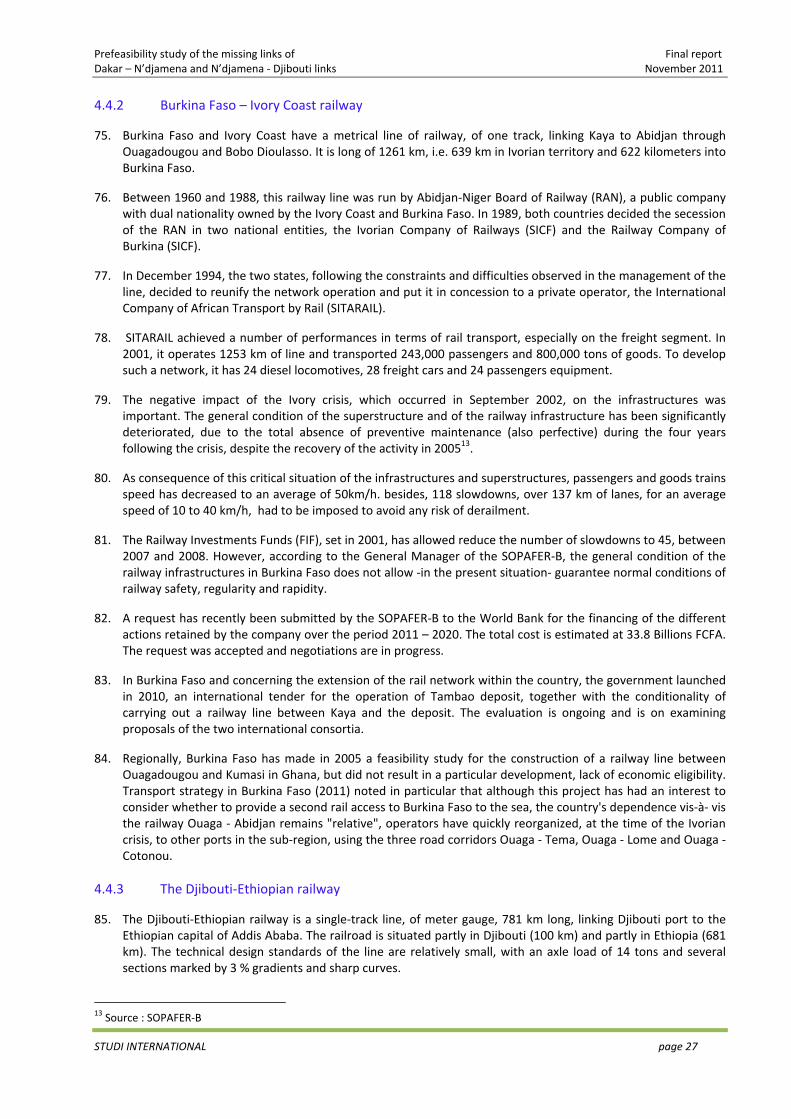
Prefeasibility study of the missing links of Final report Dakar – N’djamena and N’djamena ‐ Djibouti links November 2011
STUDI INTERNATIONAL page 27
4.4.2 Burkina Faso – Ivory Coast railway
75. Burkina Faso and Ivory Coast have a metrical line of railway, of one track, linking Kaya to Abidjan through Ouagadougou and Bobo Dioulasso. It is long of 1261 km, i.e. 639 km in Ivorian territory and 622 kilometers into Burkina Faso.
76. Between 1960 and 1988, this railway line was run by Abidjan‐Niger Board of Railway (RAN), a public company with dual nationality owned by the Ivory Coast and Burkina Faso. In 1989, both countries decided the secession of the RAN in two national entities, the Ivorian Company of Railways (SICF) and the Railway Company of Burkina (SICF).
77. In December 1994, the two states, following the constraints and difficulties observed in the management of the line, decided to reunify the network operation and put it in concession to a private operator, the International Company of African Transport by Rail (SITARAIL).
78. SITARAIL achieved a number of performances in terms of rail transport, especially on the freight segment. In 2001, it operates 1253 km of line and transported 243,000 passengers and 800,000 tons of goods. To develop such a network, it has 24 diesel locomotives, 28 freight cars and 24 passengers equipment.
79. The negative impact of the Ivory crisis, which occurred in September 2002, on the infrastructures was important. The general condition of the superstructure and of the railway infrastructure has been significantly deteriorated, due to the total absence of preventive maintenance (also perfective) during the four years following the crisis, despite the recovery of the activity in 200513.
80. As consequence of this critical situation of the infrastructures and superstructures, passengers and goods trains speed has decreased to an average of 50km/h. besides, 118 slowdowns, over 137 km of lanes, for an average speed of 10 to 40 km/h, had to be imposed to avoid any risk of derailment.
81. The Railway Investments Funds (FIF), set in 2001, has allowed reduce the number of slowdowns to 45, between 2007 and 2008. However, according to the General Manager of the SOPAFER‐B, the general condition of the railway infrastructures in Burkina Faso does not allow ‐in the present situation‐ guarantee normal conditions of railway safety, regularity and rapidity.
82. A request has recently been submitted by the SOPAFER‐B to the World Bank for the financing of the different actions retained by the company over the period 2011 – 2020. The total cost is estimated at 33.8 Billions FCFA. The request was accepted and negotiations are in progress.
83. In Burkina Faso and concerning the extension of the rail network within the country, the government launched in 2010, an international tender for the operation of Tambao deposit, together with the conditionality of carrying out a railway line between Kaya and the deposit. The evaluation is ongoing and is on examining proposals of the two international consortia.
84. Regionally, Burkina Faso has made in 2005 a feasibility study for the construction of a railway line between Ouagadougou and Kumasi in Ghana, but did not result in a particular development, lack of economic eligibility. Transport strategy in Burkina Faso (2011) noted in particular that although this project has had an interest to consider whether to provide a second rail access to Burkina Faso to the sea, the country's dependence vis‐à‐ vis the railway Ouaga ‐ Abidjan remains "relative", operators have quickly reorganized, at the time of the Ivorian crisis, to other ports in the sub‐region, using the three road corridors Ouaga ‐ Tema, Ouaga ‐ Lome and Ouaga ‐ Cotonou.
4.4.3 The Djibouti‐Ethiopian railway
85. The Djibouti‐Ethiopian railway is a single‐track line, of meter gauge, 781 km long, linking Djibouti port to the Ethiopian capital of Addis Ababa. The railroad is situated partly in Djibouti (100 km) and partly in Ethiopia (681 km). The technical design standards of the line are relatively small, with an axle load of 14 tons and several sections marked by 3 % gradients and sharp curves.
13 Source : SOPAFER‐B
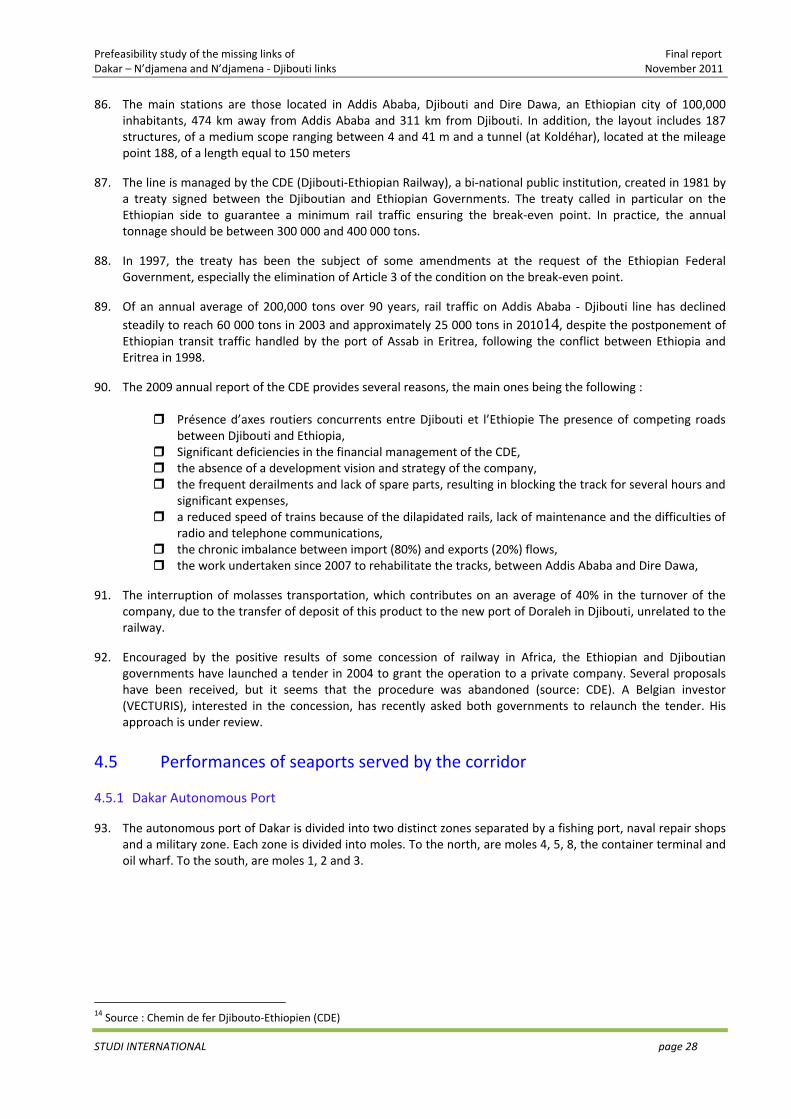
Prefeasibility study of the missing links of Final report Dakar – N’djamena and N’djamena ‐ Djibouti links November 2011
STUDI INTERNATIONAL page 28
86. The main stations are those located in Addis Ababa, Djibouti and Dire Dawa, an Ethiopian city of 100,000 inhabitants, 474 km away from Addis Ababa and 311 km from Djibouti. In addition, the layout includes 187 structures, of a medium scope ranging between 4 and 41 m and a tunnel (at Koldéhar), located at the mileage point 188, of a length equal to 150 meters
87. The line is managed by the CDE (Djibouti‐Ethiopian Railway), a bi‐national public institution, created in 1981 by a treaty signed between the Djiboutian and Ethiopian Governments. The treaty called in particular on the Ethiopian side to guarantee a minimum rail traffic ensuring the break‐even point. In practice, the annual tonnage should be between 300 000 and 400 000 tons.
88. In 1997, the treaty has been the subject of some amendments at the request of the Ethiopian Federal Government, especially the elimination of Article 3 of the condition on the break‐even point.
89. Of an annual average of 200,000 tons over 90 years, rail traffic on Addis Ababa ‐ Djibouti line has declined steadily to reach 60 000 tons in 2003 and approximately 25 000 tons in 201014, despite the postponement of Ethiopian transit traffic handled by the port of Assab in Eritrea, following the conflict between Ethiopia and Eritrea in 1998.
90. The 2009 annual report of the CDE provides several reasons, the main ones being the following :
Présence d’axes routiers concurrents entre Djibouti et l’Ethiopie The presence of competing roads between Djibouti and Ethiopia,
Significant deficiencies in the financial management of the CDE, the absence of a development vision and strategy of the company, the frequent derailments and lack of spare parts, resulting in blocking the track for several hours and significant expenses,
a reduced speed of trains because of the dilapidated rails, lack of maintenance and the difficulties of radio and telephone communications,
the chronic imbalance between import (80%) and exports (20%) flows, the work undertaken since 2007 to rehabilitate the tracks, between Addis Ababa and Dire Dawa,
91. The interruption of molasses transportation, which contributes on an average of 40% in the turnover of the company, due to the transfer of deposit of this product to the new port of Doraleh in Djibouti, unrelated to the railway.
92. Encouraged by the positive results of some concession of railway in Africa, the Ethiopian and Djiboutian governments have launched a tender in 2004 to grant the operation to a private company. Several proposals have been received, but it seems that the procedure was abandoned (source: CDE). A Belgian investor (VECTURIS), interested in the concession, has recently asked both governments to relaunch the tender. His approach is under review.
4.5 Performances of seaports served by the corridor
4.5.1 Dakar Autonomous Port
93. The autonomous port of Dakar is divided into two distinct zones separated by a fishing port, naval repair shops and a military zone. Each zone is divided into moles. To the north, are moles 4, 5, 8, the container terminal and oil wharf. To the south, are moles 1, 2 and 3.
14 Source : Chemin de fer Djibouto‐Ethiopien (CDE)
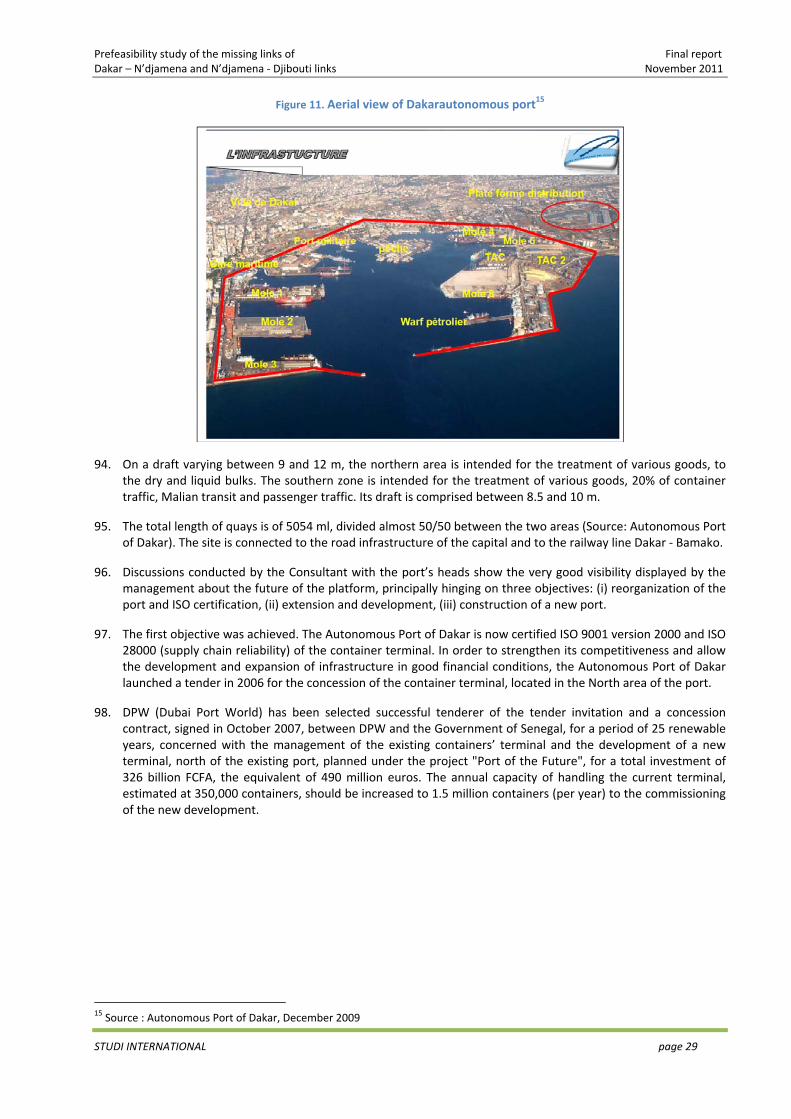
Prefeasibility study of the missing links of Final report Dakar – N’djamena and N’djamena ‐ Djibouti links November 2011
STUDI INTERNATIONAL page 29
Figure 11. Aerial view of Dakarautonomous port15
94. On a draft varying between 9 and 12 m, the northern area is intended for the treatment of various goods, to the dry and liquid bulks. The southern zone is intended for the treatment of various goods, 20% of container traffic, Malian transit and passenger traffic. Its draft is comprised between 8.5 and 10 m.
95. The total length of quays is of 5054 ml, divided almost 50/50 between the two areas (Source: Autonomous Port of Dakar). The site is connected to the road infrastructure of the capital and to the railway line Dakar ‐ Bamako.
96. Discussions conducted by the Consultant with the port’s heads show the very good visibility displayed by the management about the future of the platform, principally hinging on three objectives: (i) reorganization of the port and ISO certification, (ii) extension and development, (iii) construction of a new port.
97. The first objective was achieved. The Autonomous Port of Dakar is now certified ISO 9001 version 2000 and ISO 28000 (supply chain reliability) of the container terminal. In order to strengthen its competitiveness and allow the development and expansion of infrastructure in good financial conditions, the Autonomous Port of Dakar launched a tender in 2006 for the concession of the container terminal, located in the North area of the port.
98. DPW (Dubai Port World) has been selected successful tenderer of the tender invitation and a concession contract, signed in October 2007, between DPW and the Government of Senegal, for a period of 25 renewable years, concerned with the management of the existing containers’ terminal and the development of a new terminal, north of the existing port, planned under the project "Port of the Future", for a total investment of 326 billion FCFA, the equivalent of 490 million euros. The annual capacity of handling the current terminal, estimated at 350,000 containers, should be increased to 1.5 million containers (per year) to the commissioning of the new development.
15 Source : Autonomous Port of Dakar, December 2009
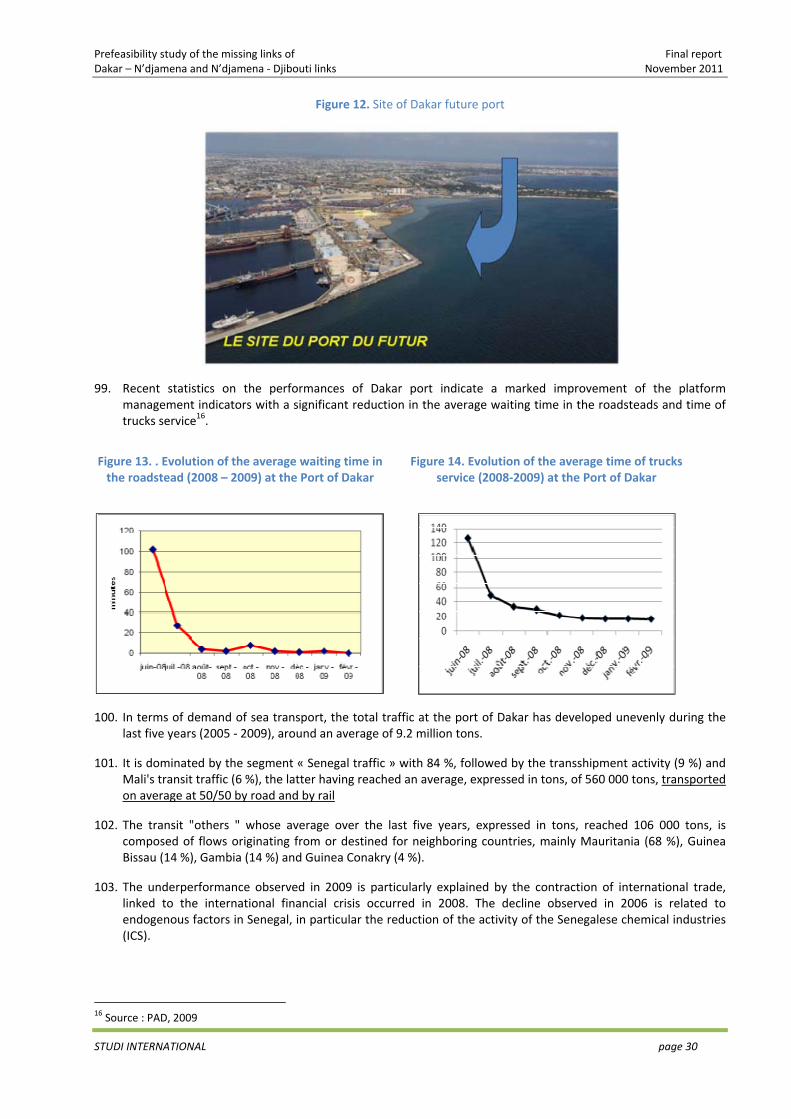
Prefeasibility study of the missing links of Final report Dakar – N’djamena and N’djamena ‐ Djibouti links November 2011
STUDI INTERNATIONAL page 30
Figure 12. Site of Dakar future port
99. Recent statistics on the performances of Dakar port indicate a marked improvement of the platform management indicators with a significant reduction in the average waiting time in the roadsteads and time of trucks service16.
Figure 13. . Evolution of the average waiting time in the roadstead (2008 – 2009) at the Port of Dakar
Figure 14. Evolution of the average time of trucks service (2008‐2009) at the Port of Dakar
100. In terms of demand of sea transport, the total traffic at the port of Dakar has developed unevenly during the last five years (2005 ‐ 2009), around an average of 9.2 million tons.
101. It is dominated by the segment « Senegal traffic » with 84 %, followed by the transshipment activity (9 %) and Mali's transit traffic (6 %), the latter having reached an average, expressed in tons, of 560 000 tons, transported on average at 50/50 by road and by rail
102. The transit "others " whose average over the last five years, expressed in tons, reached 106 000 tons, is composed of flows originating from or destined for neighboring countries, mainly Mauritania (68 %), Guinea Bissau (14 %), Gambia (14 %) and Guinea Conakry (4 %).
103. The underperformance observed in 2009 is particularly explained by the contraction of international trade, linked to the international financial crisis occurred in 2008. The decline observed in 2006 is related to endogenous factors in Senegal, in particular the reduction of the activity of the Senegalese chemical industries (ICS).
16 Source : PAD, 2009
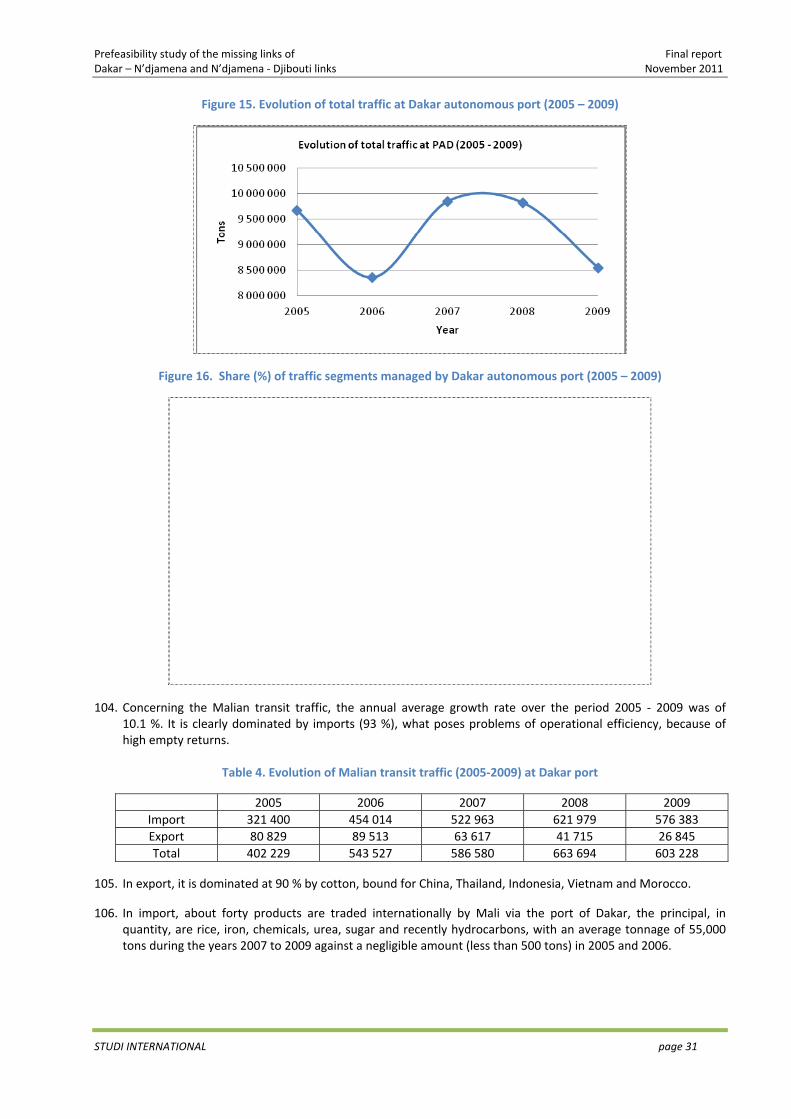
Prefeasibility study of the missing links of Final report Dakar – N’djamena and N’djamena ‐ Djibouti links November 2011
STUDI INTERNATIONAL page 31
Figure 15. Evolution of total traffic at Dakar autonomous port (2005 – 2009)
Figure 16. Share (%) of traffic segments managed by Dakar autonomous port (2005 – 2009)
104. Concerning the Malian transit traffic, the annual average growth rate over the period 2005 ‐ 2009 was of 10.1 %. It is clearly dominated by imports (93 %), what poses problems of operational efficiency, because of high empty returns.
Table 4. Evolution of Malian transit traffic (2005‐2009) at Dakar port
2005 2006 2007 2008 2009Import 321 400 454 014 522 963 621 979 576 383Export 80 829 89 513 63 617 41 715 26 845Total 402 229 543 527 586 580 663 694 603 228
105. In export, it is dominated at 90 % by cotton, bound for China, Thailand, Indonesia, Vietnam and Morocco.
106. In import, about forty products are traded internationally by Mali via the port of Dakar, the principal, in quantity, are rice, iron, chemicals, urea, sugar and recently hydrocarbons, with an average tonnage of 55,000 tons during the years 2007 to 2009 against a negligible amount (less than 500 tons) in 2005 and 2006.
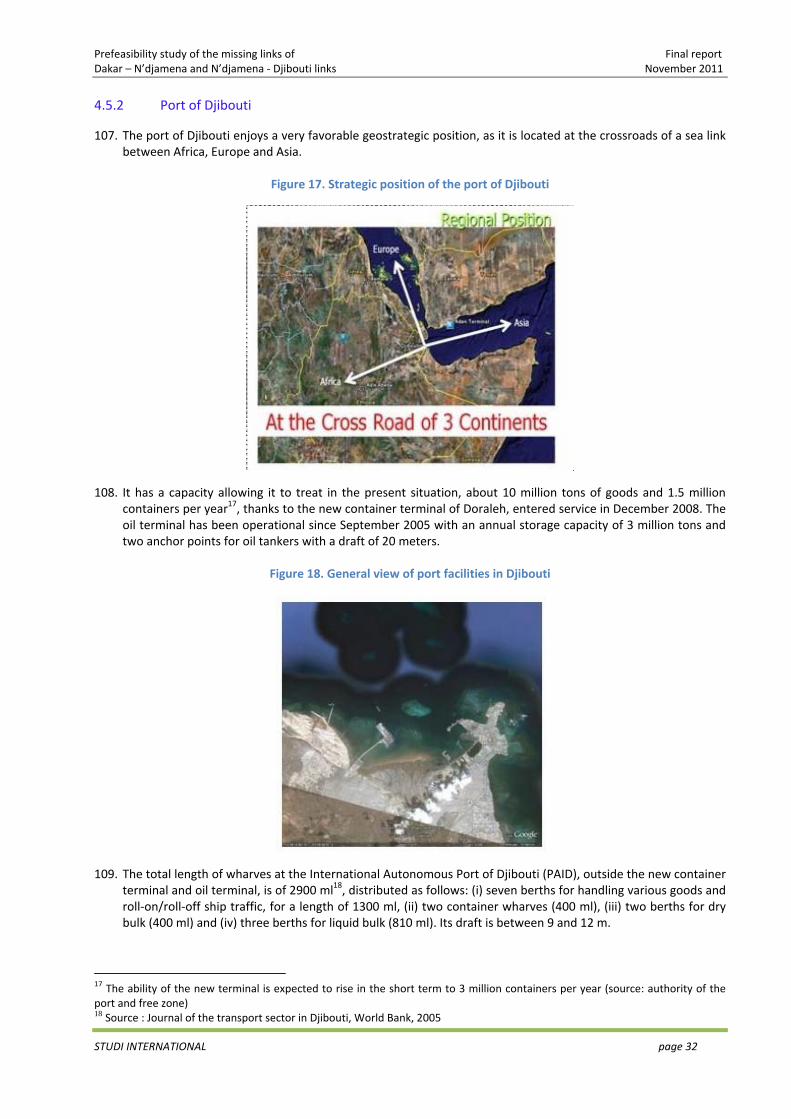
Prefeasibility study of the missing links of Final report Dakar – N’djamena and N’djamena ‐ Djibouti links November 2011
STUDI INTERNATIONAL page 32
4.5.2 Port of Djibouti
107. The port of Djibouti enjoys a very favorable geostrategic position, as it is located at the crossroads of a sea link between Africa, Europe and Asia.
Figure 17. Strategic position of the port of Djibouti
108. It has a capacity allowing it to treat in the present situation, about 10 million tons of goods and 1.5 million containers per year17, thanks to the new container terminal of Doraleh, entered service in December 2008. The oil terminal has been operational since September 2005 with an annual storage capacity of 3 million tons and two anchor points for oil tankers with a draft of 20 meters.
Figure 18. General view of port facilities in Djibouti
109. The total length of wharves at the International Autonomous Port of Djibouti (PAID), outside the new container terminal and oil terminal, is of 2900 ml18, distributed as follows: (i) seven berths for handling various goods and roll‐on/roll‐off ship traffic, for a length of 1300 ml, (ii) two container wharves (400 ml), (iii) two berths for dry bulk (400 ml) and (iv) three berths for liquid bulk (810 ml). Its draft is between 9 and 12 m.
17 The ability of the new terminal is expected to rise in the short term to 3 million containers per year (source: authority of the port and free zone) 18 Source : Journal of the transport sector in Djibouti, World Bank, 2005
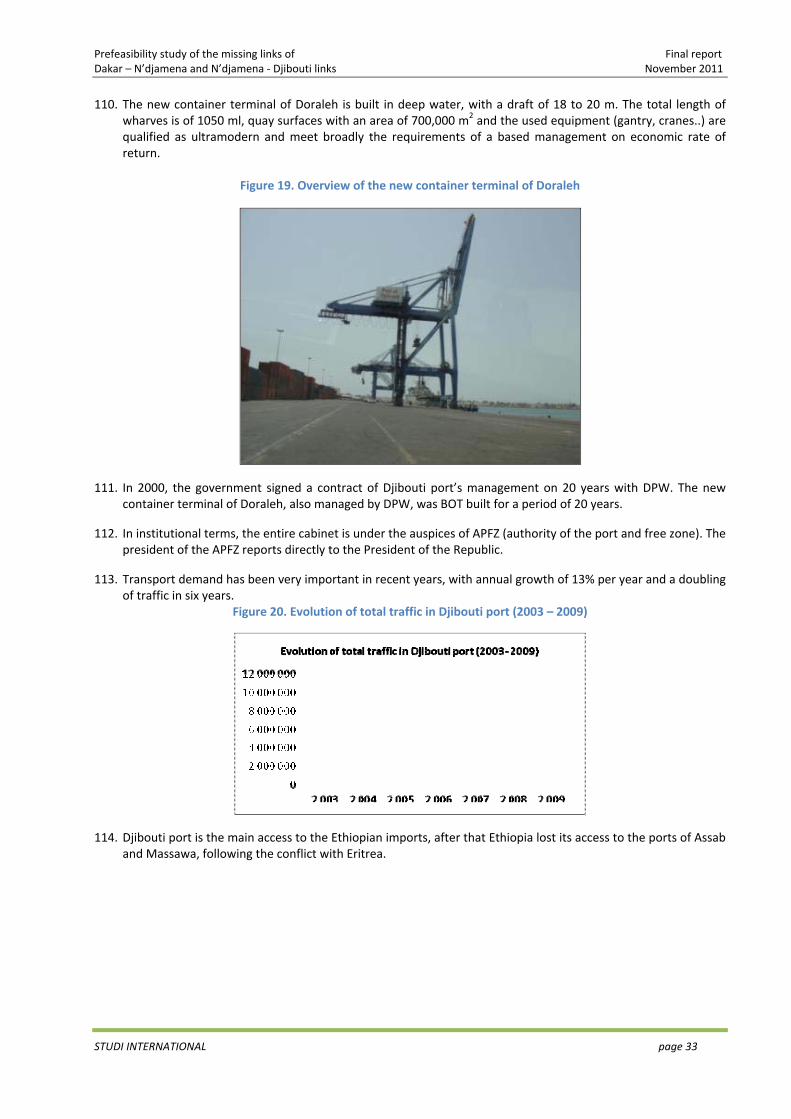
Prefeasibility study of the missing links of Final report Dakar – N’djamena and N’djamena ‐ Djibouti links November 2011
STUDI INTERNATIONAL page 33
110. The new container terminal of Doraleh is built in deep water, with a draft of 18 to 20 m. The total length of wharves is of 1050 ml, quay surfaces with an area of 700,000 m2 and the used equipment (gantry, cranes..) are qualified as ultramodern and meet broadly the requirements of a based management on economic rate of return.
Figure 19. Overview of the new container terminal of Doraleh
111. In 2000, the government signed a contract of Djibouti port’s management on 20 years with DPW. The new container terminal of Doraleh, also managed by DPW, was BOT built for a period of 20 years.
112. In institutional terms, the entire cabinet is under the auspices of APFZ (authority of the port and free zone). The president of the APFZ reports directly to the President of the Republic.
113. Transport demand has been very important in recent years, with annual growth of 13% per year and a doubling of traffic in six years.
Figure 20. Evolution of total traffic in Djibouti port (2003 – 2009)
114. Djibouti port is the main access to the Ethiopian imports, after that Ethiopia lost its access to the ports of Assab and Massawa, following the conflict with Eritrea.
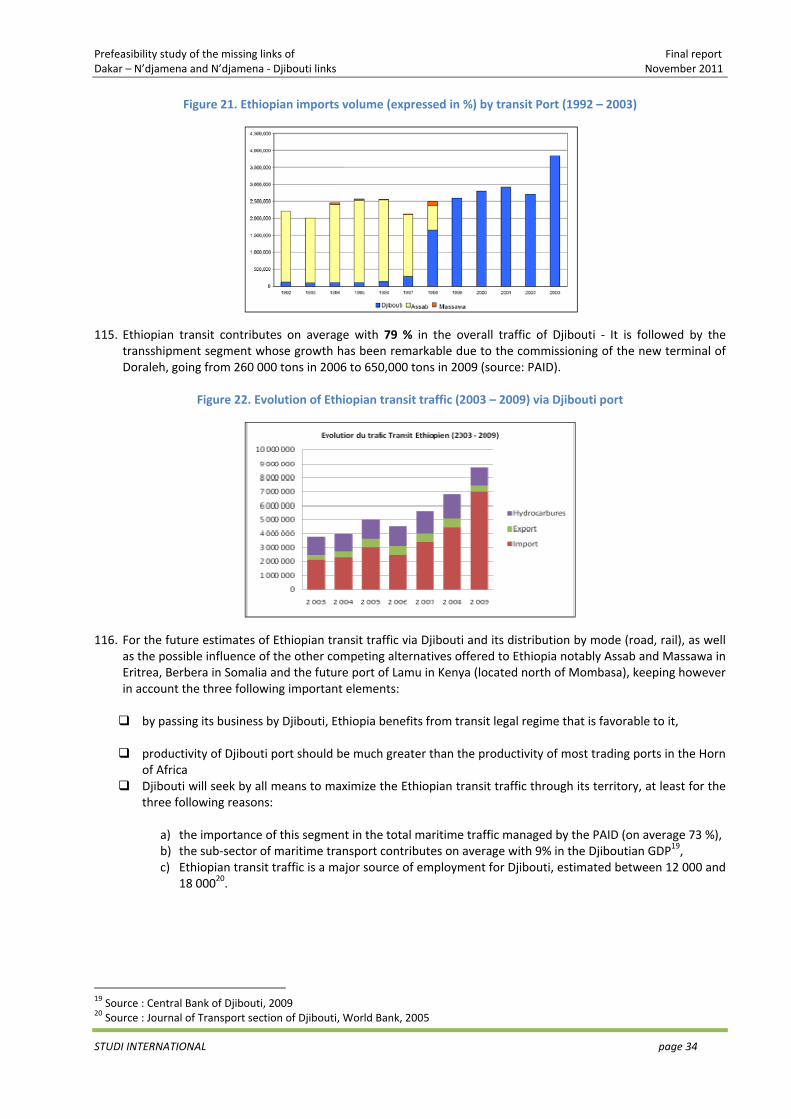
Prefeasibility study of the missing links of Final report Dakar – N’djamena and N’djamena ‐ Djibouti links November 2011
STUDI INTERNATIONAL page 34
Figure 21. Ethiopian imports volume (expressed in %) by transit Port (1992 – 2003)
115. Ethiopian transit contributes on average with 79 % in the overall traffic of Djibouti ‐ It is followed by the transshipment segment whose growth has been remarkable due to the commissioning of the new terminal of Doraleh, going from 260 000 tons in 2006 to 650,000 tons in 2009 (source: PAID).
Figure 22. Evolution of Ethiopian transit traffic (2003 – 2009) via Djibouti port
116. For the future estimates of Ethiopian transit traffic via Djibouti and its distribution by mode (road, rail), as well as the possible influence of the other competing alternatives offered to Ethiopia notably Assab and Massawa in Eritrea, Berbera in Somalia and the future port of Lamu in Kenya (located north of Mombasa), keeping however in account the three following important elements:
by passing its business by Djibouti, Ethiopia benefits from transit legal regime that is favorable to it,
productivity of Djibouti port should be much greater than the productivity of most trading ports in the Horn of Africa
Djibouti will seek by all means to maximize the Ethiopian transit traffic through its territory, at least for the three following reasons:
a) the importance of this segment in the total maritime traffic managed by the PAID (on average 73 %), b) the sub‐sector of maritime transport contributes on average with 9% in the Djiboutian GDP19, c) Ethiopian transit traffic is a major source of employment for Djibouti, estimated between 12 000 and
18 00020.
19 Source : Central Bank of Djibouti, 2009 20 Source : Journal of Transport section of Djibouti, World Bank, 2005
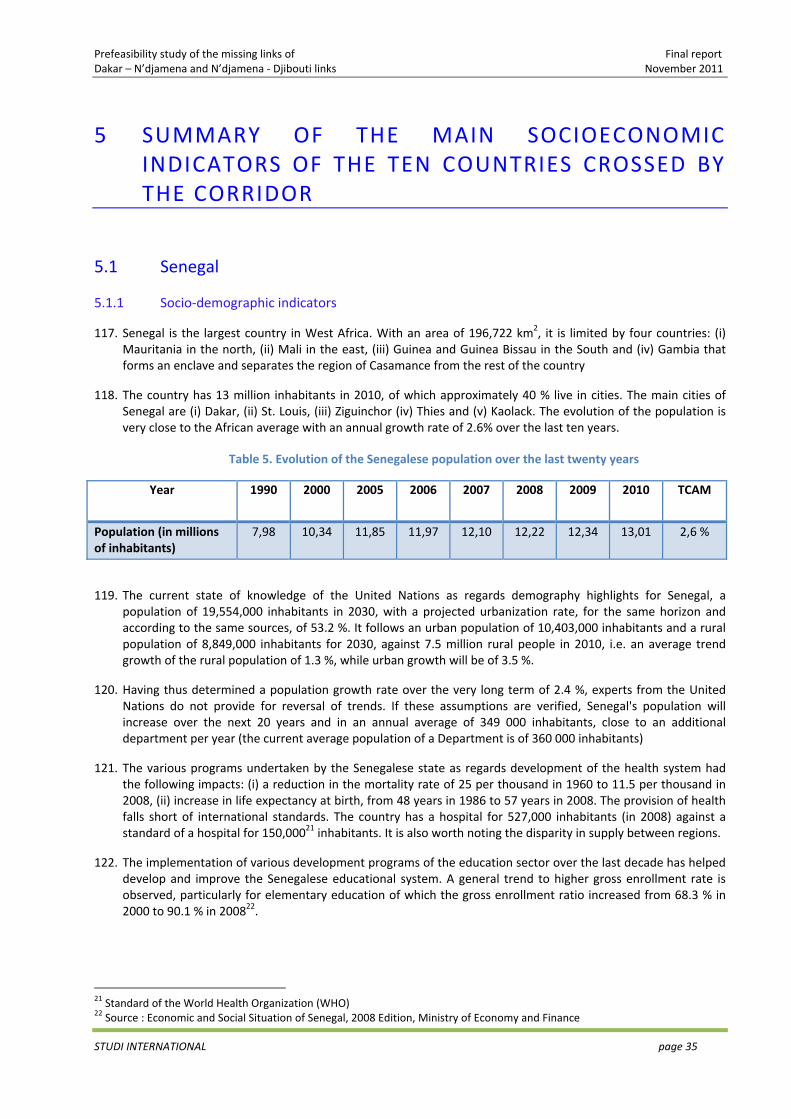
Prefeasibility study of the missing links of Final report Dakar – N’djamena and N’djamena ‐ Djibouti links November 2011
STUDI INTERNATIONAL page 35
5 SUMMARY OF THE MAIN SOCIOECONOMIC INDICATORS OF THE TEN COUNTRIES CROSSED BY THE CORRIDOR
5.1 Senegal
5.1.1 Socio‐demographic indicators
117. Senegal is the largest country in West Africa. With an area of 196,722 km2, it is limited by four countries: (i) Mauritania in the north, (ii) Mali in the east, (iii) Guinea and Guinea Bissau in the South and (iv) Gambia that forms an enclave and separates the region of Casamance from the rest of the country
118. The country has 13 million inhabitants in 2010, of which approximately 40 % live in cities. The main cities of Senegal are (i) Dakar, (ii) St. Louis, (iii) Ziguinchor (iv) Thies and (v) Kaolack. The evolution of the population is very close to the African average with an annual growth rate of 2.6% over the last ten years.
Table 5. Evolution of the Senegalese population over the last twenty years
Year 1990 2000 2005 2006 2007 2008 2009 2010 TCAM
Population (in millions of inhabitants)
7,98 10,34 11,85 11,97 12,10 12,22 12,34 13,01 2,6 %
119. The current state of knowledge of the United Nations as regards demography highlights for Senegal, a population of 19,554,000 inhabitants in 2030, with a projected urbanization rate, for the same horizon and according to the same sources, of 53.2 %. It follows an urban population of 10,403,000 inhabitants and a rural population of 8,849,000 inhabitants for 2030, against 7.5 million rural people in 2010, i.e. an average trend growth of the rural population of 1.3 %, while urban growth will be of 3.5 %.
120. Having thus determined a population growth rate over the very long term of 2.4 %, experts from the United Nations do not provide for reversal of trends. If these assumptions are verified, Senegal's population will increase over the next 20 years and in an annual average of 349 000 inhabitants, close to an additional department per year (the current average population of a Department is of 360 000 inhabitants)
121. The various programs undertaken by the Senegalese state as regards development of the health system had the following impacts: (i) a reduction in the mortality rate of 25 per thousand in 1960 to 11.5 per thousand in 2008, (ii) increase in life expectancy at birth, from 48 years in 1986 to 57 years in 2008. The provision of health falls short of international standards. The country has a hospital for 527,000 inhabitants (in 2008) against a standard of a hospital for 150,00021 inhabitants. It is also worth noting the disparity in supply between regions.
122. The implementation of various development programs of the education sector over the last decade has helped develop and improve the Senegalese educational system. A general trend to higher gross enrollment rate is observed, particularly for elementary education of which the gross enrollment ratio increased from 68.3 % in 2000 to 90.1 % in 200822.
21 Standard of the World Health Organization (WHO) 22 Source : Economic and Social Situation of Senegal, 2008 Edition, Ministry of Economy and Finance
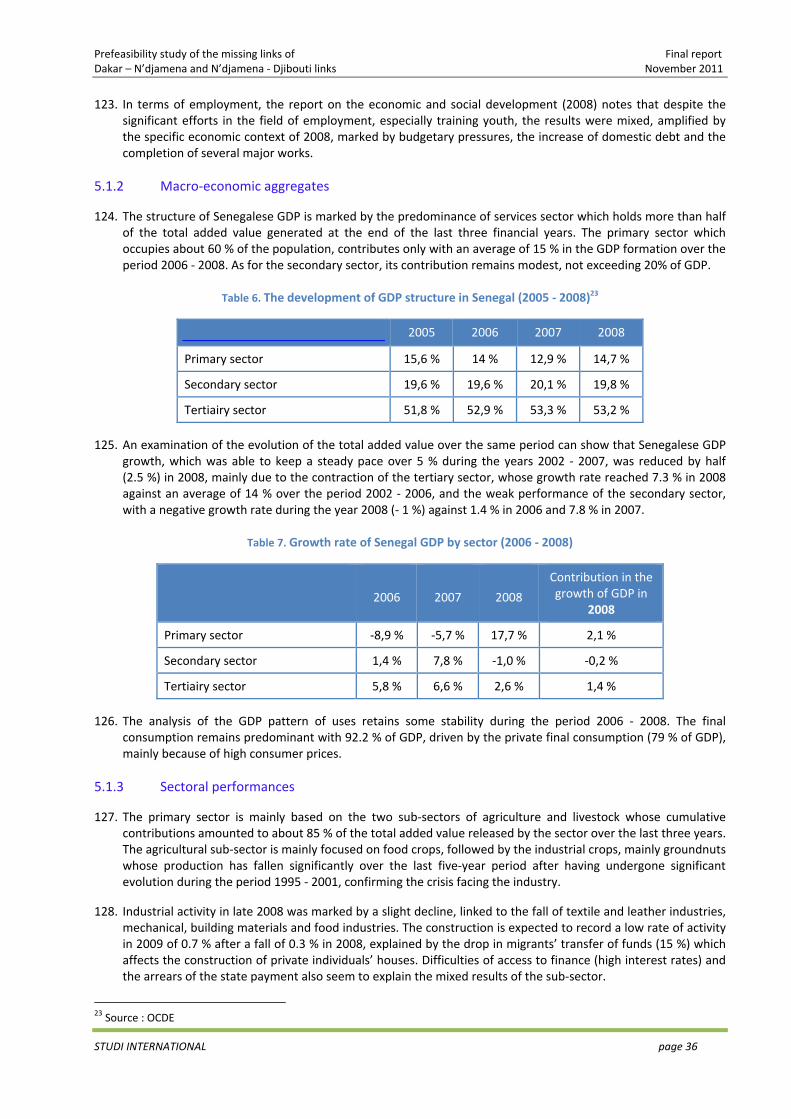
Prefeasibility study of the missing links of Final report Dakar – N’djamena and N’djamena ‐ Djibouti links November 2011
STUDI INTERNATIONAL page 36
123. In terms of employment, the report on the economic and social development (2008) notes that despite the significant efforts in the field of employment, especially training youth, the results were mixed, amplified by the specific economic context of 2008, marked by budgetary pressures, the increase of domestic debt and the completion of several major works.
5.1.2 Macro‐economic aggregates
124. The structure of Senegalese GDP is marked by the predominance of services sector which holds more than half of the total added value generated at the end of the last three financial years. The primary sector which occupies about 60 % of the population, contributes only with an average of 15 % in the GDP formation over the period 2006 ‐ 2008. As for the secondary sector, its contribution remains modest, not exceeding 20% of GDP.
Table 6. The development of GDP structure in Senegal (2005 ‐ 2008)23
2005 2006 2007 2008
Primary sector 15,6 % 14 % 12,9 % 14,7 %
Secondary sector 19,6 % 19,6 % 20,1 % 19,8 %
Tertiairy sector 51,8 % 52,9 % 53,3 % 53,2 %
125. An examination of the evolution of the total added value over the same period can show that Senegalese GDP growth, which was able to keep a steady pace over 5 % during the years 2002 ‐ 2007, was reduced by half (2.5 %) in 2008, mainly due to the contraction of the tertiary sector, whose growth rate reached 7.3 % in 2008 against an average of 14 % over the period 2002 ‐ 2006, and the weak performance of the secondary sector, with a negative growth rate during the year 2008 (‐ 1 %) against 1.4 % in 2006 and 7.8 % in 2007.
Table 7. Growth rate of Senegal GDP by sector (2006 ‐ 2008)
2006
2007
2008
Contribution in the growth of GDP in
2008
Primary sector ‐8,9 % ‐5,7 % 17,7 % 2,1 %
Secondary sector 1,4 % 7,8 % ‐1,0 % ‐0,2 %
Tertiairy sector 5,8 % 6,6 % 2,6 % 1,4 %
126. The analysis of the GDP pattern of uses retains some stability during the period 2006 ‐ 2008. The final consumption remains predominant with 92.2 % of GDP, driven by the private final consumption (79 % of GDP), mainly because of high consumer prices.
5.1.3 Sectoral performances
127. The primary sector is mainly based on the two sub‐sectors of agriculture and livestock whose cumulative contributions amounted to about 85 % of the total added value released by the sector over the last three years. The agricultural sub‐sector is mainly focused on food crops, followed by the industrial crops, mainly groundnuts whose production has fallen significantly over the last five‐year period after having undergone significant evolution during the period 1995 ‐ 2001, confirming the crisis facing the industry.
128. Industrial activity in late 2008 was marked by a slight decline, linked to the fall of textile and leather industries, mechanical, building materials and food industries. The construction is expected to record a low rate of activity in 2009 of 0.7 % after a fall of 0.3 % in 2008, explained by the drop in migrants’ transfer of funds (15 %) which affects the construction of private individuals’ houses. Difficulties of access to finance (high interest rates) and the arrears of the state payment also seem to explain the mixed results of the sub‐sector.
23 Source : OCDE
Prefeasibility study of the missing links of Final report Dakar – N’djamena and N’djamena ‐ Djibouti links November 2011
STUDI INTERNATIONAL page 37
129. The tertiary sector remains the predominant sector of the Senegalese economy in terms of contribution to the total added value. The two components that dominate the sector are trade and transport / communications, which account for about half in the sector's formation and about one third in the GDP formation. The sub‐sector of transport and communications grew at a rapid pace in the recent years, with the exception of 2008 for transportation (‐4.4 %), affected by the rise in fuel prices and a low growth rate of the economic activity that had a negative impact on transport demand for goods.
5.1.4 Foreign trade
130. Imports from Senegal continue at a faster pace than exports, the coverage rate being at on average of 38 %24 over the period 2004 ‐ 2008.
Figure 23. Evolution of Senegalese foreign trade (in Millions FCFA)
131. The fish products, petroleum products and phosphoric acid are the main exports of the country, with on average 55 % of the total national exports value.
132. The African market is the main Senegalese export destination with approximately 45 % of the total value of exports and consists mainly of the West African countries, especially Mali25, Gambia, Guinea Conakry, Guinea Bissau and the Ivory Coast. The European market is the second Senegalese export destination, with an average of 30 % over the last five years.
24 Economic and Social Situation of Senegal, 2008 edition 25 The transit traffic of Mali via Senegal is recorded as an export transation by the service of Senegal statistics
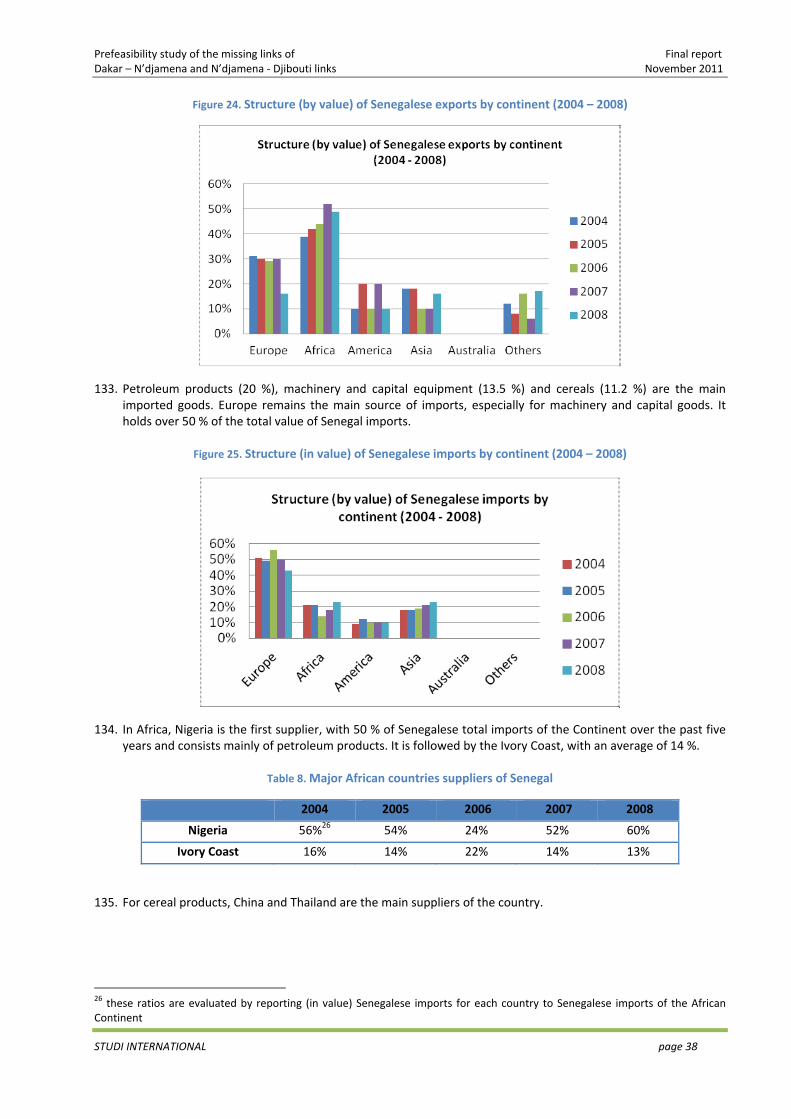
Prefeasibility study of the missing links of Final report Dakar – N’djamena and N’djamena ‐ Djibouti links November 2011
STUDI INTERNATIONAL page 38
Figure 24. Structure (by value) of Senegalese exports by continent (2004 – 2008)
133. Petroleum products (20 %), machinery and capital equipment (13.5 %) and cereals (11.2 %) are the main imported goods. Europe remains the main source of imports, especially for machinery and capital goods. It holds over 50 % of the total value of Senegal imports.
Figure 25. Structure (in value) of Senegalese imports by continent (2004 – 2008)
134. In Africa, Nigeria is the first supplier, with 50 % of Senegalese total imports of the Continent over the past five years and consists mainly of petroleum products. It is followed by the Ivory Coast, with an average of 14 %.
Table 8. Major African countries suppliers of Senegal
2004 2005 2006 2007 2008
Nigeria 56%26 54% 24% 52% 60%
Ivory Coast 16% 14% 22% 14% 13%
135. For cereal products, China and Thailand are the main suppliers of the country.
26 these ratios are evaluated by reporting (in value) Senegalese imports for each country to Senegalese imports of the African Continent
Prefeasibility study of the missing links of Final report Dakar – N’djamena and N’djamena ‐ Djibouti links November 2011
STUDI INTERNATIONAL page 39
5.1.5 Development prospects
136. Since 2000, significant structural reforms have changed the economic landscape of the country. Many public companies were privatized, both in the agricultural sector (Sonacos for peanuts and Sodefitex for cotton) and in infrastructure (water, rail transport and especially telecommunications).
137. In order to create a business friendly environment, a single window has been established since 2000. A new investment code, introduced in 2004, also allowed customs and tax exemptions in a number of sectors.
138. In 2005, the government has developed the Accelerated Growth Strategy (SCA), implemented in 2007 with the aim of achieving a sustained growth of 7 to 8 %. 5 « clusters » with high potential have been identified around which it comes to building real competitive clusters in the areas of (i) agriculture and agro‐industry, (ii) ICT, (iii) tourism and derivatives, (iv) textiles and clothing, cultural arts and crafts industry and (v) marine products.
5.2 Mali
5.2.1 Socio‐demographic Indicators
139. The Malian population is estimated at about 14.5 million in 2009. It is characterized by a strong growth rate (2.46 % between 1976 and 2009), i.e. an increase of 127 % over the past twenty three years27.
140. According to forecasts of the National Institute of Statistics and Demography, the total population should reach a workforce of 23.8 million in 2030, i.e. a rate of long‐term growth of 2.4 %. This rate is particularly high due to high fertility, the total fertility rate is estimated at the last census to 6.77 children per woman
141. The high birth rate has resulted in a very large youth population of Mali. Children under 15 account for no less than 49 % of the total population.
142. Despite a policy involving the private sector and significant involvement of NGOs, the Malian education system, however, is faced with certain constraints, in particular (i) delay in the enrollment of girls and (ii) lack of resources (infrastructure, textbooks , staff) particularly due to budgetary constraints.
143. Concerning the income poverty, estimated by the method of cost of basic needs, dropped 8 percentage points from 55.6 % in 2001 to 47.4 % in 2006, with significant regional disparities and increased poverty in urban environment, due to rural exodus and underemployment.
5.2.2 Macro‐economic aggregates
144. The growth of Malian real GDP has been averaging 5 % over the period 2002‐2009 against 4.3 % during the period 1985 ‐ 2002 with a substantial acceleration after the devaluation of the CFA francs in 1994. All key economic activities in Mali and in particular export‐oriented ones, have contributed to accelerating the pace of growth.
145. The evolution of Mali’s economic indicators is strongly linked to climatic changes and international prices of raw materials (notably cotton), especially due to the high weight of the primary sector (39.8 % of GDP in 2008), which occupies nearly 80 % of the population.
146. Concerning the government finance, the basic fiscal deficit was reduced to 1.5 % of GDP in 2009 against a deficit of 2.6 % in 2008. At the same time total revenues rose to 14.4 % of GDP due to better monitoring of fund raising and the involved structures. The current account balance recorded a slight improvement compared to 2008, due to the reduction of the deficit of trade balance, due mainly to higher exports of gold, which offset the decline in cotton exports.
147. Regarding investment, if public investment has been affected by the credit freeze, a corollary to the decline in revenue (itself due to the decline in external demand), private investments have been supported on the other hand by the housing programs and foreign direct investment (FDI), privatization proceeds.
27 Source : National Institute of statistics and demography
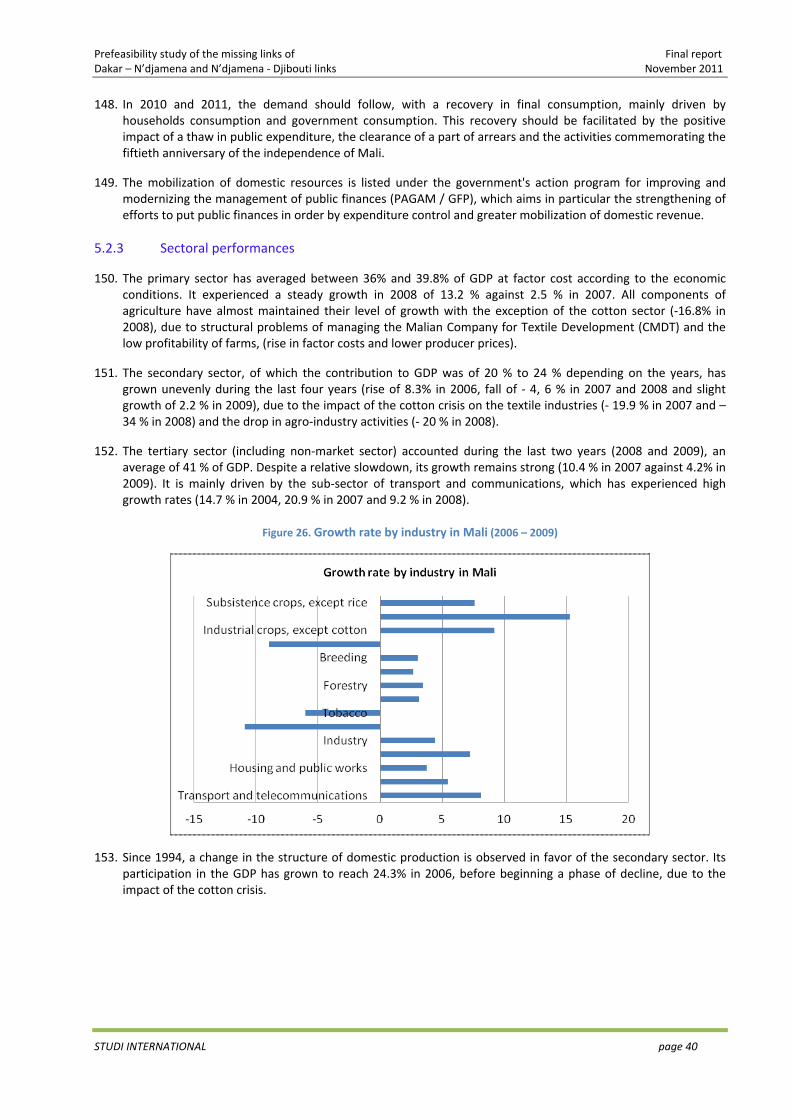
Prefeasibility study of the missing links of Final report Dakar – N’djamena and N’djamena ‐ Djibouti links November 2011
STUDI INTERNATIONAL page 40
148. In 2010 and 2011, the demand should follow, with a recovery in final consumption, mainly driven by households consumption and government consumption. This recovery should be facilitated by the positive impact of a thaw in public expenditure, the clearance of a part of arrears and the activities commemorating the fiftieth anniversary of the independence of Mali.
149. The mobilization of domestic resources is listed under the government's action program for improving and modernizing the management of public finances (PAGAM / GFP), which aims in particular the strengthening of efforts to put public finances in order by expenditure control and greater mobilization of domestic revenue.
5.2.3 Sectoral performances
150. The primary sector has averaged between 36% and 39.8% of GDP at factor cost according to the economic conditions. It experienced a steady growth in 2008 of 13.2 % against 2.5 % in 2007. All components of agriculture have almost maintained their level of growth with the exception of the cotton sector (‐16.8% in 2008), due to structural problems of managing the Malian Company for Textile Development (CMDT) and the low profitability of farms, (rise in factor costs and lower producer prices).
151. The secondary sector, of which the contribution to GDP was of 20 % to 24 % depending on the years, has grown unevenly during the last four years (rise of 8.3% in 2006, fall of ‐ 4, 6 % in 2007 and 2008 and slight growth of 2.2 % in 2009), due to the impact of the cotton crisis on the textile industries (‐ 19.9 % in 2007 and – 34 % in 2008) and the drop in agro‐industry activities (‐ 20 % in 2008).
152. The tertiary sector (including non‐market sector) accounted during the last two years (2008 and 2009), an average of 41 % of GDP. Despite a relative slowdown, its growth remains strong (10.4 % in 2007 against 4.2% in 2009). It is mainly driven by the sub‐sector of transport and communications, which has experienced high growth rates (14.7 % in 2004, 20.9 % in 2007 and 9.2 % in 2008).
Figure 26. Growth rate by industry in Mali (2006 – 2009)
153. Since 1994, a change in the structure of domestic production is observed in favor of the secondary sector. Its participation in the GDP has grown to reach 24.3% in 2006, before beginning a phase of decline, due to the impact of the cotton crisis.
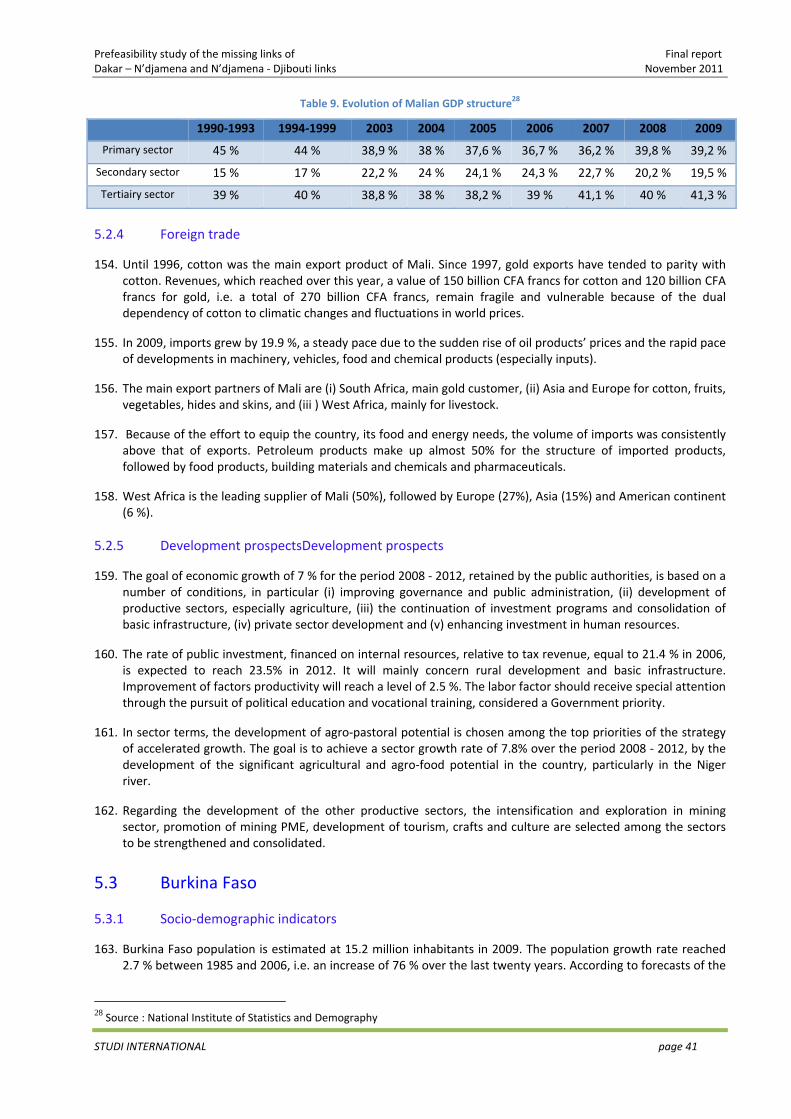
Prefeasibility study of the missing links of Final report Dakar – N’djamena and N’djamena ‐ Djibouti links November 2011
STUDI INTERNATIONAL page 41
Table 9. Evolution of Malian GDP structure28
1990‐1993 1994‐1999 2003 2004 2005 2006 2007 2008 2009
Primary sector 45 % 44 % 38,9 % 38 % 37,6 % 36,7 % 36,2 % 39,8 % 39,2 %
Secondary sector 15 % 17 % 22,2 % 24 % 24,1 % 24,3 % 22,7 % 20,2 % 19,5 %
Tertiairy sector 39 % 40 % 38,8 % 38 % 38,2 % 39 % 41,1 % 40 % 41,3 %
5.2.4 Foreign trade
154. Until 1996, cotton was the main export product of Mali. Since 1997, gold exports have tended to parity with cotton. Revenues, which reached over this year, a value of 150 billion CFA francs for cotton and 120 billion CFA francs for gold, i.e. a total of 270 billion CFA francs, remain fragile and vulnerable because of the dual dependency of cotton to climatic changes and fluctuations in world prices.
155. In 2009, imports grew by 19.9 %, a steady pace due to the sudden rise of oil products’ prices and the rapid pace of developments in machinery, vehicles, food and chemical products (especially inputs).
156. The main export partners of Mali are (i) South Africa, main gold customer, (ii) Asia and Europe for cotton, fruits, vegetables, hides and skins, and (iii ) West Africa, mainly for livestock.
157. Because of the effort to equip the country, its food and energy needs, the volume of imports was consistently above that of exports. Petroleum products make up almost 50% for the structure of imported products, followed by food products, building materials and chemicals and pharmaceuticals.
158. West Africa is the leading supplier of Mali (50%), followed by Europe (27%), Asia (15%) and American continent (6 %).
5.2.5 Development prospectsDevelopment prospects
159. The goal of economic growth of 7 % for the period 2008 ‐ 2012, retained by the public authorities, is based on a number of conditions, in particular (i) improving governance and public administration, (ii) development of productive sectors, especially agriculture, (iii) the continuation of investment programs and consolidation of basic infrastructure, (iv) private sector development and (v) enhancing investment in human resources.
160. The rate of public investment, financed on internal resources, relative to tax revenue, equal to 21.4 % in 2006, is expected to reach 23.5% in 2012. It will mainly concern rural development and basic infrastructure. Improvement of factors productivity will reach a level of 2.5 %. The labor factor should receive special attention through the pursuit of political education and vocational training, considered a Government priority.
161. In sector terms, the development of agro‐pastoral potential is chosen among the top priorities of the strategy of accelerated growth. The goal is to achieve a sector growth rate of 7.8% over the period 2008 ‐ 2012, by the development of the significant agricultural and agro‐food potential in the country, particularly in the Niger river.
162. Regarding the development of the other productive sectors, the intensification and exploration in mining sector, promotion of mining PME, development of tourism, crafts and culture are selected among the sectors to be strengthened and consolidated.
5.3 Burkina Faso
5.3.1 Socio‐demographic indicators
163. Burkina Faso population is estimated at 15.2 million inhabitants in 2009. The population growth rate reached 2.7 % between 1985 and 2006, i.e. an increase of 76 % over the last twenty years. According to forecasts of the
28 Source : National Institute of Statistics and Demography
Prefeasibility study of the missing links of Final report Dakar – N’djamena and N’djamena ‐ Djibouti links November 2011
STUDI INTERNATIONAL page 42
National Institute of Statistics and Demography, the total population should reach a capacity of 21.5 million in 2020, i.e. a rate of long‐term growth of 2.9 %29.
164. The high birth rate has resulted in a very large young population, children under 15 years representing in 2006, 46.6 % of the total population should be maintained until 2020. The fertility rate is in an average of 6.1 and the mortality level is considered strong, with an infant mortality rate of 91.7 per thousand births and a life expectancy of 56.7 years.
165. Estimated in 2006 to 51.4 inhabitants per km2, close to the world average (47 inhabitants per km2), the density of the population of Burkina Faso has been a fairly strong regional inequality, with only 28 inhabitants per km2 on average in regions of the East, the Sahel, the Cascades and the South West against an average of 60 inhabitants per km2 in the other parts of the country and a peak of 616 inhabitants per km2 in the Centre, the region where is located the capital Ouagadougou.
166. The literacy rate has reached an average of 28.7 % in 2007, unevenly distributed between both sexes (36.7 % for male and 21.6 % for females). It is considered one of the lowest in the African continent. The report on education (INSD, 2009)30 noted that the school system in Burkina Faso is characterized by the dominance of the primary education with nearly three quarters of students and that as the education system progresses, the numbers are declining significantly, reflecting the selective nature of the system.
167. In terms of health and despite the overall improvement of the populations’ health status over the past decade, the health system of Burkina Faso has called to be more consolidated in terms of quantity and quality, increase funding requirements and meet the growing needs of the population, particularly the most disadvantaged.
5.3.2 Macro‐economic aggregates
168. GDP per capita in 2007 was of 430 U.S. dollars, showing an insufficient level of cash income, resulted in the finding that 46.4 % of the country’s population lives below the absolute poverty line against 44.5 % in 1994 despite a growth rate of GDP of around 5.3 % on average over the period31.
169. Burkina Faso's economy is heavily dependent on agriculture and livestock, which represented 35 % of GDP in 2007 and more than half (65 %) of export proceeds. The secondary sector accounted for 23 % of GDP (in 2007) and consists mainly of processing industries of primary products, agri‐food industries, and textiles. Some manufacturing units of manufactured products destined for the internal market are dynamic in the sector, but for which the cost of intermediate consumption penalizes highly their competitiveness.
170. The trade balance of Burkina Faso is structurally poor with otherwise a low export diversification and broad diversification of imports. Exports consist mainly of raw materials (cotton, tobacco, vegetables and fruits, gold) while imports are semi‐finished or finished products.
171. The share of exports, boiled down to GDP, is low (8 % on average over the last ten years), mainly concentrated on five products, four of which are agricultural: cotton (63 %), grains and oilseed products (12 %), raw and manufactured tobacco (2 %), vegetables and fruits (2 %) and gold (2 %).
172. The landlocked situation of the country leads to high costs of goods transport, hurting the competitiveness of the economy as a whole. Transit costs represent on average 25 % of exports share to Burkina Faso, against an average of 19 % for landlocked countries and 18% for developing countries32.
173. The General Report (2007) of the 2025 national prospective study highlights the inadequacy of domestic savings and the absorption of part of the private savings by the general government, which in combination with a limited effectiveness of capital, constituted an important constraint to the improvement of the economic growth. Furthermore, the low level of productive investments, with low productivity, has not allowed the enhancement and consolidation of economic performance indicators.
29 Source : Demographic projections of population from 2007 to 2020 INSD 30 Source : Theme 4 : Education, literacy, school attendance. INSD ‐ 2009 31 Source : INSD, 2009 32 Source : Updating the Sectoral Strategy of Transport in Burkina Faso – STUDI Group– 2011
Prefeasibility study of the missing links of Final report Dakar – N’djamena and N’djamena ‐ Djibouti links November 2011
STUDI INTERNATIONAL page 43
174. It should be noted also that Burkina Faso's economy is heavily dependent on external aid that intervenes on average with about 80% of the funding needs of public investments33.
5.3.3 Sectoral performances
175. Agricultural sector is dominated by subsistence agriculture and a few products for export Crops occupy about 80 % of the total cultivated areas and are composed mainly of millet, sorghum, maize, rice and fonio. They are run by small farms of 3 to 6 ha on average, which are facing constraints some of which are structural, notably (i) the insufficient and erratic rainfall, (ii) the declining of soils fertility, (iii) the predominance of extensive production methods, (iv) high population pressure, (v) land insecurity due to the duality of traditional and modern land tenure and (vi) the high costs of internal and external transport34.
176. Cotton, the main cash crop of the country, provides on average 63 % of export proceeds of the country. Its contribution to the national economy is largely related to weather conditions, fluctuations in world prices and competition of subsidized cotton producers of major exporting countries.
177. Despite these constraints, the primary sector has a number of strengths and potential allowing to further boost agriculture, especially: (i) a significant availability of agricultural lands, (ii) a potential of irrigable land, (iii) a still perfectible production system, (iv) a youth of the farming population, (v) an appreciable regional and international demand, particularly for livestock, cotton, fruits and vegetables.
178. The number of structured manufacturing units in Burkina Faso is reduced (one hundred), mostly in the food processing, chemicals, metal manufacturing and textile sub‐sectors. They are particularly concentrated in Ouagadougou and Bobo Dioulasso (93 %) and are mostly characterized by (i) a relatively young age (50 % have less than ten years), (ii) low levels of infrastructure and equipment, (iii) high production costs, (iv) low optimal technology choices, (v) a high tax ratio, and (vi) a close national market and high dumping35.
179. Burkina Faso has a booming mining potential. Several international mining companies are located in the countries and engage particularly in exploratory work. The main focus of the approach strategy of the National Policy for Mining Development followed by the Ministry of Mines, Quarries and Energy for the development of mineral resources is the private initiative.
180. The mining potential is mainly composed of gold, zinc (at the Center West) and manganese of which the most important deposit is located in Tambao in the north. It should be noted that Burkina Faso has recently joined the Initiative on Transparency in the Revenues Management of Extractive Industries (ITIE).
5.3.4 Foreign trade
181. During the period 1995 ‐ 2009, the Burkinabe Foreign Trade has evolved, in value, at constant prices of 1996, at a rate of structural growth of 5.6 %. It is dominated by imports, which averaged 75 % of the country's international trade over the past twelve years. In current CFA francs, the average growth was 8.9 % and the rate of import coverage by exports averaged 34% during this period.
182. Cotton accounts for most Burkinabe exports (75 %)36, the country has become the first African producer over the past two years, which was the cause of a rise of this product’s share in exports.
183. Europe and Africa remain the two main destinations of Burkina Faso exports, with about 87 % of the country’s exports during the period 1995 ‐ 2009.
184. As regards imports, far more important than exports (in value), they grew at an average rate of 8.9 % (in current CFA francs) over the last thirteen years. Petroleum products (20 %), machinery and capital equipment
33 Source : National prospective study. General Report ‐ 2007. 34 Source : SNAT, 2009 35 Source : SNAT, 2009 36 Except in 2009 where are the gold exports which are classified first, with a share of 46% (in value). The share of cotton during that year was 29%
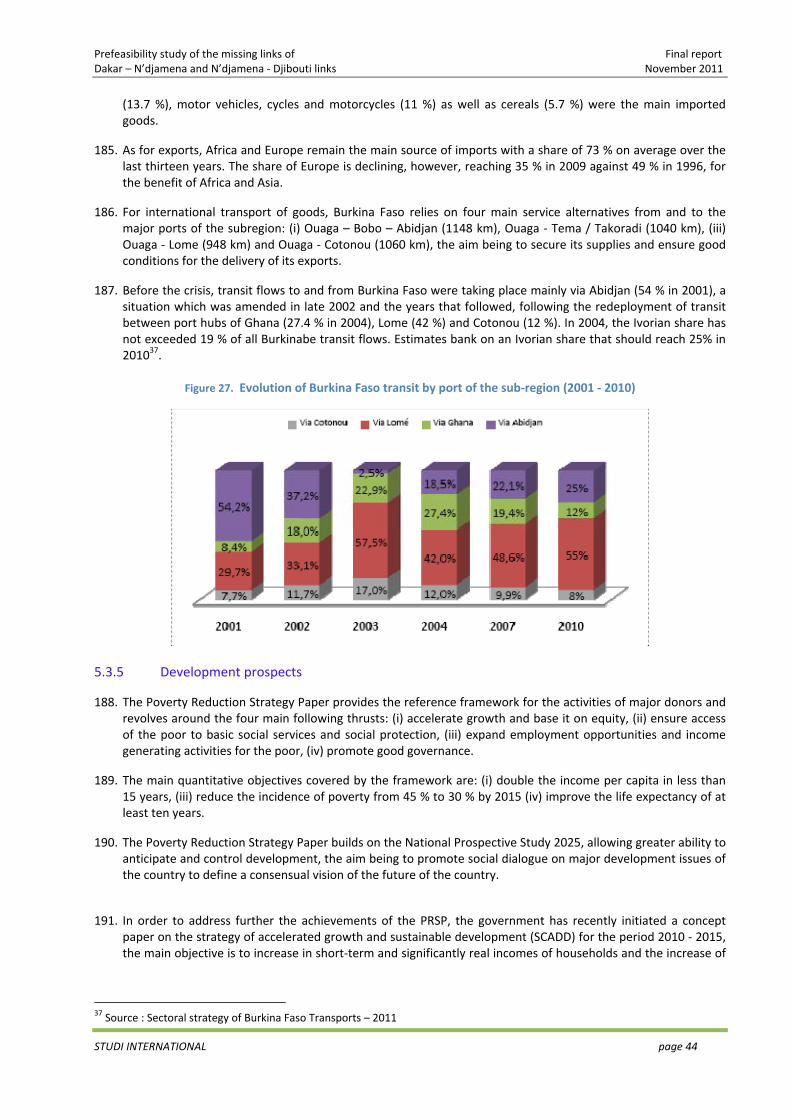
Prefeasibility study of the missing links of Final report Dakar – N’djamena and N’djamena ‐ Djibouti links November 2011
STUDI INTERNATIONAL page 44
(13.7 %), motor vehicles, cycles and motorcycles (11 %) as well as cereals (5.7 %) were the main imported goods.
185. As for exports, Africa and Europe remain the main source of imports with a share of 73 % on average over the last thirteen years. The share of Europe is declining, however, reaching 35 % in 2009 against 49 % in 1996, for the benefit of Africa and Asia.
186. For international transport of goods, Burkina Faso relies on four main service alternatives from and to the major ports of the subregion: (i) Ouaga – Bobo – Abidjan (1148 km), Ouaga ‐ Tema / Takoradi (1040 km), (iii) Ouaga ‐ Lome (948 km) and Ouaga ‐ Cotonou (1060 km), the aim being to secure its supplies and ensure good conditions for the delivery of its exports.
187. Before the crisis, transit flows to and from Burkina Faso were taking place mainly via Abidjan (54 % in 2001), a situation which was amended in late 2002 and the years that followed, following the redeployment of transit between port hubs of Ghana (27.4 % in 2004), Lome (42 %) and Cotonou (12 %). In 2004, the Ivorian share has not exceeded 19 % of all Burkinabe transit flows. Estimates bank on an Ivorian share that should reach 25% in 201037.
Figure 27. Evolution of Burkina Faso transit by port of the sub‐region (2001 ‐ 2010)
5.3.5 Development prospects
188. The Poverty Reduction Strategy Paper provides the reference framework for the activities of major donors and revolves around the four main following thrusts: (i) accelerate growth and base it on equity, (ii) ensure access of the poor to basic social services and social protection, (iii) expand employment opportunities and income generating activities for the poor, (iv) promote good governance.
189. The main quantitative objectives covered by the framework are: (i) double the income per capita in less than 15 years, (iii) reduce the incidence of poverty from 45 % to 30 % by 2015 (iv) improve the life expectancy of at least ten years.
190. The Poverty Reduction Strategy Paper builds on the National Prospective Study 2025, allowing greater ability to anticipate and control development, the aim being to promote social dialogue on major development issues of the country to define a consensual vision of the future of the country.
191. In order to address further the achievements of the PRSP, the government has recently initiated a concept paper on the strategy of accelerated growth and sustainable development (SCADD) for the period 2010 ‐ 2015, the main objective is to increase in short‐term and significantly real incomes of households and the increase of
37 Source : Sectoral strategy of Burkina Faso Transports – 2011
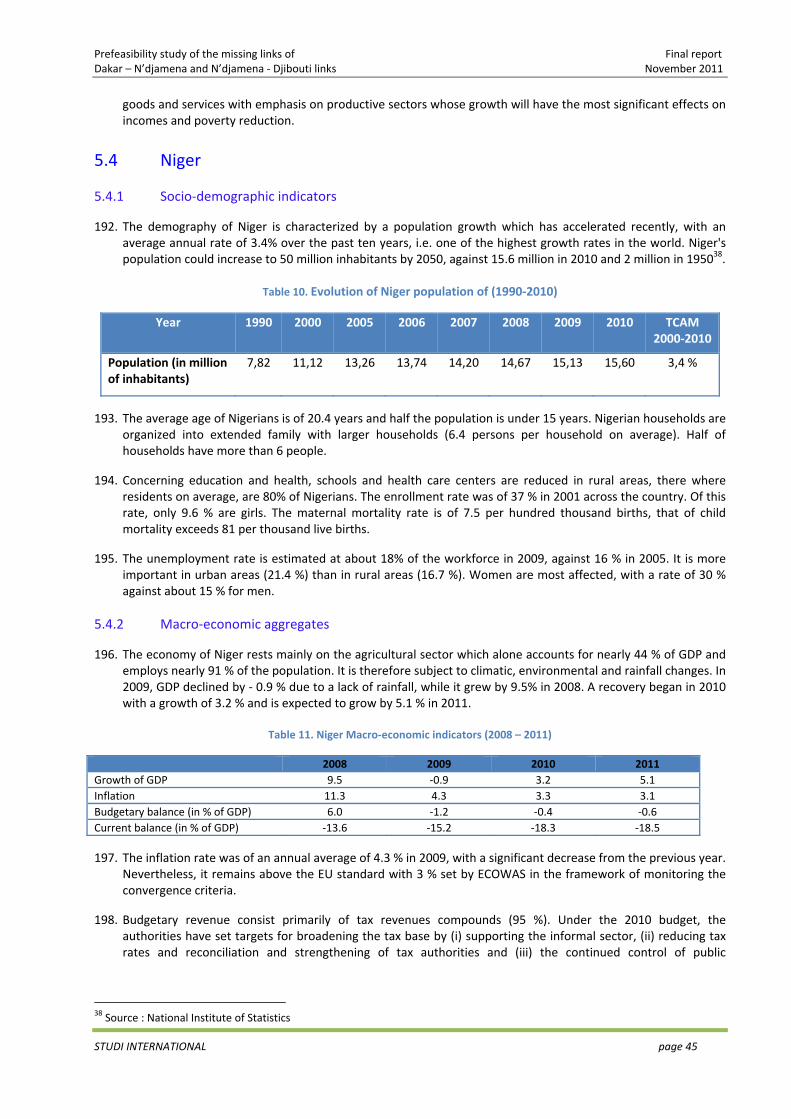
Prefeasibility study of the missing links of Final report Dakar – N’djamena and N’djamena ‐ Djibouti links November 2011
STUDI INTERNATIONAL page 45
goods and services with emphasis on productive sectors whose growth will have the most significant effects on incomes and poverty reduction.
5.4 Niger
5.4.1 Socio‐demographic indicators
192. The demography of Niger is characterized by a population growth which has accelerated recently, with an average annual rate of 3.4% over the past ten years, i.e. one of the highest growth rates in the world. Niger's population could increase to 50 million inhabitants by 2050, against 15.6 million in 2010 and 2 million in 195038.
Table 10. Evolution of Niger population of (1990‐2010)
Year 1990 2000 2005 2006 2007 2008 2009 2010 TCAM 2000‐2010
Population (in million of inhabitants)
7,82 11,12 13,26 13,74 14,20 14,67 15,13 15,60 3,4 %
193. The average age of Nigerians is of 20.4 years and half the population is under 15 years. Nigerian households are organized into extended family with larger households (6.4 persons per household on average). Half of households have more than 6 people.
194. Concerning education and health, schools and health care centers are reduced in rural areas, there where residents on average, are 80% of Nigerians. The enrollment rate was of 37 % in 2001 across the country. Of this rate, only 9.6 % are girls. The maternal mortality rate is of 7.5 per hundred thousand births, that of child mortality exceeds 81 per thousand live births.
195. The unemployment rate is estimated at about 18% of the workforce in 2009, against 16 % in 2005. It is more important in urban areas (21.4 %) than in rural areas (16.7 %). Women are most affected, with a rate of 30 % against about 15 % for men.
5.4.2 Macro‐economic aggregates
196. The economy of Niger rests mainly on the agricultural sector which alone accounts for nearly 44 % of GDP and employs nearly 91 % of the population. It is therefore subject to climatic, environmental and rainfall changes. In 2009, GDP declined by ‐ 0.9 % due to a lack of rainfall, while it grew by 9.5% in 2008. A recovery began in 2010 with a growth of 3.2 % and is expected to grow by 5.1 % in 2011.
Table 11. Niger Macro‐economic indicators (2008 – 2011)
2008 2009 2010 2011 Growth of GDP 9.5 ‐0.9 3.2 5.1 Inflation 11.3 4.3 3.3 3.1 Budgetary balance (in % of GDP) 6.0 ‐1.2 ‐0.4 ‐0.6 Current balance (in % of GDP) ‐13.6 ‐15.2 ‐18.3 ‐18.5
197. The inflation rate was of an annual average of 4.3 % in 2009, with a significant decrease from the previous year. Nevertheless, it remains above the EU standard with 3 % set by ECOWAS in the framework of monitoring the convergence criteria.
198. Budgetary revenue consist primarily of tax revenues compounds (95 %). Under the 2010 budget, the authorities have set targets for broadening the tax base by (i) supporting the informal sector, (ii) reducing tax rates and reconciliation and strengthening of tax authorities and (iii) the continued control of public
38 Source : National Institute of Statistics
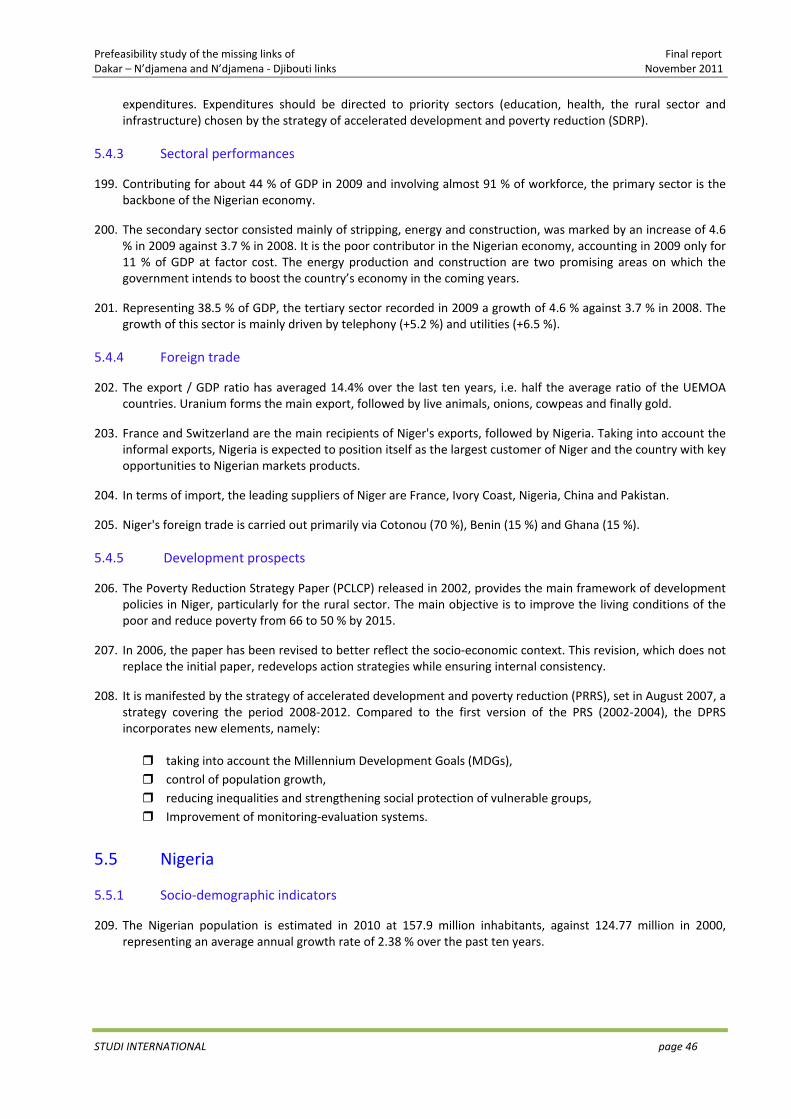
Prefeasibility study of the missing links of Final report Dakar – N’djamena and N’djamena ‐ Djibouti links November 2011
STUDI INTERNATIONAL page 46
expenditures. Expenditures should be directed to priority sectors (education, health, the rural sector and infrastructure) chosen by the strategy of accelerated development and poverty reduction (SDRP).
5.4.3 Sectoral performances
199. Contributing for about 44 % of GDP in 2009 and involving almost 91 % of workforce, the primary sector is the backbone of the Nigerian economy.
200. The secondary sector consisted mainly of stripping, energy and construction, was marked by an increase of 4.6 % in 2009 against 3.7 % in 2008. It is the poor contributor in the Nigerian economy, accounting in 2009 only for 11 % of GDP at factor cost. The energy production and construction are two promising areas on which the government intends to boost the country’s economy in the coming years.
201. Representing 38.5 % of GDP, the tertiary sector recorded in 2009 a growth of 4.6 % against 3.7 % in 2008. The growth of this sector is mainly driven by telephony (+5.2 %) and utilities (+6.5 %).
5.4.4 Foreign trade
202. The export / GDP ratio has averaged 14.4% over the last ten years, i.e. half the average ratio of the UEMOA countries. Uranium forms the main export, followed by live animals, onions, cowpeas and finally gold.
203. France and Switzerland are the main recipients of Niger's exports, followed by Nigeria. Taking into account the informal exports, Nigeria is expected to position itself as the largest customer of Niger and the country with key opportunities to Nigerian markets products.
204. In terms of import, the leading suppliers of Niger are France, Ivory Coast, Nigeria, China and Pakistan.
205. Niger's foreign trade is carried out primarily via Cotonou (70 %), Benin (15 %) and Ghana (15 %).
5.4.5 Development prospects
206. The Poverty Reduction Strategy Paper (PCLCP) released in 2002, provides the main framework of development policies in Niger, particularly for the rural sector. The main objective is to improve the living conditions of the poor and reduce poverty from 66 to 50 % by 2015.
207. In 2006, the paper has been revised to better reflect the socio‐economic context. This revision, which does not replace the initial paper, redevelops action strategies while ensuring internal consistency.
208. It is manifested by the strategy of accelerated development and poverty reduction (PRRS), set in August 2007, a strategy covering the period 2008‐2012. Compared to the first version of the PRS (2002‐2004), the DPRS incorporates new elements, namely:
taking into account the Millennium Development Goals (MDGs), control of population growth, reducing inequalities and strengthening social protection of vulnerable groups, Improvement of monitoring‐evaluation systems.
5.5 Nigeria
5.5.1 Socio‐demographic indicators
209. The Nigerian population is estimated in 2010 at 157.9 million inhabitants, against 124.77 million in 2000, representing an average annual growth rate of 2.38 % over the past ten years.
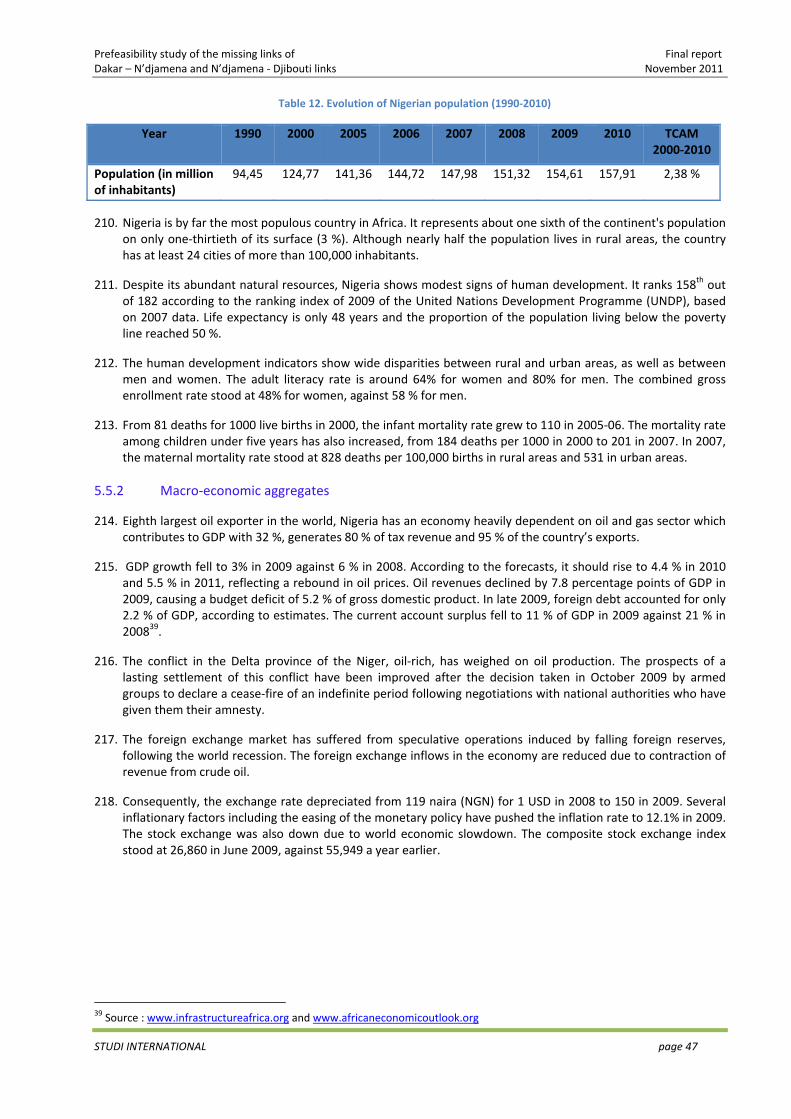
Prefeasibility study of the missing links of Final report Dakar – N’djamena and N’djamena ‐ Djibouti links November 2011
STUDI INTERNATIONAL page 47
Table 12. Evolution of Nigerian population (1990‐2010)
Year 1990 2000 2005 2006 2007 2008 2009 2010 TCAM 2000‐2010
Population (in million of inhabitants)
94,45 124,77 141,36 144,72 147,98 151,32 154,61 157,91 2,38 %
210. Nigeria is by far the most populous country in Africa. It represents about one sixth of the continent's population on only one‐thirtieth of its surface (3 %). Although nearly half the population lives in rural areas, the country has at least 24 cities of more than 100,000 inhabitants.
211. Despite its abundant natural resources, Nigeria shows modest signs of human development. It ranks 158th out of 182 according to the ranking index of 2009 of the United Nations Development Programme (UNDP), based on 2007 data. Life expectancy is only 48 years and the proportion of the population living below the poverty line reached 50 %.
212. The human development indicators show wide disparities between rural and urban areas, as well as between men and women. The adult literacy rate is around 64% for women and 80% for men. The combined gross enrollment rate stood at 48% for women, against 58 % for men.
213. From 81 deaths for 1000 live births in 2000, the infant mortality rate grew to 110 in 2005‐06. The mortality rate among children under five years has also increased, from 184 deaths per 1000 in 2000 to 201 in 2007. In 2007, the maternal mortality rate stood at 828 deaths per 100,000 births in rural areas and 531 in urban areas.
5.5.2 Macro‐economic aggregates
214. Eighth largest oil exporter in the world, Nigeria has an economy heavily dependent on oil and gas sector which contributes to GDP with 32 %, generates 80 % of tax revenue and 95 % of the country’s exports.
215. GDP growth fell to 3% in 2009 against 6 % in 2008. According to the forecasts, it should rise to 4.4 % in 2010 and 5.5 % in 2011, reflecting a rebound in oil prices. Oil revenues declined by 7.8 percentage points of GDP in 2009, causing a budget deficit of 5.2 % of gross domestic product. In late 2009, foreign debt accounted for only 2.2 % of GDP, according to estimates. The current account surplus fell to 11 % of GDP in 2009 against 21 % in 200839.
216. The conflict in the Delta province of the Niger, oil‐rich, has weighed on oil production. The prospects of a lasting settlement of this conflict have been improved after the decision taken in October 2009 by armed groups to declare a cease‐fire of an indefinite period following negotiations with national authorities who have given them their amnesty.
217. The foreign exchange market has suffered from speculative operations induced by falling foreign reserves, following the world recession. The foreign exchange inflows in the economy are reduced due to contraction of revenue from crude oil.
218. Consequently, the exchange rate depreciated from 119 naira (NGN) for 1 USD in 2008 to 150 in 2009. Several inflationary factors including the easing of the monetary policy have pushed the inflation rate to 12.1% in 2009. The stock exchange was also down due to world economic slowdown. The composite stock exchange index stood at 26,860 in June 2009, against 55,949 a year earlier.
39 Source : www.infrastructureafrica.org and www.africaneconomicoutlook.org
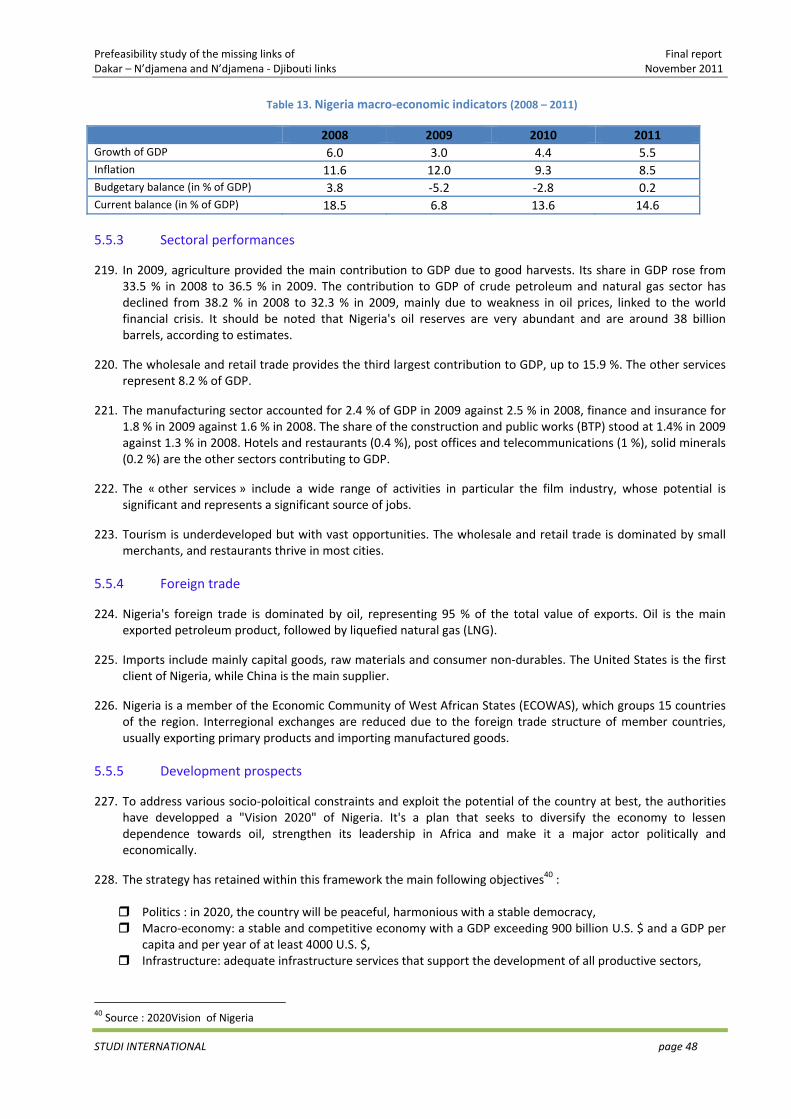
Prefeasibility study of the missing links of Final report Dakar – N’djamena and N’djamena ‐ Djibouti links November 2011
STUDI INTERNATIONAL page 48
Table 13. Nigeria macro‐economic indicators (2008 – 2011)
2008 2009 2010 2011Growth of GDP 6.0 3.0 4.4 5.5Inflation 11.6 12.0 9.3 8.5Budgetary balance (in % of GDP) 3.8 ‐5.2 ‐2.8 0.2Current balance (in % of GDP) 18.5 6.8 13.6 14.6
5.5.3 Sectoral performances
219. In 2009, agriculture provided the main contribution to GDP due to good harvests. Its share in GDP rose from 33.5 % in 2008 to 36.5 % in 2009. The contribution to GDP of crude petroleum and natural gas sector has declined from 38.2 % in 2008 to 32.3 % in 2009, mainly due to weakness in oil prices, linked to the world financial crisis. It should be noted that Nigeria's oil reserves are very abundant and are around 38 billion barrels, according to estimates.
220. The wholesale and retail trade provides the third largest contribution to GDP, up to 15.9 %. The other services represent 8.2 % of GDP.
221. The manufacturing sector accounted for 2.4 % of GDP in 2009 against 2.5 % in 2008, finance and insurance for 1.8 % in 2009 against 1.6 % in 2008. The share of the construction and public works (BTP) stood at 1.4% in 2009 against 1.3 % in 2008. Hotels and restaurants (0.4 %), post offices and telecommunications (1 %), solid minerals (0.2 %) are the other sectors contributing to GDP.
222. The « other services » include a wide range of activities in particular the film industry, whose potential is significant and represents a significant source of jobs.
223. Tourism is underdeveloped but with vast opportunities. The wholesale and retail trade is dominated by small merchants, and restaurants thrive in most cities.
5.5.4 Foreign trade
224. Nigeria's foreign trade is dominated by oil, representing 95 % of the total value of exports. Oil is the main exported petroleum product, followed by liquefied natural gas (LNG).
225. Imports include mainly capital goods, raw materials and consumer non‐durables. The United States is the first client of Nigeria, while China is the main supplier.
226. Nigeria is a member of the Economic Community of West African States (ECOWAS), which groups 15 countries of the region. Interregional exchanges are reduced due to the foreign trade structure of member countries, usually exporting primary products and importing manufactured goods.
5.5.5 Development prospects
227. To address various socio‐poloitical constraints and exploit the potential of the country at best, the authorities have developped a "Vision 2020" of Nigeria. It's a plan that seeks to diversify the economy to lessen dependence towards oil, strengthen its leadership in Africa and make it a major actor politically and economically.
228. The strategy has retained within this framework the main following objectives40 :
Politics : in 2020, the country will be peaceful, harmonious with a stable democracy, Macro‐economy: a stable and competitive economy with a GDP exceeding 900 billion U.S. $ and a GDP per capita and per year of at least 4000 U.S. $,
Infrastructure: adequate infrastructure services that support the development of all productive sectors,
40 Source : 2020Vision of Nigeria
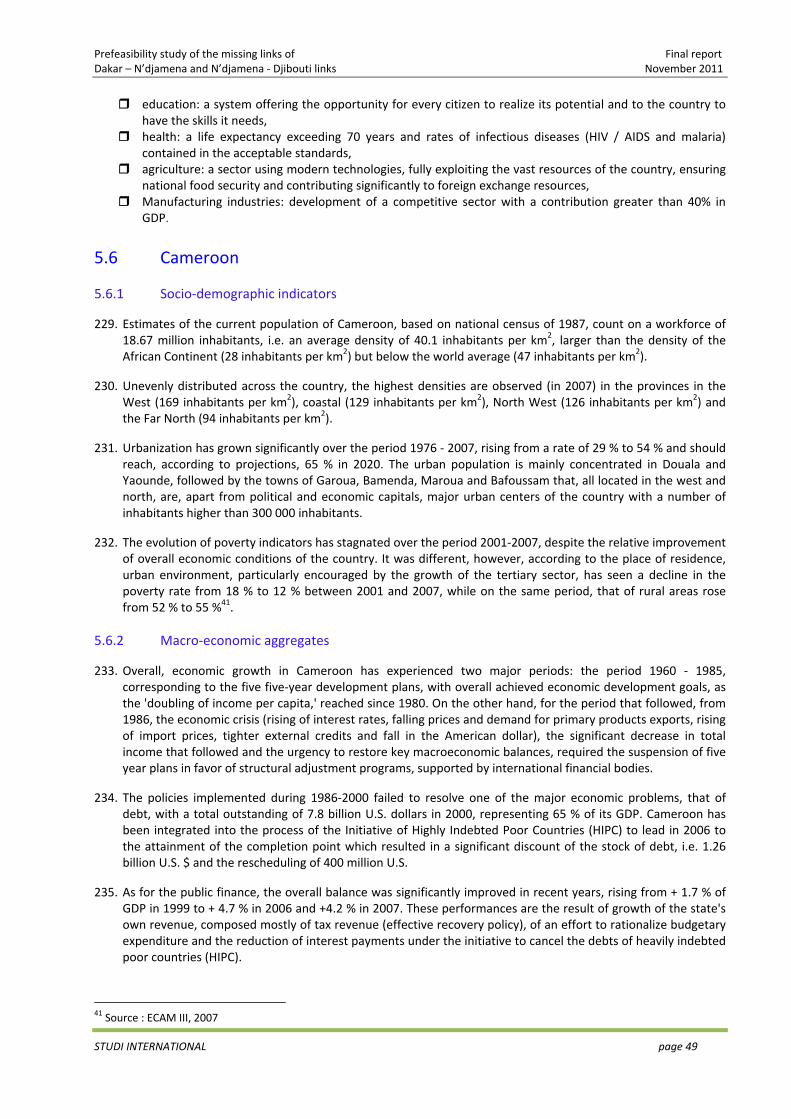
Prefeasibility study of the missing links of Final report Dakar – N’djamena and N’djamena ‐ Djibouti links November 2011
STUDI INTERNATIONAL page 49
education: a system offering the opportunity for every citizen to realize its potential and to the country to have the skills it needs,
health: a life expectancy exceeding 70 years and rates of infectious diseases (HIV / AIDS and malaria) contained in the acceptable standards,
agriculture: a sector using modern technologies, fully exploiting the vast resources of the country, ensuring national food security and contributing significantly to foreign exchange resources,
Manufacturing industries: development of a competitive sector with a contribution greater than 40% in GDP.
5.6 Cameroon
5.6.1 Socio‐demographic indicators
229. Estimates of the current population of Cameroon, based on national census of 1987, count on a workforce of 18.67 million inhabitants, i.e. an average density of 40.1 inhabitants per km2, larger than the density of the African Continent (28 inhabitants per km2) but below the world average (47 inhabitants per km2).
230. Unevenly distributed across the country, the highest densities are observed (in 2007) in the provinces in the West (169 inhabitants per km2), coastal (129 inhabitants per km2), North West (126 inhabitants per km2) and the Far North (94 inhabitants per km2).
231. Urbanization has grown significantly over the period 1976 ‐ 2007, rising from a rate of 29 % to 54 % and should reach, according to projections, 65 % in 2020. The urban population is mainly concentrated in Douala and Yaounde, followed by the towns of Garoua, Bamenda, Maroua and Bafoussam that, all located in the west and north, are, apart from political and economic capitals, major urban centers of the country with a number of inhabitants higher than 300 000 inhabitants.
232. The evolution of poverty indicators has stagnated over the period 2001‐2007, despite the relative improvement of overall economic conditions of the country. It was different, however, according to the place of residence, urban environment, particularly encouraged by the growth of the tertiary sector, has seen a decline in the poverty rate from 18 % to 12 % between 2001 and 2007, while on the same period, that of rural areas rose from 52 % to 55 %41.
5.6.2 Macro‐economic aggregates
233. Overall, economic growth in Cameroon has experienced two major periods: the period 1960 ‐ 1985, corresponding to the five five‐year development plans, with overall achieved economic development goals, as the 'doubling of income per capita,' reached since 1980. On the other hand, for the period that followed, from 1986, the economic crisis (rising of interest rates, falling prices and demand for primary products exports, rising of import prices, tighter external credits and fall in the American dollar), the significant decrease in total income that followed and the urgency to restore key macroeconomic balances, required the suspension of five year plans in favor of structural adjustment programs, supported by international financial bodies.
234. The policies implemented during 1986‐2000 failed to resolve one of the major economic problems, that of debt, with a total outstanding of 7.8 billion U.S. dollars in 2000, representing 65 % of its GDP. Cameroon has been integrated into the process of the Initiative of Highly Indebted Poor Countries (HIPC) to lead in 2006 to the attainment of the completion point which resulted in a significant discount of the stock of debt, i.e. 1.26 billion U.S. $ and the rescheduling of 400 million U.S.
235. As for the public finance, the overall balance was significantly improved in recent years, rising from + 1.7 % of GDP in 1999 to + 4.7 % in 2006 and +4.2 % in 2007. These performances are the result of growth of the state's own revenue, composed mostly of tax revenue (effective recovery policy), of an effort to rationalize budgetary expenditure and the reduction of interest payments under the initiative to cancel the debts of heavily indebted poor countries (HIPC).
41 Source : ECAM III, 2007
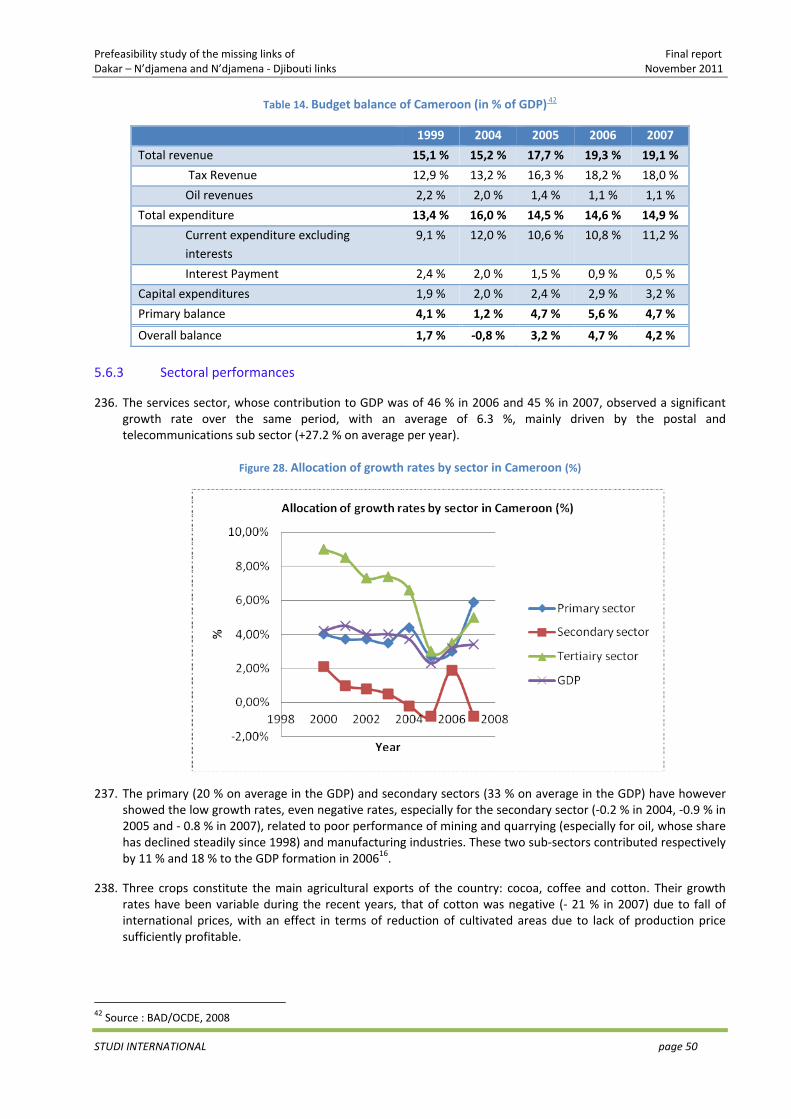
Prefeasibility study of the missing links of Final report Dakar – N’djamena and N’djamena ‐ Djibouti links November 2011
STUDI INTERNATIONAL page 50
Table 14. Budget balance of Cameroon (in % of GDP) 42
1999 2004 2005 2006 2007
Total revenue 15,1 % 15,2 % 17,7 % 19,3 % 19,1 %
Tax Revenue 12,9 % 13,2 % 16,3 % 18,2 % 18,0 %
Oil revenues 2,2 % 2,0 % 1,4 % 1,1 % 1,1 %
Total expenditure 13,4 % 16,0 % 14,5 % 14,6 % 14,9 %
Current expenditure excluding interests
9,1 % 12,0 % 10,6 % 10,8 % 11,2 %
Interest Payment 2,4 % 2,0 % 1,5 % 0,9 % 0,5 %
Capital expenditures 1,9 % 2,0 % 2,4 % 2,9 % 3,2 %
Primary balance 4,1 % 1,2 % 4,7 % 5,6 % 4,7 %
Overall balance 1,7 % ‐0,8 % 3,2 % 4,7 % 4,2 %
5.6.3 Sectoral performances
236. The services sector, whose contribution to GDP was of 46 % in 2006 and 45 % in 2007, observed a significant growth rate over the same period, with an average of 6.3 %, mainly driven by the postal and telecommunications sub sector (+27.2 % on average per year).
Figure 28. Allocation of growth rates by sector in Cameroon (%)
237. The primary (20 % on average in the GDP) and secondary sectors (33 % on average in the GDP) have however showed the low growth rates, even negative rates, especially for the secondary sector (‐0.2 % in 2004, ‐0.9 % in 2005 and ‐ 0.8 % in 2007), related to poor performance of mining and quarrying (especially for oil, whose share has declined steadily since 1998) and manufacturing industries. These two sub‐sectors contributed respectively by 11 % and 18 % to the GDP formation in 200616.
238. Three crops constitute the main agricultural exports of the country: cocoa, coffee and cotton. Their growth rates have been variable during the recent years, that of cotton was negative (‐ 21 % in 2007) due to fall of international prices, with an effect in terms of reduction of cultivated areas due to lack of production price sufficiently profitable.
42 Source : BAD/OCDE, 2008
Prefeasibility study of the missing links of Final report Dakar – N’djamena and N’djamena ‐ Djibouti links November 2011
STUDI INTERNATIONAL page 51
5.6.4 Foreign trade
239. 5 products dominate the main Cameroon exports: (i) crude oil (43 %), wood and wooden structures (13 %), fuels and lubricants (11 %), sawn timber (9 %) and raw cocoa beans (5 %)43.
240. Europe is the main destination for exports, with about 85 % of total exports during the period 2005 to 2009.
241. In terms of imports, they grew at an average rate of 7 % (in current francs) over the past five years. Mineral products (20 %), hydrocarbons (18 %), machinery and equipment (16%), chemicals (12 %) and metals (11 %) are the main imported goods.
242. The European Union, Nigeria, the United States, China and Japan are the major suppliers.
243. Cameroon is the first and main countries of transit for landlocked countries of Central Africa mainly Central African Republic and Chad, through which pass the majority of foreign trade with the rest of the world.
5.6.5 Development prospects
244. The Cameroon Government has formulated in 2009 an overall vision of medium and long term development, 'Cameroon Vision 2035', based on the principles of justice, responsibility, solidarity and participation. 'Cameroon Vision 2035' aims to sustainably improve the basic living conditions of the population. The vision encompasses sectoral strategies in the short, medium and long term.
245. It is thus to increase the GDP per capita from nearly 1,000 dollars in 2007 to 3800 dollars in 2035 (in constant terms 2007), the poverty line from 40% to 10%, life expectancy from 50 years to 71.5 years and the share of student numbers in science and engineering from 5% in 2007 to 30% by 2035.
246. These goals require rapid growth of GDP of 9% per annum over the period 2015 to 2025 and beyond two digits. The Vision 2035 envisages for that effect an important participation of the private sector and development of secondary sectors and services, at high added –value, export‐oriented. Modern technologies of information and telecommunications will be used as support of competitiveness improvement.
247. The Vision 2035 focuses also its strategy on the education of young generations in the fields of science, technology, management and telecommunications infrastructure. In the short and medium term, the vision 2035 is translated into 'policies’ which are those of the Poverty Reduction Strategy Paper (PRSP).
248. Transport, infrastructure are an important support to the development and consolidation of the strategy. The vision focuses its strategy on an integral development of the road, rail, air and sea sub‐sectors with the main objectives of a significant reduction in operating costs and a significant improvement of enterprises’ competitiveness.
249. In the road sector, the objective is the tarring of at least 30 % of the national road network. For the railway subsector, the Vision retains a short‐term improvement of the current network status. In the long term, the network must branch to the main production areas while meeting the requirements of integration with the subregion’s countries. Related to maritime sub‐sector, the strategy takes as its main actions the construction of deepwater ports of Kribi and Limbe as well as the modernization and strengthening of Douala port capacity.
5.7 Chad
5.7.1 Socio‐demographic indicators
250. According to the results of General Census of Population and Housing (RGPH2), the Chadian population reached in 2009 a workforce of 11.27 million inhabitants, i.e. a fairly steady trend of 3.6 % by year on average over the last sixteen years44, resulting from a quite high birth rate with a major influx of refugees from neighboring countries estimated at about 300 000 inhabitants.
43 Source : National Institute of Statistics 44 Based on the results of the last general census of population of 1993
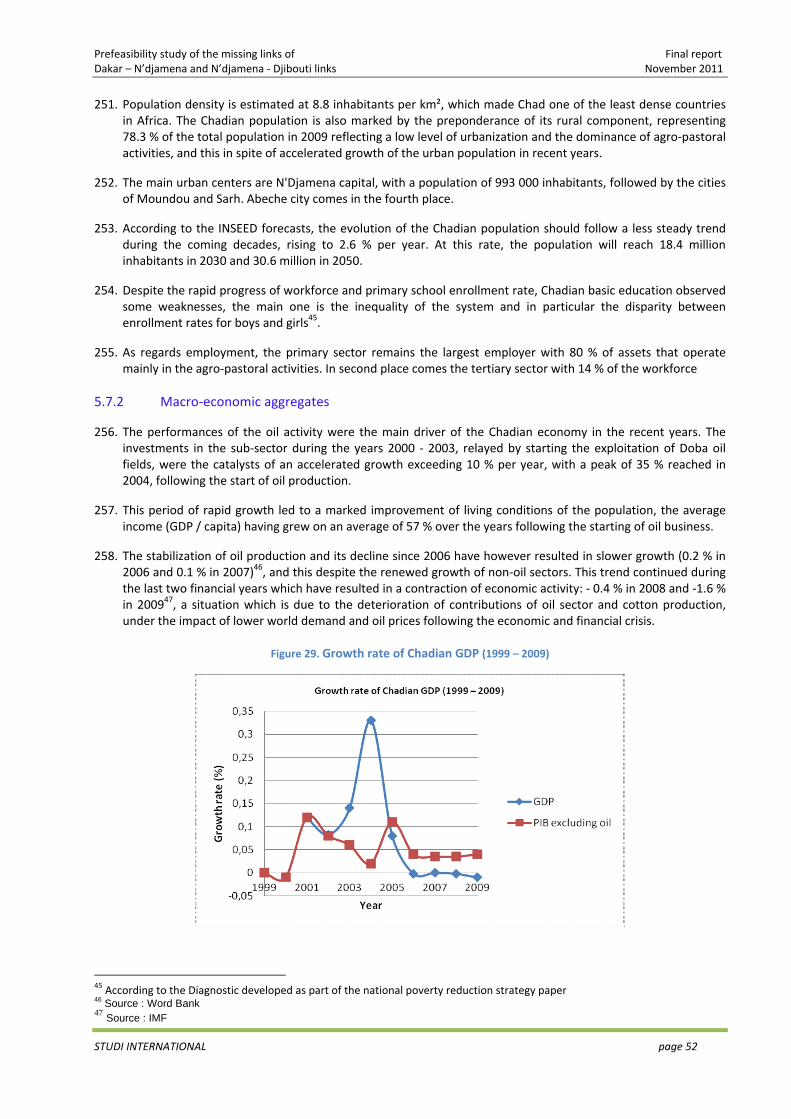
Prefeasibility study of the missing links of Final report Dakar – N’djamena and N’djamena ‐ Djibouti links November 2011
STUDI INTERNATIONAL page 52
251. Population density is estimated at 8.8 inhabitants per km², which made Chad one of the least dense countries in Africa. The Chadian population is also marked by the preponderance of its rural component, representing 78.3 % of the total population in 2009 reflecting a low level of urbanization and the dominance of agro‐pastoral activities, and this in spite of accelerated growth of the urban population in recent years.
252. The main urban centers are N'Djamena capital, with a population of 993 000 inhabitants, followed by the cities of Moundou and Sarh. Abeche city comes in the fourth place.
253. According to the INSEED forecasts, the evolution of the Chadian population should follow a less steady trend during the coming decades, rising to 2.6 % per year. At this rate, the population will reach 18.4 million inhabitants in 2030 and 30.6 million in 2050.
254. Despite the rapid progress of workforce and primary school enrollment rate, Chadian basic education observed some weaknesses, the main one is the inequality of the system and in particular the disparity between enrollment rates for boys and girls45.
255. As regards employment, the primary sector remains the largest employer with 80 % of assets that operate mainly in the agro‐pastoral activities. In second place comes the tertiary sector with 14 % of the workforce
5.7.2 Macro‐economic aggregates
256. The performances of the oil activity were the main driver of the Chadian economy in the recent years. The investments in the sub‐sector during the years 2000 ‐ 2003, relayed by starting the exploitation of Doba oil fields, were the catalysts of an accelerated growth exceeding 10 % per year, with a peak of 35 % reached in 2004, following the start of oil production.
257. This period of rapid growth led to a marked improvement of living conditions of the population, the average income (GDP / capita) having grew on an average of 57 % over the years following the starting of oil business.
258. The stabilization of oil production and its decline since 2006 have however resulted in slower growth (0.2 % in 2006 and 0.1 % in 2007)46, and this despite the renewed growth of non‐oil sectors. This trend continued during the last two financial years which have resulted in a contraction of economic activity: ‐ 0.4 % in 2008 and ‐1.6 % in 200947, a situation which is due to the deterioration of contributions of oil sector and cotton production, under the impact of lower world demand and oil prices following the economic and financial crisis.
Figure 29. Growth rate of Chadian GDP (1999 – 2009)
45 According to the Diagnostic developed as part of the national poverty reduction strategy paper 46 Source : Word Bank 47 Source : IMF
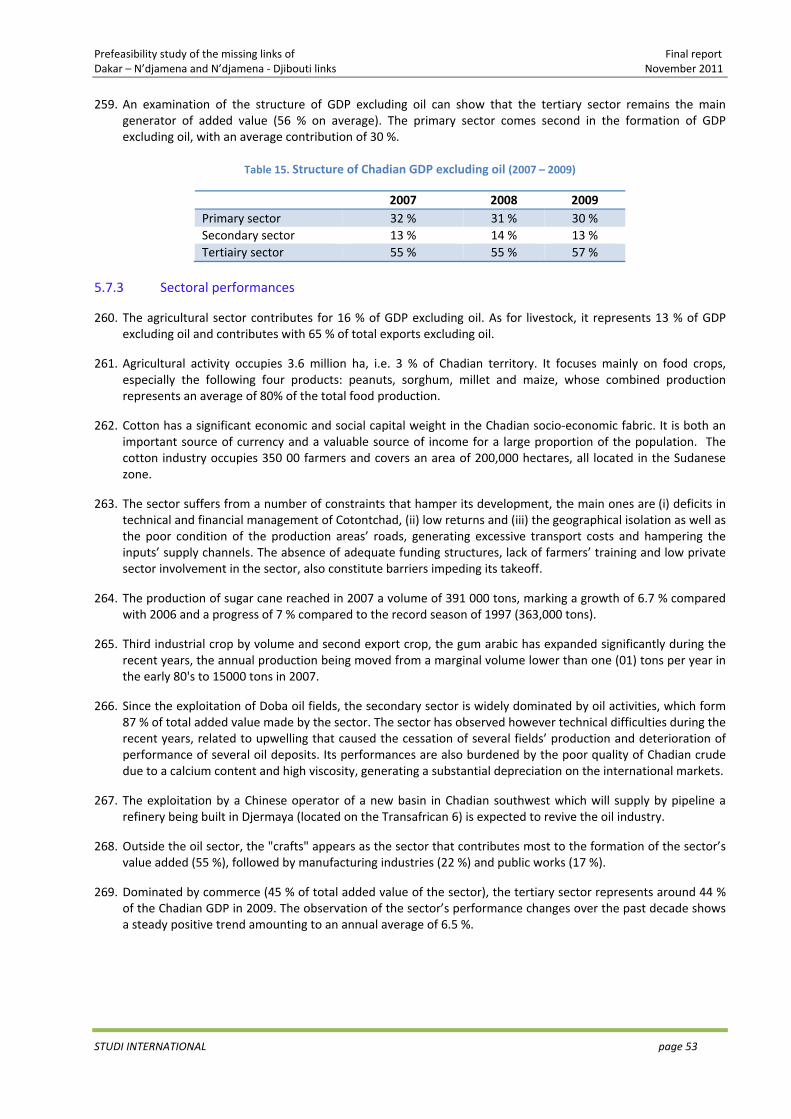
Prefeasibility study of the missing links of Final report Dakar – N’djamena and N’djamena ‐ Djibouti links November 2011
STUDI INTERNATIONAL page 53
259. An examination of the structure of GDP excluding oil can show that the tertiary sector remains the main generator of added value (56 % on average). The primary sector comes second in the formation of GDP excluding oil, with an average contribution of 30 %.
Table 15. Structure of Chadian GDP excluding oil (2007 – 2009)
2007 2008 2009 Primary sector 32 % 31 % 30 % Secondary sector 13 % 14 % 13 % Tertiairy sector 55 % 55 % 57 %
5.7.3 Sectoral performances
260. The agricultural sector contributes for 16 % of GDP excluding oil. As for livestock, it represents 13 % of GDP excluding oil and contributes with 65 % of total exports excluding oil.
261. Agricultural activity occupies 3.6 million ha, i.e. 3 % of Chadian territory. It focuses mainly on food crops, especially the following four products: peanuts, sorghum, millet and maize, whose combined production represents an average of 80% of the total food production.
262. Cotton has a significant economic and social capital weight in the Chadian socio‐economic fabric. It is both an important source of currency and a valuable source of income for a large proportion of the population. The cotton industry occupies 350 00 farmers and covers an area of 200,000 hectares, all located in the Sudanese zone.
263. The sector suffers from a number of constraints that hamper its development, the main ones are (i) deficits in technical and financial management of Cotontchad, (ii) low returns and (iii) the geographical isolation as well as the poor condition of the production areas’ roads, generating excessive transport costs and hampering the inputs’ supply channels. The absence of adequate funding structures, lack of farmers’ training and low private sector involvement in the sector, also constitute barriers impeding its takeoff.
264. The production of sugar cane reached in 2007 a volume of 391 000 tons, marking a growth of 6.7 % compared with 2006 and a progress of 7 % compared to the record season of 1997 (363,000 tons).
265. Third industrial crop by volume and second export crop, the gum arabic has expanded significantly during the recent years, the annual production being moved from a marginal volume lower than one (01) tons per year in the early 80's to 15000 tons in 2007.
266. Since the exploitation of Doba oil fields, the secondary sector is widely dominated by oil activities, which form 87 % of total added value made by the sector. The sector has observed however technical difficulties during the recent years, related to upwelling that caused the cessation of several fields’ production and deterioration of performance of several oil deposits. Its performances are also burdened by the poor quality of Chadian crude due to a calcium content and high viscosity, generating a substantial depreciation on the international markets.
267. The exploitation by a Chinese operator of a new basin in Chadian southwest which will supply by pipeline a refinery being built in Djermaya (located on the Transafrican 6) is expected to revive the oil industry.
268. Outside the oil sector, the "crafts" appears as the sector that contributes most to the formation of the sector’s value added (55 %), followed by manufacturing industries (22 %) and public works (17 %).
269. Dominated by commerce (45 % of total added value of the sector), the tertiary sector represents around 44 % of the Chadian GDP in 2009. The observation of the sector’s performance changes over the past decade shows a steady positive trend amounting to an annual average of 6.5 %.
Prefeasibility study of the missing links of Final report Dakar – N’djamena and N’djamena ‐ Djibouti links November 2011
STUDI INTERNATIONAL page 54
5.7.4 Foreign trade
270. Crude oil dominates Chadian trade. It accounts for 67 % of the total trade value and 85 % of total exports.Excluding oil, the bulk of Chadian exports are made of the agricultural products, with a predominance of two products: animal husbandry products and cotton. Nigeria is the main customer of Chadian non‐oil exports, with a share of 39% of their total value, followed by France (26 %).
271. With accrued shares amounting to 68% of the total value of imports on average over the last three years, capital goods, vehicles and hydrocarbons are the country’s main imported products. In the second order of importance come the food (13%) and fertilizers (7%).
272. In terms of geographical distribution, it appears the heavy weight of Cameroon, which contributes for 30% of the imports’ value, making it the first supplier of Chad. It is followed by France (18 %), Spain (16 %) and Nigeria (14 %).
273. Le corridor Camerounais, via le port de Douala, gère l’essentiel du trafic international en provenance et à destination du Tchad. Il est suivi par le corridor Nigérian, via le port de Lagos, essentiellement utilisé pour l’importation des hydrocarbures et le fret des marchandises conteneurisées. D’autres voies de transit existent, mais demeurent peu fréquentées. Il s’agit de (i) la voie Trans‐équatoriale (N’djaména – Pointe Noire via Sarh et Bangui), (ii) la voie Soudanaise via Port Soudan, (iii) et les voies Libyenne et Algérienne. Cameroon corridor, through the port of Douala, manages the bulk of international traffic from and to Chad. It is followed by the Nigerian corridor, through the port of Lagos, mainly used for the import of oil and the containerized cargo freight. Other transit routes exist but remain little used. These are (i) the trans‐equatorial road (N'djamena ‐ Pointe Noire via Sarh and Bangui), (ii) the Sudanese road via Sudan Port, (iii) and Libyan and Algerian roads.
5.7.5 Development prospects
274. The Chadian government formulated in 2003 a strategy for growth and poverty reduction (SNRP1), marking its commitment to achieving the Millennium Development Goals (MDGs) by 2015.
275. In order to take new features of the socio‐economic context, SNRP1 was relayed in 2007 by a new document: Strategy for Growth and Poverty Reduction (SNRP2) which redirects the main objectives and development priorities of SNRP1, taking into account the previous achievements, new parameters characterizing the economic sectors and regional and world contexts in which they operate.
276. In terms of economic development, the strategy holds particularly the option of the economy diversification and proliferation of growth sources as the main pillar of development. The consolidation of key sectors such as oil sector and involvement of the private sector are also the main advocated channels of development.
277. By productive sector, a number of strategic choices for development have been identified, the aim being to develop its potential and draw out at best its growth capacity.
278. The impact of these measures and actions’ batteries should help maintain a growth rate of GDP of 3.3% on average over the period 2008 to 2011 and reach a growth of 4% on the horizon of the strategy (2015) and this despite the expected underperformance of the oil sector.
279. This growth will be thus supported by non‐oil activities particularly dynamic, with a target trend of 6.5 % in 2011. By 2015, the document of Chad’s transport sectoral strategy holds an annual average growth rate of GDP excluding oil of 6.2 % and primary sector growth of 4.2 %, mostly from food crops sub‐sector (5.6 %).
5.8 Sudan
5.8.1 Socio‐demographic indicators
280. According to estimates of the Central Bureau of Statistics of Sudan (CBS), the total population of Sudan has reached almost 38.2 million in 2008, which corresponds to an average density of 15.2 inhabitants per km2.
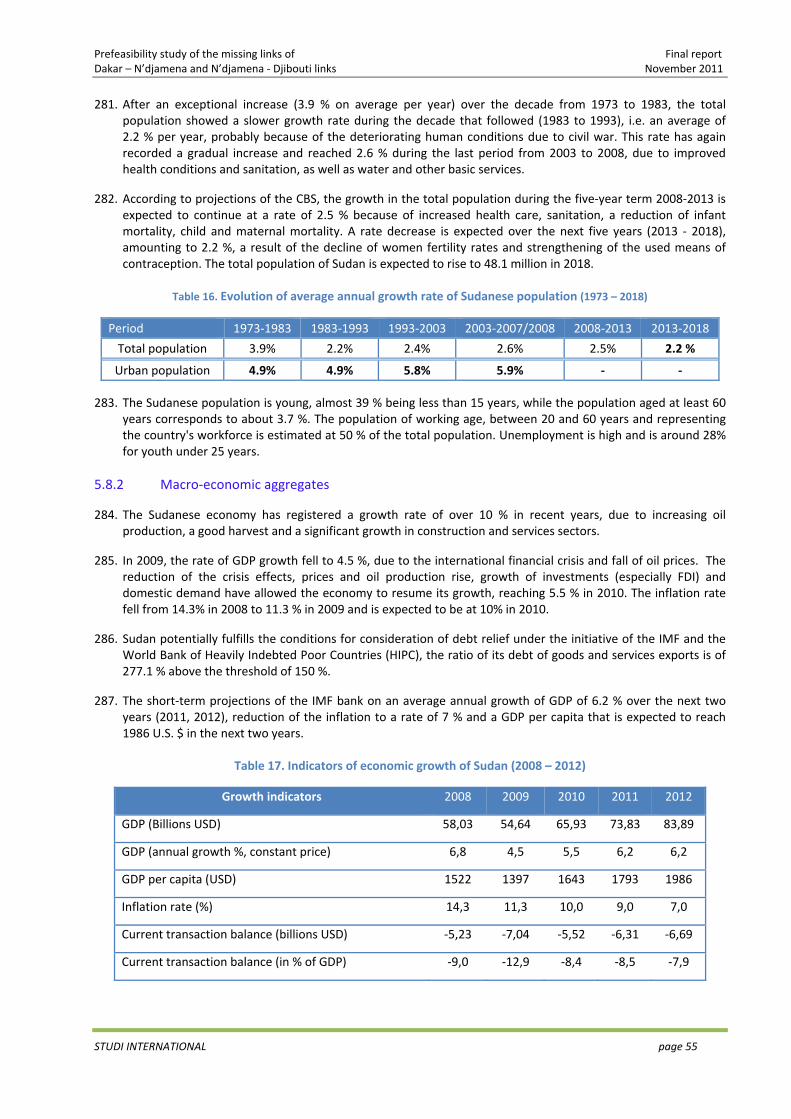
Prefeasibility study of the missing links of Final report Dakar – N’djamena and N’djamena ‐ Djibouti links November 2011
STUDI INTERNATIONAL page 55
281. After an exceptional increase (3.9 % on average per year) over the decade from 1973 to 1983, the total population showed a slower growth rate during the decade that followed (1983 to 1993), i.e. an average of 2.2 % per year, probably because of the deteriorating human conditions due to civil war. This rate has again recorded a gradual increase and reached 2.6 % during the last period from 2003 to 2008, due to improved health conditions and sanitation, as well as water and other basic services.
282. According to projections of the CBS, the growth in the total population during the five‐year term 2008‐2013 is expected to continue at a rate of 2.5 % because of increased health care, sanitation, a reduction of infant mortality, child and maternal mortality. A rate decrease is expected over the next five years (2013 ‐ 2018), amounting to 2.2 %, a result of the decline of women fertility rates and strengthening of the used means of contraception. The total population of Sudan is expected to rise to 48.1 million in 2018.
Table 16. Evolution of average annual growth rate of Sudanese population (1973 – 2018)
Period 1973‐1983 1983‐1993 1993‐2003 2003‐2007/2008 2008‐2013 2013‐2018
Total population 3.9% 2.2% 2.4% 2.6% 2.5% 2.2 %
Urban population 4.9% 4.9% 5.8% 5.9% ‐ ‐
283. The Sudanese population is young, almost 39 % being less than 15 years, while the population aged at least 60 years corresponds to about 3.7 %. The population of working age, between 20 and 60 years and representing the country's workforce is estimated at 50 % of the total population. Unemployment is high and is around 28% for youth under 25 years.
5.8.2 Macro‐economic aggregates
284. The Sudanese economy has registered a growth rate of over 10 % in recent years, due to increasing oil production, a good harvest and a significant growth in construction and services sectors.
285. In 2009, the rate of GDP growth fell to 4.5 %, due to the international financial crisis and fall of oil prices. The reduction of the crisis effects, prices and oil production rise, growth of investments (especially FDI) and domestic demand have allowed the economy to resume its growth, reaching 5.5 % in 2010. The inflation rate fell from 14.3% in 2008 to 11.3 % in 2009 and is expected to be at 10% in 2010.
286. Sudan potentially fulfills the conditions for consideration of debt relief under the initiative of the IMF and the World Bank of Heavily Indebted Poor Countries (HIPC), the ratio of its debt of goods and services exports is of 277.1 % above the threshold of 150 %.
287. The short‐term projections of the IMF bank on an average annual growth of GDP of 6.2 % over the next two years (2011, 2012), reduction of the inflation to a rate of 7 % and a GDP per capita that is expected to reach 1986 U.S. $ in the next two years.
Table 17. Indicators of economic growth of Sudan (2008 – 2012)
Growth indicators 2008 2009 2010 2011 2012
GDP (Billions USD) 58,03 54,64 65,93 73,83 83,89
GDP (annual growth %, constant price) 6,8 4,5 5,5 6,2 6,2
GDP per capita (USD) 1522 1397 1643 1793 1986
Inflation rate (%) 14,3 11,3 10,0 9,0 7,0
Current transaction balance (billions USD) ‐5,23 ‐7,04 ‐5,52 ‐6,31 ‐6,69
Current transaction balance (in % of GDP) ‐9,0 ‐12,9 ‐8,4 ‐8,5 ‐7,9
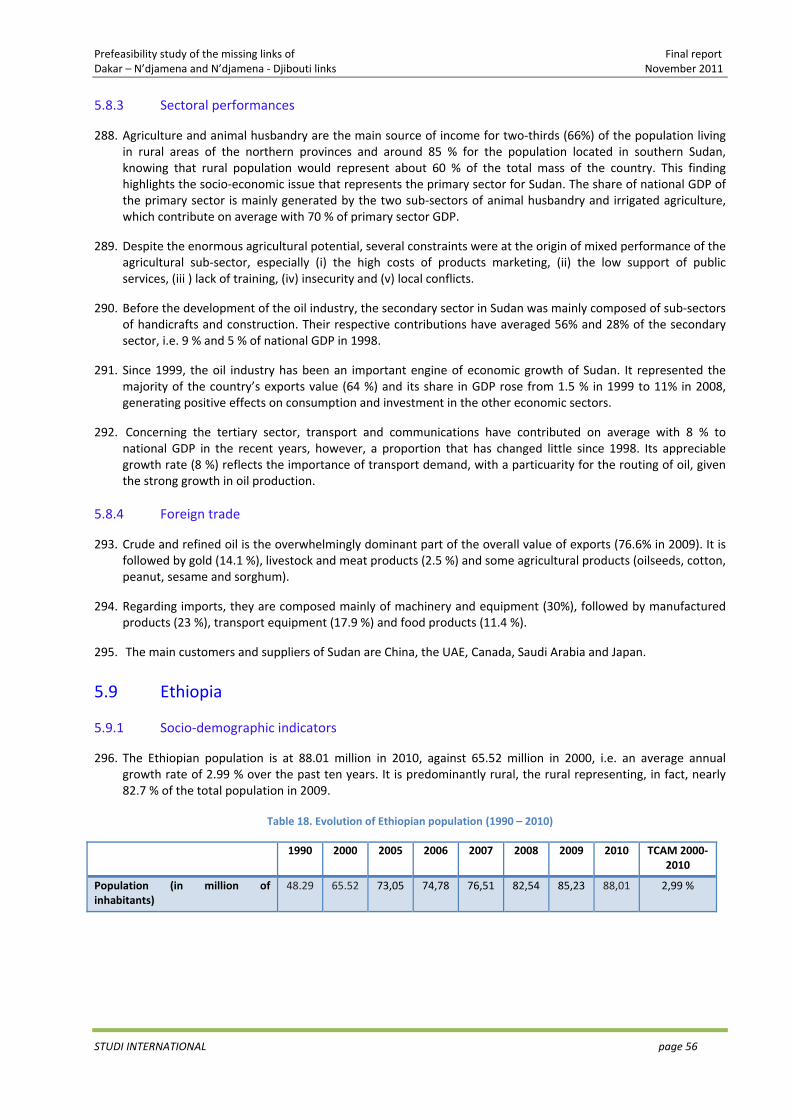
Prefeasibility study of the missing links of Final report Dakar – N’djamena and N’djamena ‐ Djibouti links November 2011
STUDI INTERNATIONAL page 56
5.8.3 Sectoral performances
288. Agriculture and animal husbandry are the main source of income for two‐thirds (66%) of the population living in rural areas of the northern provinces and around 85 % for the population located in southern Sudan, knowing that rural population would represent about 60 % of the total mass of the country. This finding highlights the socio‐economic issue that represents the primary sector for Sudan. The share of national GDP of the primary sector is mainly generated by the two sub‐sectors of animal husbandry and irrigated agriculture, which contribute on average with 70 % of primary sector GDP.
289. Despite the enormous agricultural potential, several constraints were at the origin of mixed performance of the agricultural sub‐sector, especially (i) the high costs of products marketing, (ii) the low support of public services, (iii ) lack of training, (iv) insecurity and (v) local conflicts.
290. Before the development of the oil industry, the secondary sector in Sudan was mainly composed of sub‐sectors of handicrafts and construction. Their respective contributions have averaged 56% and 28% of the secondary sector, i.e. 9 % and 5 % of national GDP in 1998.
291. Since 1999, the oil industry has been an important engine of economic growth of Sudan. It represented the majority of the country’s exports value (64 %) and its share in GDP rose from 1.5 % in 1999 to 11% in 2008, generating positive effects on consumption and investment in the other economic sectors.
292. Concerning the tertiary sector, transport and communications have contributed on average with 8 % to national GDP in the recent years, however, a proportion that has changed little since 1998. Its appreciable growth rate (8 %) reflects the importance of transport demand, with a particuarity for the routing of oil, given the strong growth in oil production.
5.8.4 Foreign trade
293. Crude and refined oil is the overwhelmingly dominant part of the overall value of exports (76.6% in 2009). It is followed by gold (14.1 %), livestock and meat products (2.5 %) and some agricultural products (oilseeds, cotton, peanut, sesame and sorghum).
294. Regarding imports, they are composed mainly of machinery and equipment (30%), followed by manufactured products (23 %), transport equipment (17.9 %) and food products (11.4 %).
295. The main customers and suppliers of Sudan are China, the UAE, Canada, Saudi Arabia and Japan.
5.9 Ethiopia
5.9.1 Socio‐demographic indicators
296. The Ethiopian population is at 88.01 million in 2010, against 65.52 million in 2000, i.e. an average annual growth rate of 2.99 % over the past ten years. It is predominantly rural, the rural representing, in fact, nearly 82.7 % of the total population in 2009.
Table 18. Evolution of Ethiopian population (1990 – 2010)
1990 2000 2005 2006 2007 2008 2009 2010 TCAM 2000‐2010
Population (in million of inhabitants)
48.29 65.52 73,05 74,78 76,51 82,54 85,23 88,01 2,99 %
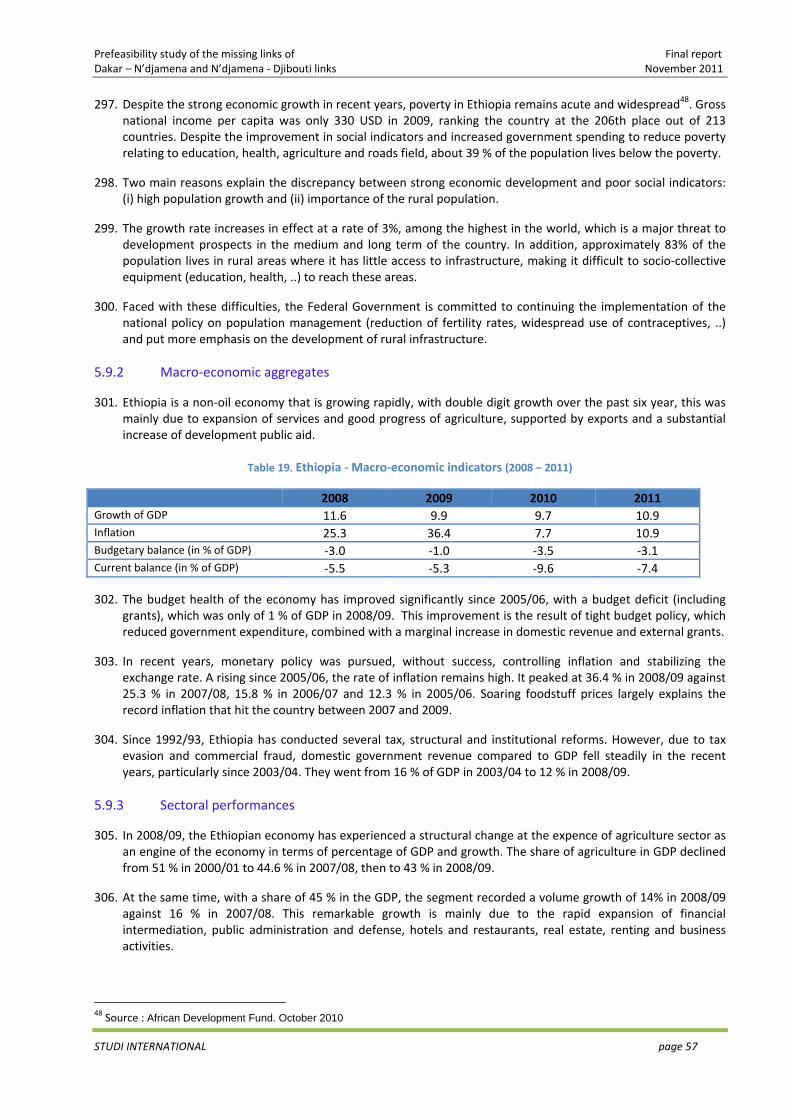
Prefeasibility study of the missing links of Final report Dakar – N’djamena and N’djamena ‐ Djibouti links November 2011
STUDI INTERNATIONAL page 57
297. Despite the strong economic growth in recent years, poverty in Ethiopia remains acute and widespread48. Gross national income per capita was only 330 USD in 2009, ranking the country at the 206th place out of 213 countries. Despite the improvement in social indicators and increased government spending to reduce poverty relating to education, health, agriculture and roads field, about 39 % of the population lives below the poverty.
298. Two main reasons explain the discrepancy between strong economic development and poor social indicators: (i) high population growth and (ii) importance of the rural population.
299. The growth rate increases in effect at a rate of 3%, among the highest in the world, which is a major threat to development prospects in the medium and long term of the country. In addition, approximately 83% of the population lives in rural areas where it has little access to infrastructure, making it difficult to socio‐collective equipment (education, health, ..) to reach these areas.
300. Faced with these difficulties, the Federal Government is committed to continuing the implementation of the national policy on population management (reduction of fertility rates, widespread use of contraceptives, ..) and put more emphasis on the development of rural infrastructure.
5.9.2 Macro‐economic aggregates
301. Ethiopia is a non‐oil economy that is growing rapidly, with double digit growth over the past six year, this was mainly due to expansion of services and good progress of agriculture, supported by exports and a substantial increase of development public aid.
Table 19. Ethiopia ‐ Macro‐economic indicators (2008 – 2011)
2008 2009 2010 2011Growth of GDP 11.6 9.9 9.7 10.9Inflation 25.3 36.4 7.7 10.9Budgetary balance (in % of GDP) ‐3.0 ‐1.0 ‐3.5 ‐3.1Current balance (in % of GDP) ‐5.5 ‐5.3 ‐9.6 ‐7.4
302. The budget health of the economy has improved significantly since 2005/06, with a budget deficit (including grants), which was only of 1 % of GDP in 2008/09. This improvement is the result of tight budget policy, which reduced government expenditure, combined with a marginal increase in domestic revenue and external grants.
303. In recent years, monetary policy was pursued, without success, controlling inflation and stabilizing the exchange rate. A rising since 2005/06, the rate of inflation remains high. It peaked at 36.4 % in 2008/09 against 25.3 % in 2007/08, 15.8 % in 2006/07 and 12.3 % in 2005/06. Soaring foodstuff prices largely explains the record inflation that hit the country between 2007 and 2009.
304. Since 1992/93, Ethiopia has conducted several tax, structural and institutional reforms. However, due to tax evasion and commercial fraud, domestic government revenue compared to GDP fell steadily in the recent years, particularly since 2003/04. They went from 16 % of GDP in 2003/04 to 12 % in 2008/09.
5.9.3 Sectoral performances
305. In 2008/09, the Ethiopian economy has experienced a structural change at the expence of agriculture sector as an engine of the economy in terms of percentage of GDP and growth. The share of agriculture in GDP declined from 51 % in 2000/01 to 44.6 % in 2007/08, then to 43 % in 2008/09.
306. At the same time, with a share of 45 % in the GDP, the segment recorded a volume growth of 14% in 2008/09 against 16 % in 2007/08. This remarkable growth is mainly due to the rapid expansion of financial intermediation, public administration and defense, hotels and restaurants, real estate, renting and business activities.
48 Source : African Development Fund. October 2010
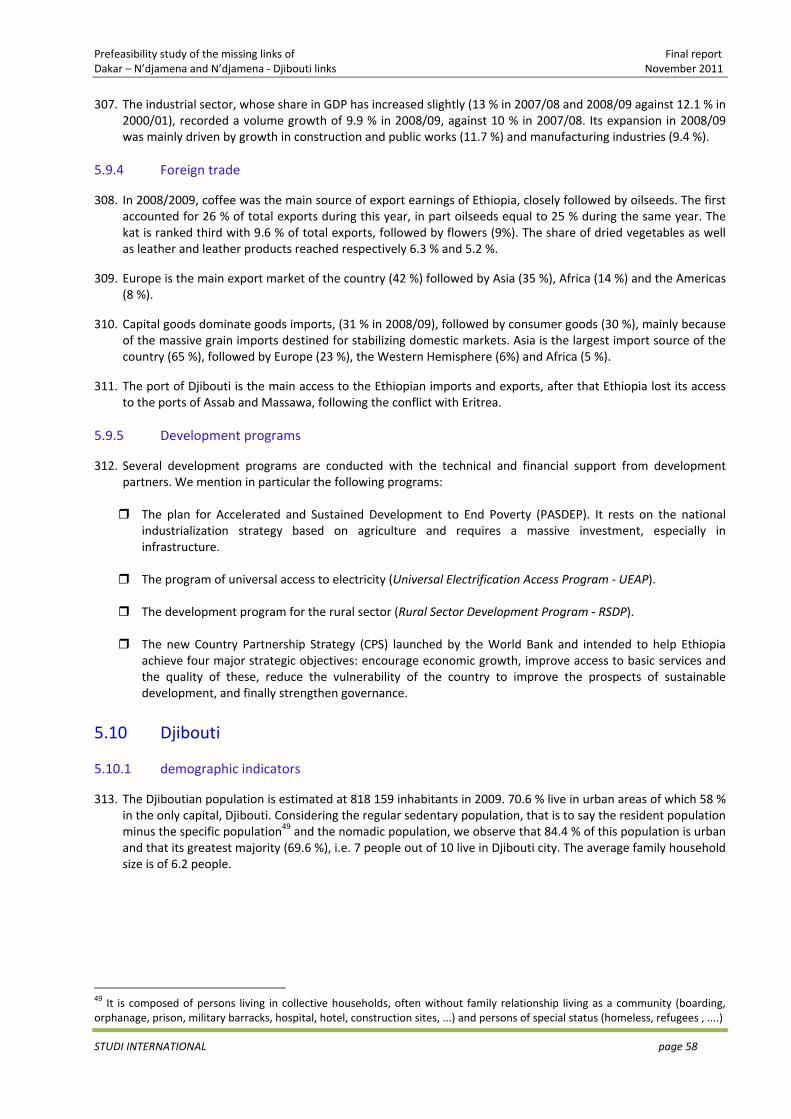
Prefeasibility study of the missing links of Final report Dakar – N’djamena and N’djamena ‐ Djibouti links November 2011
STUDI INTERNATIONAL page 58
307. The industrial sector, whose share in GDP has increased slightly (13 % in 2007/08 and 2008/09 against 12.1 % in 2000/01), recorded a volume growth of 9.9 % in 2008/09, against 10 % in 2007/08. Its expansion in 2008/09 was mainly driven by growth in construction and public works (11.7 %) and manufacturing industries (9.4 %).
5.9.4 Foreign trade
308. In 2008/2009, coffee was the main source of export earnings of Ethiopia, closely followed by oilseeds. The first accounted for 26 % of total exports during this year, in part oilseeds equal to 25 % during the same year. The kat is ranked third with 9.6 % of total exports, followed by flowers (9%). The share of dried vegetables as well as leather and leather products reached respectively 6.3 % and 5.2 %.
309. Europe is the main export market of the country (42 %) followed by Asia (35 %), Africa (14 %) and the Americas (8 %).
310. Capital goods dominate goods imports, (31 % in 2008/09), followed by consumer goods (30 %), mainly because of the massive grain imports destined for stabilizing domestic markets. Asia is the largest import source of the country (65 %), followed by Europe (23 %), the Western Hemisphere (6%) and Africa (5 %).
311. The port of Djibouti is the main access to the Ethiopian imports and exports, after that Ethiopia lost its access to the ports of Assab and Massawa, following the conflict with Eritrea.
5.9.5 Development programs
312. Several development programs are conducted with the technical and financial support from development partners. We mention in particular the following programs:
The plan for Accelerated and Sustained Development to End Poverty (PASDEP). It rests on the national industrialization strategy based on agriculture and requires a massive investment, especially in infrastructure.
The program of universal access to electricity (Universal Electrification Access Program ‐ UEAP).
The development program for the rural sector (Rural Sector Development Program ‐ RSDP).
The new Country Partnership Strategy (CPS) launched by the World Bank and intended to help Ethiopia achieve four major strategic objectives: encourage economic growth, improve access to basic services and the quality of these, reduce the vulnerability of the country to improve the prospects of sustainable development, and finally strengthen governance.
5.10 Djibouti
5.10.1 demographic indicators
313. The Djiboutian population is estimated at 818 159 inhabitants in 2009. 70.6 % live in urban areas of which 58 % in the only capital, Djibouti. Considering the regular sedentary population, that is to say the resident population minus the specific population49 and the nomadic population, we observe that 84.4 % of this population is urban and that its greatest majority (69.6 %), i.e. 7 people out of 10 live in Djibouti city. The average family household size is of 6.2 people.
49 It is composed of persons living in collective households, often without family relationship living as a community (boarding, orphanage, prison, military barracks, hospital, hotel, construction sites, ...) and persons of special status (homeless, refugees , ....)
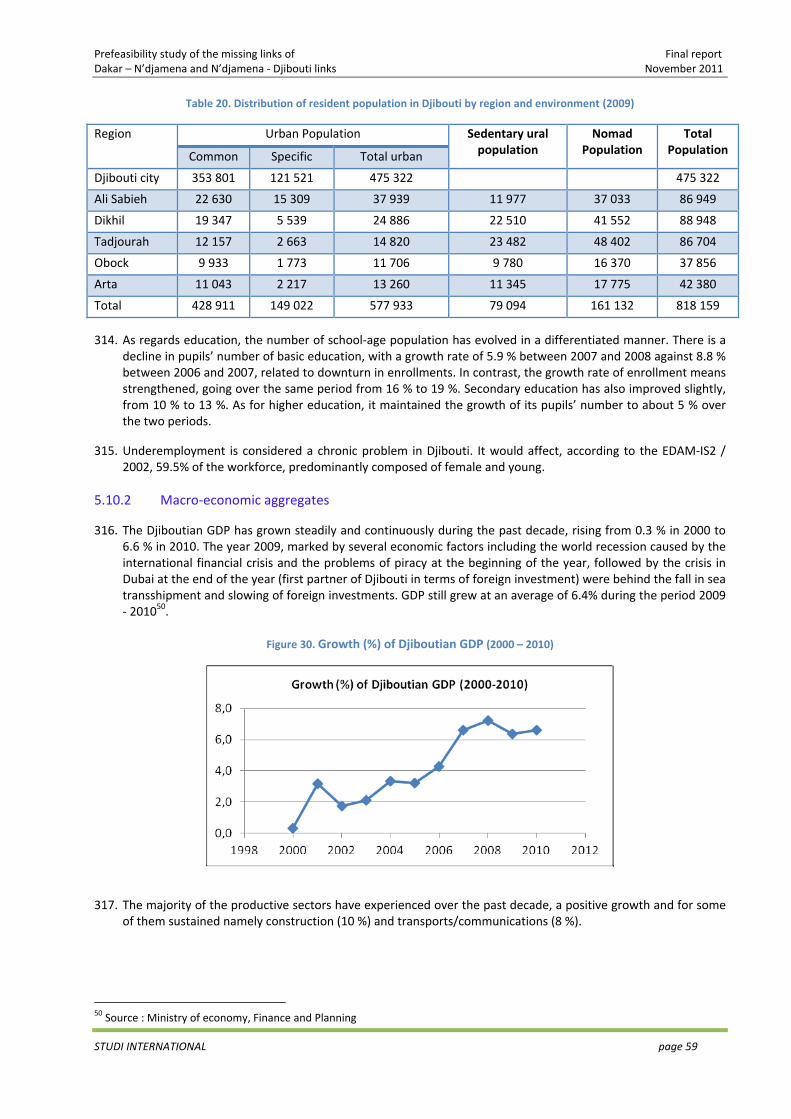
Prefeasibility study of the missing links of Final report Dakar – N’djamena and N’djamena ‐ Djibouti links November 2011
STUDI INTERNATIONAL page 59
Table 20. Distribution of resident population in Djibouti by region and environment (2009)
Region Urban Population Sedentary ural population
Nomad Population
TotalPopulation Common Specific Total urban
Djibouti city 353 801 121 521 475 322 475 322
Ali Sabieh 22 630 15 309 37 939 11 977 37 033 86 949
Dikhil 19 347 5 539 24 886 22 510 41 552 88 948
Tadjourah 12 157 2 663 14 820 23 482 48 402 86 704
Obock 9 933 1 773 11 706 9 780 16 370 37 856
Arta 11 043 2 217 13 260 11 345 17 775 42 380
Total 428 911 149 022 577 933 79 094 161 132 818 159
314. As regards education, the number of school‐age population has evolved in a differentiated manner. There is a decline in pupils’ number of basic education, with a growth rate of 5.9 % between 2007 and 2008 against 8.8 % between 2006 and 2007, related to downturn in enrollments. In contrast, the growth rate of enrollment means strengthened, going over the same period from 16 % to 19 %. Secondary education has also improved slightly, from 10 % to 13 %. As for higher education, it maintained the growth of its pupils’ number to about 5 % over the two periods.
315. Underemployment is considered a chronic problem in Djibouti. It would affect, according to the EDAM‐IS2 / 2002, 59.5% of the workforce, predominantly composed of female and young.
5.10.2 Macro‐economic aggregates
316. The Djiboutian GDP has grown steadily and continuously during the past decade, rising from 0.3 % in 2000 to 6.6 % in 2010. The year 2009, marked by several economic factors including the world recession caused by the international financial crisis and the problems of piracy at the beginning of the year, followed by the crisis in Dubai at the end of the year (first partner of Djibouti in terms of foreign investment) were behind the fall in sea transshipment and slowing of foreign investments. GDP still grew at an average of 6.4% during the period 2009 ‐ 201050.
Figure 30. Growth (%) of Djiboutian GDP (2000 – 2010)
317. The majority of the productive sectors have experienced over the past decade, a positive growth and for some of them sustained namely construction (10 %) and transports/communications (8 %).
50 Source : Ministry of economy, Finance and Planning
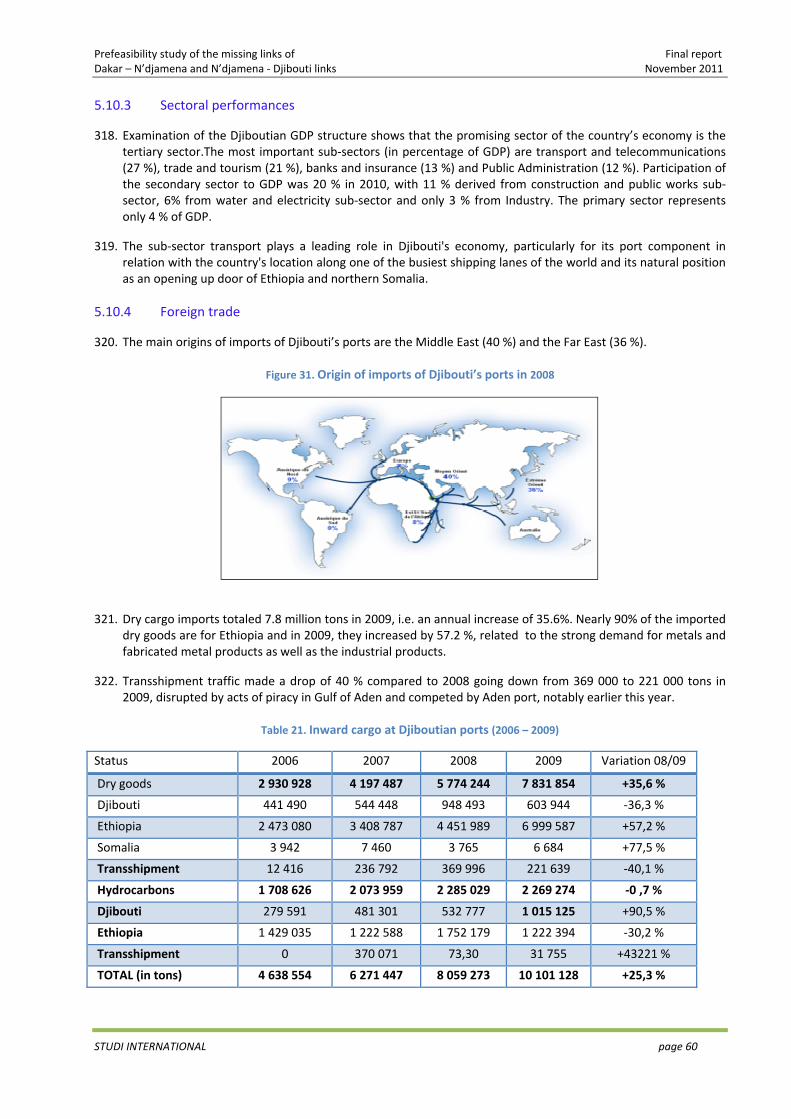
Prefeasibility study of the missing links of Final report Dakar – N’djamena and N’djamena ‐ Djibouti links November 2011
STUDI INTERNATIONAL page 60
5.10.3 Sectoral performances
318. Examination of the Djiboutian GDP structure shows that the promising sector of the country’s economy is the tertiary sector.The most important sub‐sectors (in percentage of GDP) are transport and telecommunications (27 %), trade and tourism (21 %), banks and insurance (13 %) and Public Administration (12 %). Participation of the secondary sector to GDP was 20 % in 2010, with 11 % derived from construction and public works sub‐sector, 6% from water and electricity sub‐sector and only 3 % from Industry. The primary sector represents only 4 % of GDP.
319. The sub‐sector transport plays a leading role in Djibouti's economy, particularly for its port component in relation with the country's location along one of the busiest shipping lanes of the world and its natural position as an opening up door of Ethiopia and northern Somalia.
5.10.4 Foreign trade
320. The main origins of imports of Djibouti’s ports are the Middle East (40 %) and the Far East (36 %).
Figure 31. Origin of imports of Djibouti’s ports in 2008
321. Dry cargo imports totaled 7.8 million tons in 2009, i.e. an annual increase of 35.6%. Nearly 90% of the imported dry goods are for Ethiopia and in 2009, they increased by 57.2 %, related to the strong demand for metals and fabricated metal products as well as the industrial products.
322. Transshipment traffic made a drop of 40 % compared to 2008 going down from 369 000 to 221 000 tons in 2009, disrupted by acts of piracy in Gulf of Aden and competed by Aden port, notably earlier this year.
Table 21. Inward cargo at Djiboutian ports (2006 – 2009)
Status 2006 2007 2008 2009 Variation 08/09
Dry goods 2 930 928 4 197 487 5 774 244 7 831 854 +35,6 %
Djibouti 441 490 544 448 948 493 603 944 ‐36,3 %
Ethiopia 2 473 080 3 408 787 4 451 989 6 999 587 +57,2 %
Somalia 3 942 7 460 3 765 6 684 +77,5 %
Transshipment 12 416 236 792 369 996 221 639 ‐40,1 %
Hydrocarbons 1 708 626 2 073 959 2 285 029 2 269 274 ‐0 ,7 %
Djibouti 279 591 481 301 532 777 1 015 125 +90,5 %
Ethiopia 1 429 035 1 222 588 1 752 179 1 222 394 ‐30,2 %
Transshipment 0 370 071 73,30 31 755 +43221 %
TOTAL (in tons) 4 638 554 6 271 447 8 059 273 10 101 128 +25,3 %
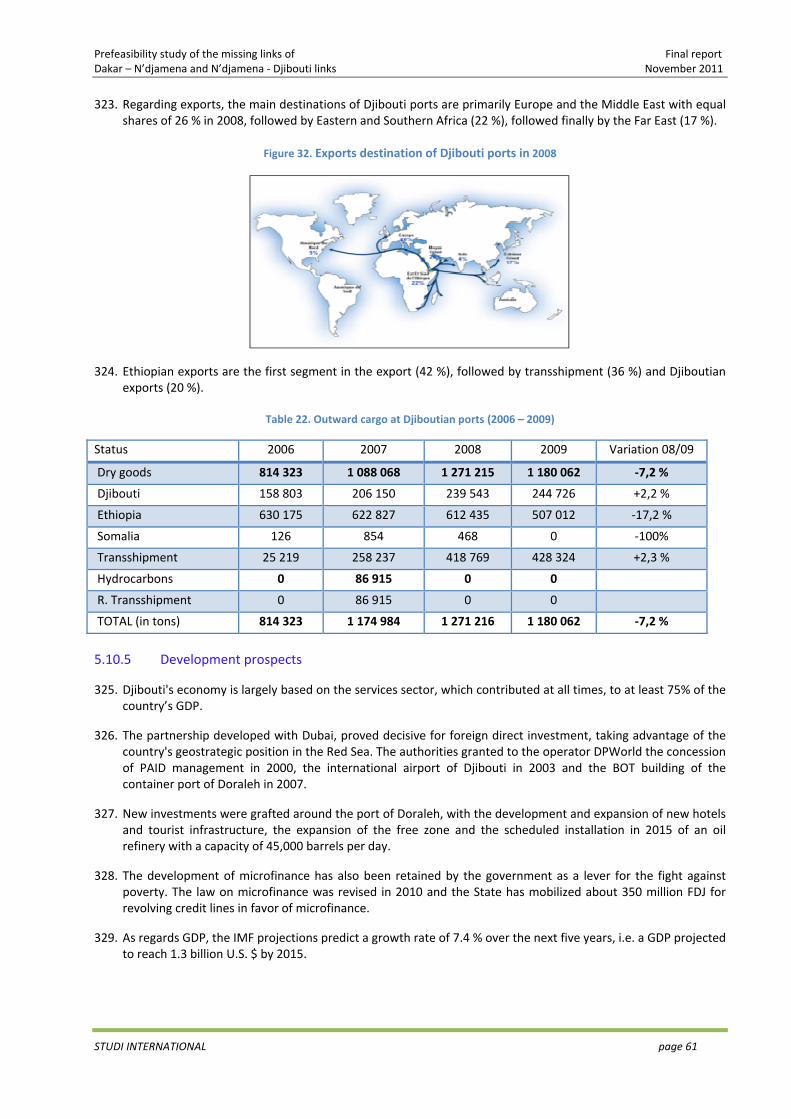
Prefeasibility study of the missing links of Final report Dakar – N’djamena and N’djamena ‐ Djibouti links November 2011
STUDI INTERNATIONAL page 61
323. Regarding exports, the main destinations of Djibouti ports are primarily Europe and the Middle East with equal shares of 26 % in 2008, followed by Eastern and Southern Africa (22 %), followed finally by the Far East (17 %).
Figure 32. Exports destination of Djibouti ports in 2008
324. Ethiopian exports are the first segment in the export (42 %), followed by transshipment (36 %) and Djiboutian exports (20 %).
Table 22. Outward cargo at Djiboutian ports (2006 – 2009)
Status 2006 2007 2008 2009 Variation 08/09
Dry goods 814 323 1 088 068 1 271 215 1 180 062 ‐7,2 %
Djibouti 158 803 206 150 239 543 244 726 +2,2 %
Ethiopia 630 175 622 827 612 435 507 012 ‐17,2 %
Somalia 126 854 468 0 ‐100%
Transshipment 25 219 258 237 418 769 428 324 +2,3 %
Hydrocarbons 0 86 915 0 0
R. Transshipment 0 86 915 0 0
TOTAL (in tons) 814 323 1 174 984 1 271 216 1 180 062 ‐7,2 %
5.10.5 Development prospects
325. Djibouti's economy is largely based on the services sector, which contributed at all times, to at least 75% of the country’s GDP.
326. The partnership developed with Dubai, proved decisive for foreign direct investment, taking advantage of the country's geostrategic position in the Red Sea. The authorities granted to the operator DPWorld the concession of PAID management in 2000, the international airport of Djibouti in 2003 and the BOT building of the container port of Doraleh in 2007.
327. New investments were grafted around the port of Doraleh, with the development and expansion of new hotels and tourist infrastructure, the expansion of the free zone and the scheduled installation in 2015 of an oil refinery with a capacity of 45,000 barrels per day.
328. The development of microfinance has also been retained by the government as a lever for the fight against poverty. The law on microfinance was revised in 2010 and the State has mobilized about 350 million FDJ for revolving credit lines in favor of microfinance.
329. As regards GDP, the IMF projections predict a growth rate of 7.4 % over the next five years, i.e. a GDP projected to reach 1.3 billion U.S. $ by 2015.
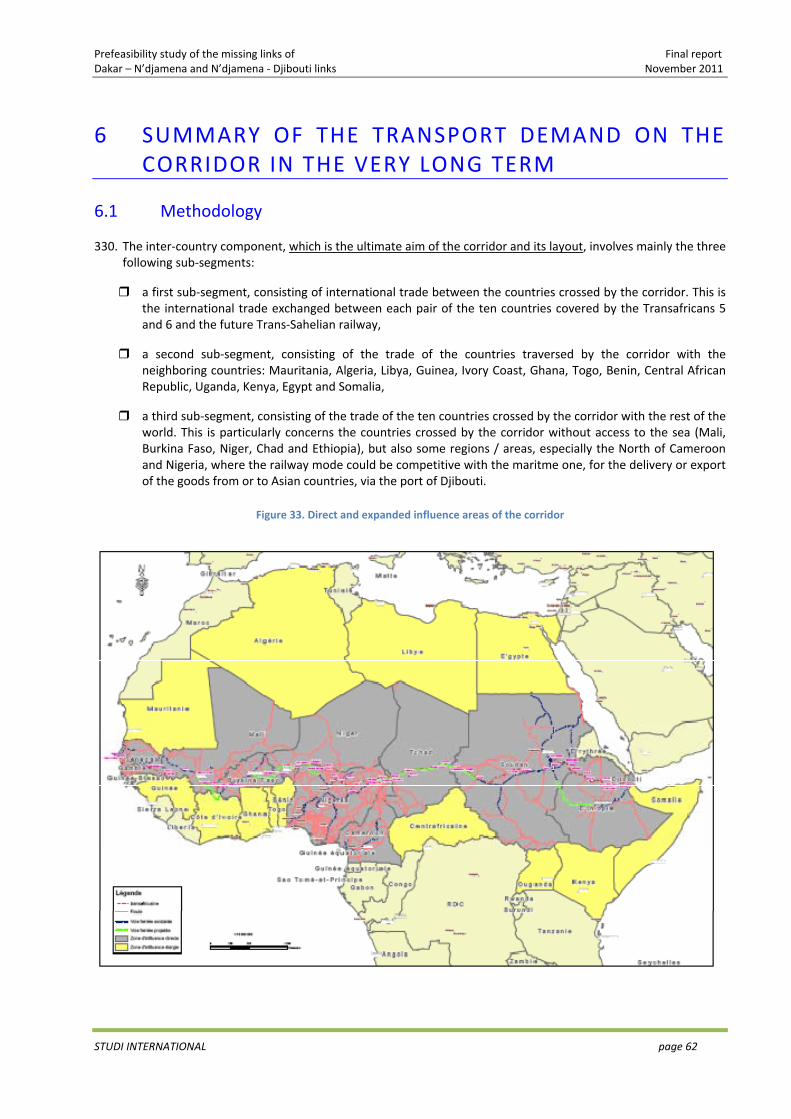
Prefeasibility study of the missing links of Final report Dakar – N’djamena and N’djamena ‐ Djibouti links November 2011
STUDI INTERNATIONAL page 62
6 SUMMARY OF THE TRANSPORT DEMAND ON THE CORRIDOR IN THE VERY LONG TERM
6.1 Methodology
330. The inter‐country component, which is the ultimate aim of the corridor and its layout, involves mainly the three following sub‐segments:
a first sub‐segment, consisting of international trade between the countries crossed by the corridor. This is the international trade exchanged between each pair of the ten countries covered by the Transafricans 5 and 6 and the future Trans‐Sahelian railway,
a second sub‐segment, consisting of the trade of the countries traversed by the corridor with the neighboring countries: Mauritania, Algeria, Libya, Guinea, Ivory Coast, Ghana, Togo, Benin, Central African Republic, Uganda, Kenya, Egypt and Somalia,
a third sub‐segment, consisting of the trade of the ten countries crossed by the corridor with the rest of the world. This is particularly concerns the countries crossed by the corridor without access to the sea (Mali, Burkina Faso, Niger, Chad and Ethiopia), but also some regions / areas, especially the North of Cameroon and Nigeria, where the railway mode could be competitive with the maritme one, for the delivery or export of the goods from or to Asian countries, via the port of Djibouti.
Figure 33. Direct and expanded influence areas of the corridor
Prefeasibility study of the missing links of Final report Dakar – N’djamena and N’djamena ‐ Djibouti links November 2011
STUDI INTERNATIONAL page 63
331. The inter‐country trade is evaluated by estimating the additional import (export) that will emerge by the fact that the built corridor will provide access to natural resources untapped before. Regarding the endogenous impact (without new resources), the evolution of international trade is estimated by the effect of changes in the transport cost on traffic. It is assumed that the elasticity of the trade between two countries with respect to transportation costs is of 1.2.
332. Two scenarios of GDP growth are identified: (i) a trend scenario, which holds the maintenance in the very long‐term of the growth rate observed during the 2005 ‐ 2008 period, taking into account the target value of convergence of the African countries’ economy, set at 6% for the long term and at 5% in the very long term, (ii) a high scenario, which holds a gradual improvement in the business climate of the countries included in the direct and expanded influence area of the corridor and the same rate of convergence. This scenario also takes into account the effect of " Africa’s integration ", estimated by the study on the quantification of scenarios for rationalization of the RECs (2011), which assesses the growth of GDP and imports by country between the reference year (2008) and the year of implementation of the integration
333. Transport demand in the very long term is directly derived from the matrix of international trade very in the very long term, converted to tonne, from the data (Q, V) 51 obtained through the database TradeMap (average of last three years ) and trade statistics of foreign tarde provided by national statistical institutes of countries of the direct and expanded influence zones of the corridor.The difference between the situation "with project" and "without project", is the contribution of the development of the corridor (depending on the alternative ‐ road, rail, road and rail ‐) in terms of international trade.
334. A redeployment of trade following the development of the missing links of the corridor can be due to the differential in the transportation costs pertaining respectively to the two situations : before and after the project.
335. In order to achieve the objectives of the study and especially the assessment of the international trade in the long and the very long term between the countries involved by the corridor, a comprehensive model of international trade estimates (integrating all African countries) was developped, including for each country, what follows:
data of imports (exports) per sector in 2008, the 2008 GDP, the population for 2008, parameters related to the business climate, the elasticity of transport costs regarding imports
(exports), the share of each sub‐sector in GDP for 2008, two scenarios of GDP growth: trend and high (with african integration), target rates of the GDP growth.
336. The intra‐country component concerns mainly the road section. This affects in particular the Camerounian sections (85 km) of the Transafrican 5 and Tchadian (166 km), Sudanese (611 km), Ethiopian (565 km) and Djiboutian (100 km) sections of the missing links of the Transafrican 6, where the pavement condition is qualified as degraded. Their leveling would allow a significant reduction in the transport costs, which may reach 30 %.
6.2 Trade in 2008
337. The review of trade in 2008 of the countries crossed by the corridor and the countries bordering them reveals the following main observations :
Trade between the countries crossed by the Dakar – Djibouti corridor reached in 2008, an amount of 2.6 billion US$, representing about 4 % of the total volume of foreign trade generated by these countries. The dominating four countries can be identified as : Nigeria, Senegal, Cameroon and Mali, which, globally, account respectively for 80% of the imports and 88% of the exports.
51 Q : Quantity, V : Value
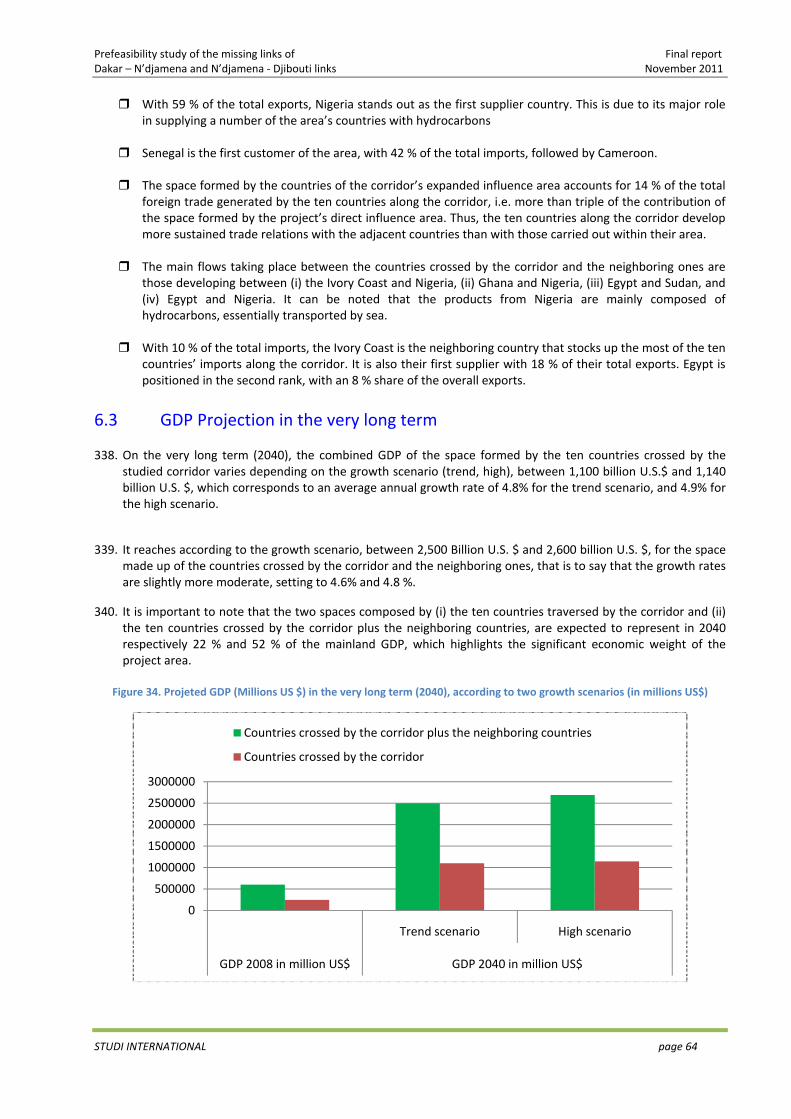
Prefeasibility study of the missing links of Final report Dakar – N’djamena and N’djamena ‐ Djibouti links November 2011
STUDI INTERNATIONAL page 64
With 59 % of the total exports, Nigeria stands out as the first supplier country. This is due to its major role in supplying a number of the area’s countries with hydrocarbons
Senegal is the first customer of the area, with 42 % of the total imports, followed by Cameroon.
The space formed by the countries of the corridor’s expanded influence area accounts for 14 % of the total foreign trade generated by the ten countries along the corridor, i.e. more than triple of the contribution of the space formed by the project’s direct influence area. Thus, the ten countries along the corridor develop more sustained trade relations with the adjacent countries than with those carried out within their area.
The main flows taking place between the countries crossed by the corridor and the neighboring ones are those developing between (i) the Ivory Coast and Nigeria, (ii) Ghana and Nigeria, (iii) Egypt and Sudan, and (iv) Egypt and Nigeria. It can be noted that the products from Nigeria are mainly composed of hydrocarbons, essentially transported by sea.
With 10 % of the total imports, the Ivory Coast is the neighboring country that stocks up the most of the ten countries’ imports along the corridor. It is also their first supplier with 18 % of their total exports. Egypt is positioned in the second rank, with an 8 % share of the overall exports.
6.3 GDP Projection in the very long term
338. On the very long term (2040), the combined GDP of the space formed by the ten countries crossed by the studied corridor varies depending on the growth scenario (trend, high), between 1,100 billion U.S.$ and 1,140 billion U.S. $, which corresponds to an average annual growth rate of 4.8% for the trend scenario, and 4.9% for the high scenario.
339. It reaches according to the growth scenario, between 2,500 Billion U.S. $ and 2,600 billion U.S. $, for the space made up of the countries crossed by the corridor and the neighboring ones, that is to say that the growth rates are slightly more moderate, setting to 4.6% and 4.8 %.
340. It is important to note that the two spaces composed by (i) the ten countries traversed by the corridor and (ii) the ten countries crossed by the corridor plus the neighboring countries, are expected to represent in 2040 respectively 22 % and 52 % of the mainland GDP, which highlights the significant economic weight of the project area.
Figure 34. Projeted GDP (Millions US $) in the very long term (2040), according to two growth scenarios (in millions US$)
0
500000
1000000
1500000
2000000
2500000
3000000
Trend scenario High scenario
GDP 2008 in million US$ GDP 2040 in million US$
Countries crossed by the corridor plus the neighboring countries
Countries crossed by the corridor
Prefeasibility study of the missing links of Final report Dakar – N’djamena and N’djamena ‐ Djibouti links November 2011
STUDI INTERNATIONAL page 65
6.4 Evaluation of trade in the very long term
341. The trade assessment for the very long term pertaining to the countries of the direct and expanded influence areas of the corridor, in the respective situations "without project" and "with project", highlights the following main results.
6.4.1 Base situation
342. Trading between the countries crossed by the corridor, estimated at 2.6 billion U.S. $ in 2008, will reach an average of 10 billion U.S. $ in 2040, i.e. 3.5 times the level observed in 2008, and an average growth rate of 4% per year.
343. Reasoning on the expanded influence area (10 countries crossed by the corridor + neighboring countries), the international trade, equal to 9.8 billion U.S. $ in 2008, would reach an average of 41.3 billion U.S. $ in 2040, i.e. 4.6 times the level already observed in 2008, and an average annual growth rate of 4.5 %.
Table 23. 2008 Trading (in billion US$) between countries crossed by the corridor and with neighboring Countries and
projections in 2040 for the situation without projet
Projections 2040 Situation 2008 Trend scenario High scenario Trading of intra‐Countries crossed by the corridor
2.6 8.85 11.08
Trading of intra‐Countries crossed by the corridor and with the neighboring countries
9.8 38.00 44.55
6.4.2 Project situation
344. The reduction in the transport costs, due to the leveling of the road and rail missing links of the corridor will be the main contribution of the project. This reduction will generate a gain in terms of cost of provision and shipment of exports from countries covered and adjacent to the corridor and improves thus, in quantity, trading between these countries.
345. The reduction in the transport costs between each pair of involved countries in the project depends on the goods’ transport modes, but also on the corridor’s share in this trading.
346. For each pair of countries, the percentage of the transport costs’ reduction depends on the two following main parameters :
part of the developed section in relation to the total length of the route, share of the trade between the different transport modes and the road / rail routes.
347. The contribution of the development of the road and rail missing links is measured by the difference between the quantities exchanged between each pair of countries in the situations « without project » and « with project ».
6.4.2.1 Road component
348. The impact’s simulation of the road facilities shows a rather limited increase of trade. This reflects the weakness of the damaged road sections (missing links), compared to the total length of the trade routes. The road missing links are indeed concentrated mainly at the East of the Continent and their leveling would allow, on average for all the trade routes, gains in the transportation costs, not exceeding 1.5 %.
Prefeasibility study of the missing links of Final report Dakar – N’djamena and N’djamena ‐ Djibouti links November 2011
STUDI INTERNATIONAL page 66
Table 24. 2008 Trading in (in billion US$) between countries crossed by the corridor and with the neighboring countries and projections in 2040 for the situation with project ‐Road component
Projections 2040 Situation 2008 Trend scenario High scenario Trading of intra‐Countries crossed by the corridor
2.6 8.93 11.14
Trading of intra‐Countries crossed by the corridor and with the neighboring countries
9.8 38.22 44.79
6.4.2.2 Railway component
349. Trade between the ten countries crossed by the corridor and the neighboring countries, estimated at 9.8 billion in 2008, would reach on average, 41.6 billion U.S. $ in 2040 (38.3 billion U.S. $ for the trend scenario and 44.94 billion U.S. $ for the high scenario).
350. The missing links’ construction of the railway between Dakar and Djibouti, will allow to all trade routes, gains in the transportation costs by an average of 4.2 %.
Table 25. 2008 Trading (in billion US$) between countries crossed by the corridor and with neighboring countries and
projections in 2040 for the situation with projet ‐ Railway component
Projections 2040 Situation 2008 Trend scenario High scenario Trading of intra‐Countries crossed by the corridor
2.6 9.19 11.45
Trading of intra‐Countries crossed by the corridor and with the neighboring countries
9.8 38.30 44.94
6.4.2.3 Road and railway component
351. The simultaneous development of both the road and rail missing links will affect the transportation costs on the Dakar‐Djibouti corridor, similar to that of the development of the rail tracks only. This is explained by the weakness of the damaged road sections compared to the total length of routes.
6.5 Transport demand in the very long term ‐ The international component
352. The conversion to tones of the international trade matrix enables to evaluate the road and rail traffic projected in the very long term. The project's contribution is determined using the difference between the values of trade (in tones) of the two situations without and with project.
353. The leveling of the road missing links and the construction of the rail missing links will result in a redeployment of trade, which is manifested by a sign «‐ » preceding the values of traded quantities.
354. It is also necessary to take into account the diverted traffic flows, particularly at the expense of the maritime mode, in relation to trade of the countries included within the expanded and direct influence areas of the corridor with the rest of the world. For the railway component, it is also necessary to take into account the generated traffic by the mineral deposits covered by the corridor, especially Burkina Faso, Sudan and Ethiopia.
6.5.1 Road alternative
355. In the space made up of the ten countries crossed by the Dakar – Djibouti corridor, the road corridor should pick depending on the trend or the high growth scenario, between 6.5 and 7.4 million tons in 2030 and between 9.4 and 11.6 million tons by 2040, representing around 58 % of the total intra‐countries trade of the project’s direct area. The rest should be made on other road routes or by sea, especially when it comes to the coastal countries.
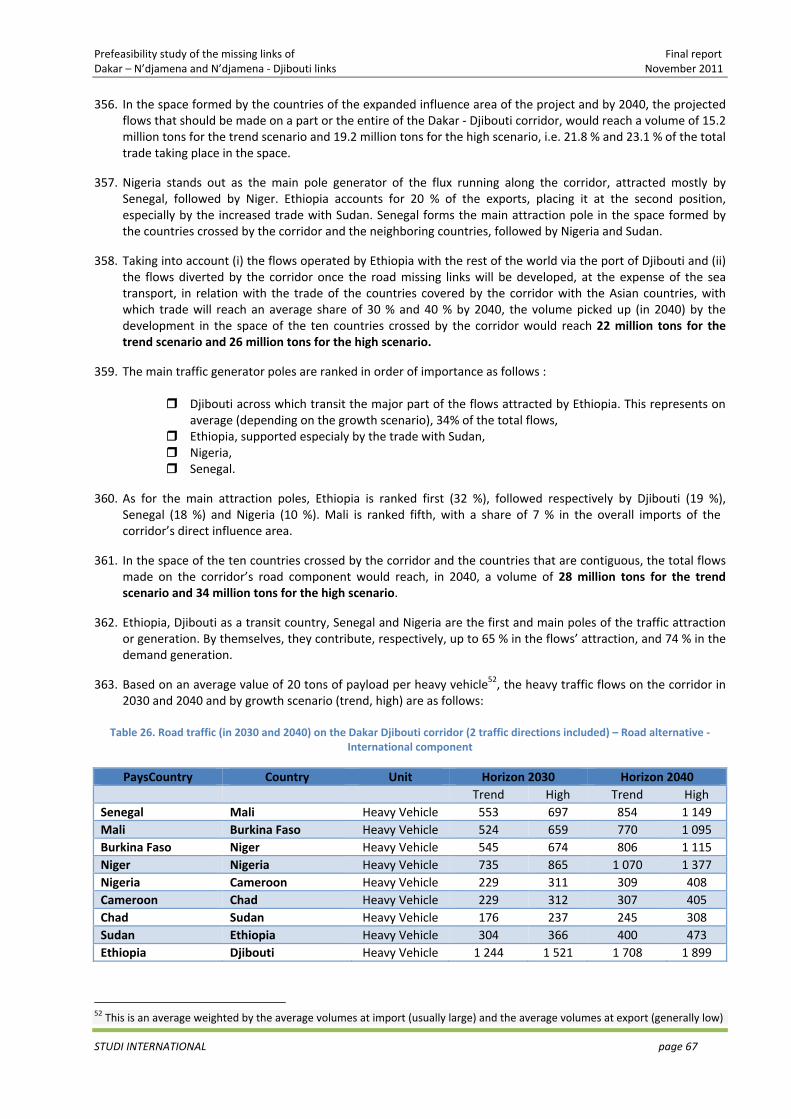
Prefeasibility study of the missing links of Final report Dakar – N’djamena and N’djamena ‐ Djibouti links November 2011
STUDI INTERNATIONAL page 67
356. In the space formed by the countries of the expanded influence area of the project and by 2040, the projected flows that should be made on a part or the entire of the Dakar ‐ Djibouti corridor, would reach a volume of 15.2 million tons for the trend scenario and 19.2 million tons for the high scenario, i.e. 21.8 % and 23.1 % of the total trade taking place in the space.
357. Nigeria stands out as the main pole generator of the flux running along the corridor, attracted mostly by Senegal, followed by Niger. Ethiopia accounts for 20 % of the exports, placing it at the second position, especially by the increased trade with Sudan. Senegal forms the main attraction pole in the space formed by the countries crossed by the corridor and the neighboring countries, followed by Nigeria and Sudan.
358. Taking into account (i) the flows operated by Ethiopia with the rest of the world via the port of Djibouti and (ii) the flows diverted by the corridor once the road missing links will be developed, at the expense of the sea transport, in relation with the trade of the countries covered by the corridor with the Asian countries, with which trade will reach an average share of 30 % and 40 % by 2040, the volume picked up (in 2040) by the development in the space of the ten countries crossed by the corridor would reach 22 million tons for the trend scenario and 26 million tons for the high scenario.
359. The main traffic generator poles are ranked in order of importance as follows :
Djibouti across which transit the major part of the flows attracted by Ethiopia. This represents on average (depending on the growth scenario), 34% of the total flows,
Ethiopia, supported especialy by the trade with Sudan, Nigeria, Senegal.
360. As for the main attraction poles, Ethiopia is ranked first (32 %), followed respectively by Djibouti (19 %), Senegal (18 %) and Nigeria (10 %). Mali is ranked fifth, with a share of 7 % in the overall imports of the corridor’s direct influence area.
361. In the space of the ten countries crossed by the corridor and the countries that are contiguous, the total flows made on the corridor’s road component would reach, in 2040, a volume of 28 million tons for the trend scenario and 34 million tons for the high scenario.
362. Ethiopia, Djibouti as a transit country, Senegal and Nigeria are the first and main poles of the traffic attraction or generation. By themselves, they contribute, respectively, up to 65 % in the flows’ attraction, and 74 % in the demand generation.
363. Based on an average value of 20 tons of payload per heavy vehicle52, the heavy traffic flows on the corridor in 2030 and 2040 and by growth scenario (trend, high) are as follows:
Table 26. Road traffic (in 2030 and 2040) on the Dakar Djibouti corridor (2 traffic directions included) – Road alternative ‐
International component
PaysCountry Country Unit Horizon 2030 Horizon 2040Trend High Trend High
Senegal Mali Heavy Vehicle 553 697 854 1 149Mali Burkina Faso Heavy Vehicle 524 659 770 1 095Burkina Faso Niger Heavy Vehicle 545 674 806 1 115Niger Nigeria Heavy Vehicle 735 865 1 070 1 377Nigeria Cameroon Heavy Vehicle 229 311 309 408Cameroon Chad Heavy Vehicle 229 312 307 405Chad Sudan Heavy Vehicle 176 237 245 308Sudan Ethiopia Heavy Vehicle 304 366 400 473Ethiopia Djibouti Heavy Vehicle 1 244 1 521 1 708 1 899
52 This is an average weighted by the average volumes at import (usually large) and the average volumes at export (generally low)
Prefeasibility study of the missing links of Final report Dakar – N’djamena and N’djamena ‐ Djibouti links November 2011
STUDI INTERNATIONAL page 68
6.5.2 Railway alternative
364. The commissioning of the railway line should cause a modal redistribution of the traffic taking place between the countries in the expanded and direct influence areas of the corridor, between the road, rail modes and to a lesser extent the maritime mode.
365. The estimate of the railway share in the transport demand of the project’s influence area is established by taking into account the effects’ addition of the two following factors :
transfer of flows normally taking place by other modes (road and sea) towards the railway mode, which should be, for some traffic, an advantage compared with the existing solutions,
the appearance of an induced traffic, following the reduction in the generalized transport costs, driven by the introduction of railways in the transport system of the project’s influence area (direct and expanded).
366. Regarding the first component (transfer of flows), for each pair of countries, it was conducted a comparative examination of the railway alternative in comparison with the road and sea options, an analysis that resulted in the development of four matrixes with modal distribution of the flows taking place within the space of the project service area:
Matrix 1 : share of the railway mode Matrix 2 : share of the maritime mode Matrix 3 : share of the road mode Matrix 4 : share of the corridor’s road component in the flows taking place by road
367. Regarding the second component (induced traffic), it is the traffic generated by the reduction in the transport costs as a result of the introduction of the railway alternative.
368. Two possibilities arise according to the studied alternative. For the railway alternative, the gain in the transport costs is calculated compared to a road alternative with the missing links (undeveloped). As for the railway ‐ road alternative, the gain is measured against a fully developed road solution.
369. The results of these analyses, modal distribution and coefficients of transport cost reduction, are then injected into the traffic forecasting model.
370. The redistribution of flows between the two road and railway modes, which should be generated following the commissioning of the railway line, shows that in the direct service area, the railway line should capture in the very long term (2040), 38 % of the flows drained by the Dakar ‐ Djibouti corridor (i.e. 4.2 million tons for the trend scenario and 5.2 million tons for the high scenario), against 62 % for the road alternative. Both modes will ensure 68 % of the trade of the intra‐countries traversed by the corridor.
371. For the space formed by the countries of the project’s expanded service area, the flows to operate on a part or on the entire Dakar ‐ Djibouti corridor by the two modes, road and rail, should ensure on average (for the two growth scenarios), 25 % of the trade operated in the space by 2030, and 26 % by 2040. The flows are divided between the two modes as follows:
44 % for the railway, 56 % for the road.
372. If we include the trade of the countries crossed by the corridor within the rest of the world, as well as the traffic generated by the mining deposits covered by the infrastructure, the railway will capture in the very long term (2040), 10.4 million tons for the trend scenario and 12.8 million tons for the high scenario. The countries the most affected by this trade (whether in terms of issue or attraction) are Ethiopia, Djibouti (as a transit country), Nigeria, Senegal and Mali.
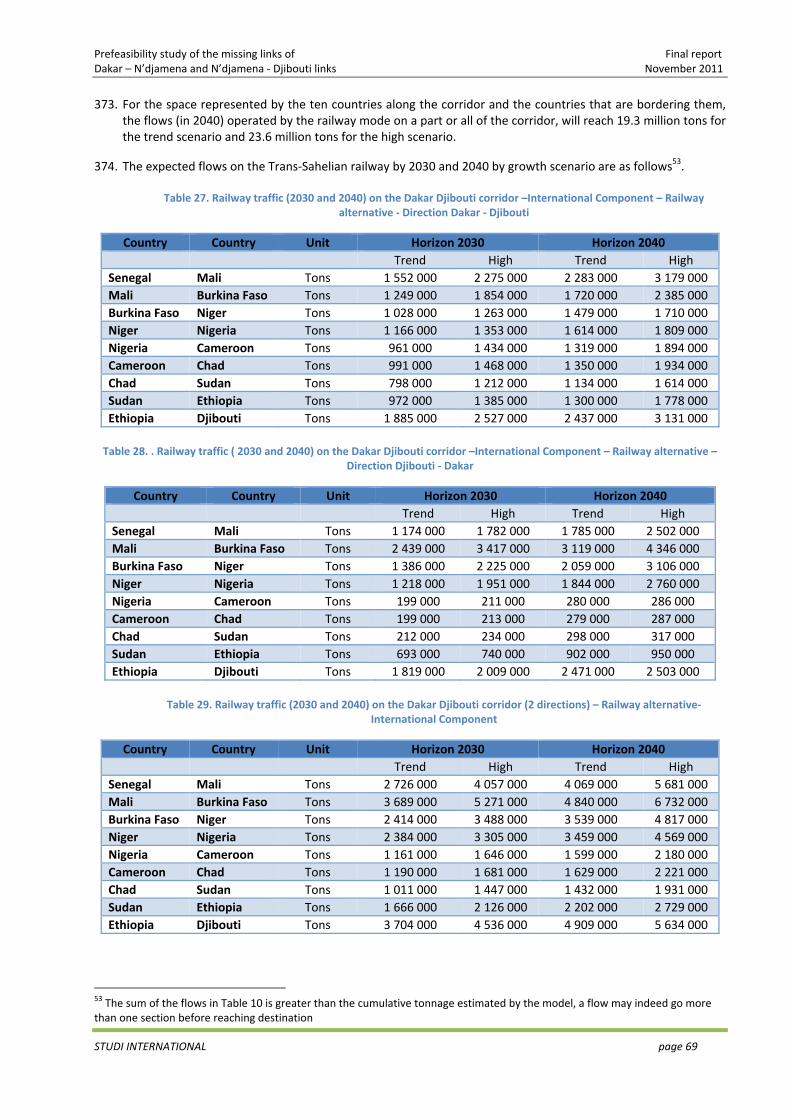
Prefeasibility study of the missing links of Final report Dakar – N’djamena and N’djamena ‐ Djibouti links November 2011
STUDI INTERNATIONAL page 69
373. For the space represented by the ten countries along the corridor and the countries that are bordering them, the flows (in 2040) operated by the railway mode on a part or all of the corridor, will reach 19.3 million tons for the trend scenario and 23.6 million tons for the high scenario.
374. The expected flows on the Trans‐Sahelian railway by 2030 and 2040 by growth scenario are as follows53.
Table 27. Railway traffic (2030 and 2040) on the Dakar Djibouti corridor –International Component – Railway alternative ‐ Direction Dakar ‐ Djibouti
Country Country Unit Horizon 2030 Horizon 2040 Trend High Trend High
Senegal Mali Tons 1 552 000 2 275 000 2 283 000 3 179 000Mali Burkina Faso Tons 1 249 000 1 854 000 1 720 000 2 385 000Burkina Faso Niger Tons 1 028 000 1 263 000 1 479 000 1 710 000Niger Nigeria Tons 1 166 000 1 353 000 1 614 000 1 809 000Nigeria Cameroon Tons 961 000 1 434 000 1 319 000 1 894 000Cameroon Chad Tons 991 000 1 468 000 1 350 000 1 934 000Chad Sudan Tons 798 000 1 212 000 1 134 000 1 614 000Sudan Ethiopia Tons 972 000 1 385 000 1 300 000 1 778 000Ethiopia Djibouti Tons 1 885 000 2 527 000 2 437 000 3 131 000
Table 28. . Railway traffic ( 2030 and 2040) on the Dakar Djibouti corridor –International Component – Railway alternative –
Direction Djibouti ‐ Dakar
Country Country Unit Horizon 2030 Horizon 2040 Trend High Trend High
Senegal Mali Tons 1 174 000 1 782 000 1 785 000 2 502 000Mali Burkina Faso Tons 2 439 000 3 417 000 3 119 000 4 346 000Burkina Faso Niger Tons 1 386 000 2 225 000 2 059 000 3 106 000Niger Nigeria Tons 1 218 000 1 951 000 1 844 000 2 760 000Nigeria Cameroon Tons 199 000 211 000 280 000 286 000Cameroon Chad Tons 199 000 213 000 279 000 287 000Chad Sudan Tons 212 000 234 000 298 000 317 000Sudan Ethiopia Tons 693 000 740 000 902 000 950 000Ethiopia Djibouti Tons 1 819 000 2 009 000 2 471 000 2 503 000
Table 29. Railway traffic (2030 and 2040) on the Dakar Djibouti corridor (2 directions) – Railway alternative‐
International Component
Country Country Unit Horizon 2030 Horizon 2040 Trend High Trend High
Senegal Mali Tons 2 726 000 4 057 000 4 069 000 5 681 000Mali Burkina Faso Tons 3 689 000 5 271 000 4 840 000 6 732 000Burkina Faso Niger Tons 2 414 000 3 488 000 3 539 000 4 817 000Niger Nigeria Tons 2 384 000 3 305 000 3 459 000 4 569 000Nigeria Cameroon Tons 1 161 000 1 646 000 1 599 000 2 180 000Cameroon Chad Tons 1 190 000 1 681 000 1 629 000 2 221 000Chad Sudan Tons 1 011 000 1 447 000 1 432 000 1 931 000Sudan Ethiopia Tons 1 666 000 2 126 000 2 202 000 2 729 000Ethiopia Djibouti Tons 3 704 000 4 536 000 4 909 000 5 634 000
53 The sum of the flows in Table 10 is greater than the cumulative tonnage estimated by the model, a flow may indeed go more than one section before reaching destination
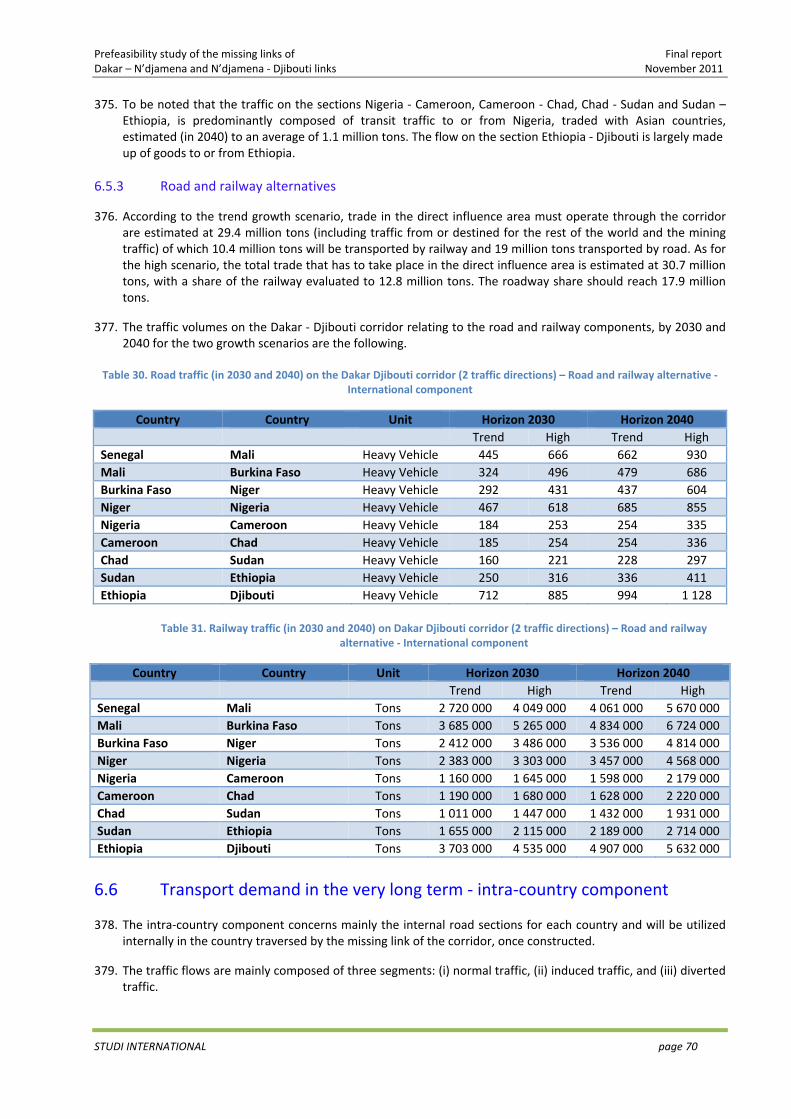
Prefeasibility study of the missing links of Final report Dakar – N’djamena and N’djamena ‐ Djibouti links November 2011
STUDI INTERNATIONAL page 70
375. To be noted that the traffic on the sections Nigeria ‐ Cameroon, Cameroon ‐ Chad, Chad ‐ Sudan and Sudan – Ethiopia, is predominantly composed of transit traffic to or from Nigeria, traded with Asian countries, estimated (in 2040) to an average of 1.1 million tons. The flow on the section Ethiopia ‐ Djibouti is largely made up of goods to or from Ethiopia.
6.5.3 Road and railway alternatives
376. According to the trend growth scenario, trade in the direct influence area must operate through the corridor are estimated at 29.4 million tons (including traffic from or destined for the rest of the world and the mining traffic) of which 10.4 million tons will be transported by railway and 19 million tons transported by road. As for the high scenario, the total trade that has to take place in the direct influence area is estimated at 30.7 million tons, with a share of the railway evaluated to 12.8 million tons. The roadway share should reach 17.9 million tons.
377. The traffic volumes on the Dakar ‐ Djibouti corridor relating to the road and railway components, by 2030 and 2040 for the two growth scenarios are the following.
Table 30. Road traffic (in 2030 and 2040) on the Dakar Djibouti corridor (2 traffic directions) – Road and railway alternative ‐
International component
Country Country Unit Horizon 2030 Horizon 2040Trend High Trend High
Senegal Mali Heavy Vehicle 445 666 662 930Mali Burkina Faso Heavy Vehicle 324 496 479 686Burkina Faso Niger Heavy Vehicle 292 431 437 604Niger Nigeria Heavy Vehicle 467 618 685 855Nigeria Cameroon Heavy Vehicle 184 253 254 335Cameroon Chad Heavy Vehicle 185 254 254 336Chad Sudan Heavy Vehicle 160 221 228 297Sudan Ethiopia Heavy Vehicle 250 316 336 411Ethiopia Djibouti Heavy Vehicle 712 885 994 1 128
Table 31. Railway traffic (in 2030 and 2040) on Dakar Djibouti corridor (2 traffic directions) – Road and railway alternative ‐ International component
Country Country Unit Horizon 2030 Horizon 2040Trend High Trend High
Senegal Mali Tons 2 720 000 4 049 000 4 061 000 5 670 000Mali Burkina Faso Tons 3 685 000 5 265 000 4 834 000 6 724 000Burkina Faso Niger Tons 2 412 000 3 486 000 3 536 000 4 814 000Niger Nigeria Tons 2 383 000 3 303 000 3 457 000 4 568 000Nigeria Cameroon Tons 1 160 000 1 645 000 1 598 000 2 179 000Cameroon Chad Tons 1 190 000 1 680 000 1 628 000 2 220 000Chad Sudan Tons 1 011 000 1 447 000 1 432 000 1 931 000Sudan Ethiopia Tons 1 655 000 2 115 000 2 189 000 2 714 000Ethiopia Djibouti Tons 3 703 000 4 535 000 4 907 000 5 632 000
6.6 Transport demand in the very long term ‐ intra‐country component
378. The intra‐country component concerns mainly the internal road sections for each country and will be utilized internally in the country traversed by the missing link of the corridor, once constructed.
379. The traffic flows are mainly composed of three segments: (i) normal traffic, (ii) induced traffic, and (iii) diverted traffic.
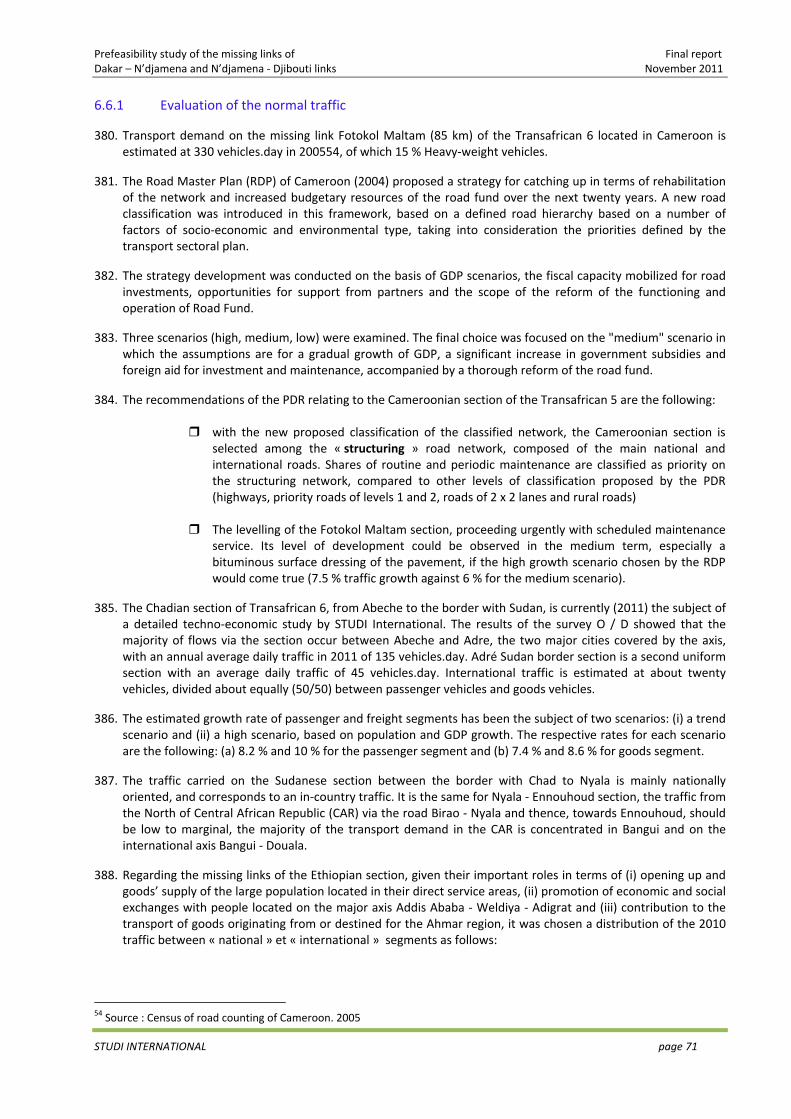
Prefeasibility study of the missing links of Final report Dakar – N’djamena and N’djamena ‐ Djibouti links November 2011
STUDI INTERNATIONAL page 71
6.6.1 Evaluation of the normal traffic
380. Transport demand on the missing link Fotokol Maltam (85 km) of the Transafrican 6 located in Cameroon is estimated at 330 vehicles.day in 200554, of which 15 % Heavy‐weight vehicles.
381. The Road Master Plan (RDP) of Cameroon (2004) proposed a strategy for catching up in terms of rehabilitation of the network and increased budgetary resources of the road fund over the next twenty years. A new road classification was introduced in this framework, based on a defined road hierarchy based on a number of factors of socio‐economic and environmental type, taking into consideration the priorities defined by the transport sectoral plan.
382. The strategy development was conducted on the basis of GDP scenarios, the fiscal capacity mobilized for road investments, opportunities for support from partners and the scope of the reform of the functioning and operation of Road Fund.
383. Three scenarios (high, medium, low) were examined. The final choice was focused on the "medium" scenario in which the assumptions are for a gradual growth of GDP, a significant increase in government subsidies and foreign aid for investment and maintenance, accompanied by a thorough reform of the road fund.
384. The recommendations of the PDR relating to the Cameroonian section of the Transafrican 5 are the following:
with the new proposed classification of the classified network, the Cameroonian section is selected among the « structuring » road network, composed of the main national and international roads. Shares of routine and periodic maintenance are classified as priority on the structuring network, compared to other levels of classification proposed by the PDR (highways, priority roads of levels 1 and 2, roads of 2 x 2 lanes and rural roads)
The levelling of the Fotokol Maltam section, proceeding urgently with scheduled maintenance service. Its level of development could be observed in the medium term, especially a bituminous surface dressing of the pavement, if the high growth scenario chosen by the RDP would come true (7.5 % traffic growth against 6 % for the medium scenario).
385. The Chadian section of Transafrican 6, from Abeche to the border with Sudan, is currently (2011) the subject of a detailed techno‐economic study by STUDI International. The results of the survey O / D showed that the majority of flows via the section occur between Abeche and Adre, the two major cities covered by the axis, with an annual average daily traffic in 2011 of 135 vehicles.day. Adré Sudan border section is a second uniform section with an average daily traffic of 45 vehicles.day. International traffic is estimated at about twenty vehicles, divided about equally (50/50) between passenger vehicles and goods vehicles.
386. The estimated growth rate of passenger and freight segments has been the subject of two scenarios: (i) a trend scenario and (ii) a high scenario, based on population and GDP growth. The respective rates for each scenario are the following: (a) 8.2 % and 10 % for the passenger segment and (b) 7.4 % and 8.6 % for goods segment.
387. The traffic carried on the Sudanese section between the border with Chad to Nyala is mainly nationally oriented, and corresponds to an in‐country traffic. It is the same for Nyala ‐ Ennouhoud section, the traffic from the North of Central African Republic (CAR) via the road Birao ‐ Nyala and thence, towards Ennouhoud, should be low to marginal, the majority of the transport demand in the CAR is concentrated in Bangui and on the international axis Bangui ‐ Douala.
388. Regarding the missing links of the Ethiopian section, given their important roles in terms of (i) opening up and goods’ supply of the large population located in their direct service areas, (ii) promotion of economic and social exchanges with people located on the major axis Addis Ababa ‐ Weldiya ‐ Adigrat and (iii) contribution to the transport of goods originating from or destined for the Ahmar region, it was chosen a distribution of the 2010 traffic between « national » et « international » segments as follows:
54 Source : Census of road counting of Cameroon. 2005
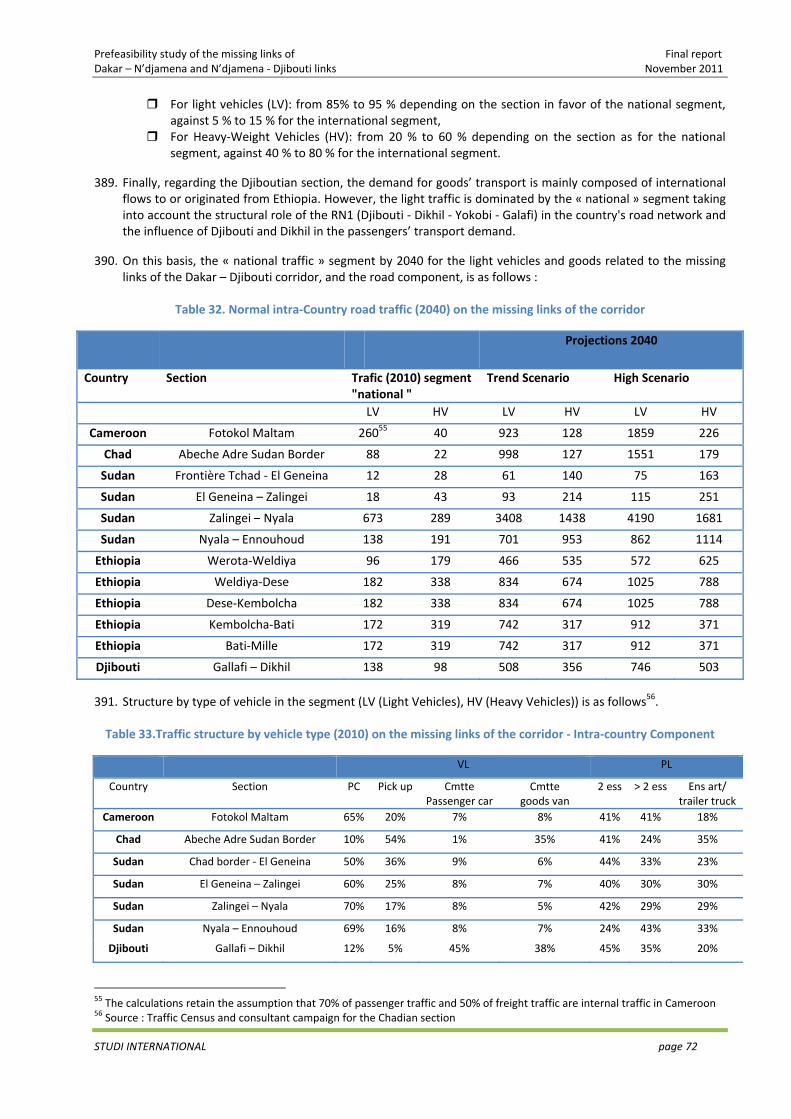
Prefeasibility study of the missing links of Final report Dakar – N’djamena and N’djamena ‐ Djibouti links November 2011
STUDI INTERNATIONAL page 72
For light vehicles (LV): from 85% to 95 % depending on the section in favor of the national segment, against 5 % to 15 % for the international segment,
For Heavy‐Weight Vehicles (HV): from 20 % to 60 % depending on the section as for the national segment, against 40 % to 80 % for the international segment.
389. Finally, regarding the Djiboutian section, the demand for goods’ transport is mainly composed of international flows to or originated from Ethiopia. However, the light traffic is dominated by the « national » segment taking into account the structural role of the RN1 (Djibouti ‐ Dikhil ‐ Yokobi ‐ Galafi) in the country's road network and the influence of Djibouti and Dikhil in the passengers’ transport demand.
390. On this basis, the « national traffic » segment by 2040 for the light vehicles and goods related to the missing links of the Dakar – Djibouti corridor, and the road component, is as follows :
Table 32. Normal intra‐Country road traffic (2040) on the missing links of the corridor
Projections 2040
Country Section Trafic (2010) segment "national "
Trend Scenario High Scenario
LV HV LV HV LV HV
Cameroon Fotokol Maltam 26055 40 923 128 1859 226
Chad Abeche Adre Sudan Border 88 22 998 127 1551 179
Sudan Frontière Tchad ‐ El Geneina 12 28 61 140 75 163
Sudan El Geneina – Zalingei 18 43 93 214 115 251
Sudan Zalingei – Nyala 673 289 3408 1438 4190 1681
Sudan Nyala – Ennouhoud 138 191 701 953 862 1114
Ethiopia Werota‐Weldiya 96 179 466 535 572 625
Ethiopia Weldiya‐Dese 182 338 834 674 1025 788
Ethiopia Dese‐Kembolcha 182 338 834 674 1025 788
Ethiopia Kembolcha‐Bati 172 319 742 317 912 371
Ethiopia Bati‐Mille 172 319 742 317 912 371
Djibouti Gallafi – Dikhil 138 98 508 356 746 503
391. Structure by type of vehicle in the segment (LV (Light Vehicles), HV (Heavy Vehicles)) is as follows56. Table 33.Traffic structure by vehicle type (2010) on the missing links of the corridor ‐ Intra‐country Component
VL PL
Country Section PC Pick up Cmtte Passenger car
Cmtte goods van
2 ess > 2 ess Ens art/ trailer truck
Cameroon Fotokol Maltam 65% 20% 7% 8% 41% 41% 18%
Chad Abeche Adre Sudan Border 10% 54% 1% 35% 41% 24% 35%
Sudan Chad border ‐ El Geneina 50% 36% 9% 6% 44% 33% 23%
Sudan El Geneina – Zalingei 60% 25% 8% 7% 40% 30% 30%
Sudan Zalingei – Nyala 70% 17% 8% 5% 42% 29% 29%
Sudan Nyala – Ennouhoud 69% 16% 8% 7% 24% 43% 33%
Djibouti Gallafi – Dikhil 12% 5% 45% 38% 45% 35% 20%
55 The calculations retain the assumption that 70% of passenger traffic and 50% of freight traffic are internal traffic in Cameroon 56 Source : Traffic Census and consultant campaign for the Chadian section
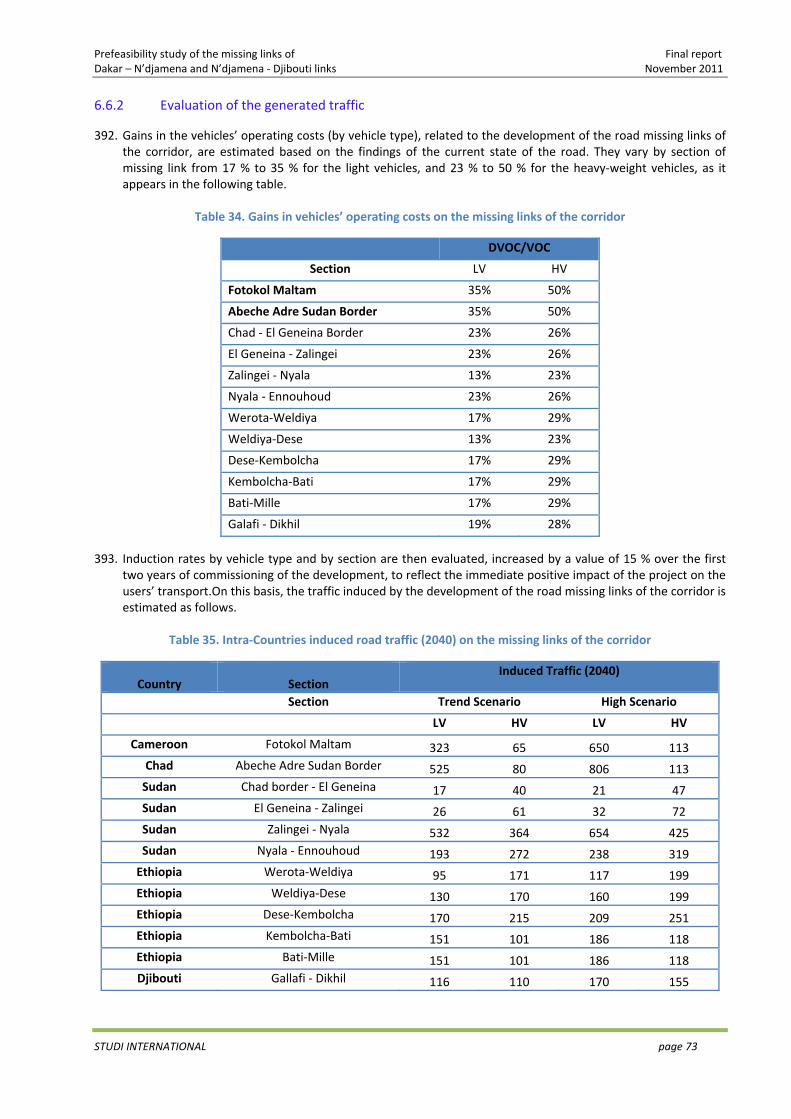
Prefeasibility study of the missing links of Final report Dakar – N’djamena and N’djamena ‐ Djibouti links November 2011
STUDI INTERNATIONAL page 73
6.6.2 Evaluation of the generated traffic
392. Gains in the vehicles’ operating costs (by vehicle type), related to the development of the road missing links of the corridor, are estimated based on the findings of the current state of the road. They vary by section of missing link from 17 % to 35 % for the light vehicles, and 23 % to 50 % for the heavy‐weight vehicles, as it appears in the following table.
Table 34. Gains in vehicles’ operating costs on the missing links of the corridor
DVOC/VOC
Section LV HV
Fotokol Maltam 35% 50%
Abeche Adre Sudan Border 35% 50%
Chad ‐ El Geneina Border 23% 26%
El Geneina ‐ Zalingei 23% 26%
Zalingei ‐ Nyala 13% 23%
Nyala ‐ Ennouhoud 23% 26%
Werota‐Weldiya 17% 29%
Weldiya‐Dese 13% 23%
Dese‐Kembolcha 17% 29%
Kembolcha‐Bati 17% 29%
Bati‐Mille 17% 29%
Galafi ‐ Dikhil 19% 28%
393. Induction rates by vehicle type and by section are then evaluated, increased by a value of 15 % over the first two years of commissioning of the development, to reflect the immediate positive impact of the project on the users’ transport.On this basis, the traffic induced by the development of the road missing links of the corridor is estimated as follows.
Table 35. Intra‐Countries induced road traffic (2040) on the missing links of the corridor
Country Section Induced Traffic (2040)
Section Trend Scenario High Scenario
LV HV LV HV
Cameroon Fotokol Maltam 323 65 650 113 Chad Abeche Adre Sudan Border 525 80 806 113 Sudan Chad border ‐ El Geneina 17 40 21 47 Sudan El Geneina ‐ Zalingei 26 61 32 72 Sudan Zalingei ‐ Nyala 532 364 654 425 Sudan Nyala ‐ Ennouhoud 193 272 238 319 Ethiopia Werota‐Weldiya 95 171 117 199 Ethiopia Weldiya‐Dese 130 170 160 199 Ethiopia Dese‐Kembolcha 170 215 209 251 Ethiopia Kembolcha‐Bati 151 101 186 118 Ethiopia Bati‐Mille 151 101 186 118 Djibouti Gallafi ‐ Dikhil 116 110 170 155
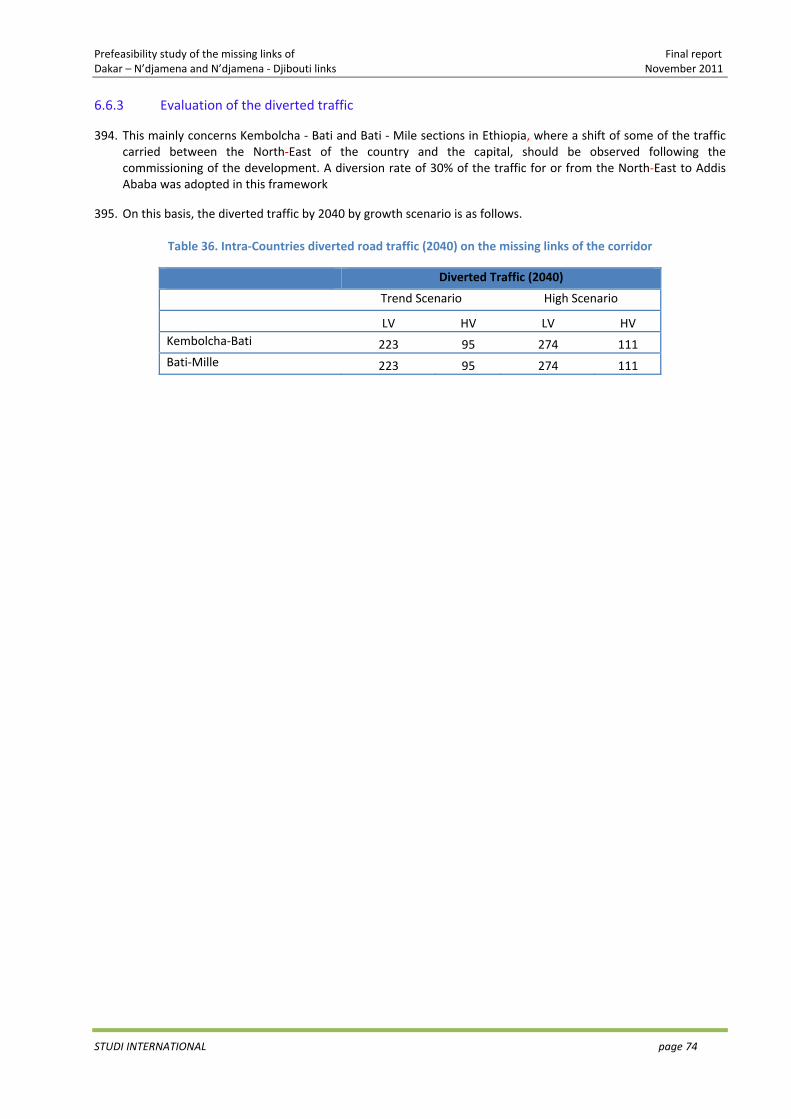
Prefeasibility study of the missing links of Final report Dakar – N’djamena and N’djamena ‐ Djibouti links November 2011
STUDI INTERNATIONAL page 74
6.6.3 Evaluation of the diverted traffic
394. This mainly concerns Kembolcha ‐ Bati and Bati ‐ Mile sections in Ethiopia, where a shift of some of the traffic carried between the North‐East of the country and the capital, should be observed following the commissioning of the development. A diversion rate of 30% of the traffic for or from the North‐East to Addis Ababa was adopted in this framework
395. On this basis, the diverted traffic by 2040 by growth scenario is as follows.
Table 36. Intra‐Countries diverted road traffic (2040) on the missing links of the corridor
Diverted Traffic (2040)
Trend Scenario High Scenario
LV HV LV HV Kembolcha‐Bati 223 95 274 111 Bati‐Mille 223 95 274 111
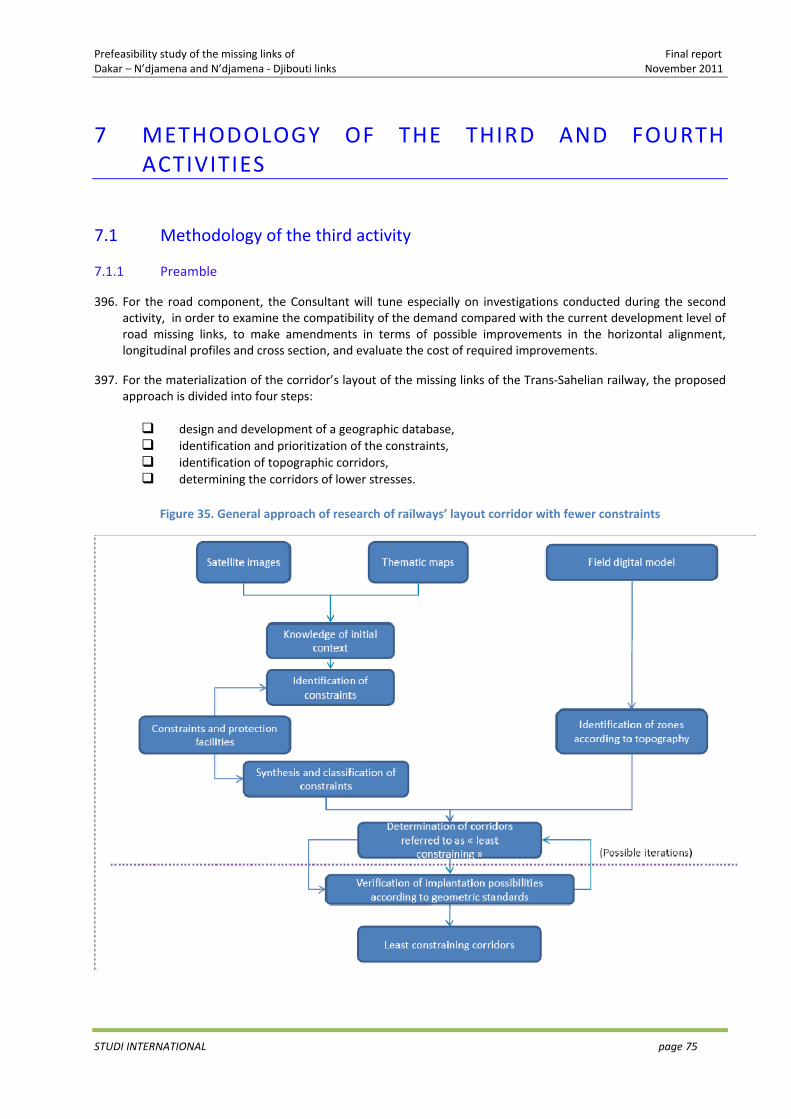
Prefeasibility study of the missing links of Final report Dakar – N’djamena and N’djamena ‐ Djibouti links November 2011
STUDI INTERNATIONAL page 75
7 METHODOLOGY OF THE THIRD AND FOURTH ACTIVITIES
7.1 Methodology of the third activity
7.1.1 Preamble
396. For the road component, the Consultant will tune especially on investigations conducted during the second activity, in order to examine the compatibility of the demand compared with the current development level of road missing links, to make amendments in terms of possible improvements in the horizontal alignment, longitudinal profiles and cross section, and evaluate the cost of required improvements.
397. For the materialization of the corridor’s layout of the missing links of the Trans‐Sahelian railway, the proposed approach is divided into four steps:
design and development of a geographic database, identification and prioritization of the constraints, identification of topographic corridors, determining the corridors of lower stresses.
Figure 35. General approach of research of railways’ layout corridor with fewer constraints
Prefeasibility study of the missing links of Final report Dakar – N’djamena and N’djamena ‐ Djibouti links November 2011
STUDI INTERNATIONAL page 76
7.1.2 Design and development of a geographic database
398. Spatial data on the project’s influence area will be managed as a geographic database, developed as a GIS coverage Geodatabase and operated on ArcGIS. It is structured in different layers: (i) physical data, (ii) socio‐economic data, (iii) easements and protection data, (iv) land use....
7.1.3 Identification and prioritization of constraints
399. A number of constraints must be considered in developing the railway corridor’s layout: urban areas, major facilities (airports, dams, ...), protection perimeters, high‐value agricultural land, forests, nature parks, wet areas , dams, ...
400. The items to be identified as constraints for the registration of a corridor layout of the missing links will be stored in the previously designed database.
401. This operation is followed by a prioritization of constraints, based on the analysis of their identified relative values.
402. Three main levels of constraints will be defined and plotted on a map called "constraints map", where each level is represented by an appropriate color.
7.1.4 Identification of topographic corridors
403. Topography is a fundamental and deciding datum when searching the layout corridor s of the railway missing links. It is within the topographic corridors in favor of the registration of the new layout corridor s that the research will be conducted.
404. The topographic analysis will be conducted based on a terrain digital model and consists in identifying, based on the geometric standards (eligible slopes, minimum radius, spanning conditions, etc...), the favorable topographic corridors.
7.1.5 Determination of corridor’s layout of lesser constraints
405. The corridors of lesser constraints are determined from the maps of :
hierarchical constraints, topographic corridors.
406. The axes of the layout corridor’s layout of the railway missing links are rechecked geometrically, especially the conditions of horizontal curvature, the longitudinal profiles, the eligible slopes, measurements and excavation and filling materials.
7.1.6 Evaluation of the developments costs
407. The developed corridors of the railway route and the leveling of the road missing links will be subject to a preliminary assessment of the development costs.
7.1.7 Choice of the best alternative of the railway corridor’s layout
408. The alternatives of the railway layout’s corridor will be subject to a first multi‐criteria analysis to identify the best railway alternative on the technical, economic and environmental levels.
7.1.8 Evaluation of the rolling stock cost
409. Depending on the demand forecasts, it will be to size the necessary fleet and to estimate its cost, taking into account the number of working days, the average time of a train rotation, the required time for the maintenance of the rolling stock and the annual tonnage transported by a train.
Prefeasibility study of the missing links of Final report Dakar – N’djamena and N’djamena ‐ Djibouti links November 2011
STUDI INTERNATIONAL page 77
7.2 Methodology of the fourth activity
410. The fourth activity aims to assess the economic viability of the road and rail missing links’ development. It also intends to analyze the risks to the project and recommend the schedule of the construction works, in conjunction with the economic eligibility of the different sections covered by the analysis. It also deals with the terms of reference of the following steps, including the geotechnical, hydrological and hydraulic programs.
411. The assessment of the economic feasibility of the development rests on a comparative analysis between two situations : the situation « with project » which involves the completion of the missing links (road, rail), and the situation « without project » where it is assumed that the operation of the transport routes is similar to that which currently exists, that is to say that the service level of the alternative « reference network » is frozen at its current state.
412. The economic evaluation will be made from the perspective of the community by the updated balance method which involves the comparison of benefits and costs spread over time, which implies the use of a discount rate, concept developed by analogy with the interest rate and representing the time preference. This method requires the inclusion of a reference price system in order to correct economic distortions and show only the actual costs incurred by the national community. These modifications consist mainly of avoiding taxes that do not correspond to the use or consumption of inputs.
413. From these real costs and benefits, it becomes possible to analyze the economic profitability of the project alternatives, in order to identify the profitability indicators, mainly the internal rate of return and the net present value.
414. In the reference situation or "without project", the forecast of the commercial traffic can be performed using the same methodology used for the commercial traffic with the project, without considering however the traffic generated by the filling of the missing links and by considering the rate of trends by traffic segment comparable to those of the current situation that will gradually decrease over time, as a result of any reduction in the service quality.
415. In the situation "with project", the analysis of direct costs / benefits will be conducted from the data of the investment plan, by making the transformation in economic terms of the project financial data and this is by trying each time to eliminate the << distortion >> on prices when they do not reflect the <<market price >>. The quantifiable costs and benefits that will be introduced to the economic evaluation are the development costs, operating costs of vehicles before and after the project (for the road component), the savings generated by the use of the railway (compared to the road or sea transport modes), the decrease in the travel time, as well as other quantifiable benefits related to the economic development observed in the form of increased economic aggregates, especially of additional exports of agricultural, industrial and mining products or improving yields and productivity of the productive sectors.
416. Regarding the benefits of job creation during the implementation of the new development, full employment may be unrealized in the project’s area, any expense for labor will result in a reduction of unemployment and present thus for the community, a benefit that partially offsets the incurred cost. Therefore, it is legitimate to mark down the costs of labor associated with the development of the project through the coefficients (1‐p) for unskilled or low‐skilled labor and (1‐q) for skilled labor, p and q are positive reals comprised between 0 and 1.
417. In addition to these advantages, the community will recover at the end of the infrastructure’s lifetime a part of the investment (residual value) that will be counted as a benefit of the project.
418. For the railway, it is also expected benefits related to the reduction of pollutant emissions, which will be measured against the reference situation.
419. Based on these costs and benefits of the new development, the Consultant will assess the economic viability of the project and the updated benefit. A sensitivity study will be also conducted in order to determine the influence of changes in considered factors (investment, benefits) on the value of the economic rate of return.
Prefeasibility study of the missing links of Final report Dakar – N’djamena and N’djamena ‐ Djibouti links November 2011
STUDI INTERNATIONAL page 78
420. The calculation of the profitability indicators will be conducted for the three following alternatives : (i) completion of road missing links, (ii) completion of rail missing links, (iii) both at a time.
421. The risks will be then analyzed, together with proposals for mitigation. These are cross‐cutting risks and specific risks, especially applicable to the railway.
Prefeasibility study of the missing links of Final report Dakar – N’djamena and N’djamena ‐ Djibouti links November 2011
STUDI INTERNATIONAL page 79
8 CRITICAL ANALYSIS OF CURRENT ROAD STANDARDS AND TRACKS GAUGE OF THE TEN COUNTRIES COVERED BY THE CORRIDOR
8.1 Road standards
422. In the space of the ten countries crossed by the Transafricans 5 and 6, the roads are designed according to the French standards for the francophone countries and English standards for the anglophone countries.
423. The TAH 5 and 6 have often variable widths of roadways and roads, due to the lack of harmonization of the road standards adopted by each country. The TAH 6 is the most concerned by this finding.
424. Concerning the geometric design, the radii of curvature, for a given reference speed, differ from one standard to another as well as the clothoid curves and their use factors. In addition, the design standards for longitudinal and cross sections, different according to the countries, cause a limitation of the inter‐country road traffic and pose the problem of a rapid degradation of several road sections.
425. In terms of the maximum load per axle, main element of design, it varies from 8.16 T for the countries using the Anglophone standards to 13 T for the countries using the Francophones standards. The lack of control of the axle load would lead, in the medium term, to an early degradation of the roadway, especially for the countries using the Anglophone standard. In addition and by assuming that the control of the axle load is done, this would limit the gross weight of trucks from the Francophone side, which goes against a case of displacement and reduction in the transport costs per tone57. It should be noted also that the development of containerization techniques, regarded as the transportation way for the future, will not be fully promoted, because of the maximum axle standards, different between the countries crossed by the two TAH. Finally, a liberalization of goods’ transport across the RECs and ultimately, across the overall African continent, will be disabled due to the distortion of the competitive conditions, generated by the lack of harmonization of the standards to the axle.
426. A special legislation is used in each country, for exceptional road transport, reserved primarily for transporting heavy goods. This type of transport, which causes very high stresses on the roadway, can be the cause of premature deterioration in the absence of harmonization of rules and principles governing the activity.
8.2 Railway standards
427. The Trans‐Sahelian railway is composed of a succession of lines in operation and new lines to be achieved, which represent about 43 % of the total length. It crosses eleven (11) countries58 of which two (2) do not have rail lines59.
428. An interconnection of two isolated railways network is normally always possible technically. Its economic viability however depends on a variety of factors of which the identification consists of looking at first, for the characteristics of the networks, and their compatibilities.
57 Note No. 163 of Gerpisa (International Auto Network) presented the main arguments in favor of the truck of 13 tons per axle. It is particularly noted that the damages caused to the roadways on which trucks of 13 tons move per axle are contained within reasonable limits. According to the American institution Board of Public Road, by increasing the axle load from 8.2 T to 10.9 T, the annual cost of ordinary roads construction will increase from 0.7% to 1.2% depending on the type of roads and the traffic flow, transportation costs would decrease in turn by 25% 58 A trans‐Sahelian railway section crosses the Ivory Coast. It links Sikasso (Mali) to Ouangolodougou (North of the Ivory Coast) and Ouangolodougou to the border with Burkina Faso 59 Niger and Chad
Prefeasibility study of the missing links of Final report Dakar – N’djamena and N’djamena ‐ Djibouti links November 2011
STUDI INTERNATIONAL page 80
429. The introduction of new interconnections that will ensure the continuity of traffic on the entire Trans‐Sahelian railway is likely quite complex. Indeed, it is a project that will be developped taking into account the characteristics of the existing and used lines, imposing thus a number of constraints that would not exist on a new independent route.
430. Two major constraints related to the performance and reliability of the rail transport on the Dakar ‐ Djibouti line should be considered: (i) the tracks gauge and (ii) the rolling stock.
8.2.1 Tracks gauge
431. The used linear on the Trans‐Sahelian has different tracks gauge:
a meter gauge linear (1,000 mm), of about 2,690 km, located in West Africa and between Ethiopia and Djibouti,
a narrow gauge linear (1,067 mm), of about 2,450 km, located in Nigeria (1219) and Sudan (1230).
432. This diversity of tracks’ gauge is the consequence of colonial fact and cooperative relations that have dominated the economic activity, especially in the field of natural resources. The meter gauge is French, while the narrow gauge is English.
433. An examination of the gauge issue is essential and three scenarios can be considered :
« standard gauge (1435 mm) for the entire corridor » scenario.This responds to the statements of the African Union which adopted at the Conference of Algiers (April 2008) of Ministers responsible for transport, the conclusions of the work conference on the African rail networks (Johannesburg 2007) 60, which recommended an equal quality of service between the different rail networks, whose technical characteristics are in many cases, the major concerns.
This option would initiate the development of the standard gauge (1435 mm) in the region, promoted by the African Union, which could have a ripple effect for future connections. However, it is hampered by at least the three following constraints:
lack of access to ports of the countries of Guinea’s Gulf, served by meter gauges and to Nigerian and Sudanese railways networks composed of narrow roads, which results in an increase in transhipment areas,
a non‐optimized existing rolling stock and do not meet the requirements of the standard gauge, full recovery of the existing roads of the corridor, the adoption of a single standard gauge equivalent to a new alignment, synonym of a major additional cost (over 5000 km are indeed concerned). At least two technical reasons justify the adoption of a new alignment:
a. the basis of the standard road is wider in current section from the present road (metric or narrow) and the minimum values of the radii of the curves are higher than their similar for both types of road,
b. the current structures are not predisposed (clearance and axle loads).
« Standard gauge (1435 mm) for the railway missing links » scenario : Ensuring continuity with the existing networks by building new interconnections (missing links) by a standard gauge (1435 mm) and transshipment centers at the intersection points with the existing lines (1000 mm or 1067 mm). This option provides at least the two following advantages :
60 Work conference on interconnection, interoperability and complementarity of African railway systems. 20/21 November 2007. Johannesburg. South Africa

Prefeasibility study of the missing links of Final report Dakar – N’djamena and N’djamena ‐ Djibouti links November 2011
STUDI INTERNATIONAL page 81
respond to the statemens of the African Union on the standardization of the new railways,
financially, save the additional costs of setting standard gauge of the existing network, the relevant sections being on average only one‐third of their capacity.
However, it has the two following disadvantages:
need to build at least a dozen transshipment centers,
six countries will find themselves with two different gauges (metric / standard or narrow / standard): (i) Mali, (ii) Ivory Coast, (iii) Burkina Faso (iv) Nigeria, (v) Sudan and (vi) Ethiopia.
Scenario of « meter (1000 mm) or narrow (1067 mm) gauge for the railway missing links » : ensure the continuity of the existing networks by building new interconnections (missing links) by a meter or narrow gauge, as appropriate. This option has the three following advantages:
performance in terms of operating speed and travel time, comparable in the case of metric gauges, to those envisaged by the adoption of standard gauges, and thus likely to achieve similar performance to the exploits observed in several countries, in particular South Africa, Australia, Malaysia and Japan,
It offers the advantage to meet transport demand in the long and the very long term,
controlled investments, making timely the development of missing links.
In addition, the rolling stock adapted to the metric or narrow gauges is currently made by several companies from different countries (South Korea, India, Canada, China, Spain, France, Iran, Brazil, Austria, South Africa, Romania, etc.. ) and their availability in the international market should not pose in principle any particular problems. Niger and Chad have in this context a meter gauge network with four (4) transshipment points created on the corridor:
two (2) in the Nigerian territory, at the stations of Kaura Namoda and Maiduguri, two (2) in the Sudanese territory, at the borders with Chad and Ethiopia.
The creation of transshipment centers, rather than the adoption of rolling stock equipped with variable gauge bogies or interchangeable bogies, is recommended, primarily for the following considerations:
the existing bogie trailer rolling stock does not allow these operations because they are not predisposed to this type of equipment,
presence of axle trailer rolling stock, the cost of the possible rolling stock (wagons, motor) will be more expensive of 20% to 40%, plus additional costs for its maintenance,
tonnage to be transported is strongly influenced, adapted to the concept of transshipment center (containerization).
Moreover and when designing the layout of the missing links, the required standards by a standard gauge track can be adopted. Thus, the roads61 are prone to the standard gauge by means of changing cross members, which represents costs at (supply and work) about only 15% of the investment.
61 In metric or narrow gauge
Prefeasibility study of the missing links of Final report Dakar – N’djamena and N’djamena ‐ Djibouti links November 2011
STUDI INTERNATIONAL page 82
434. To take into account statements of the African Union, the conclusions of the professional conference on African rail network (2007) and demands expressed by the representatives of some countries crossed by the corridor, the entire design, engineering calculations, costs assessment and economic eligibility will focus on the scenario « standard gauge (1435 mm) for the entire corridor».
435. Because of the important constraints of the breaking load generated by the multitude of transshipment centers to be created, the scenario « standard gauge (1435 mm) for the railway missing links » is discarded and will not be subject to specific notes or calculations .
436. As for the scenario "meter or narrow gauge for railway missing links," it is an interesting intermediate alternative, with the interest (i) to be tailored to budget constraints, (ii) meeting the current and future demand for transport and (iii) adjusted to the technical requirements for future standardization of missing links.
437. Within this framework will be provided the investments generated by the construction of the missing links (in meter or narrow gauge) as well as the costs necessary for the rehabilitation of existing roads.
8.2.2 Rolling stock
438. With rising and falling gradients above 10 per thousand and the radii of curvature not exceeding 300 m, the existing railway networks (i) does not allow to achieve commercial speeds above 55 km / h and (ii) limit carrying capacity of trains.
439. Operationalize the future Trans‐Sahelian railway line, with a standard gauge throughout the corridor, would require an axle load rolling stock going up to 25 tonnes.
8.2.3 Compatibility of operation systems
440. Operation practices of the existing railway networks are similar, especially as they all refer to the General Rules of Railways Operation (RGE) which is the basic document of the railway execution.
8.3 Recommendations relating to the road component
441. The harmonization of the road standards across the African continent has been, in the recent years, subject to several discussions, notes, documents, highlighting the advantages and disadvantages of the two main standards used in the Sub ‐Saharian Africa for the design and dimensioning of roads.
442. The process of the standards’ harmonization is underway in most of the RECs. Two recent studies conducted by
the ADB62 (2007) and the CEA/BSER‐AC63 (2009), examined this issue, one across the continent and the other across Central Africa.
443. The major recommendations common to both studies are the following:
the maximum axle load is of 13 tonnes,
the operation’s axle load and the total loaded weight that would protect the existing roads are lower than
those of the design, i.e. an axle load from 8 to 11 tones, and a total loaded weight of 55 tonnes,
the surfacing should be in bituminous concrete, with a minimum thickness of 5 cm,
the adoption of a reference speed of 80 km / h (in open country) with the exception of roads in difficult terrain where it is held equal to 60 km / h,
62 Study on regional corridors’ signaling and users safety 2007 63 Study on the harmonization of construction standards of road infrastructures in Central Africa 2009
Prefeasibility study of the missing links of Final report Dakar – N’djamena and N’djamena ‐ Djibouti links November 2011
STUDI INTERNATIONAL page 83
the horizontal alignment, relating to the recommended speed, should be characterized by:
curvature radii with superelevation higher than 240 m,
curvature radii without superelevation higher than 900 m,
a maximum declivity of 6%.
the cross section should check the following conditions:
a roadway width of 7.0 m, consisting of two (2) lanes of 3.5 m each, with an extra marking width of 2 x 0.25 m,
a minimum shoulder width of 1.50 m for each side. Shoulders may be widened to 2.50 m or 3.00 m, and paved in case of heavy traffic flows drawn by animals, bicycles and motorcycles.
444. These recommendations will be taken into account during the design of the missing links of the corridor. The question remains however raised for the existing missing links of the Transafrican 6 relating to Sudan and Ethiopia, insofar as the current design may not meet the carriers of the Francophone countries (in particular Chadians) that are aiming at transporting their goods (to Sudan or Ethiopia) at lower costs. However, traffic with a maximum load of 13 tons per simple axle not being mainly used for long‐distance flows, this significantly reduces their percentage regarding all the traffic.
445. Also, if the non‐harmonization of the road standards of the countries crossed by the Transafrican 6, especially the maximum axle load, does not represent an obstacle that is to get rid of it urgently, the countries traversed by the corridor are called as soon as possible to comply with the recommendations of previous studies, especially for regional corridors and eventually for all of their networks in response to the objectives of the African integration.
8.4 Recommendations relating to the railway component
8.4.1 Gauge and permissible load
446. The gauge to be adopted will be the IUR gauge (sheet 550) for the standard gauge. The adopted permissible load for the infrastructure is of 25 tons per meter.
447. The main geometric design standards of a railway line (horizontal alignment, longitudinal section and cross section) will consider the above.
8.4.2 Rolling stock
448. For the selected traffic, it is recommended locomotives of truck load type of rated power of 2400 Hp. To service the future corridor, cars will have the two main following characteristics:
Bogies vehicles, UIC coupling type of 100 tonnes forces64(Tf).
8.4.3 Transshipment centers
449. The Dakar Djibouti corridor as being in standard gauge, we would use thus five (5) transshipment centers created on the railway corridor :
a transshipment center in Ouangolodougou in the Ivory Coast, two transshipment center in the Nigerian territory, at the Zaria and Kaduna stations,
64 80 tonnes forces may be sufficient but would be insufficient in case of incorporation of the car on a train pulled in multiple unit
Prefeasibility study of the missing links of Final report Dakar – N’djamena and N’djamena ‐ Djibouti links November 2011
STUDI INTERNATIONAL page 84
two (2) in the Sudanese territory: in Batasuna and Sennar for Alternative 165, Batasuna and Gedaref for Alternative 266.
8.4.4 Criteria for the equipment and standardization choice
450. The main aimed objectives for the technical definition of the road are the following: (i) use of conventional, tested and easily removed components, (i) material service life and (iii) minimization of the constraints and maintenance costs.
451. The IUR (sheet 714‐R) defines a classification of lines, depending on the supported traffic, from the fictional daily traffic notion expressed in tonnes / day. This classification leads to the six (6) following groups :
‐ group 1 : more than 130,000 t/d ‐ group 2 : 80,000 to 130,000 t/d ‐ group 3 : 40,000 to 80,000 t/d ‐ group 4 : 40,000 to 20,000 t/d ‐ group 5 : 20,000 to 5,000 t/d ‐ group 6 : mines of 5,000 t/d
452. In this case, the classification of the Dakar ‐ Djibouti railway line would be group 4, which meets to the
transport demand, in the very long term and for which it is recommended that a profile of type 60 kg / m type for the routes.
453. For the selection of the spring rail fasteners which will be subject to advanced future studies of the project,
they will have to comply with IUR, ISO standards, English (EN) and French (NF).
65 Variant 1 : Dakar – N’djaména – Ati – Nyala – Sennar – Damazin – Addis Abeba ‐ Djibouti 66 Variant 2 : Dakar – N’djaména – Mongo – Nyala – Sennar – Gedaref – Addis Abeba ‐ Djibouti
Prefeasibility study of the missing links of Final report Dakar – N’djamena and N’djamena ‐ Djibouti links November 2011
STUDI INTERNATIONAL page 85
9 MAIN GEOMETRIC STANDARDS OF A RAILWAY LAYOUT DESIGN
9.1 Horizontal alignment
9.1.1 Conditions of the horizontal routes layout’s establishment
454. The layout of a railway line consists of a series of straight sections and curves, where the route is generally laid
with super‐elevation. The curves are composed of an arc of circle and two clothoïdal spirals, to ensure a smooth transition of lateral acceleration.
455. They are characterized by the following parameters:
‐ the arc of circle radius, ‐ the super‐elevation, measured in mm, which corresponds to the super‐elevation of a stretch of rail,
compared with the other remaining at the theoretical level of the track, ‐ the length of the spirals.
456. These parameters must be calculated so as to limit on the one hand, the forces exerted on the rolling stock and
on the track, and on the other hand, the discomfort felt by passengers when trains pass in a curve.
9.1.2 Selected main characteristics 457. the main selected characteristics of the horizontal alignment and checking the various parameters mentioned
earlier are the following:
‐ a width of the right‐of‐way of at least 50 m, ‐ a ballasted track on a concrete tie with sleeper spacings of 1,666 ties per kilometer, ‐ a nominal thickness of ballast between the top of the platform and the underside of the sleeper
spacings of 0.25 m for the main track, and 0.15 m for the subsidiary tracks, ‐ a length of the spiral, depending on the variation of the super‐elevation: (i) for the radii less than 1,000
m, the change in super‐elevation will be of 0.7 mm / m and the length of the connection is of (1.42 * Real superellevation), (ii) for the radii above 1,000 m, the change in the super‐elevation will be of 0.5 mm / m and the length of the connection is of (2 * real superellevation),
‐ development of structures such as walkways, protection walls, level crossings, engineering structures of streams’ crossing.
9.1.3 Principles for setting trains speeds limit on curve 458. The speed limit on a curve (circular) is of 120 km / h for passenger trains and 80 km / h for freight trains. For
curves with super‐elevation, the speed limit is of 72 km / h, conditioned by security when crossing curves. The actual maximum super‐elevation is of 100 mm.
459. The length of the spiral (TCL) varies between 100 and 200 m depending on the curvature radius and the speed. The TCL is usually scheduled within the limits of approximately 70% of the equilibrium elevation compared to the design speed.
460. The speed limit for the points and crossing varies between 30 and 45 km / h on the turnout track and is in the range of 80 km / h on the direct track.
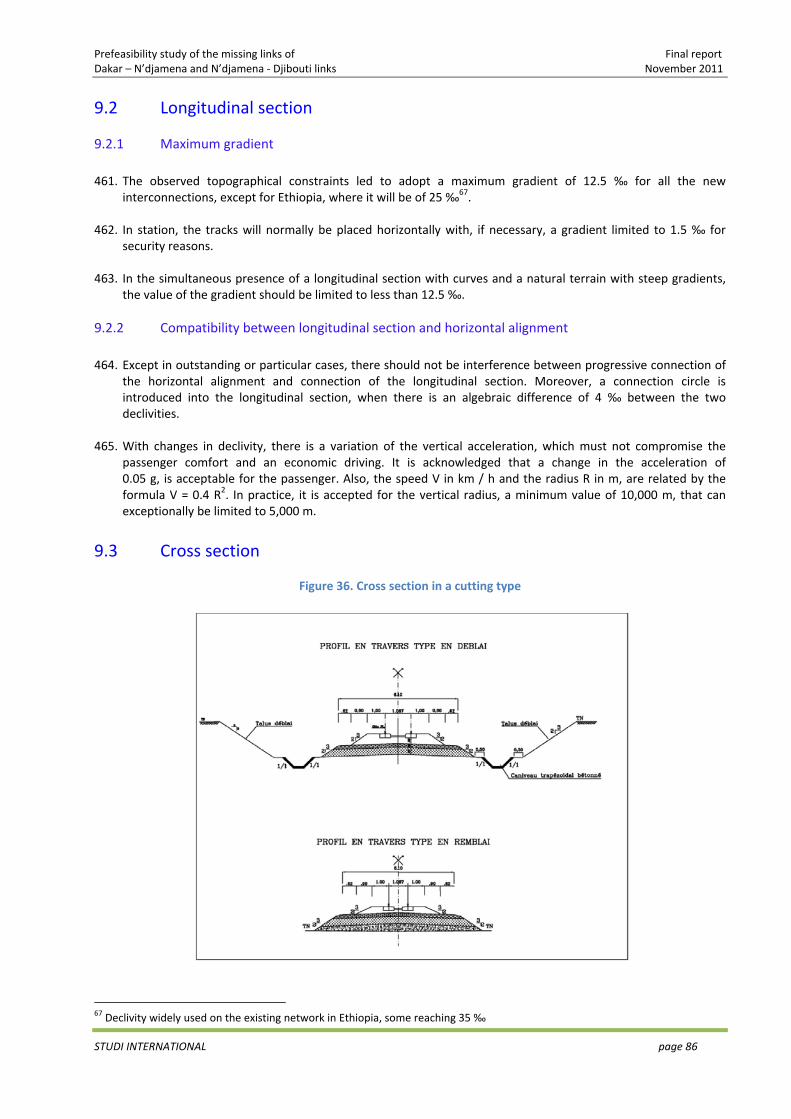
Prefeasibility study of the missing links of Final report Dakar – N’djamena and N’djamena ‐ Djibouti links November 2011
STUDI INTERNATIONAL page 86
9.2 Longitudinal section
9.2.1 Maximum gradient
461. The observed topographical constraints led to adopt a maximum gradient of 12.5 ‰ for all the new interconnections, except for Ethiopia, where it will be of 25 ‰67.
462. In station, the tracks will normally be placed horizontally with, if necessary, a gradient limited to 1.5 ‰ for security reasons.
463. In the simultaneous presence of a longitudinal section with curves and a natural terrain with steep gradients, the value of the gradient should be limited to less than 12.5 ‰.
9.2.2 Compatibility between longitudinal section and horizontal alignment
464. Except in outstanding or particular cases, there should not be interference between progressive connection of the horizontal alignment and connection of the longitudinal section. Moreover, a connection circle is introduced into the longitudinal section, when there is an algebraic difference of 4 ‰ between the two declivities.
465. With changes in declivity, there is a variation of the vertical acceleration, which must not compromise the
passenger comfort and an economic driving. It is acknowledged that a change in the acceleration of 0.05 g, is acceptable for the passenger. Also, the speed V in km / h and the radius R in m, are related by the formula V = 0.4 R2. In practice, it is accepted for the vertical radius, a minimum value of 10,000 m, that can exceptionally be limited to 5,000 m.
9.3 Cross section
Figure 36. Cross section in a cutting type
67 Declivity widely used on the existing network in Ethiopia, some reaching 35 ‰
Prefeasibility study of the missing links of Final report Dakar – N’djamena and N’djamena ‐ Djibouti links November 2011
STUDI INTERNATIONAL page 87
10 IDENTIFICATION AND PRIORITIZATION OF CONSTRAINTS, IDENTIFICATION OF TOPOGRAPHIC CORRIDORS
10.1 Preamble
466. The identification and prioritization of constraints mainly concern the railway component. For the Transafricans 5 and 6, it is to make the necessary technical interventions for a leveling (rehabilitation, reinforcement, ..) of the road missing links, mainly in Sudan, Ethiopia and Djibouti.
467. Research of the corridors of the railway missing links tracks requires the development of a spatial knowledge
base for all the ten countries, together with the establishment of geographical analysis tools necessary to develop a number of parameters that are essential for the geographic analysis (generation of terrain digital models, gradients’ calculation, crossing between the layers, ...).
468. The use of GIS and remote sensing technologies is one of the possible answers to this problem and can provide
adequate solutions to the expectations. Its choice is justified by the following main considerations: (i) the large extent of the project area, (ii) the diversity of the countries and landscapes crossed by the corridor, (iii) the multitude of physical and socio‐economic data to be analysed, as well as (iv) the status of the available mapping on the project area (unavailability of maps with appropriate scales, heterogeneity of scales, topicality level of heterogeneous maps, ...).
469. GIS technology enables to combine multiple data sources, multiple scales and offers significant opportunities in
terms of crossing and geographic analysis. Remote sensing provides recent images, which, with the interpretation work, allows having a map of the land use in the project’s influence area. This one is an important part in the search for the layout corridors.
10.2 Design of the geographic database
470. The choice is focused on the GIS coverage « Geodatabase », a format that offers the advantage of grouping in the same database, geographic and alphanumeric data types, with the ability to create relationships and links between the various entities of the database. The database so created, is controlled by a GIS to create new information layers, from an analysis of the existing data, in order to facilitate the search for the layout corridors.
10.2.1 Data collection 471. The collection of geographic data was launched at the start of the project by acquiring a number of Landsat
satellite coverages on the project area, the use of available geographic data on the specialized websites and data collected by the Consultant in its various missions conducted in the countries concerned by the corridor.
472. This collection has considered the need to ensure the following points: (i) a continuity of information on all the concerned countries, (ii) the homogeneity of data, especially of the comparable information scales between the countries and (iii) a uniform typicality level across countries.
473. The following table outlines the different vector layers making up the database.
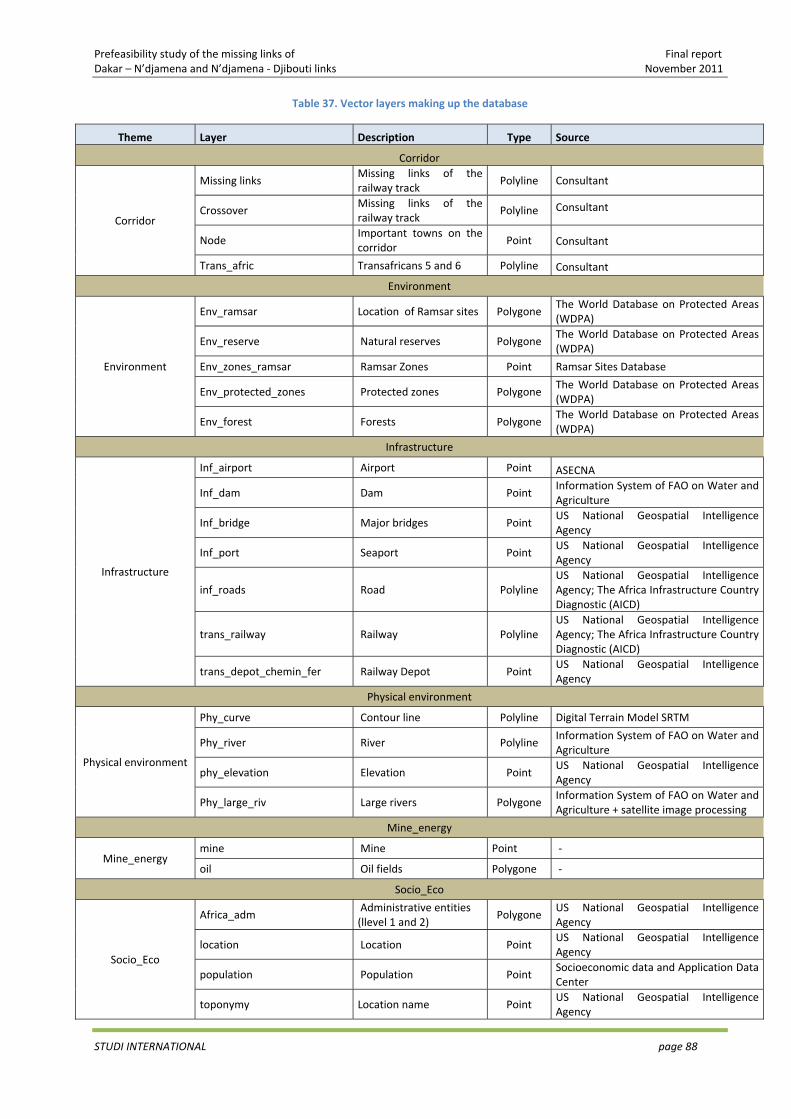
Prefeasibility study of the missing links of Final report Dakar – N’djamena and N’djamena ‐ Djibouti links November 2011
STUDI INTERNATIONAL page 88
Table 37. Vector layers making up the database
Theme Layer Description Type Source
Corridor
Corridor
Missing links Missing links of the railway track
Polyline Consultant
Crossover Missing links of the railway track
Polyline Consultant
Node Important towns on the corridor
Point Consultant
Trans_afric Transafricans 5 and 6 Polyline Consultant
Environment
Environment
Env_ramsar Location of Ramsar sites Polygone The World Database on Protected Areas (WDPA)
Env_reserve Natural reserves Polygone The World Database on Protected Areas (WDPA)
Env_zones_ramsar Ramsar Zones Point Ramsar Sites Database
Env_protected_zones Protected zones Polygone The World Database on Protected Areas (WDPA)
Env_forest Forests Polygone The World Database on Protected Areas (WDPA)
Infrastructure
Infrastructure
Inf_airport Airport Point ASECNA
Inf_dam Dam Point Information System of FAO on Water and Agriculture
Inf_bridge Major bridges Point US National Geospatial Intelligence Agency
Inf_port Seaport Point US National Geospatial Intelligence Agency
inf_roads Road Polyline US National Geospatial Intelligence Agency; The Africa Infrastructure Country Diagnostic (AICD)
trans_railway Railway Polyline US National Geospatial Intelligence Agency; The Africa Infrastructure Country Diagnostic (AICD)
trans_depot_chemin_fer Railway Depot Point US National Geospatial Intelligence Agency
Physical environment
Physical environment
Phy_curve Contour line Polyline Digital Terrain Model SRTM
Phy_river River Polyline Information System of FAO on Water and Agriculture
phy_elevation Elevation Point US National Geospatial Intelligence Agency
Phy_large_riv Large rivers Polygone Information System of FAO on Water and Agriculture + satellite image processing
Mine_energy
Mine_energy mine Mine Point ‐
oil Oil fields Polygone ‐
Socio_Eco
Socio_Eco
Africa_adm Administrative entities (llevel 1 and 2)
Polygone US National Geospatial Intelligence Agency
location Location Point US National Geospatial Intelligence Agency
population Population Point Socioeconomic data and Application Data Center
toponymy Location name Point US National Geospatial Intelligence Agency
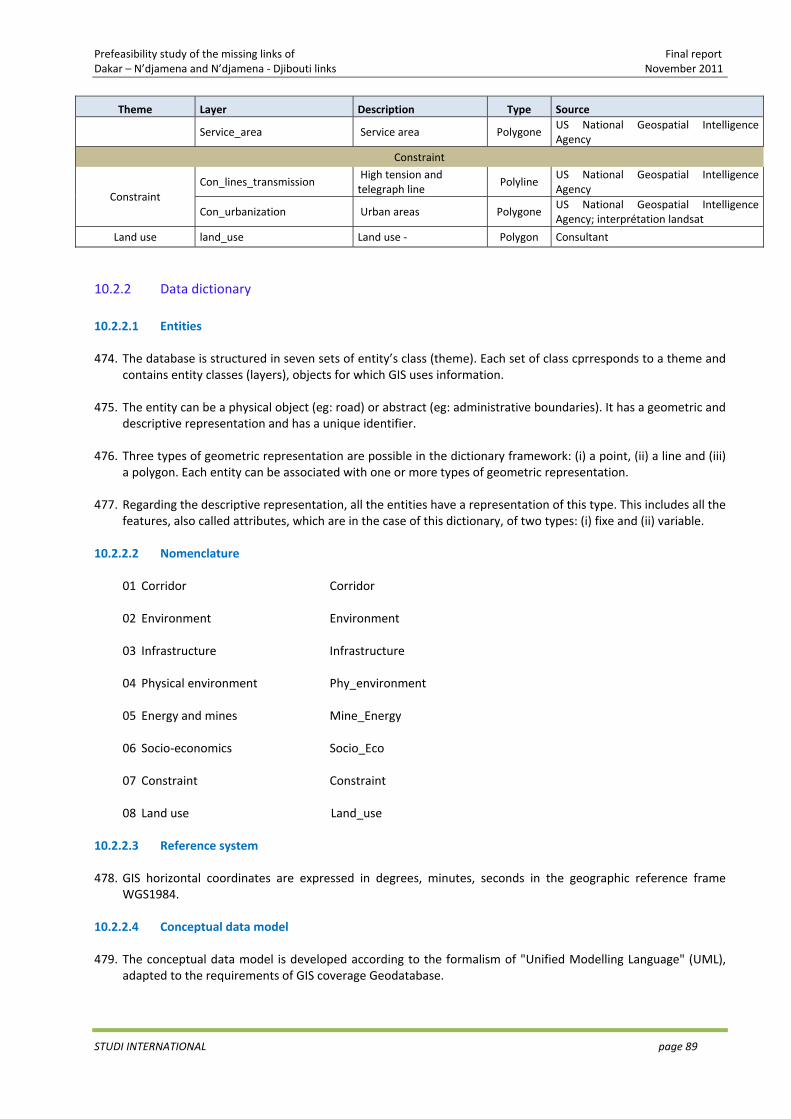
Prefeasibility study of the missing links of Final report Dakar – N’djamena and N’djamena ‐ Djibouti links November 2011
STUDI INTERNATIONAL page 89
Theme Layer Description Type Source
Service_area Service area Polygone US National Geospatial Intelligence Agency
Constraint
Constraint Con_lines_transmission
High tension and telegraph line
Polyline US National Geospatial Intelligence Agency
Con_urbanization Urban areas Polygone US National Geospatial Intelligence Agency; interprétation landsat
Land use land_use Land use ‐ Polygon Consultant
10.2.2 Data dictionary 10.2.2.1 Entities 474. The database is structured in seven sets of entity’s class (theme). Each set of class cprresponds to a theme and
contains entity classes (layers), objects for which GIS uses information. 475. The entity can be a physical object (eg: road) or abstract (eg: administrative boundaries). It has a geometric and
descriptive representation and has a unique identifier.
476. Three types of geometric representation are possible in the dictionary framework: (i) a point, (ii) a line and (iii) a polygon. Each entity can be associated with one or more types of geometric representation.
477. Regarding the descriptive representation, all the entities have a representation of this type. This includes all the
features, also called attributes, which are in the case of this dictionary, of two types: (i) fixe and (ii) variable. 10.2.2.2 Nomenclature 01 Corridor Corridor 02 Environment Environment 03 Infrastructure Infrastructure 04 Physical environment Phy_environment 05 Energy and mines Mine_Energy 06 Socio‐economics Socio_Eco 07 Constraint Constraint 08 Land use Land_use 10.2.2.3 Reference system 478. GIS horizontal coordinates are expressed in degrees, minutes, seconds in the geographic reference frame
WGS1984. 10.2.2.4 Conceptual data model 479. The conceptual data model is developed according to the formalism of "Unified Modelling Language" (UML),
adapted to the requirements of GIS coverage Geodatabase.
Prefeasibility study of the missing links of Final report Dakar – N’djamena and N’djamena ‐ Djibouti links November 2011
STUDI INTERNATIONAL page 90
10.2.2.5 Common attributes 480. All the entities have common attributes. In order to ease the reading of the dictionary, these attributes are not
repeated in each form of entity. They are mainly as follows:
object_id : internal number created by ArcGIS for the auto increment of the records in the geodatabase
Length : for all the linear or surface objects
surface : for all the surface objects
10.3 Identification and prioritization of constraints
481. The constraints in the inclusion of the corridor of the railway missing links track are identified on the basis of the data in the GIS. There are mainly the three following categories of constraints: (i) protected areas, (ii) high‐value agricultural land and (iii) forests and floodplains.
482. Protected areas include Ramsar areas, reserves and natural parks. They are classified at Level 1, that is to say
an absolute prohibition to cross them, except in case of force majeure (difficult relief or a bypass that would generate a very high infrastructure cost).
483. The lands of high agricultural value that figure in the database are classified at level 2. Their bypass is widely
recommended without an absolute prohibition to cross them.
484. Forests and floodplains are classified at Level 3. It would be better to get around them, when the geometric or relief conditions permit it, and provided that the route is not significantly extended.
485. Other types of constraints are taken promptly. This is especially for crossings of major rivers, with the principle
of a research of a layout corridor that minimizes at maximum the cost of the structure, when possible.
486. The corridors of the railway missing links’ track to search, must also obey a number of options, especially (i) their irrigation of major activity areas of the crossed countries and (ii) the activity areas generating heavy goods traffic, especially mining, that have to be branched up at the most to the railway.
487. In the appendix, is presented the map of constraints, developed by the Consultant from the GIS. Figure
particularly the project’s direct influence area, the different types of constraints with appropriate colors, the existing road and railway networks, and some registration and location information (cities, hydrography, lakes ...).
10.4 Identification of topographic corridors
488. The topography is an important and decisive datum when searching the corridors of railway alignment. All researches will be conducted within the topographic corridors in favor of including the layout.
489. The topographic analysis was performed based on the MNT SRTM and was to extract in a quasi‐automatic way, based on technical requirements for designing a railway layout, topographic corridors in favor of including a layout corridor.
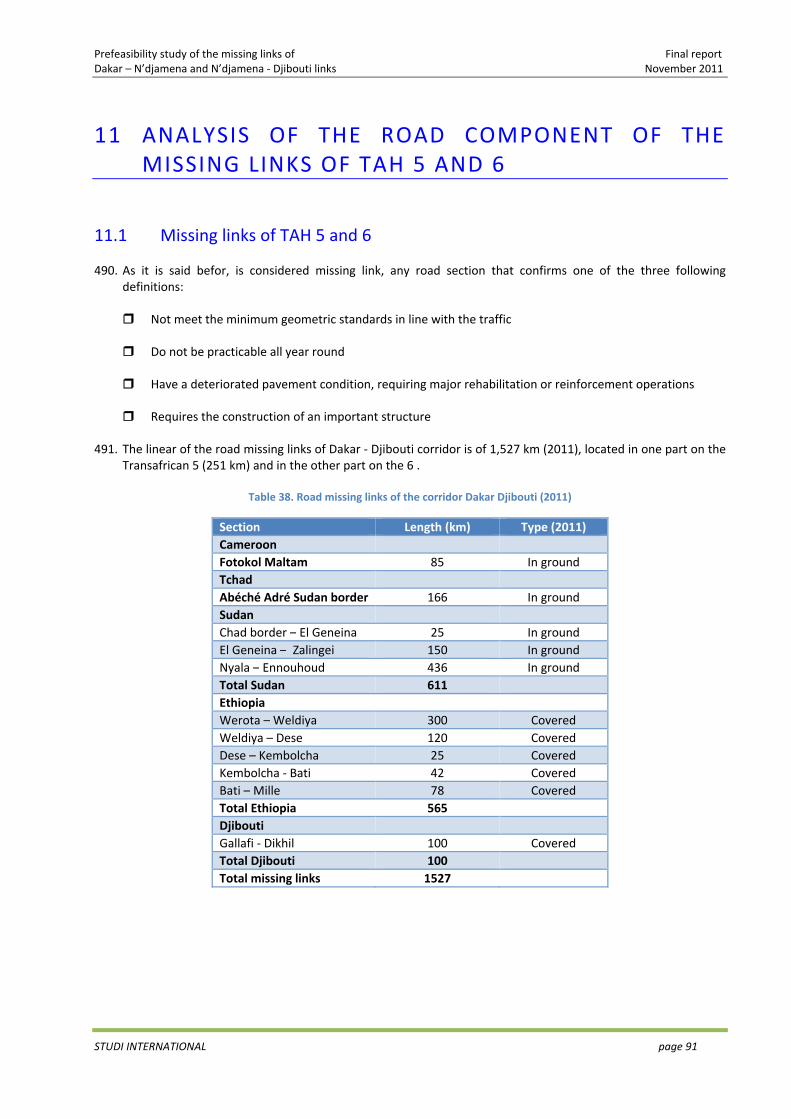
Prefeasibility study of the missing links of Final report Dakar – N’djamena and N’djamena ‐ Djibouti links November 2011
STUDI INTERNATIONAL page 91
11 ANALYSIS OF THE ROAD COMPONENT OF THE MISSING LINKS OF TAH 5 AND 6
11.1 Missing links of TAH 5 and 6
490. As it is said befor, is considered missing link, any road section that confirms one of the three following definitions:
Not meet the minimum geometric standards in line with the traffic
Do not be practicable all year round
Have a deteriorated pavement condition, requiring major rehabilitation or reinforcement operations
Requires the construction of an important structure
491. The linear of the road missing links of Dakar ‐ Djibouti corridor is of 1,527 km (2011), located in one part on the Transafrican 5 (251 km) and in the other part on the 6 .
Table 38. Road missing links of the corridor Dakar Djibouti (2011)
Section Length (km) Type (2011) Cameroon Fotokol Maltam 85 In ground Tchad Abéché Adré Sudan border 166 In ground Sudan Chad border – El Geneina 25 In ground El Geneina – Zalingei 150 In ground Nyala – Ennouhoud 436 In ground Total Sudan 611Ethiopia Werota – Weldiya 300 Covered Weldiya – Dese 120 Covered Dese – Kembolcha 25 Covered Kembolcha ‐ Bati 42 Covered Bati – Mille 78 Covered Total Ethiopia 565Djibouti Gallafi ‐ Dikhil 100 Covered Total Djibouti 100Total missing links 1527
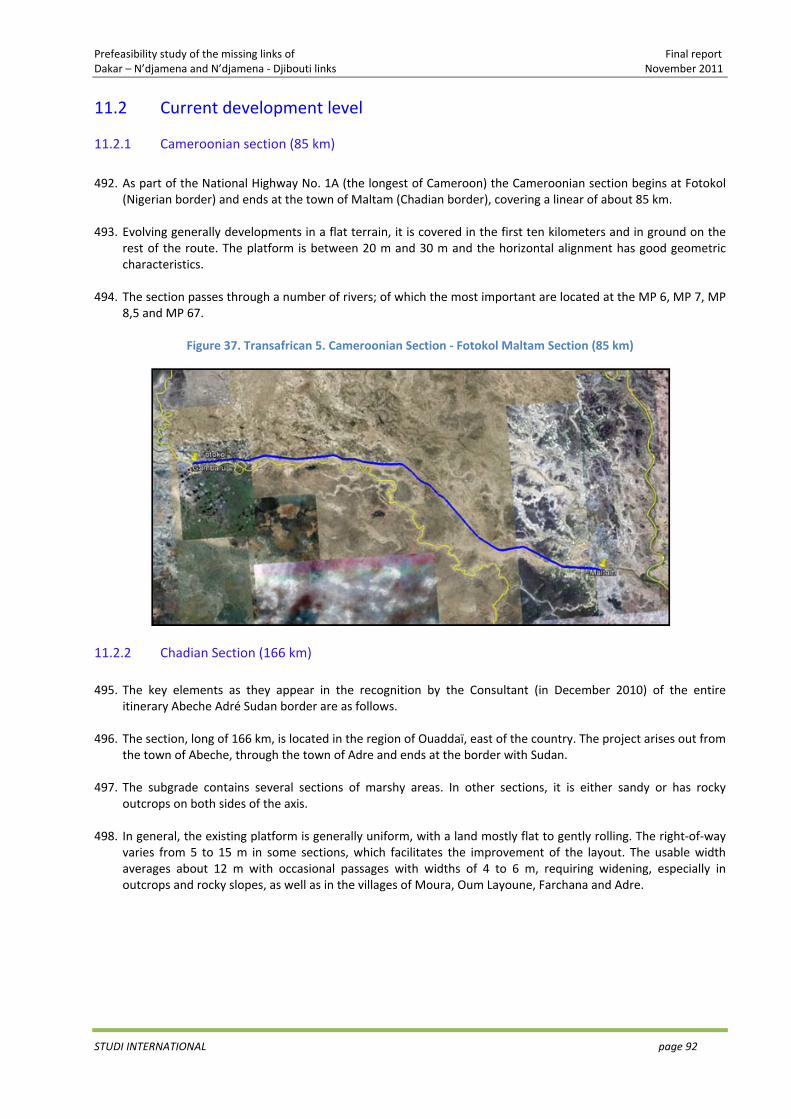
Prefeasibility study of the missing links of Final report Dakar – N’djamena and N’djamena ‐ Djibouti links November 2011
STUDI INTERNATIONAL page 92
11.2 Current development level
11.2.1 Cameroonian section (85 km)
492. As part of the National Highway No. 1A (the longest of Cameroon) the Cameroonian section begins at Fotokol
(Nigerian border) and ends at the town of Maltam (Chadian border), covering a linear of about 85 km. 493. Evolving generally developments in a flat terrain, it is covered in the first ten kilometers and in ground on the
rest of the route. The platform is between 20 m and 30 m and the horizontal alignment has good geometric characteristics.
494. The section passes through a number of rivers; of which the most important are located at the MP 6, MP 7, MP
8,5 and MP 67.
Figure 37. Transafrican 5. Cameroonian Section ‐ Fotokol Maltam Section (85 km)
11.2.2 Chadian Section (166 km) 495. The key elements as they appear in the recognition by the Consultant (in December 2010) of the entire
itinerary Abeche Adré Sudan border are as follows. 496. The section, long of 166 km, is located in the region of Ouaddaï, east of the country. The project arises out from
the town of Abeche, through the town of Adre and ends at the border with Sudan.
497. The subgrade contains several sections of marshy areas. In other sections, it is either sandy or has rocky outcrops on both sides of the axis.
498. In general, the existing platform is generally uniform, with a land mostly flat to gently rolling. The right‐of‐way
varies from 5 to 15 m in some sections, which facilitates the improvement of the layout. The usable width averages about 12 m with occasional passages with widths of 4 to 6 m, requiring widening, especially in outcrops and rocky slopes, as well as in the villages of Moura, Oum Layoune, Farchana and Adre.
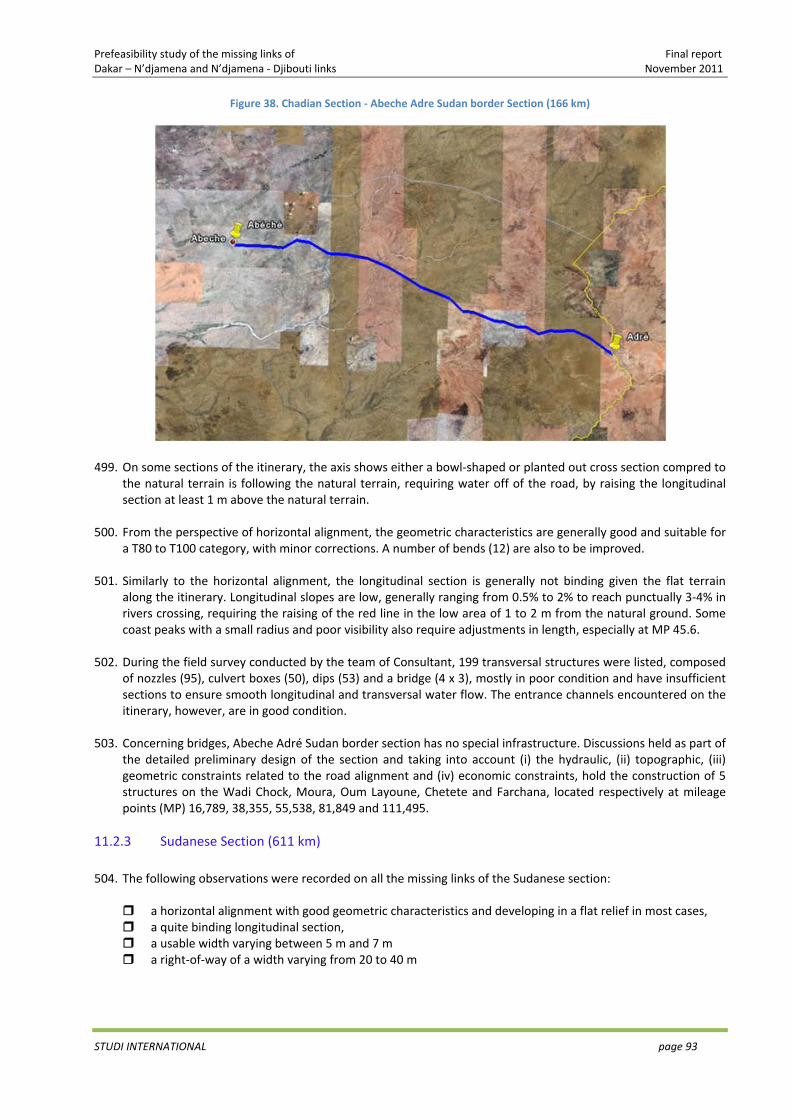
Prefeasibility study of the missing links of Final report Dakar – N’djamena and N’djamena ‐ Djibouti links November 2011
STUDI INTERNATIONAL page 93
Figure 38. Chadian Section ‐ Abeche Adre Sudan border Section (166 km)
499. On some sections of the itinerary, the axis shows either a bowl‐shaped or planted out cross section compred to
the natural terrain is following the natural terrain, requiring water off of the road, by raising the longitudinal section at least 1 m above the natural terrain.
500. From the perspective of horizontal alignment, the geometric characteristics are generally good and suitable for
a T80 to T100 category, with minor corrections. A number of bends (12) are also to be improved.
501. Similarly to the horizontal alignment, the longitudinal section is generally not binding given the flat terrain along the itinerary. Longitudinal slopes are low, generally ranging from 0.5% to 2% to reach punctually 3‐4% in rivers crossing, requiring the raising of the red line in the low area of 1 to 2 m from the natural ground. Some coast peaks with a small radius and poor visibility also require adjustments in length, especially at MP 45.6.
502. During the field survey conducted by the team of Consultant, 199 transversal structures were listed, composed
of nozzles (95), culvert boxes (50), dips (53) and a bridge (4 x 3), mostly in poor condition and have insufficient sections to ensure smooth longitudinal and transversal water flow. The entrance channels encountered on the itinerary, however, are in good condition.
503. Concerning bridges, Abeche Adré Sudan border section has no special infrastructure. Discussions held as part of
the detailed preliminary design of the section and taking into account (i) the hydraulic, (ii) topographic, (iii) geometric constraints related to the road alignment and (iv) economic constraints, hold the construction of 5 structures on the Wadi Chock, Moura, Oum Layoune, Chetete and Farchana, located respectively at mileage points (MP) 16,789, 38,355, 55,538, 81,849 and 111,495.
11.2.3 Sudanese Section (611 km) 504. The following observations were recorded on all the missing links of the Sudanese section:
a horizontal alignment with good geometric characteristics and developing in a flat relief in most cases, a quite binding longitudinal section, a usable width varying between 5 m and 7 m a right‐of‐way of a width varying from 20 to 40 m
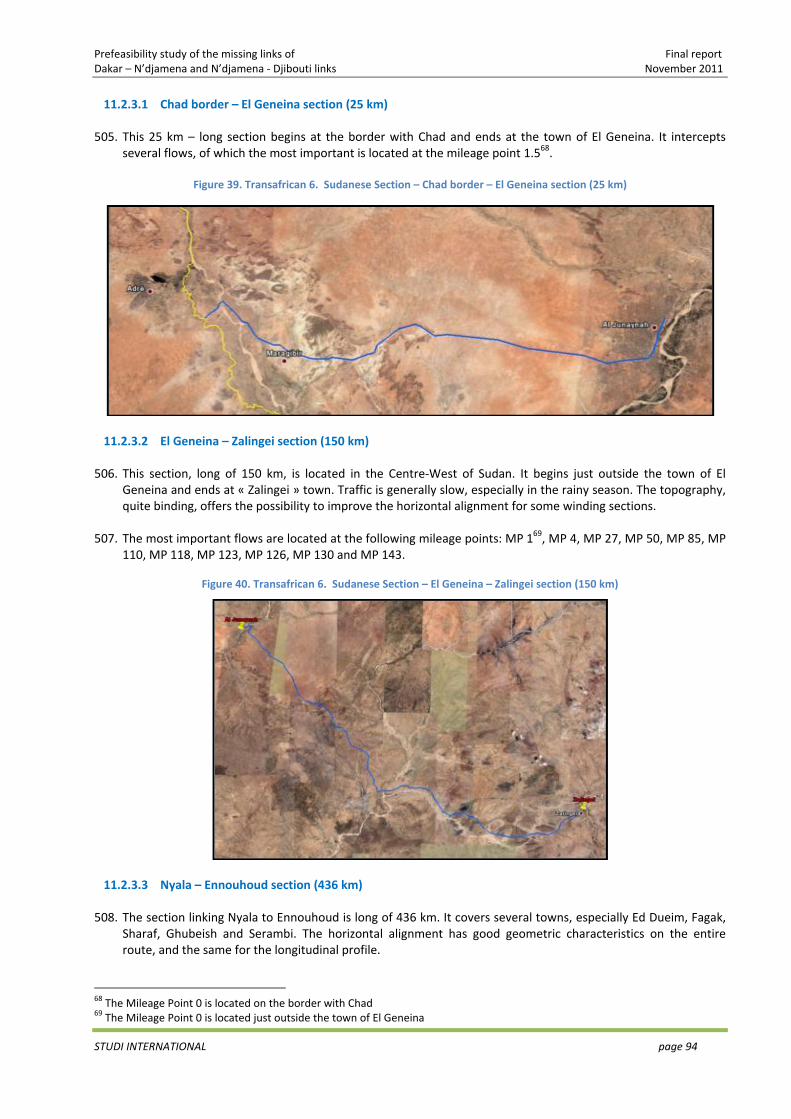
Prefeasibility study of the missing links of Final report Dakar – N’djamena and N’djamena ‐ Djibouti links November 2011
STUDI INTERNATIONAL page 94
11.2.3.1 Chad border – El Geneina section (25 km)
505. This 25 km – long section begins at the border with Chad and ends at the town of El Geneina. It intercepts several flows, of which the most important is located at the mileage point 1.568.
Figure 39. Transafrican 6. Sudanese Section – Chad border – El Geneina section (25 km)
11.2.3.2 El Geneina – Zalingei section (150 km)
506. This section, long of 150 km, is located in the Centre‐West of Sudan. It begins just outside the town of El
Geneina and ends at « Zalingei » town. Traffic is generally slow, especially in the rainy season. The topography, quite binding, offers the possibility to improve the horizontal alignment for some winding sections.
507. The most important flows are located at the following mileage points: MP 169, MP 4, MP 27, MP 50, MP 85, MP 110, MP 118, MP 123, MP 126, MP 130 and MP 143.
Figure 40. Transafrican 6. Sudanese Section – El Geneina – Zalingei section (150 km)
11.2.3.3 Nyala – Ennouhoud section (436 km)
508. The section linking Nyala to Ennouhoud is long of 436 km. It covers several towns, especially Ed Dueim, Fagak, Sharaf, Ghubeish and Serambi. The horizontal alignment has good geometric characteristics on the entire route, and the same for the longitudinal profile.
68 The Mileage Point 0 is located on the border with Chad 69 The Mileage Point 0 is located just outside the town of El Geneina
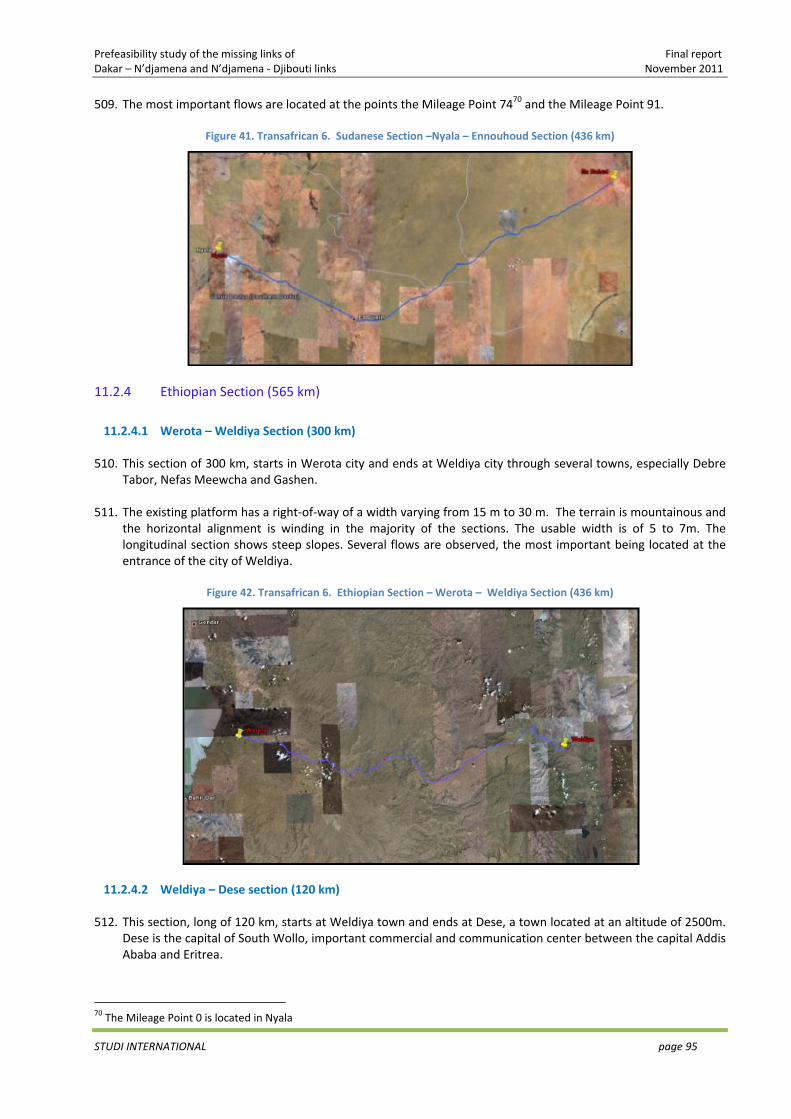
Prefeasibility study of the missing links of Final report Dakar – N’djamena and N’djamena ‐ Djibouti links November 2011
STUDI INTERNATIONAL page 95
509. The most important flows are located at the points the Mileage Point 7470 and the Mileage Point 91.
Figure 41. Transafrican 6. Sudanese Section –Nyala – Ennouhoud Section (436 km)
11.2.4 Ethiopian Section (565 km)
11.2.4.1 Werota – Weldiya Section (300 km)
510. This section of 300 km, starts in Werota city and ends at Weldiya city through several towns, especially Debre
Tabor, Nefas Meewcha and Gashen. 511. The existing platform has a right‐of‐way of a width varying from 15 m to 30 m. The terrain is mountainous and
the horizontal alignment is winding in the majority of the sections. The usable width is of 5 to 7m. The longitudinal section shows steep slopes. Several flows are observed, the most important being located at the entrance of the city of Weldiya.
Figure 42. Transafrican 6. Ethiopian Section – Werota – Weldiya Section (436 km)
11.2.4.2 Weldiya – Dese section (120 km) 512. This section, long of 120 km, starts at Weldiya town and ends at Dese, a town located at an altitude of 2500m.
Dese is the capital of South Wollo, important commercial and communication center between the capital Addis Ababa and Eritrea.
70 The Mileage Point 0 is located in Nyala
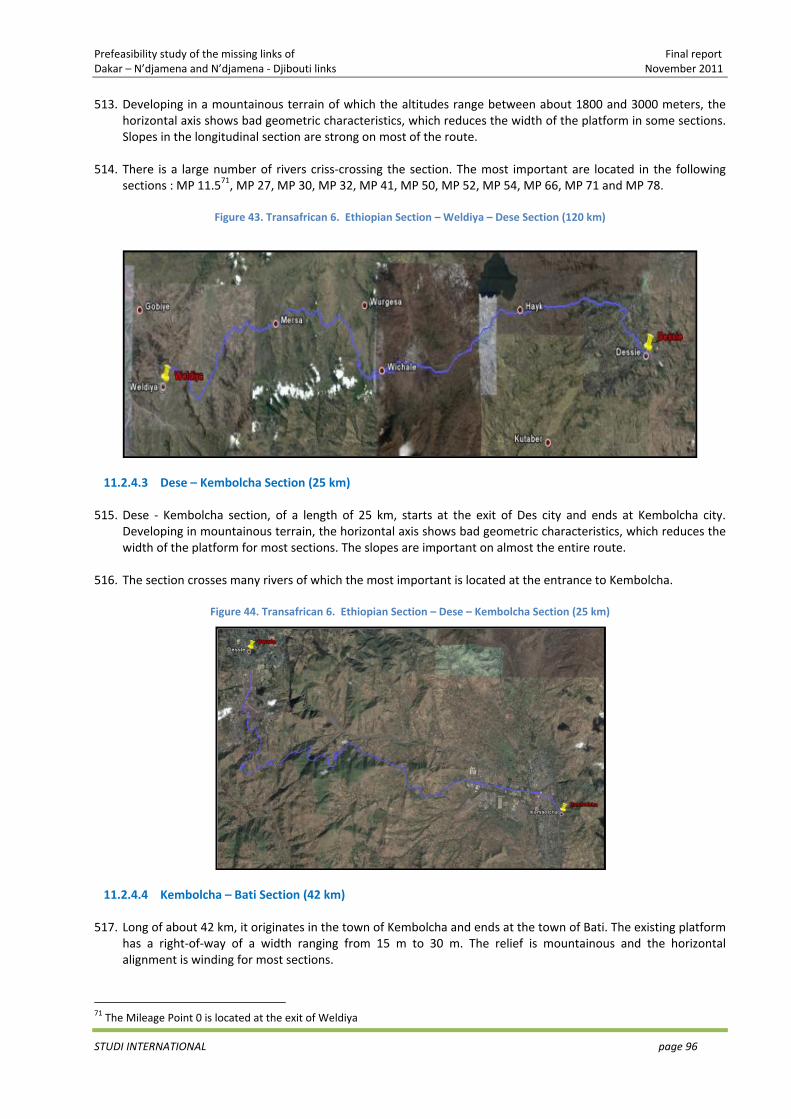
Prefeasibility study of the missing links of Final report Dakar – N’djamena and N’djamena ‐ Djibouti links November 2011
STUDI INTERNATIONAL page 96
513. Developing in a mountainous terrain of which the altitudes range between about 1800 and 3000 meters, the horizontal axis shows bad geometric characteristics, which reduces the width of the platform in some sections. Slopes in the longitudinal section are strong on most of the route.
514. There is a large number of rivers criss‐crossing the section. The most important are located in the following sections : MP 11.571, MP 27, MP 30, MP 32, MP 41, MP 50, MP 52, MP 54, MP 66, MP 71 and MP 78.
Figure 43. Transafrican 6. Ethiopian Section – Weldiya – Dese Section (120 km)
11.2.4.3 Dese – Kembolcha Section (25 km)
515. Dese ‐ Kembolcha section, of a length of 25 km, starts at the exit of Des city and ends at Kembolcha city. Developing in mountainous terrain, the horizontal axis shows bad geometric characteristics, which reduces the width of the platform for most sections. The slopes are important on almost the entire route.
516. The section crosses many rivers of which the most important is located at the entrance to Kembolcha.
Figure 44. Transafrican 6. Ethiopian Section – Dese – Kembolcha Section (25 km)
11.2.4.4 Kembolcha – Bati Section (42 km)
517. Long of about 42 km, it originates in the town of Kembolcha and ends at the town of Bati. The existing platform
has a right‐of‐way of a width ranging from 15 m to 30 m. The relief is mountainous and the horizontal alignment is winding for most sections.
71 The Mileage Point 0 is located at the exit of Weldiya
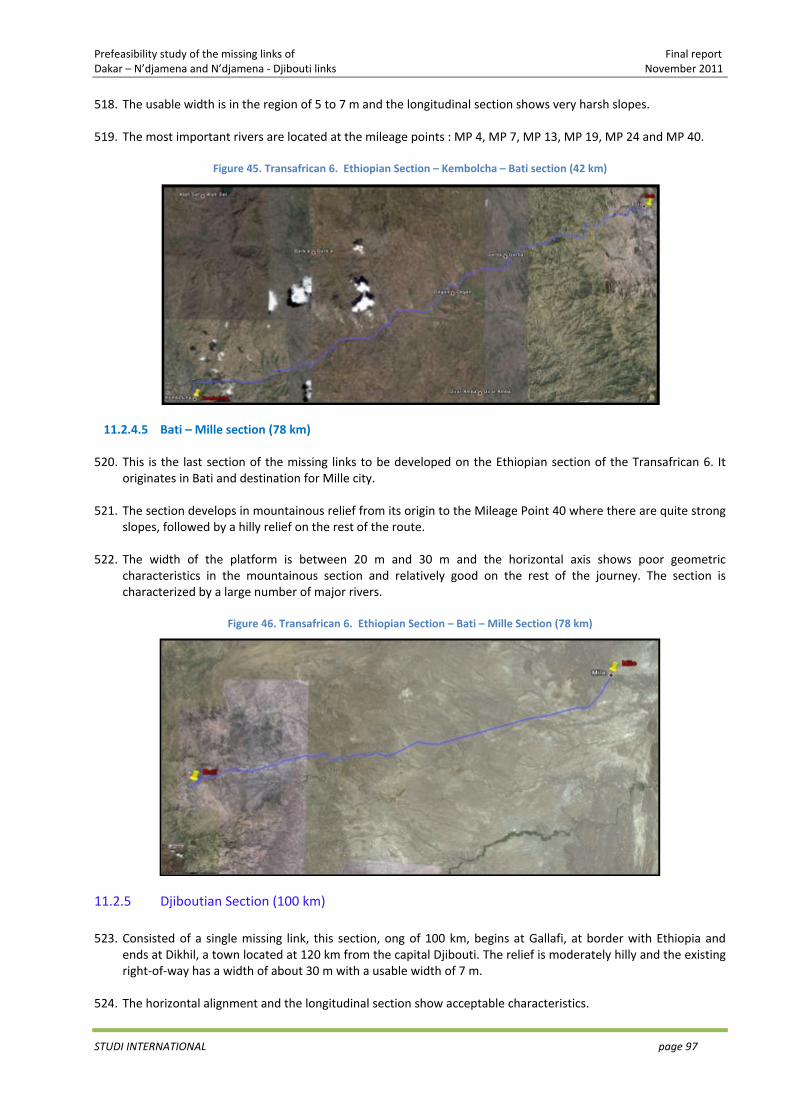
Prefeasibility study of the missing links of Final report Dakar – N’djamena and N’djamena ‐ Djibouti links November 2011
STUDI INTERNATIONAL page 97
518. The usable width is in the region of 5 to 7 m and the longitudinal section shows very harsh slopes.
519. The most important rivers are located at the mileage points : MP 4, MP 7, MP 13, MP 19, MP 24 and MP 40.
Figure 45. Transafrican 6. Ethiopian Section – Kembolcha – Bati section (42 km)
11.2.4.5 Bati – Mille section (78 km)
520. This is the last section of the missing links to be developed on the Ethiopian section of the Transafrican 6. It
originates in Bati and destination for Mille city.
521. The section develops in mountainous relief from its origin to the Mileage Point 40 where there are quite strong slopes, followed by a hilly relief on the rest of the route.
522. The width of the platform is between 20 m and 30 m and the horizontal axis shows poor geometric characteristics in the mountainous section and relatively good on the rest of the journey. The section is characterized by a large number of major rivers.
Figure 46. Transafrican 6. Ethiopian Section – Bati – Mille Section (78 km)
11.2.5 Djiboutian Section (100 km) 523. Consisted of a single missing link, this section, ong of 100 km, begins at Gallafi, at border with Ethiopia and
ends at Dikhil, a town located at 120 km from the capital Djibouti. The relief is moderately hilly and the existing right‐of‐way has a width of about 30 m with a usable width of 7 m.
524. The horizontal alignment and the longitudinal section show acceptable characteristics.
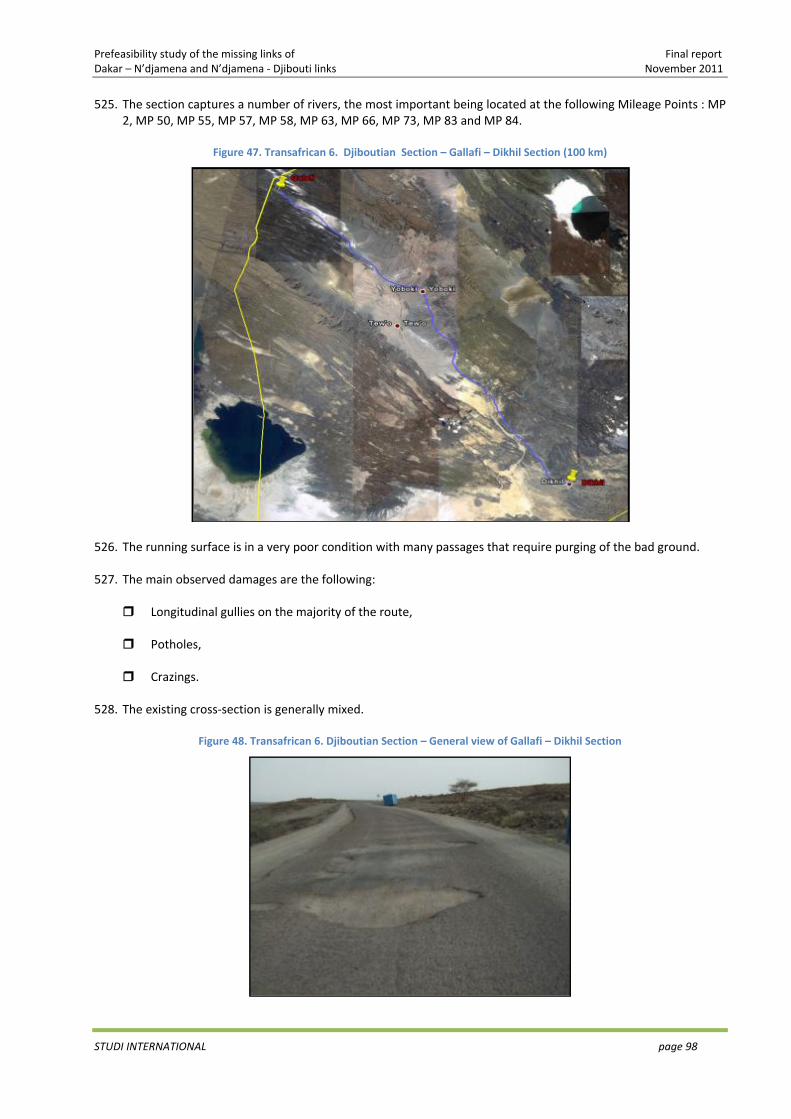
Prefeasibility study of the missing links of Final report Dakar – N’djamena and N’djamena ‐ Djibouti links November 2011
STUDI INTERNATIONAL page 98
525. The section captures a number of rivers, the most important being located at the following Mileage Points : MP 2, MP 50, MP 55, MP 57, MP 58, MP 63, MP 66, MP 73, MP 83 and MP 84.
Figure 47. Transafrican 6. Djiboutian Section – Gallafi – Dikhil Section (100 km)
526. The running surface is in a very poor condition with many passages that require purging of the bad ground.
527. The main observed damages are the following:
Longitudinal gullies on the majority of the route,
Potholes,
Crazings. 528. The existing cross‐section is generally mixed.
Figure 48. Transafrican 6. Djiboutian Section – General view of Gallafi – Dikhil Section
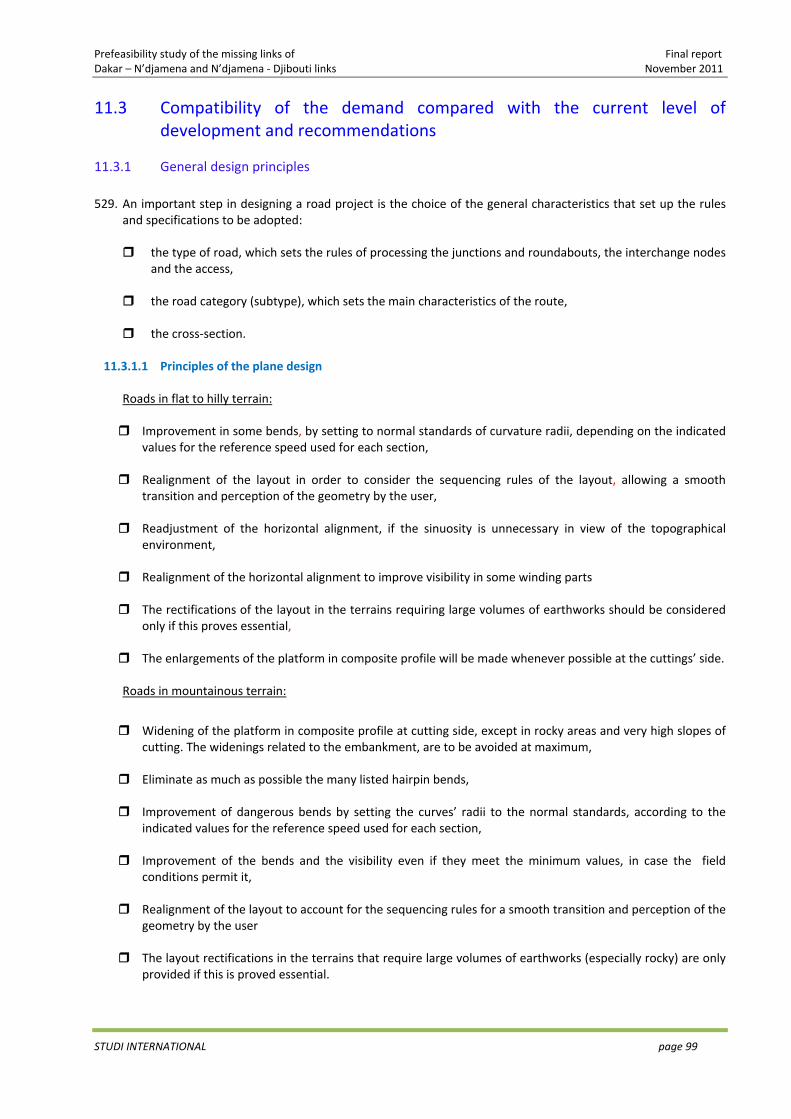
Prefeasibility study of the missing links of Final report Dakar – N’djamena and N’djamena ‐ Djibouti links November 2011
STUDI INTERNATIONAL page 99
11.3 Compatibility of the demand compared with the current level of development and recommendations
11.3.1 General design principles
529. An important step in designing a road project is the choice of the general characteristics that set up the rules and specifications to be adopted:
the type of road, which sets the rules of processing the junctions and roundabouts, the interchange nodes and the access,
the road category (subtype), which sets the main characteristics of the route,
the cross‐section. 11.3.1.1 Principles of the plane design
Roads in flat to hilly terrain:
Improvement in some bends, by setting to normal standards of curvature radii, depending on the indicated values for the reference speed used for each section,
Realignment of the layout in order to consider the sequencing rules of the layout, allowing a smooth transition and perception of the geometry by the user,
Readjustment of the horizontal alignment, if the sinuosity is unnecessary in view of the topographical environment,
Realignment of the horizontal alignment to improve visibility in some winding parts
The rectifications of the layout in the terrains requiring large volumes of earthworks should be considered only if this proves essential,
The enlargements of the platform in composite profile will be made whenever possible at the cuttings’ side.
Roads in mountainous terrain:
Widening of the platform in composite profile at cutting side, except in rocky areas and very high slopes of cutting. The widenings related to the embankment, are to be avoided at maximum,
Eliminate as much as possible the many listed hairpin bends,
Improvement of dangerous bends by setting the curves’ radii to the normal standards, according to the indicated values for the reference speed used for each section,
Improvement of the bends and the visibility even if they meet the minimum values, in case the field conditions permit it,
Realignment of the layout to account for the sequencing rules for a smooth transition and perception of the geometry by the user
The layout rectifications in the terrains that require large volumes of earthworks (especially rocky) are only provided if this is proved essential.
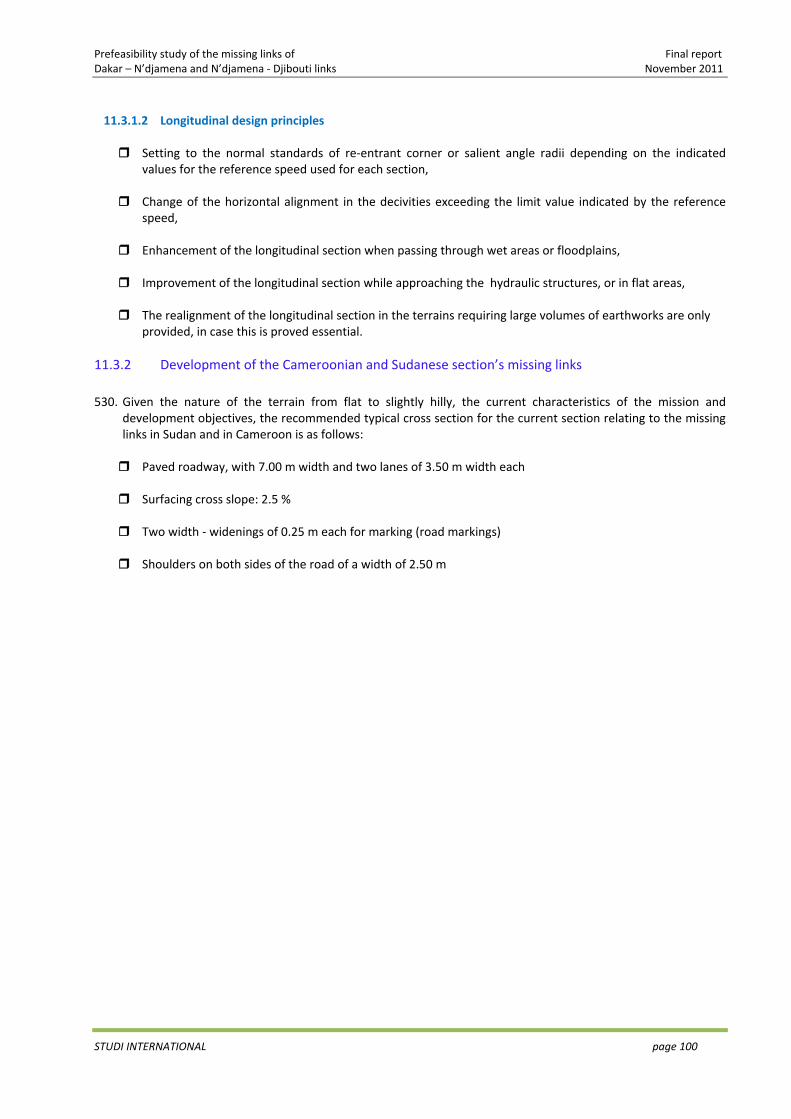
Prefeasibility study of the missing links of Final report Dakar – N’djamena and N’djamena ‐ Djibouti links November 2011
STUDI INTERNATIONAL page 100
11.3.1.2 Longitudinal design principles
Setting to the normal standards of re‐entrant corner or salient angle radii depending on the indicated values for the reference speed used for each section,
Change of the horizontal alignment in the decivities exceeding the limit value indicated by the reference speed,
Enhancement of the longitudinal section when passing through wet areas or floodplains,
Improvement of the longitudinal section while approaching the hydraulic structures, or in flat areas,
The realignment of the longitudinal section in the terrains requiring large volumes of earthworks are only provided, in case this is proved essential.
11.3.2 Development of the Cameroonian and Sudanese section’s missing links
530. Given the nature of the terrain from flat to slightly hilly, the current characteristics of the mission and development objectives, the recommended typical cross section for the current section relating to the missing links in Sudan and in Cameroon is as follows:
Paved roadway, with 7.00 m width and two lanes of 3.50 m width each
Surfacing cross slope: 2.5 %
Two width ‐ widenings of 0.25 m each for marking (road markings)
Shoulders on both sides of the road of a width of 2.50 m
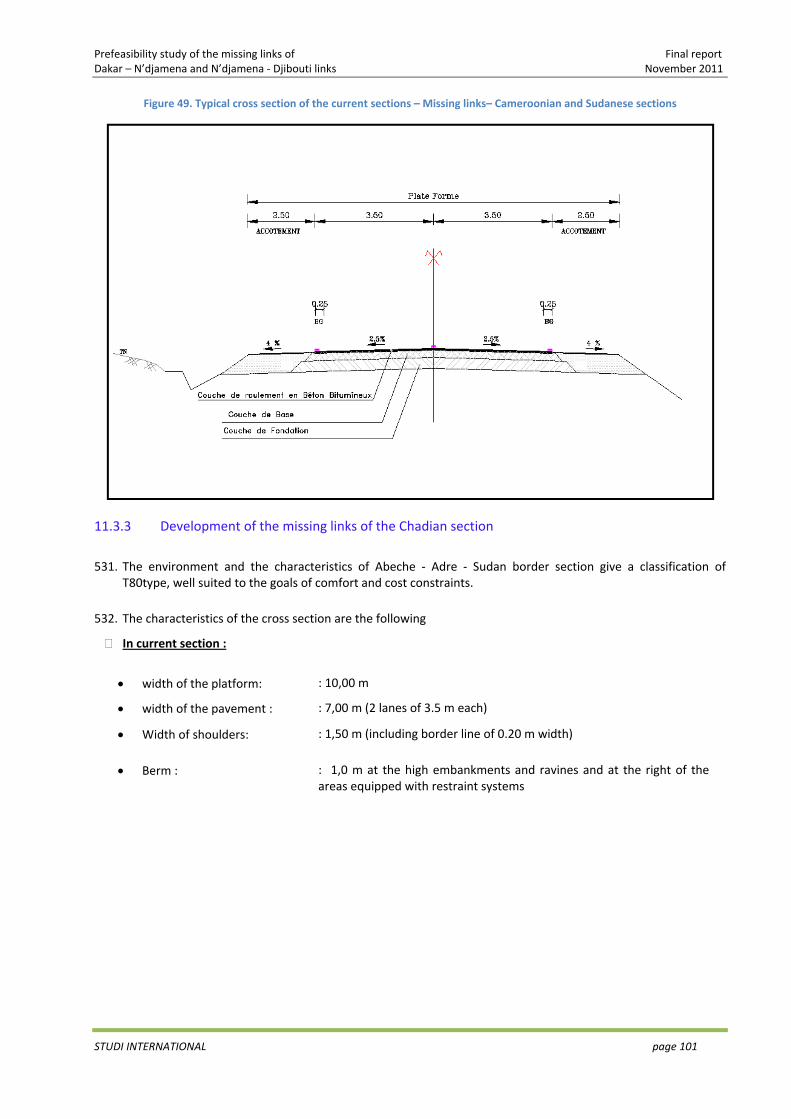
Prefeasibility study of the missing links of Final report Dakar – N’djamena and N’djamena ‐ Djibouti links November 2011
STUDI INTERNATIONAL page 101
Figure 49. Typical cross section of the current sections – Missing links– Cameroonian and Sudanese sections
11.3.3 Development of the missing links of the Chadian section
531. The environment and the characteristics of Abeche ‐ Adre ‐ Sudan border section give a classification of
T80type, well suited to the goals of comfort and cost constraints. 532. The characteristics of the cross section are the following
In current section :
• width of the platform: : 10,00 m
• width of the pavement : : 7,00 m (2 lanes of 3.5 m each)
• Width of shoulders: : 1,50 m (including border line of 0.20 m width)
• Berm : : 1,0 m at the high embankments and ravines and at the right of the areas equipped with restraint systems
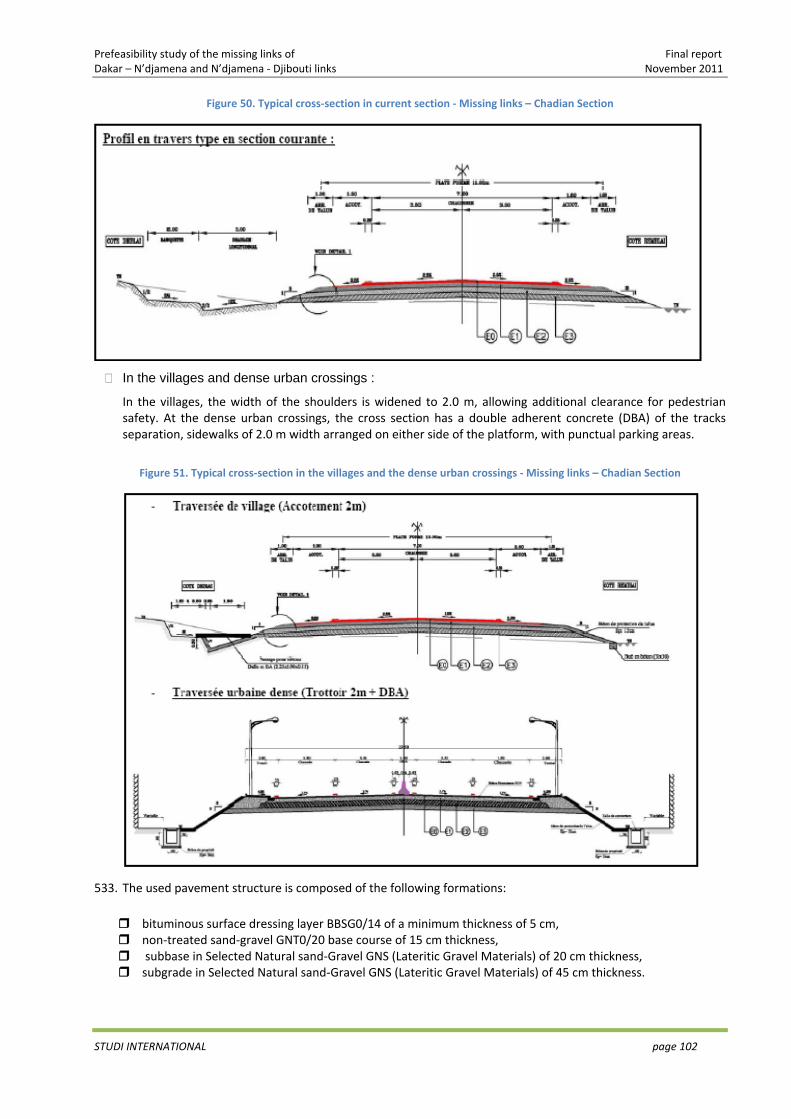
Prefeasibility study of the missing links of Final report Dakar – N’djamena and N’djamena ‐ Djibouti links November 2011
STUDI INTERNATIONAL page 102
Figure 50. Typical cross‐section in current section ‐ Missing links – Chadian Section
In the villages and dense urban crossings :
In the villages, the width of the shoulders is widened to 2.0 m, allowing additional clearance for pedestrian safety. At the dense urban crossings, the cross section has a double adherent concrete (DBA) of the tracks separation, sidewalks of 2.0 m width arranged on either side of the platform, with punctual parking areas.
Figure 51. Typical cross‐section in the villages and the dense urban crossings ‐ Missing links – Chadian Section
533. The used pavement structure is composed of the following formations:
bituminous surface dressing layer BBSG0/14 of a minimum thickness of 5 cm, non‐treated sand‐gravel GNT0/20 base course of 15 cm thickness, subbase in Selected Natural sand‐Gravel GNS (Lateritic Gravel Materials) of 20 cm thickness, subgrade in Selected Natural sand‐Gravel GNS (Lateritic Gravel Materials) of 45 cm thickness.
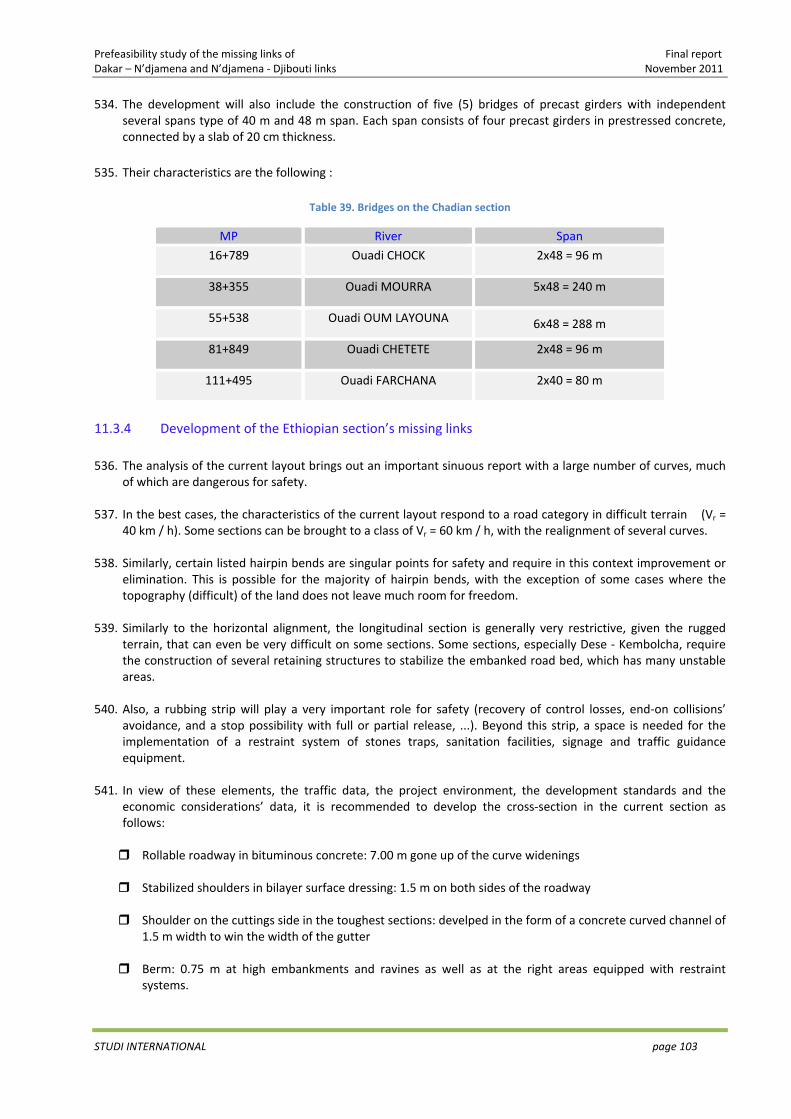
Prefeasibility study of the missing links of Final report Dakar – N’djamena and N’djamena ‐ Djibouti links November 2011
STUDI INTERNATIONAL page 103
534. The development will also include the construction of five (5) bridges of precast girders with independent several spans type of 40 m and 48 m span. Each span consists of four precast girders in prestressed concrete, connected by a slab of 20 cm thickness.
535. Their characteristics are the following :
Table 39. Bridges on the Chadian section
MP River Span
16+789 Ouadi CHOCK 2x48 = 96 m
38+355 Ouadi MOURRA 5x48 = 240 m
55+538 Ouadi OUM LAYOUNA 6x48 = 288 m
81+849 Ouadi CHETETE 2x48 = 96 m
111+495 Ouadi FARCHANA 2x40 = 80 m
11.3.4 Development of the Ethiopian section’s missing links
536. The analysis of the current layout brings out an important sinuous report with a large number of curves, much of which are dangerous for safety.
537. In the best cases, the characteristics of the current layout respond to a road category in difficult terrain (Vr =
40 km / h). Some sections can be brought to a class of Vr = 60 km / h, with the realignment of several curves. 538. Similarly, certain listed hairpin bends are singular points for safety and require in this context improvement or
elimination. This is possible for the majority of hairpin bends, with the exception of some cases where the topography (difficult) of the land does not leave much room for freedom.
539. Similarly to the horizontal alignment, the longitudinal section is generally very restrictive, given the rugged
terrain, that can even be very difficult on some sections. Some sections, especially Dese ‐ Kembolcha, require the construction of several retaining structures to stabilize the embanked road bed, which has many unstable areas.
540. Also, a rubbing strip will play a very important role for safety (recovery of control losses, end‐on collisions’
avoidance, and a stop possibility with full or partial release, ...). Beyond this strip, a space is needed for the implementation of a restraint system of stones traps, sanitation facilities, signage and traffic guidance equipment.
541. In view of these elements, the traffic data, the project environment, the development standards and the
economic considerations’ data, it is recommended to develop the cross‐section in the current section as follows:
Rollable roadway in bituminous concrete: 7.00 m gone up of the curve widenings
Stabilized shoulders in bilayer surface dressing: 1.5 m on both sides of the roadway
Shoulder on the cuttings side in the toughest sections: develped in the form of a concrete curved channel of 1.5 m width to win the width of the gutter
Berm: 0.75 m at high embankments and ravines as well as at the right areas equipped with restraint systems.
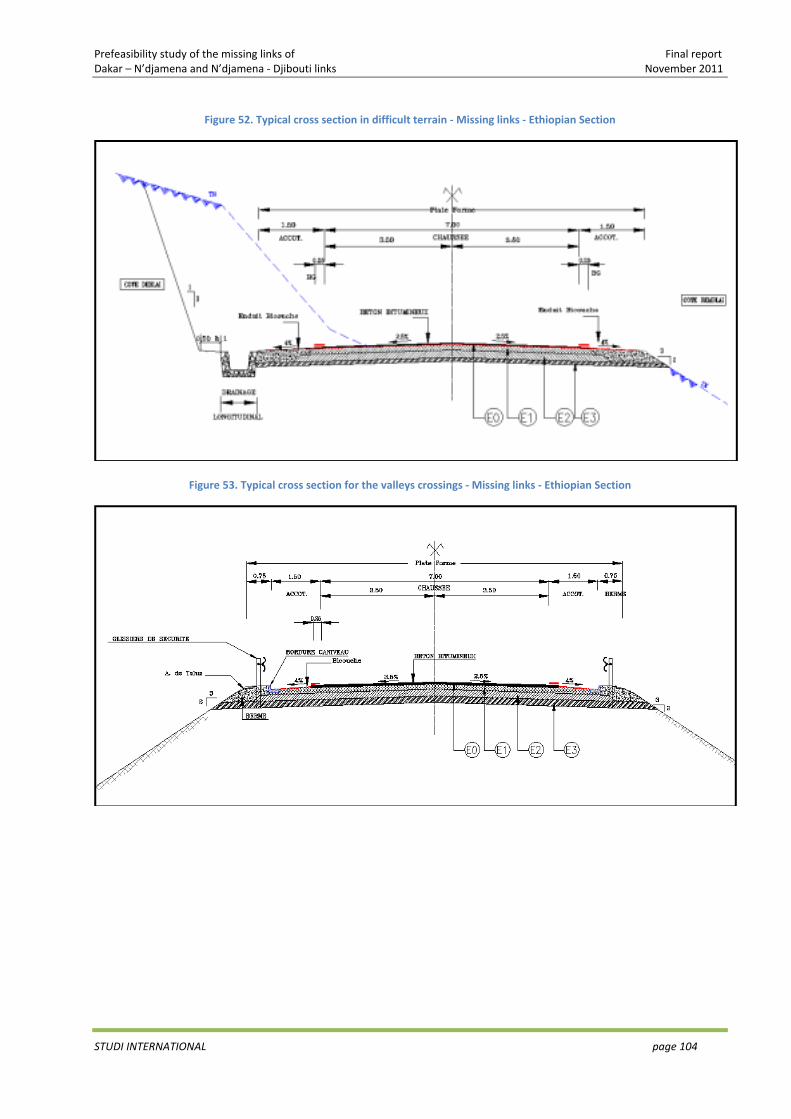
Prefeasibility study of the missing links of Final report Dakar – N’djamena and N’djamena ‐ Djibouti links November 2011
STUDI INTERNATIONAL page 104
Figure 52. Typical cross section in difficult terrain ‐ Missing links ‐ Ethiopian Section
Figure 53. Typical cross section for the valleys crossings ‐ Missing links ‐ Ethiopian Section
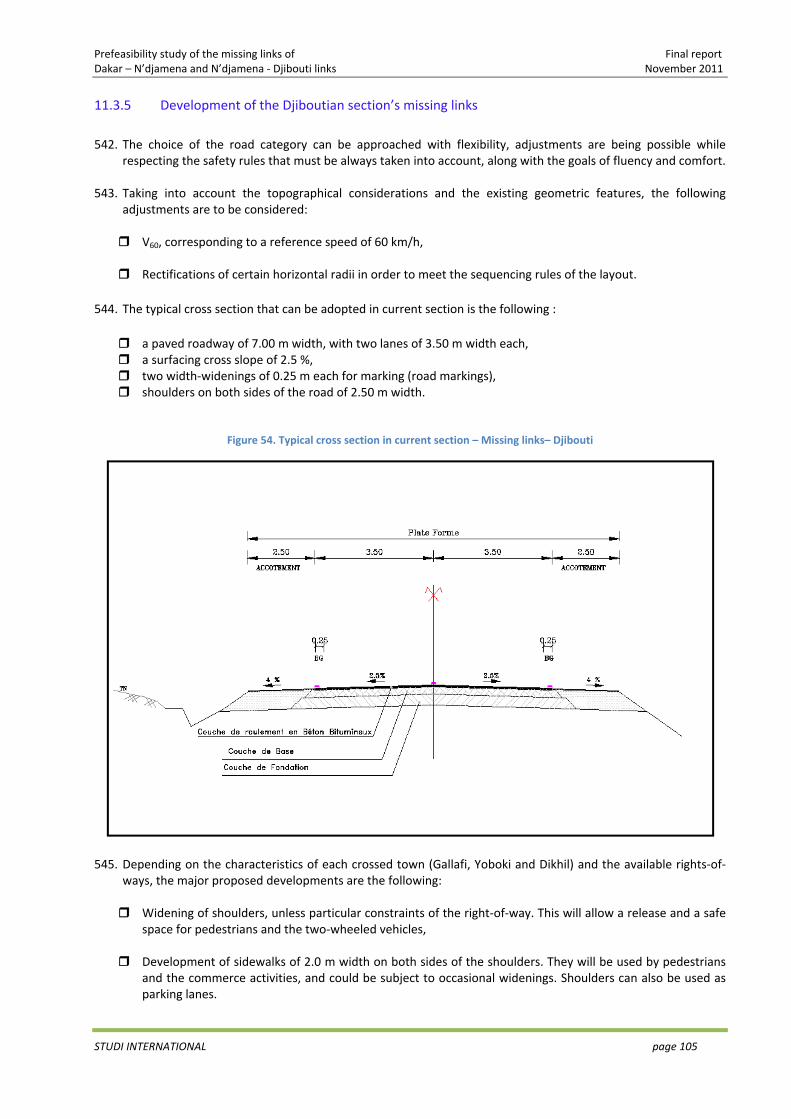
Prefeasibility study of the missing links of Final report Dakar – N’djamena and N’djamena ‐ Djibouti links November 2011
STUDI INTERNATIONAL page 105
11.3.5 Development of the Djiboutian section’s missing links
542. The choice of the road category can be approached with flexibility, adjustments are being possible while
respecting the safety rules that must be always taken into account, along with the goals of fluency and comfort. 543. Taking into account the topographical considerations and the existing geometric features, the following
adjustments are to be considered:
V60, corresponding to a reference speed of 60 km/h,
Rectifications of certain horizontal radii in order to meet the sequencing rules of the layout.
544. The typical cross section that can be adopted in current section is the following :
a paved roadway of 7.00 m width, with two lanes of 3.50 m width each, a surfacing cross slope of 2.5 %, two width‐widenings of 0.25 m each for marking (road markings), shoulders on both sides of the road of 2.50 m width.
Figure 54. Typical cross section in current section – Missing links– Djibouti
545. Depending on the characteristics of each crossed town (Gallafi, Yoboki and Dikhil) and the available rights‐of‐
ways, the major proposed developments are the following:
Widening of shoulders, unless particular constraints of the right‐of‐way. This will allow a release and a safe space for pedestrians and the two‐wheeled vehicles,
Development of sidewalks of 2.0 m width on both sides of the shoulders. They will be used by pedestrians and the commerce activities, and could be subject to occasional widenings. Shoulders can also be used as parking lanes.
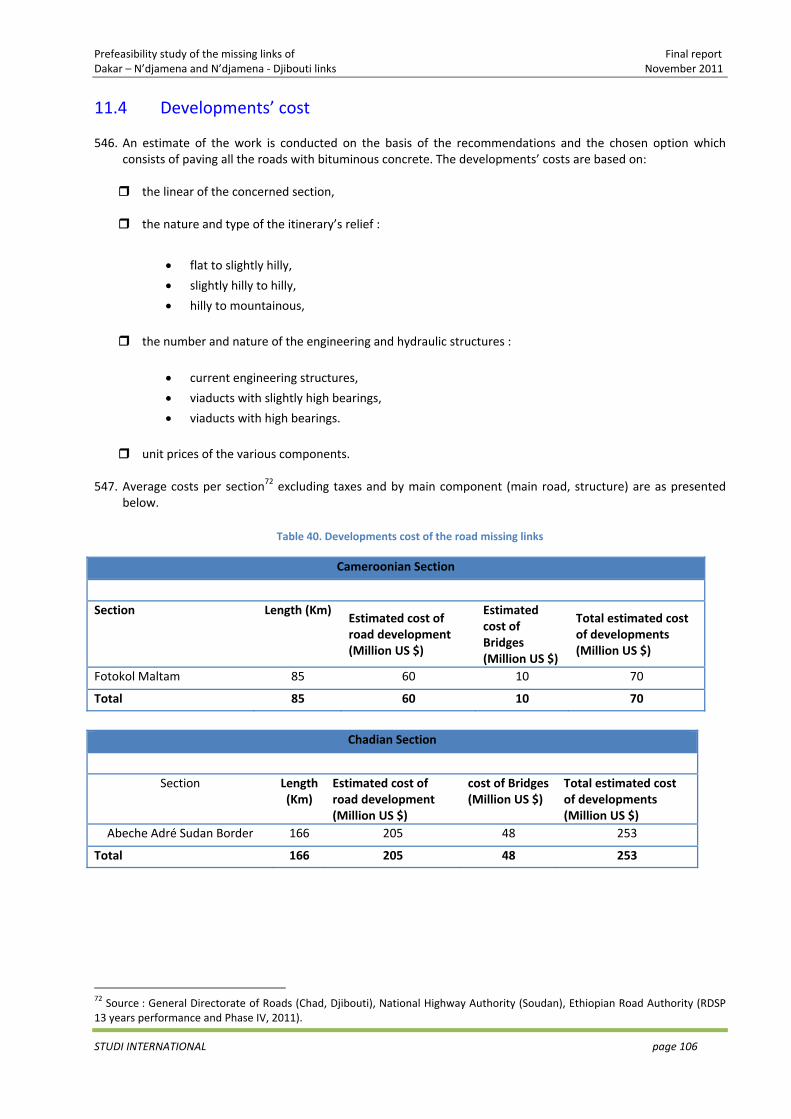
Prefeasibility study of the missing links of Final report Dakar – N’djamena and N’djamena ‐ Djibouti links November 2011
STUDI INTERNATIONAL page 106
11.4 Developments’ cost
546. An estimate of the work is conducted on the basis of the recommendations and the chosen option which consists of paving all the roads with bituminous concrete. The developments’ costs are based on:
the linear of the concerned section,
the nature and type of the itinerary’s relief :
• flat to slightly hilly,
• slightly hilly to hilly,
• hilly to mountainous,
the number and nature of the engineering and hydraulic structures :
• current engineering structures,
• viaducts with slightly high bearings,
• viaducts with high bearings.
unit prices of the various components.
547. Average costs per section72 excluding taxes and by main component (main road, structure) are as presented
below.
Table 40. Developments cost of the road missing links
Cameroonian Section
Section Length (Km)Estimated cost of road development (Million US $)
Estimated cost of Bridges (Million US $)
Total estimated cost of developments (Million US $)
Fotokol Maltam 85 60 10 70
Total 85 60 10 70
Chadian Section
Section Length (Km)
Estimated cost of road development (Million US $)
cost of Bridges (Million US $)
Total estimated cost of developments (Million US $)
Abeche Adré Sudan Border 166 205 48 253
Total 166 205 48 253
72 Source : General Directorate of Roads (Chad, Djibouti), National Highway Authority (Soudan), Ethiopian Road Authority (RDSP 13 years performance and Phase IV, 2011).
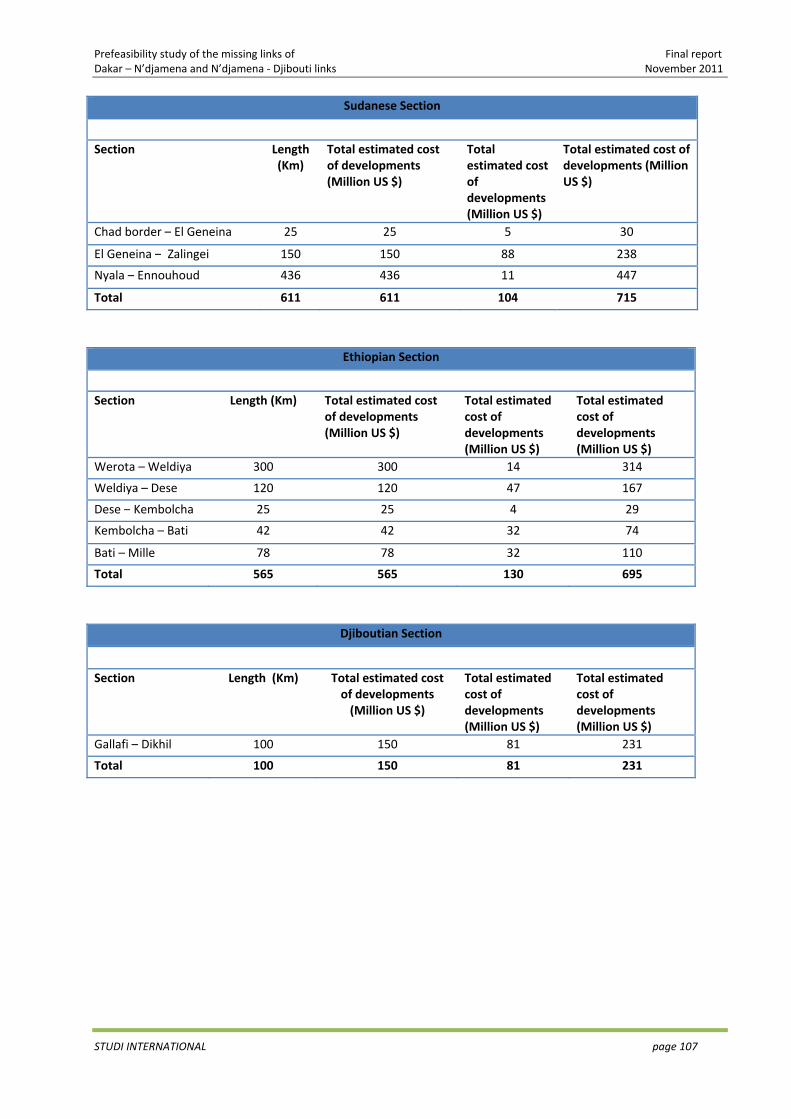
Prefeasibility study of the missing links of Final report Dakar – N’djamena and N’djamena ‐ Djibouti links November 2011
STUDI INTERNATIONAL page 107
Sudanese Section
Section Length (Km)
Total estimated cost of developments (Million US $)
Total estimated cost of developments (Million US $)
Total estimated cost of developments (Million US $)
Chad border – El Geneina 25 25 5 30
El Geneina – Zalingei 150 150 88 238
Nyala – Ennouhoud 436 436 11 447
Total 611 611 104 715
Ethiopian Section
Section Length (Km) Total estimated cost of developments (Million US $)
Total estimated cost of developments (Million US $)
Total estimated cost of developments (Million US $)
Werota – Weldiya 300 300 14 314
Weldiya – Dese 120 120 47 167
Dese – Kembolcha 25 25 4 29
Kembolcha – Bati 42 42 32 74
Bati – Mille 78 78 32 110
Total 565 565 130 695
Djiboutian Section
Section Length (Km) Total estimated cost of developments (Million US $)
Total estimated cost of developments (Million US $)
Total estimated cost of developments (Million US $)
Gallafi – Dikhil 100 150 81 231
Total 100 150 81 231
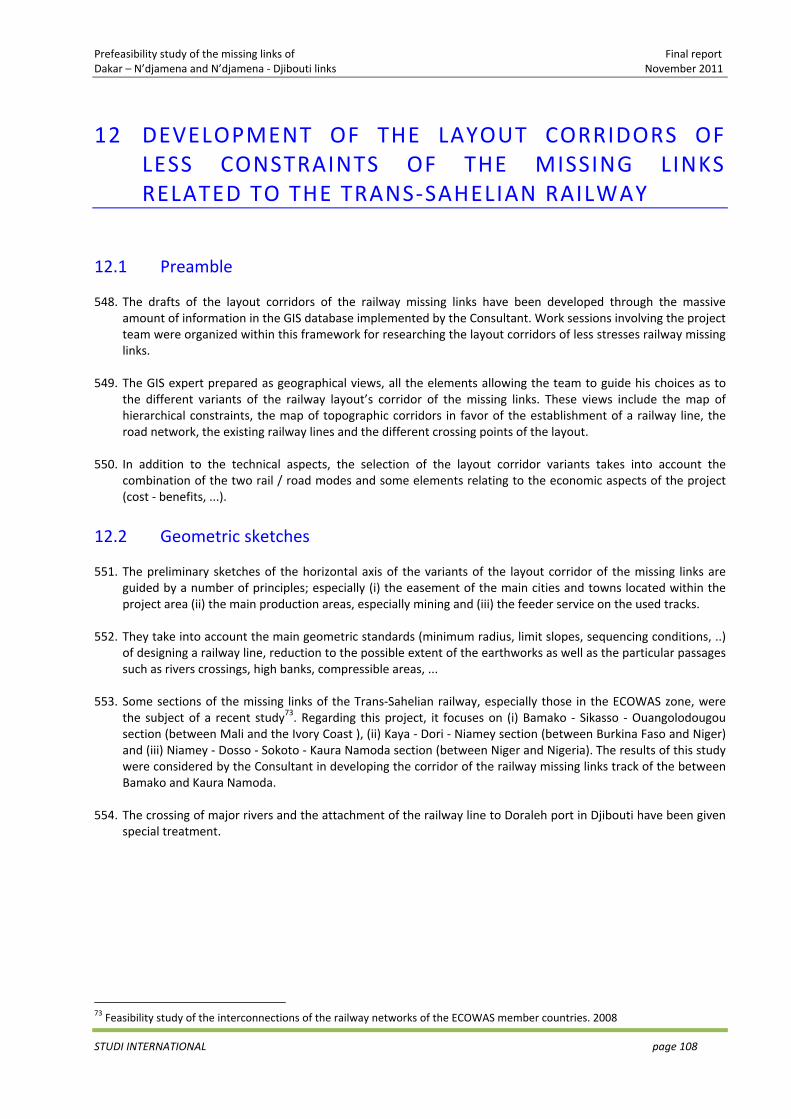
Prefeasibility study of the missing links of Final report Dakar – N’djamena and N’djamena ‐ Djibouti links November 2011
STUDI INTERNATIONAL page 108
12 DEVELOPMENT OF THE LAYOUT CORRIDORS OF LESS CONSTRAINTS OF THE MISSING LINKS RELATED TO THE TRANS‐SAHELIAN RAILWAY
12.1 Preamble
548. The drafts of the layout corridors of the railway missing links have been developed through the massive amount of information in the GIS database implemented by the Consultant. Work sessions involving the project team were organized within this framework for researching the layout corridors of less stresses railway missing links.
549. The GIS expert prepared as geographical views, all the elements allowing the team to guide his choices as to the different variants of the railway layout’s corridor of the missing links. These views include the map of hierarchical constraints, the map of topographic corridors in favor of the establishment of a railway line, the road network, the existing railway lines and the different crossing points of the layout.
550. In addition to the technical aspects, the selection of the layout corridor variants takes into account the combination of the two rail / road modes and some elements relating to the economic aspects of the project (cost ‐ benefits, ...).
12.2 Geometric sketches
551. The preliminary sketches of the horizontal axis of the variants of the layout corridor of the missing links are guided by a number of principles; especially (i) the easement of the main cities and towns located within the project area (ii) the main production areas, especially mining and (iii) the feeder service on the used tracks.
552. They take into account the main geometric standards (minimum radius, limit slopes, sequencing conditions, ..) of designing a railway line, reduction to the possible extent of the earthworks as well as the particular passages such as rivers crossings, high banks, compressible areas, ...
553. Some sections of the missing links of the Trans‐Sahelian railway, especially those in the ECOWAS zone, were the subject of a recent study73. Regarding this project, it focuses on (i) Bamako ‐ Sikasso ‐ Ouangolodougou section (between Mali and the Ivory Coast ), (ii) Kaya ‐ Dori ‐ Niamey section (between Burkina Faso and Niger) and (iii) Niamey ‐ Dosso ‐ Sokoto ‐ Kaura Namoda section (between Niger and Nigeria). The results of this study were considered by the Consultant in developing the corridor of the railway missing links track of the between Bamako and Kaura Namoda.
554. The crossing of major rivers and the attachment of the railway line to Doraleh port in Djibouti have been given special treatment.
73 Feasibility study of the interconnections of the railway networks of the ECOWAS member countries. 2008
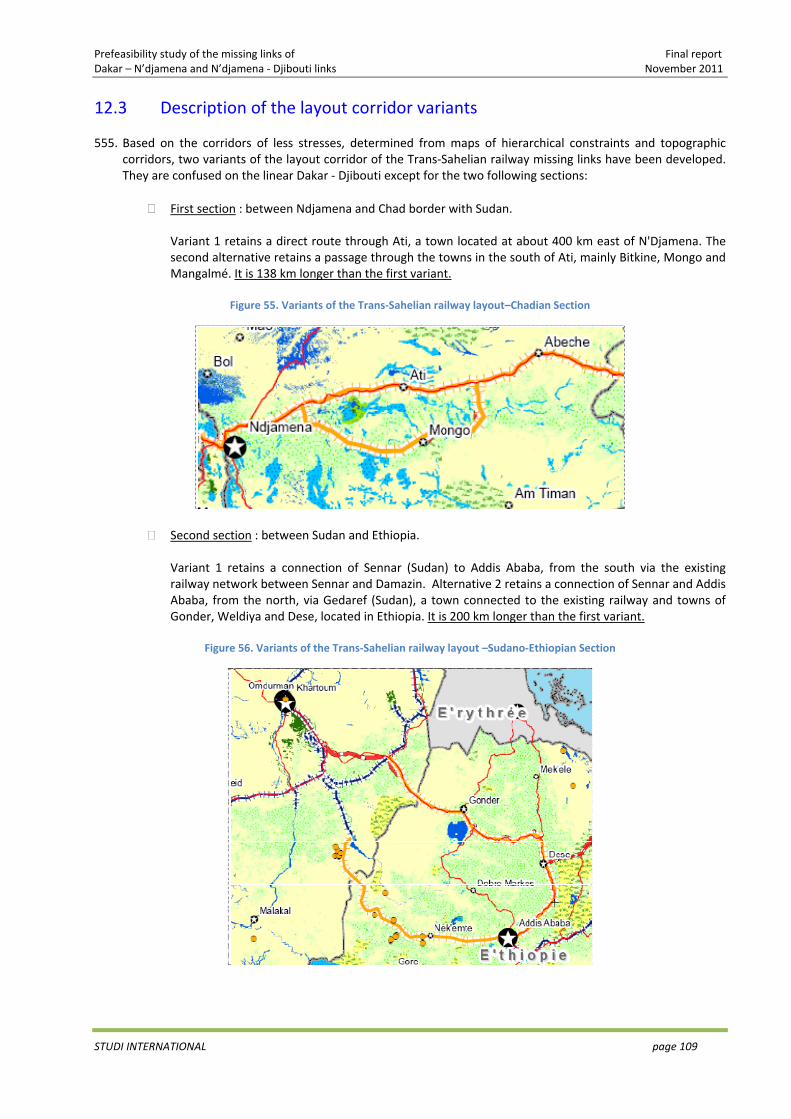
Prefeasibility study of the missing links of Final report Dakar – N’djamena and N’djamena ‐ Djibouti links November 2011
STUDI INTERNATIONAL page 109
12.3 Description of the layout corridor variants
555. Based on the corridors of less stresses, determined from maps of hierarchical constraints and topographic corridors, two variants of the layout corridor of the Trans‐Sahelian railway missing links have been developed. They are confused on the linear Dakar ‐ Djibouti except for the two following sections:
First section : between Ndjamena and Chad border with Sudan.
Variant 1 retains a direct route through Ati, a town located at about 400 km east of N'Djamena. The second alternative retains a passage through the towns in the south of Ati, mainly Bitkine, Mongo and Mangalmé. It is 138 km longer than the first variant.
Figure 55. Variants of the Trans‐Sahelian railway layout–Chadian Section
Second section : between Sudan and Ethiopia.
Variant 1 retains a connection of Sennar (Sudan) to Addis Ababa, from the south via the existing railway network between Sennar and Damazin. Alternative 2 retains a connection of Sennar and Addis Ababa, from the north, via Gedaref (Sudan), a town connected to the existing railway and towns of Gonder, Weldiya and Dese, located in Ethiopia. It is 200 km longer than the first variant.
Figure 56. Variants of the Trans‐Sahelian railway layout –Sudano‐Ethiopian Section
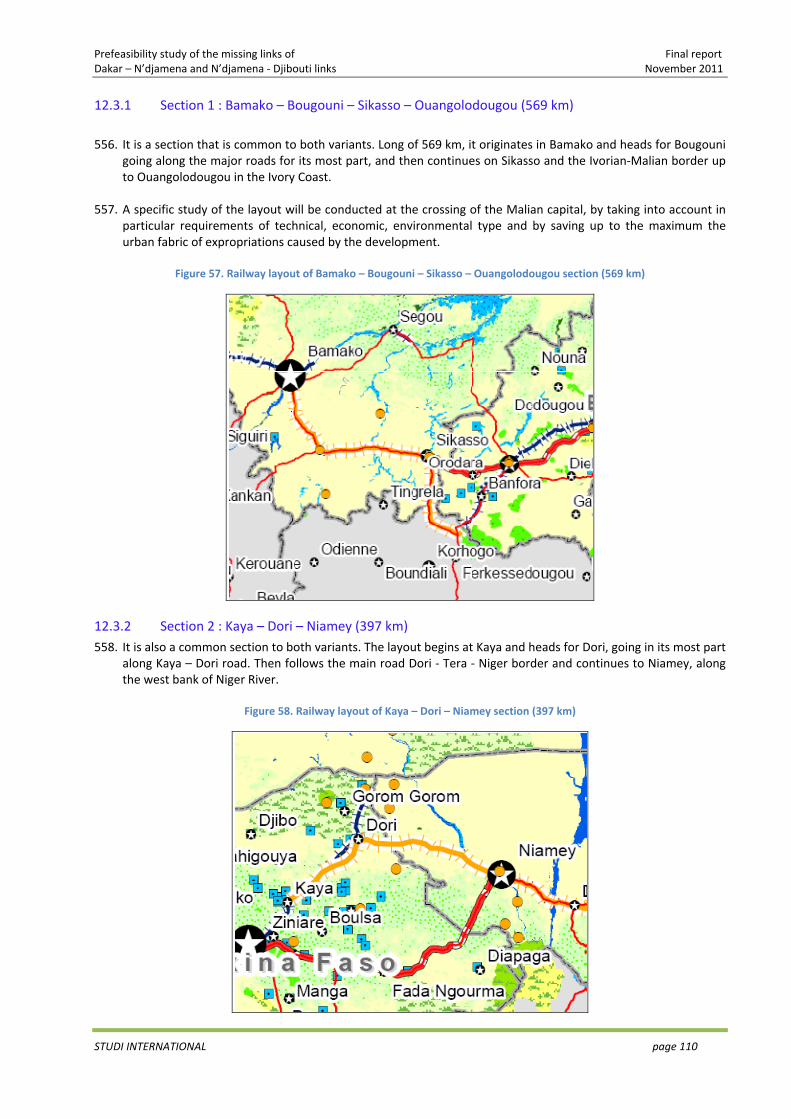
Prefeasibility study of the missing links of Final report Dakar – N’djamena and N’djamena ‐ Djibouti links November 2011
STUDI INTERNATIONAL page 110
12.3.1 Section 1 : Bamako – Bougouni – Sikasso – Ouangolodougou (569 km)
556. It is a section that is common to both variants. Long of 569 km, it originates in Bamako and heads for Bougouni
going along the major roads for its most part, and then continues on Sikasso and the Ivorian‐Malian border up to Ouangolodougou in the Ivory Coast.
557. A specific study of the layout will be conducted at the crossing of the Malian capital, by taking into account in
particular requirements of technical, economic, environmental type and by saving up to the maximum the urban fabric of expropriations caused by the development.
Figure 57. Railway layout of Bamako – Bougouni – Sikasso – Ouangolodougou section (569 km)
12.3.2 Section 2 : Kaya – Dori – Niamey (397 km) 558. It is also a common section to both variants. The layout begins at Kaya and heads for Dori, going in its most part
along Kaya – Dori road. Then follows the main road Dori ‐ Tera ‐ Niger border and continues to Niamey, along the west bank of Niger River.
Figure 58. Railway layout of Kaya – Dori – Niamey section (397 km)
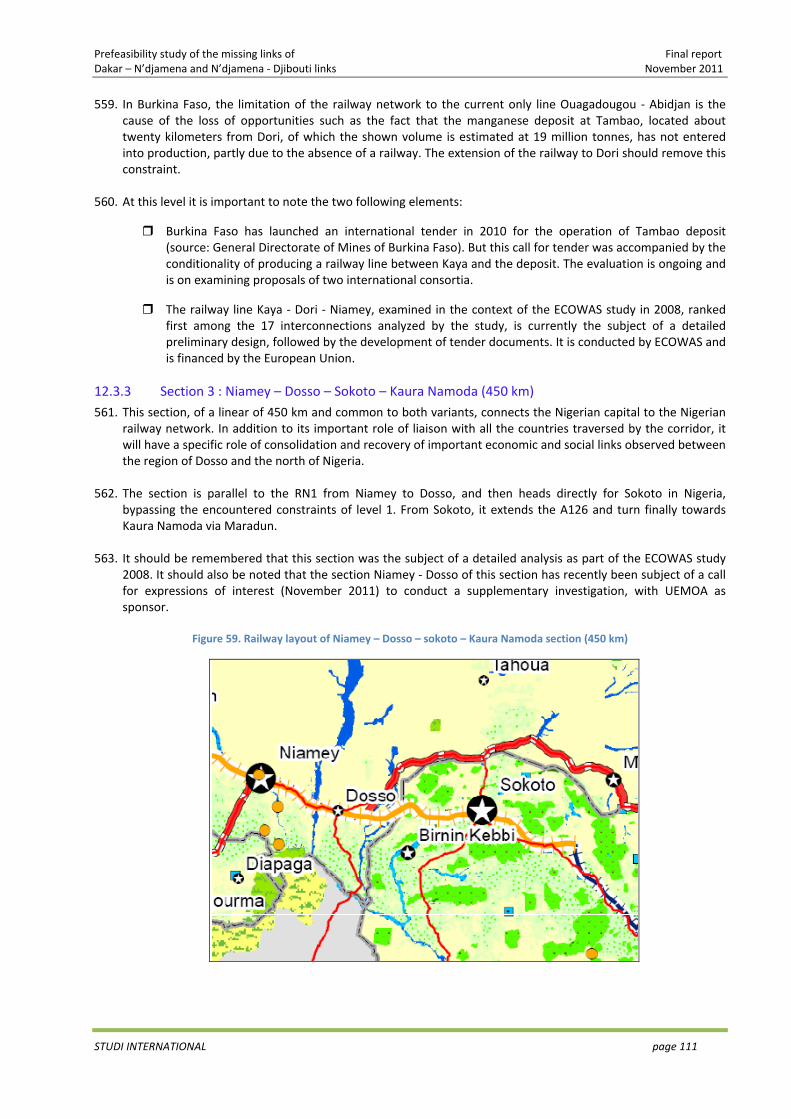
Prefeasibility study of the missing links of Final report Dakar – N’djamena and N’djamena ‐ Djibouti links November 2011
STUDI INTERNATIONAL page 111
559. In Burkina Faso, the limitation of the railway network to the current only line Ouagadougou ‐ Abidjan is the cause of the loss of opportunities such as the fact that the manganese deposit at Tambao, located about twenty kilometers from Dori, of which the shown volume is estimated at 19 million tonnes, has not entered into production, partly due to the absence of a railway. The extension of the railway to Dori should remove this constraint.
560. At this level it is important to note the two following elements:
Burkina Faso has launched an international tender in 2010 for the operation of Tambao deposit (source: General Directorate of Mines of Burkina Faso). But this call for tender was accompanied by the conditionality of producing a railway line between Kaya and the deposit. The evaluation is ongoing and is on examining proposals of two international consortia.
The railway line Kaya ‐ Dori ‐ Niamey, examined in the context of the ECOWAS study in 2008, ranked first among the 17 interconnections analyzed by the study, is currently the subject of a detailed preliminary design, followed by the development of tender documents. It is conducted by ECOWAS and is financed by the European Union.
12.3.3 Section 3 : Niamey – Dosso – Sokoto – Kaura Namoda (450 km) 561. This section, of a linear of 450 km and common to both variants, connects the Nigerian capital to the Nigerian
railway network. In addition to its important role of liaison with all the countries traversed by the corridor, it will have a specific role of consolidation and recovery of important economic and social links observed between the region of Dosso and the north of Nigeria.
562. The section is parallel to the RN1 from Niamey to Dosso, and then heads directly for Sokoto in Nigeria, bypassing the encountered constraints of level 1. From Sokoto, it extends the A126 and turn finally towards Kaura Namoda via Maradun.
563. It should be remembered that this section was the subject of a detailed analysis as part of the ECOWAS study
2008. It should also be noted that the section Niamey ‐ Dosso of this section has recently been subject of a call for expressions of interest (November 2011) to conduct a supplementary investigation, with UEMOA as sponsor.
Figure 59. Railway layout of Niamey – Dosso – sokoto – Kaura Namoda section (450 km)

Prefeasibility study of the missing links of Final report Dakar – N’djamena and N’djamena ‐ Djibouti links November 2011
STUDI INTERNATIONAL page 112
12.3.4 Section 4 : Maiduguri ‐ Ndjamena (270 km) 564. Common to the two alternatives, this section, long of 270 km, runs parallel with the RN2 in Nigeria, passing
through the towns of Mafa, Logomani, Sou and heads for N'djamena by the north.
Figure 60. Railway layout of Maiduguri – N’djaména section (270 km)
12.3.5 Section 5 : N’djaména – Nyala (1150 km according to a first alternative and 1288 km according to a second variant)
565. Alternative 1 is parallel to the road leading to Abeche, passing through Ngoura and Ati. The total linear of
N'djamena ‐ Nyala section (in Sudan) passing through the town of Ati is of 1150 km.
566. Alternative 2 takes the same route as the first alternative to Ngoura, a crossroads located at about 300 km from the Chadian capital. Then it veers south, parallel to the Transafrican 6, to cross successively the villages and towns of Abtouyour, Arboutchatak, Bitkine, Mongo and Mangalmé, agglomerations located all in the south of Ati. Its total length is of 1288 km.
567. The first alternative has the advantage of being short, of about 12 %. On the other hand, it goes over much less
urban towns than the second alternative.
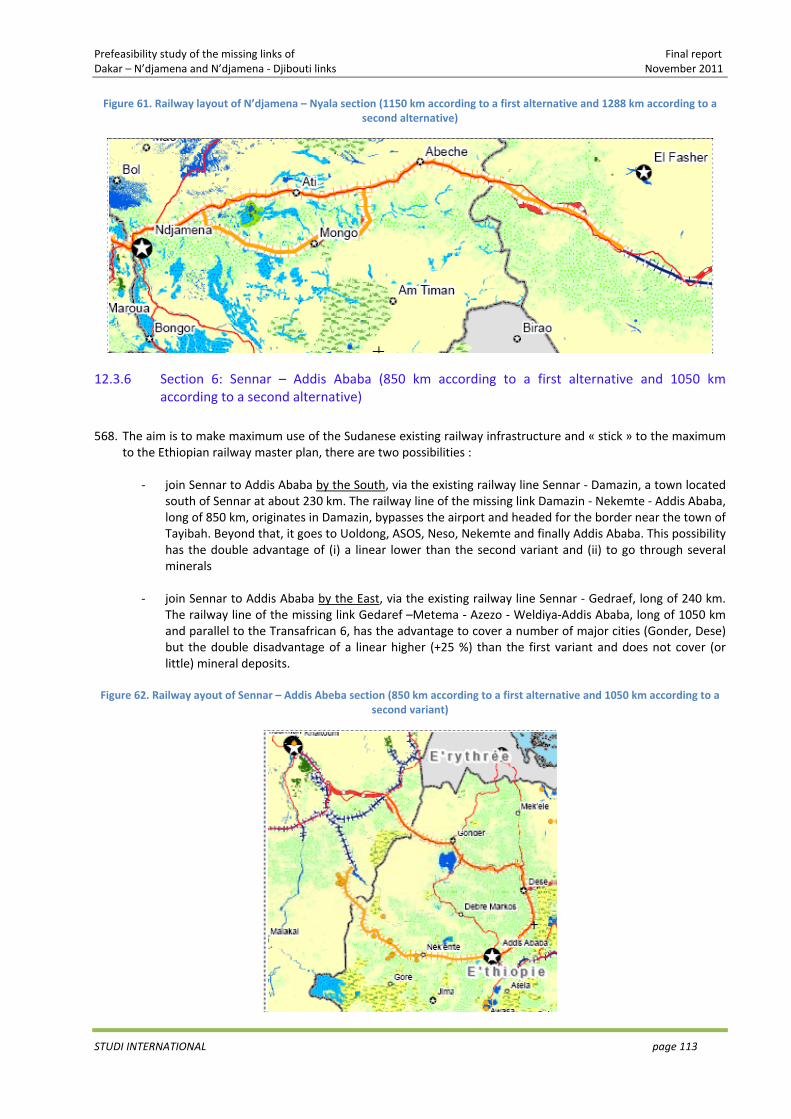
Prefeasibility study of the missing links of Final report Dakar – N’djamena and N’djamena ‐ Djibouti links November 2011
STUDI INTERNATIONAL page 113
Figure 61. Railway layout of N’djamena – Nyala section (1150 km according to a first alternative and 1288 km according to a second alternative)
12.3.6 Section 6: Sennar – Addis Ababa (850 km according to a first alternative and 1050 km according to a second alternative)
568. The aim is to make maximum use of the Sudanese existing railway infrastructure and « stick » to the maximum
to the Ethiopian railway master plan, there are two possibilities :
‐ join Sennar to Addis Ababa by the South, via the existing railway line Sennar ‐ Damazin, a town located south of Sennar at about 230 km. The railway line of the missing link Damazin ‐ Nekemte ‐ Addis Ababa, long of 850 km, originates in Damazin, bypasses the airport and headed for the border near the town of Tayibah. Beyond that, it goes to Uoldong, ASOS, Neso, Nekemte and finally Addis Ababa. This possibility has the double advantage of (i) a linear lower than the second variant and (ii) to go through several minerals
‐ join Sennar to Addis Ababa by the East, via the existing railway line Sennar ‐ Gedraef, long of 240 km. The railway line of the missing link Gedaref –Metema ‐ Azezo ‐ Weldiya‐Addis Ababa, long of 1050 km and parallel to the Transafrican 6, has the advantage to cover a number of major cities (Gonder, Dese) but the double disadvantage of a linear higher (+25 %) than the first variant and does not cover (or little) mineral deposits.
Figure 62. Railway ayout of Sennar – Addis Abeba section (850 km according to a first alternative and 1050 km according to a
second variant)
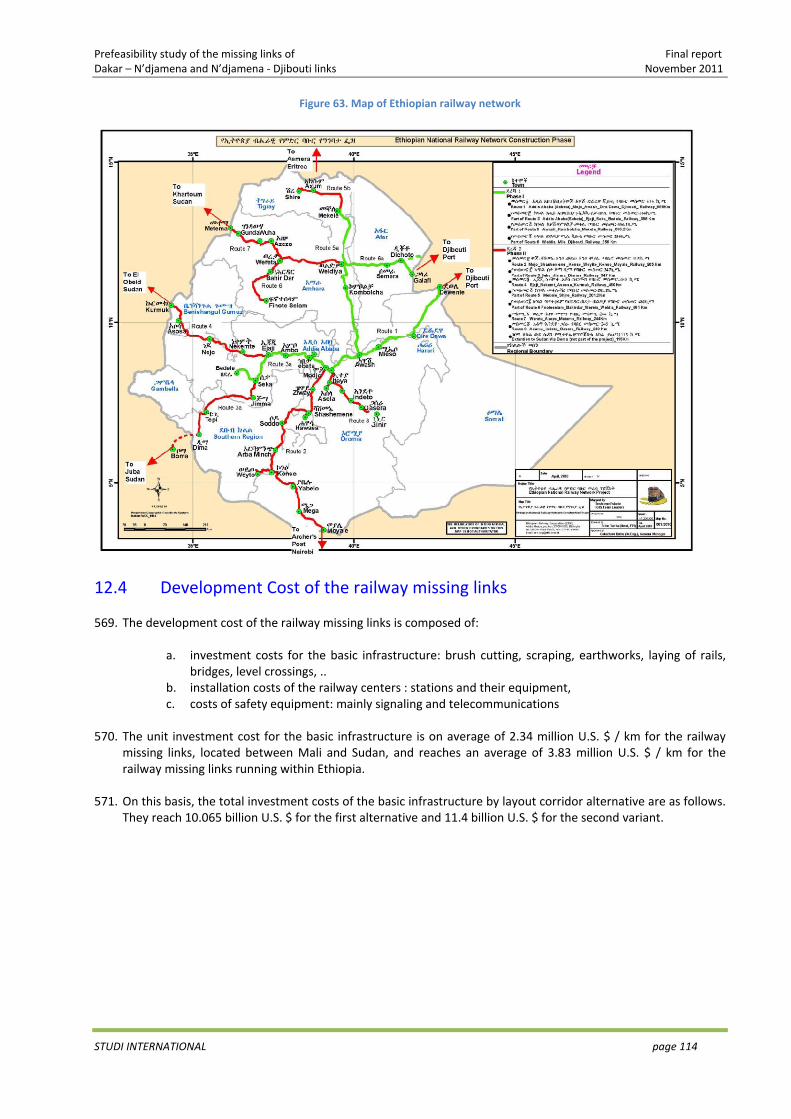
Prefeasibility study of the missing links of Final report Dakar – N’djamena and N’djamena ‐ Djibouti links November 2011
STUDI INTERNATIONAL page 114
Figure 63. Map of Ethiopian railway network
12.4 Development Cost of the railway missing links
569. The development cost of the railway missing links is composed of:
a. investment costs for the basic infrastructure: brush cutting, scraping, earthworks, laying of rails, bridges, level crossings, ..
b. installation costs of the railway centers : stations and their equipment, c. costs of safety equipment: mainly signaling and telecommunications
570. The unit investment cost for the basic infrastructure is on average of 2.34 million U.S. $ / km for the railway
missing links, located between Mali and Sudan, and reaches an average of 3.83 million U.S. $ / km for the railway missing links running within Ethiopia.
571. On this basis, the total investment costs of the basic infrastructure by layout corridor alternative are as follows. They reach 10.065 billion U.S. $ for the first alternative and 11.4 billion U.S. $ for the second variant.
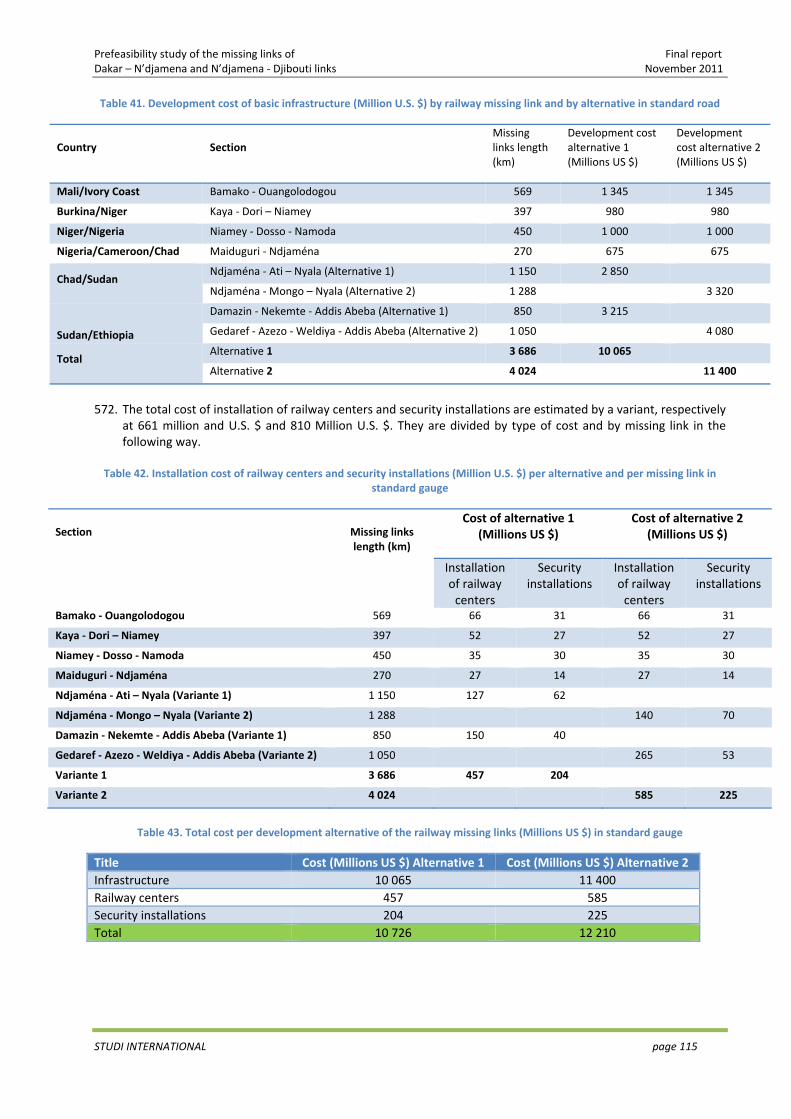
Prefeasibility study of the missing links of Final report Dakar – N’djamena and N’djamena ‐ Djibouti links November 2011
STUDI INTERNATIONAL page 115
Table 41. Development cost of basic infrastructure (Million U.S. $) by railway missing link and by alternative in standard road
Country
Section
Missing links length (km)
Development cost alternative 1 (Millions US $)
Development cost alternative 2 (Millions US $)
Mali/Ivory Coast Bamako ‐ Ouangolodogou 569 1 345 1 345
Burkina/Niger Kaya ‐ Dori – Niamey 397 980 980
Niger/Nigeria Niamey ‐ Dosso ‐ Namoda 450 1 000 1 000
Nigeria/Cameroon/Chad Maiduguri ‐ Ndjaména 270 675 675
Chad/Sudan Ndjaména ‐ Ati – Nyala (Alternative 1) 1 150 2 850
Ndjaména ‐ Mongo – Nyala (Alternative 2) 1 288 3 320
Sudan/Ethiopia
Damazin ‐ Nekemte ‐ Addis Abeba (Alternative 1) 850 3 215
Gedaref ‐ Azezo ‐ Weldiya ‐ Addis Abeba (Alternative 2) 1 050 4 080
Total Alternative 1 3 686 10 065
Alternative 2 4 024 11 400
572. The total cost of installation of railway centers and security installations are estimated by a variant, respectively
at 661 million and U.S. $ and 810 Million U.S. $. They are divided by type of cost and by missing link in the following way.
Table 42. Installation cost of railway centers and security installations (Million U.S. $) per alternative and per missing link in standard gauge
Section
Missing links length (km)
Cost of alternative 1 (Millions US $)
Cost of alternative 2(Millions US $)
Installation of railway centers
Security installations
Installation of railway centers
Security installations
Bamako ‐ Ouangolodogou 569 66 31 66 31
Kaya ‐ Dori – Niamey 397 52 27 52 27
Niamey ‐ Dosso ‐ Namoda 450 35 30 35 30
Maiduguri ‐ Ndjaména 270 27 14 27 14
Ndjaména ‐ Ati – Nyala (Variante 1) 1 150 127 62
Ndjaména ‐ Mongo – Nyala (Variante 2) 1 288 140 70
Damazin ‐ Nekemte ‐ Addis Abeba (Variante 1) 850 150 40
Gedaref ‐ Azezo ‐ Weldiya ‐ Addis Abeba (Variante 2) 1 050 265 53
Variante 1 3 686 457 204
Variante 2 4 024 585 225
Table 43. Total cost per development alternative of the railway missing links (Millions US $) in standard gauge
Title Cost (Millions US $) Alternative 1 Cost (Millions US $) Alternative 2Infrastructure 10 065 11 400 Railway centers 457 585 Security installations 204 225 Total 10 726 12 210
Prefeasibility study of the missing links of Final report Dakar – N’djamena and N’djamena ‐ Djibouti links November 2011
STUDI INTERNATIONAL page 116
12.5 Development cost of the existing network of standard gauge corridor
573. Adopt a standard gauge for the entire corridor would require a full resumption of the existing tracks of the corridor, as it would primarily look for a new layout. The reasons were discussed in the previous sections and are mainly technical. Indeed, the base of the standard gauge is wider in current section compared to the meter or narrow gauge and the values of the minimum radii are larger than their similar for both types of track. Moreover, the current structures are not susceptible to standard gauge (clearance and axle loads).
574. The total development cost in standard gauge of the Trans‐Sahelian existing railway network amounts to US
14025 millions $, as shown in the table below.
Table 44. The total development cost in standard gauge of the Trans‐Sahelian existing railway network
Section Length (km) Total development cost in standard gauge (Millions US$)
Dakar ‐ Bamako 1228 3100
Ouangolodogou ‐ Ouagadougou 543 1320
Ouagadougou ‐ Kaya 105 270
Kaura Namoda ‐ Zaria 219 560
Zaria ‐ Kaduna ‐ Jos ‐ Bauchi ‐ Maiduguri 1000 2500
Nyala ‐ Sennar 1000 2700
Sennar ‐ Damazin 230 625
Addis Abeba ‐ Djibouti 781 2950
Total 5139 14025
12.6 Transshipment centers
575. As mentioned above, we resort to transshipment centers, there are five (5) : one (1) in Ivory Coast, two (2) in Nigeria (Zaria and Kaduna) and two (2 ) in Sudan : Batasuna and Sennar for Alternative 174, Batasuna and Gedaref for Alternative 275.
576. Parallel and bordering tracks are to be planned at each transshipment center in a cemented area. These tracks are four (4) (two (2) by spacing) embedded in concrete, for the running of the handling equipment, of a minimum necessary length of 500 m for each track, a gantry crane of 45 tons and handling equipment on pneumatic wheels.
577. The cost of a transshipment center is estimated to 5 million U.S. $, for a total cost of 25 million U.S.
12.7 Railway connection with Doraleh port in Djibouti
578. This railway connection, long of 7.5 km, originates in the existing track, goes through the national 1 and goes along the national 3 in the north of Balbala to access the port area, heading for the storage area where a yard will be made in order to evacuate or take delivery of containers.
579. The investment cost of the basic infrastructure is estimated at 23 million U.S. $. The cost of the area,
equipment and buildings development amounted to 1.5 million U.S. $ and the cost of safety facilities to 500,000 U.S. $.
74 Alternative 1 : Dakar – N’djaména – Ati – Nyala – Sennar – Damazin – Addis Abeba ‐ Djibouti 75 Alternative 2 : Dakar – N’djaména – Mongo – Nyala – Sennar – Gedaref – Addis Abeba ‐ Djibouti
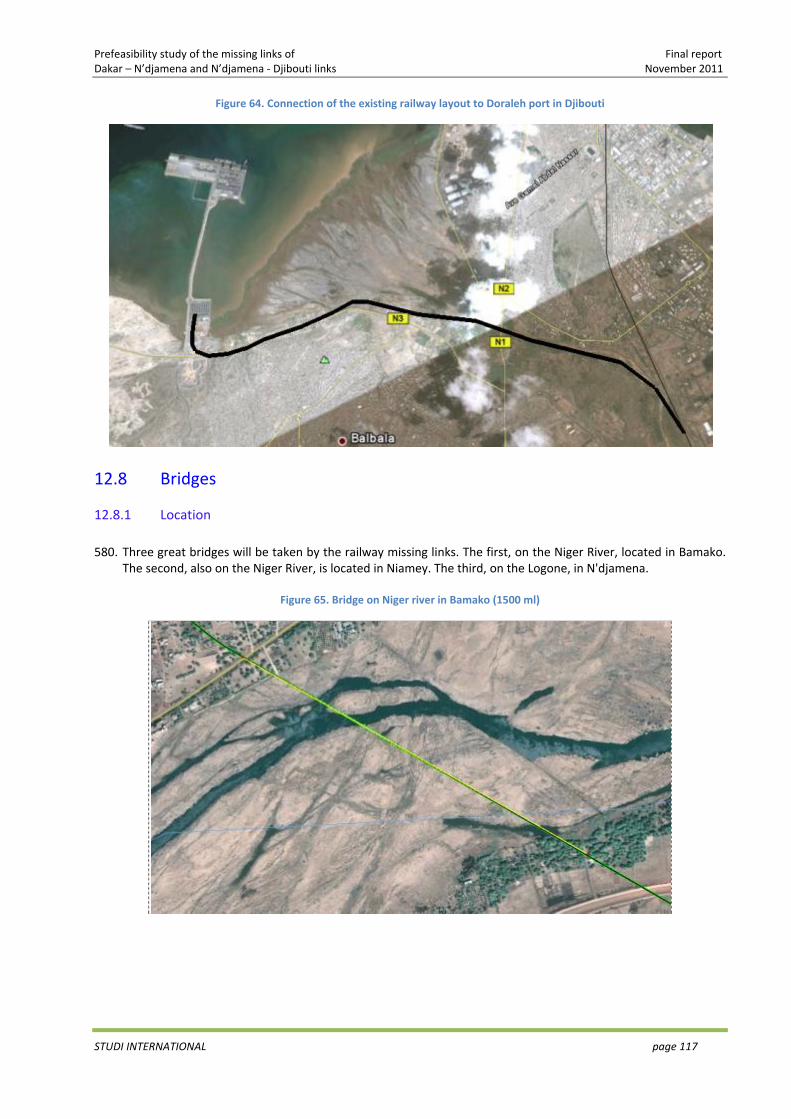
Prefeasibility study of the missing links of Final report Dakar – N’djamena and N’djamena ‐ Djibouti links November 2011
STUDI INTERNATIONAL page 117
Figure 64. Connection of the existing railway layout to Doraleh port in Djibouti
12.8 Bridges
12.8.1 Location 580. Three great bridges will be taken by the railway missing links. The first, on the Niger River, located in Bamako.
The second, also on the Niger River, is located in Niamey. The third, on the Logone, in N'djamena.
Figure 65. Bridge on Niger river in Bamako (1500 ml)
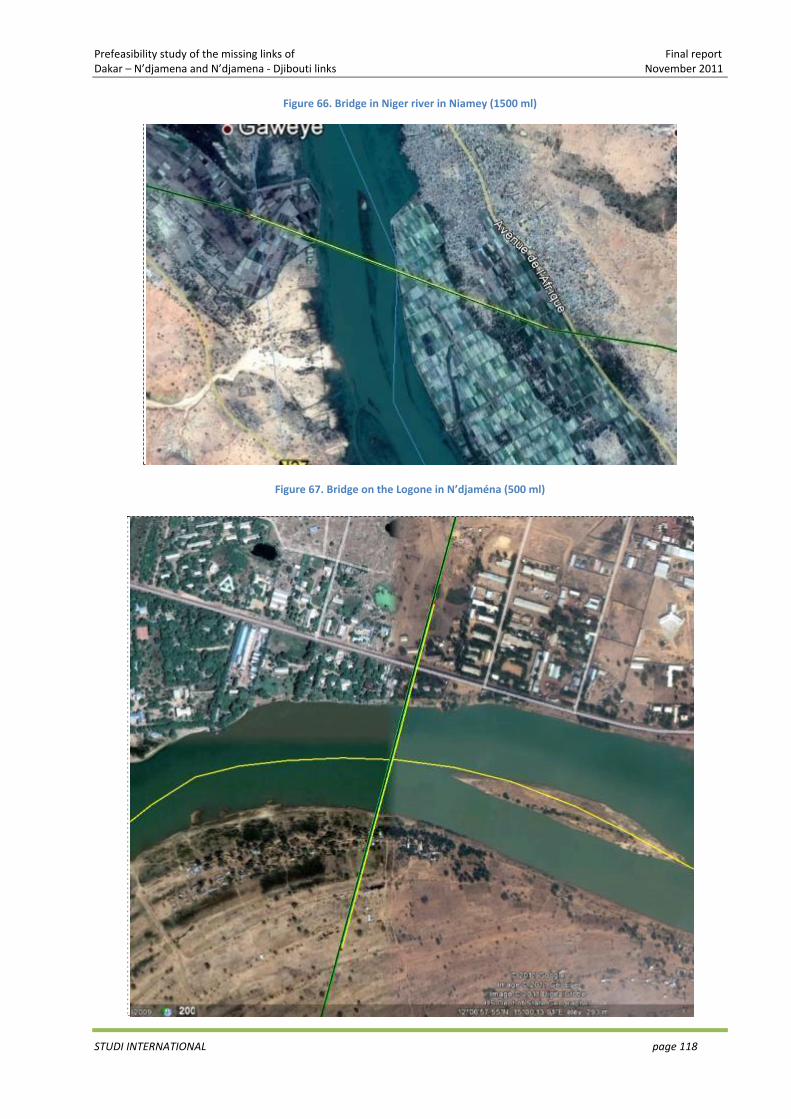
Prefeasibility study of the missing links of Final report Dakar – N’djamena and N’djamena ‐ Djibouti links November 2011
STUDI INTERNATIONAL page 118
Figure 66. Bridge in Niger river in Niamey (1500 ml)
Figure 67. Bridge on the Logone in N’djaména (500 ml)
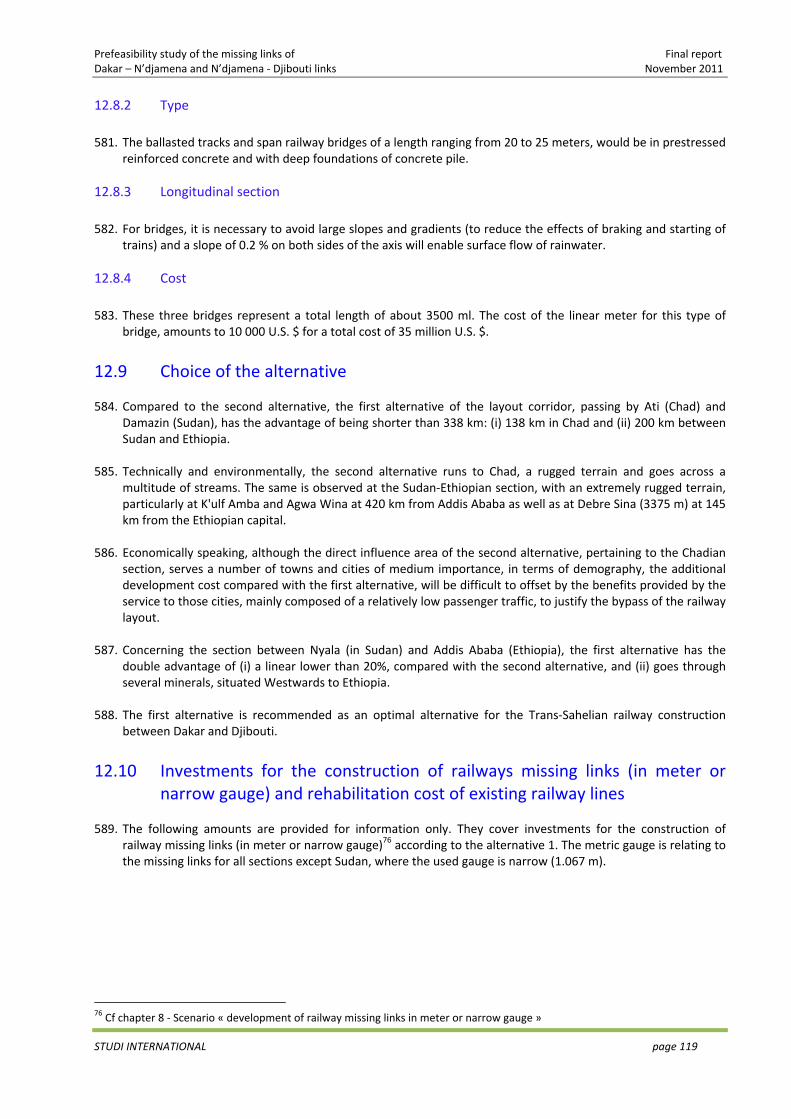
Prefeasibility study of the missing links of Final report Dakar – N’djamena and N’djamena ‐ Djibouti links November 2011
STUDI INTERNATIONAL page 119
12.8.2 Type 581. The ballasted tracks and span railway bridges of a length ranging from 20 to 25 meters, would be in prestressed
reinforced concrete and with deep foundations of concrete pile.
12.8.3 Longitudinal section 582. For bridges, it is necessary to avoid large slopes and gradients (to reduce the effects of braking and starting of
trains) and a slope of 0.2 % on both sides of the axis will enable surface flow of rainwater.
12.8.4 Cost 583. These three bridges represent a total length of about 3500 ml. The cost of the linear meter for this type of
bridge, amounts to 10 000 U.S. $ for a total cost of 35 million U.S. $.
12.9 Choice of the alternative
584. Compared to the second alternative, the first alternative of the layout corridor, passing by Ati (Chad) and Damazin (Sudan), has the advantage of being shorter than 338 km: (i) 138 km in Chad and (ii) 200 km between Sudan and Ethiopia.
585. Technically and environmentally, the second alternative runs to Chad, a rugged terrain and goes across a
multitude of streams. The same is observed at the Sudan‐Ethiopian section, with an extremely rugged terrain, particularly at K'ulf Amba and Agwa Wina at 420 km from Addis Ababa as well as at Debre Sina (3375 m) at 145 km from the Ethiopian capital.
586. Economically speaking, although the direct influence area of the second alternative, pertaining to the Chadian
section, serves a number of towns and cities of medium importance, in terms of demography, the additional development cost compared with the first alternative, will be difficult to offset by the benefits provided by the service to those cities, mainly composed of a relatively low passenger traffic, to justify the bypass of the railway layout.
587. Concerning the section between Nyala (in Sudan) and Addis Ababa (Ethiopia), the first alternative has the
double advantage of (i) a linear lower than 20%, compared with the second alternative, and (ii) goes through several minerals, situated Westwards to Ethiopia.
588. The first alternative is recommended as an optimal alternative for the Trans‐Sahelian railway construction
between Dakar and Djibouti.
12.10 Investments for the construction of railways missing links (in meter or narrow gauge) and rehabilitation cost of existing railway lines
589. The following amounts are provided for information only. They cover investments for the construction of railway missing links (in meter or narrow gauge)76 according to the alternative 1. The metric gauge is relating to the missing links for all sections except Sudan, where the used gauge is narrow (1.067 m).
76 Cf chapter 8 ‐ Scenario « development of railway missing links in meter or narrow gauge »
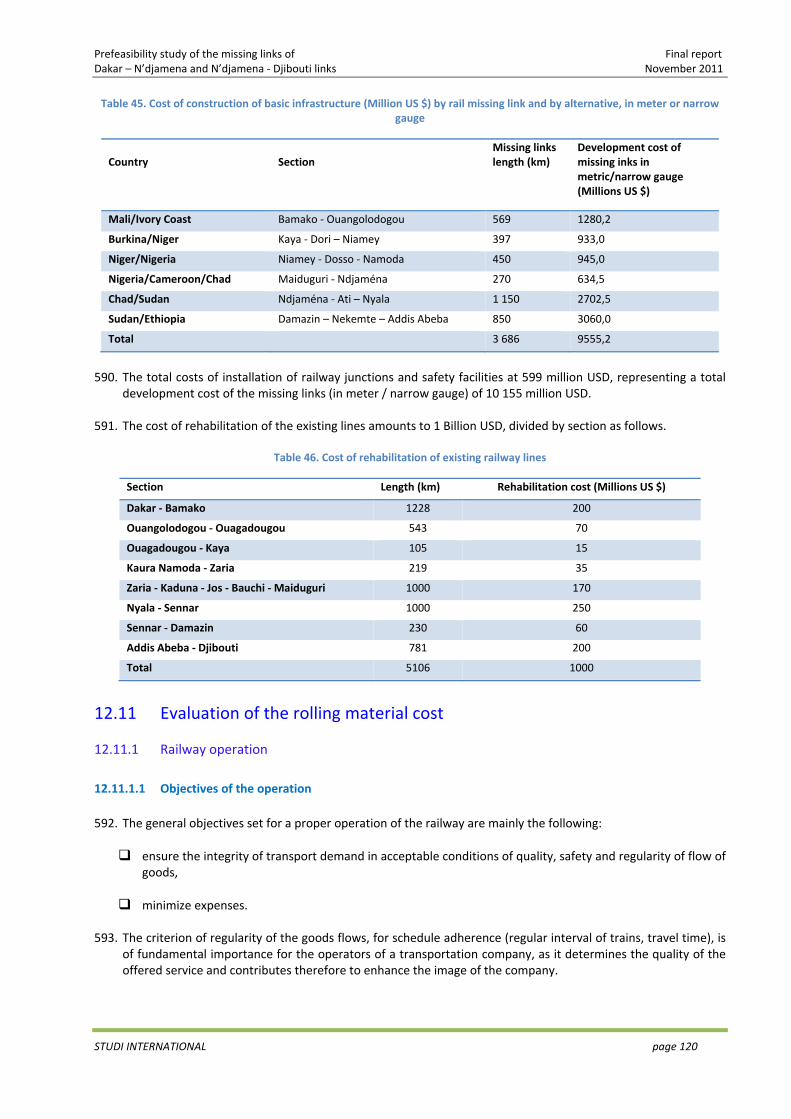
Prefeasibility study of the missing links of Final report Dakar – N’djamena and N’djamena ‐ Djibouti links November 2011
STUDI INTERNATIONAL page 120
Table 45. Cost of construction of basic infrastructure (Million US $) by rail missing link and by alternative, in meter or narrow gauge
Country
Section
Missing links length (km)
Development cost of missing inks in metric/narrow gauge (Millions US $)
Mali/Ivory Coast Bamako ‐ Ouangolodogou 569 1280,2
Burkina/Niger Kaya ‐ Dori – Niamey 397 933,0
Niger/Nigeria Niamey ‐ Dosso ‐ Namoda 450 945,0
Nigeria/Cameroon/Chad Maiduguri ‐ Ndjaména 270 634,5
Chad/Sudan Ndjaména ‐ Ati – Nyala 1 150 2702,5
Sudan/Ethiopia Damazin – Nekemte – Addis Abeba 850 3060,0
Total 3 686 9555,2
590. The total costs of installation of railway junctions and safety facilities at 599 million USD, representing a total
development cost of the missing links (in meter / narrow gauge) of 10 155 million USD. 591. The cost of rehabilitation of the existing lines amounts to 1 Billion USD, divided by section as follows.
Table 46. Cost of rehabilitation of existing railway lines
Section Length (km) Rehabilitation cost (Millions US $)
Dakar ‐ Bamako 1228 200
Ouangolodogou ‐ Ouagadougou 543 70
Ouagadougou ‐ Kaya 105 15
Kaura Namoda ‐ Zaria 219 35
Zaria ‐ Kaduna ‐ Jos ‐ Bauchi ‐ Maiduguri 1000 170
Nyala ‐ Sennar 1000 250
Sennar ‐ Damazin 230 60
Addis Abeba ‐ Djibouti 781 200
Total 5106 1000
12.11 Evaluation of the rolling material cost
12.11.1 Railway operation
12.11.1.1 Objectives of the operation 592. The general objectives set for a proper operation of the railway are mainly the following:
ensure the integrity of transport demand in acceptable conditions of quality, safety and regularity of flow of goods,
minimize expenses.
593. The criterion of regularity of the goods flows, for schedule adherence (regular interval of trains, travel time), is
of fundamental importance for the operators of a transportation company, as it determines the quality of the offered service and contributes therefore to enhance the image of the company.
Prefeasibility study of the missing links of Final report Dakar – N’djamena and N’djamena ‐ Djibouti links November 2011
STUDI INTERNATIONAL page 121
594. The means to implement to maintain this regularity are multiple and relate particularly to :
the availability of equipment such as rolling stock and fixed equipment, the rational organization of maintenance, the permanent measures relating to the necessary reserves of these equipment and opportunities to operate with modes called "degraded"
Staff management, resulting from a good organization with a just enough reserve steering wheel and good training, so that the staff can be able to respond quickly and effectively to operational elements at the lower incident.
12.11.1.2 Operation mode 595. The operation will be based on races between origins and destinations, adapted to the goods traffic demand.
New interconnections are analyzed in this framework as autonomous segments. 12.11.1.3 Operation plan 596. The purpose of the business plan is to establish an order of the importance of rolling stock needs (wagons and
motor), necessary for goods transport valued by the future demand.
597. It is unrealistic to assume a continuous operation, i.e. 365 days a year, due to a number of factors related to the irregularities of operation (degraded mode) quoted above, which are involved in the daily railway operation.
598. It is proposed within this framework an operational business plan, on the annual basis of 300 days, consistent
with the experience and practices of an efficient railway operation.
599. Commercial speed would be in the range of 45 km/h‐55 km/h, to ensure a regular operation. It takes into account a number of operating hazards, namely:
programmed slowing for track maintenance, crossings and overtakings of the trains, Interim orders of idling (OPMR) due to unexpected and short‐term changes, the track conditions and safety facilities.
600. It is the done thing for establishing an operating plan. For the number of days, it is nearly 85%. For the
operating speed which is not the maximum speed, it takes into account the hazards mentioned above, consistent with the experience and practices of railway operation. It ensures a consistency of operation and not migrate to a degraded operation, source of poor management and increased operating costs.
12.11.2 Evaluation of the carriage stock and costs of the rolling stock
12.11.2.1 Trailer stock
601. In order to ensure the service of the future railway line Dakar – Djibouti, we recommend the wagons with the three following main features:
Bogie vehicles, Axle load77 of 25 tons, coupler type UIC de 100 power tons78 (Tf).
77 For the calculation of the exploitation plan, the retained axle load is 16 tons 78 80 power tons could be enough but these would be insufficient in case of incorporation of the wagon into a multiple‐unit trailed train
Prefeasibility study of the missing links of Final report Dakar – N’djamena and N’djamena ‐ Djibouti links November 2011
STUDI INTERNATIONAL page 122
602. This carriage stock is adapted to the different goods to be transported. It can be decomposed in the following way :
tilting carts for bulk goods transport, covered wagons for the transport of goods with pallet handling and live animals, flat wagons for the transport of goods such as steel, containers and vehicles, Cistern‐wagons for the transport of liquid products (hydrocarbons, chloride, liquefied gas).
603. A good part of the transported goods shall be carried out using containers. For the calculation of the fleet, we
shall adopt the following parameter scenarios:
flat wagon loaded with two containers of 6 m (20 feet) each, The load at the wagon axle is 16 tons. The gross load would be 64 tons, the loading capacity of a wagon would be 49 tons79 and the tare weight of the wagon is 15 tons, The maximum load of a container is 22 tons and its tare weight 2.5 tons.
604. Hence, the neat load considered of a wagon is 44 tons (2 containers of 22 tons) and the tare weight is 20 tons
(15 tons for the tare weight of the wagon and 5 tons for the tare weight of the two containers).
605. The number of wagons required to ensure the future demand is assessed based on the tonnages and the cycle durations. A certain number of factors must be considered in the calculation of the cycle durations of the rolling stock, namely :
The duration of the station stop, composed of the periods of temps de (i) loading, (ii) train formation, (iii) making the train available train for expedition and (iv) car visit and departure formalities,
stop time in intermediate station: (i) operation time (empty wagons /loaded from/to the transshipping tracks) and (ii) departure formalities time,
station stop time at the arrival, made of the time of (i) train availability for delivery =of empty wagons/loaded on the transshipment tracks, (ii) loading/unloading (in average, 48 h), (iii) train revision (and replacement if necessary of defective wagons), (iv) train formation et (v) visit of the car and departure formalities.
12.11.2.2 Motor stock 606. For the retained traffic, we recommend as well the locomotives type CC with a nominal power of 2400 Cv. 12.11.2.3 Unit costs of the rolling stock 607. The unit costs of the rolling stock are the following (prices of the year 2011) :
trailed stock: 175,000 US $ motor stock : 3,500,000 US $
12.11.2.4 Evaluation of the carriage rolling stock and acquisition costs 608. The necessary traffic and the requirements of the tour duration determine for each line, the necessary carriage
stock of rolling stock, determined by the number of wagons, the neat load of a train and the total cycle of a train. We note that the cycle of the trailed stock and motor stock are not the same. In fact, the motor stock, like the trailed stock, is not subject to the loading/unloading times.
79 Maximum admissible load a wagon can transport
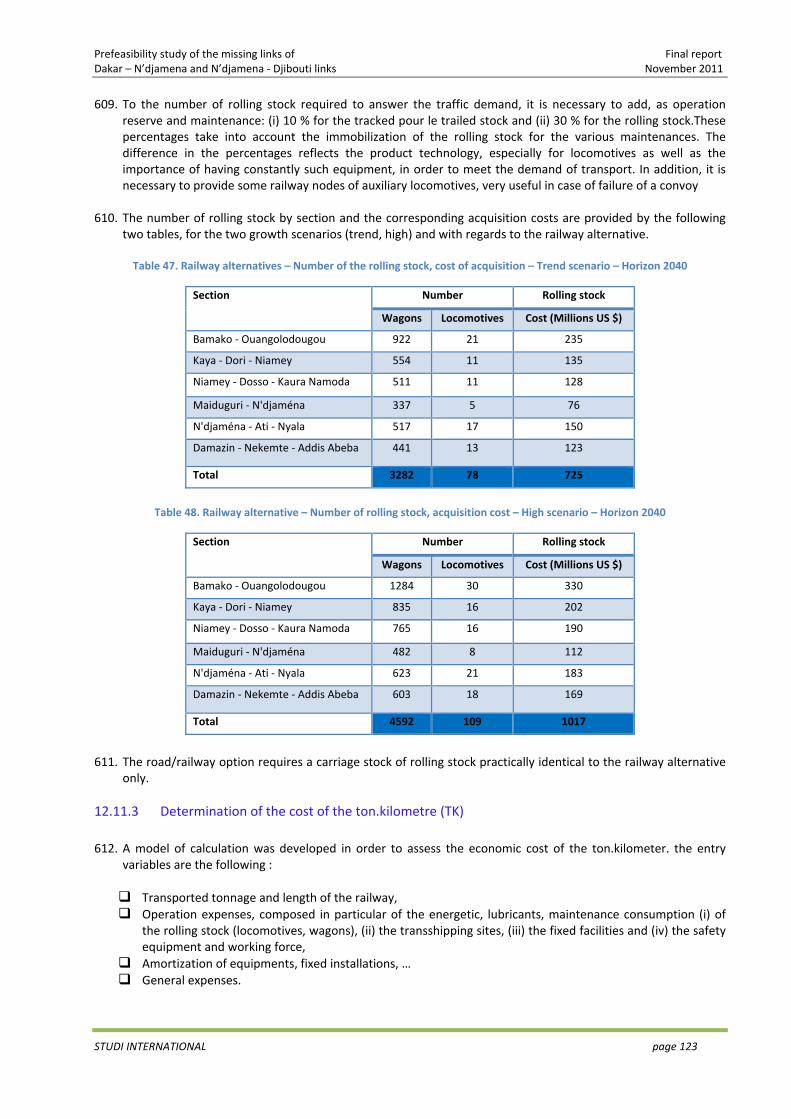
Prefeasibility study of the missing links of Final report Dakar – N’djamena and N’djamena ‐ Djibouti links November 2011
STUDI INTERNATIONAL page 123
609. To the number of rolling stock required to answer the traffic demand, it is necessary to add, as operation reserve and maintenance: (i) 10 % for the tracked pour le trailed stock and (ii) 30 % for the rolling stock.These percentages take into account the immobilization of the rolling stock for the various maintenances. The difference in the percentages reflects the product technology, especially for locomotives as well as the importance of having constantly such equipment, in order to meet the demand of transport. In addition, it is necessary to provide some railway nodes of auxiliary locomotives, very useful in case of failure of a convoy
610. The number of rolling stock by section and the corresponding acquisition costs are provided by the following
two tables, for the two growth scenarios (trend, high) and with regards to the railway alternative.
Table 47. Railway alternatives – Number of the rolling stock, cost of acquisition – Trend scenario – Horizon 2040
Section Number Rolling stock
Wagons Locomotives Cost (Millions US $)
Bamako ‐ Ouangolodougou 922 21 235
Kaya ‐ Dori ‐ Niamey 554 11 135
Niamey ‐ Dosso ‐ Kaura Namoda 511 11 128
Maiduguri ‐ N'djaména 337 5 76
N'djaména ‐ Ati ‐ Nyala 517 17 150
Damazin ‐ Nekemte ‐ Addis Abeba 441 13 123
Total 3282 78 725
Table 48. Railway alternative – Number of rolling stock, acquisition cost – High scenario – Horizon 2040
Section Number Rolling stock
Wagons Locomotives Cost (Millions US $)
Bamako ‐ Ouangolodougou 1284 30 330
Kaya ‐ Dori ‐ Niamey 835 16 202
Niamey ‐ Dosso ‐ Kaura Namoda 765 16 190
Maiduguri ‐ N'djaména 482 8 112
N'djaména ‐ Ati ‐ Nyala 623 21 183
Damazin ‐ Nekemte ‐ Addis Abeba 603 18 169
Total 4592 109 1017
611. The road/railway option requires a carriage stock of rolling stock practically identical to the railway alternative
only.
12.11.3 Determination of the cost of the ton.kilometre (TK) 612. A model of calculation was developed in order to assess the economic cost of the ton.kilometer. the entry
variables are the following :
Transported tonnage and length of the railway, Operation expenses, composed in particular of the energetic, lubricants, maintenance consumption (i) of the rolling stock (locomotives, wagons), (ii) the transshipping sites, (iii) the fixed facilities and (iv) the safety equipment and working force,
Amortization of equipments, fixed installations, … General expenses.
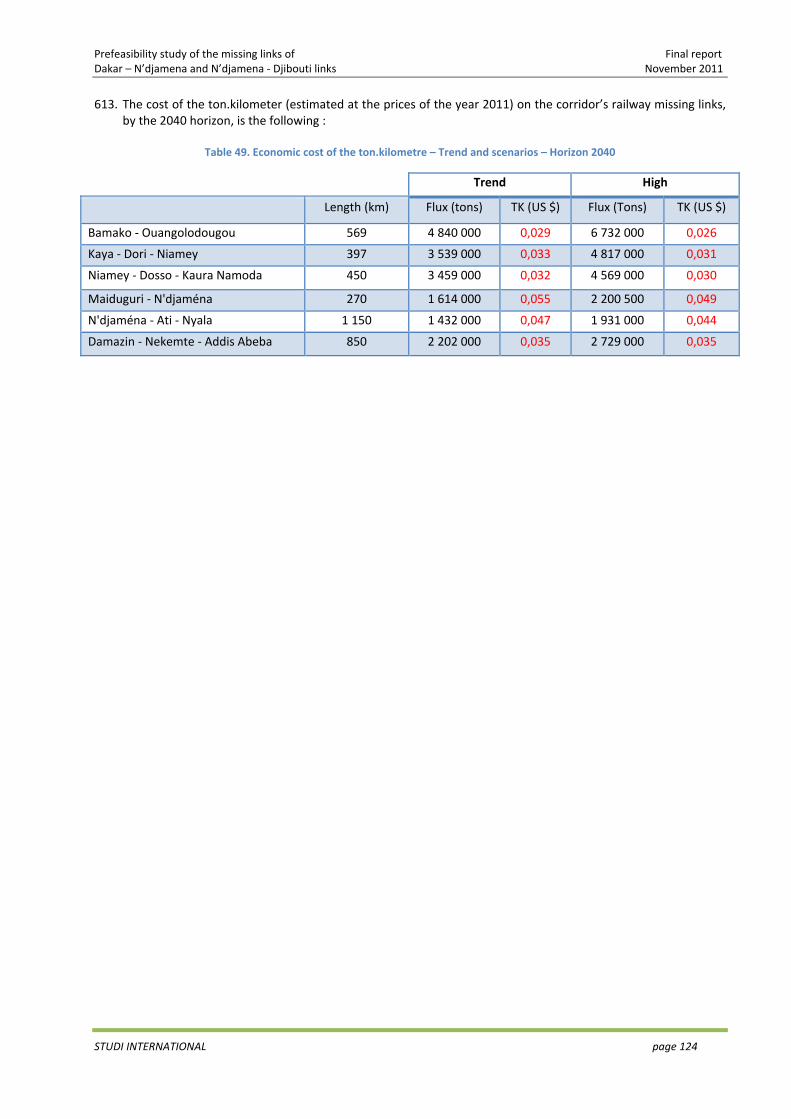
Prefeasibility study of the missing links of Final report Dakar – N’djamena and N’djamena ‐ Djibouti links November 2011
STUDI INTERNATIONAL page 124
613. The cost of the ton.kilometer (estimated at the prices of the year 2011) on the corridor’s railway missing links, by the 2040 horizon, is the following :
Table 49. Economic cost of the ton.kilometre – Trend and scenarios – Horizon 2040
Trend High
Length (km) Flux (tons) TK (US $) Flux (Tons) TK (US $)
Bamako ‐ Ouangolodougou 569 4 840 000 0,029 6 732 000 0,026
Kaya ‐ Dori ‐ Niamey 397 3 539 000 0,033 4 817 000 0,031
Niamey ‐ Dosso ‐ Kaura Namoda 450 3 459 000 0,032 4 569 000 0,030
Maiduguri ‐ N'djaména 270 1 614 000 0,055 2 200 500 0,049
N'djaména ‐ Ati ‐ Nyala 1 150 1 432 000 0,047 1 931 000 0,044
Damazin ‐ Nekemte ‐ Addis Abeba 850 2 202 000 0,035 2 729 000 0,035
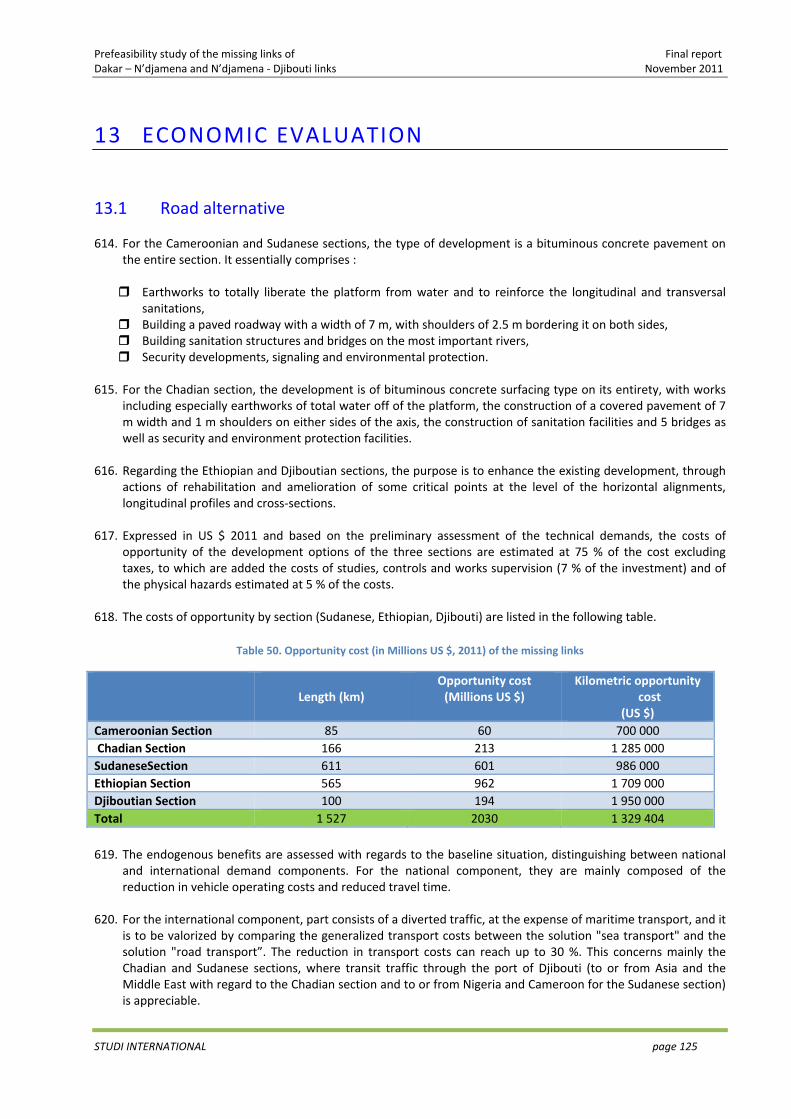
Prefeasibility study of the missing links of Final report Dakar – N’djamena and N’djamena ‐ Djibouti links November 2011
STUDI INTERNATIONAL page 125
13 ECONOMIC EVALUATION
13.1 Road alternative
614. For the Cameroonian and Sudanese sections, the type of development is a bituminous concrete pavement on the entire section. It essentially comprises :
Earthworks to totally liberate the platform from water and to reinforce the longitudinal and transversal sanitations,
Building a paved roadway with a width of 7 m, with shoulders of 2.5 m bordering it on both sides, Building sanitation structures and bridges on the most important rivers, Security developments, signaling and environmental protection.
615. For the Chadian section, the development is of bituminous concrete surfacing type on its entirety, with works
including especially earthworks of total water off of the platform, the construction of a covered pavement of 7 m width and 1 m shoulders on either sides of the axis, the construction of sanitation facilities and 5 bridges as well as security and environment protection facilities.
616. Regarding the Ethiopian and Djiboutian sections, the purpose is to enhance the existing development, through
actions of rehabilitation and amelioration of some critical points at the level of the horizontal alignments, longitudinal profiles and cross‐sections.
617. Expressed in US $ 2011 and based on the preliminary assessment of the technical demands, the costs of opportunity of the development options of the three sections are estimated at 75 % of the cost excluding taxes, to which are added the costs of studies, controls and works supervision (7 % of the investment) and of the physical hazards estimated at 5 % of the costs.
618. The costs of opportunity by section (Sudanese, Ethiopian, Djibouti) are listed in the following table.
Table 50. Opportunity cost (in Millions US $, 2011) of the missing links
Length (km) Opportunity cost (Millions US $)
Kilometric opportunity cost
(US $) Cameroonian Section 85 60 700 000 Chadian Section 166 213 1 285 000SudaneseSection 611 601 986 000Ethiopian Section 565 962 1 709 000Djiboutian Section 100 194 1 950 000Total 1 527 2030 1 329 404
619. The endogenous benefits are assessed with regards to the baseline situation, distinguishing between national
and international demand components. For the national component, they are mainly composed of the reduction in vehicle operating costs and reduced travel time.
620. For the international component, part consists of a diverted traffic, at the expense of maritime transport, and it
is to be valorized by comparing the generalized transport costs between the solution "sea transport" and the solution "road transport”. The reduction in transport costs can reach up to 30 %. This concerns mainly the Chadian and Sudanese sections, where transit traffic through the port of Djibouti (to or from Asia and the Middle East with regard to the Chadian section and to or from Nigeria and Cameroon for the Sudanese section) is appreciable.
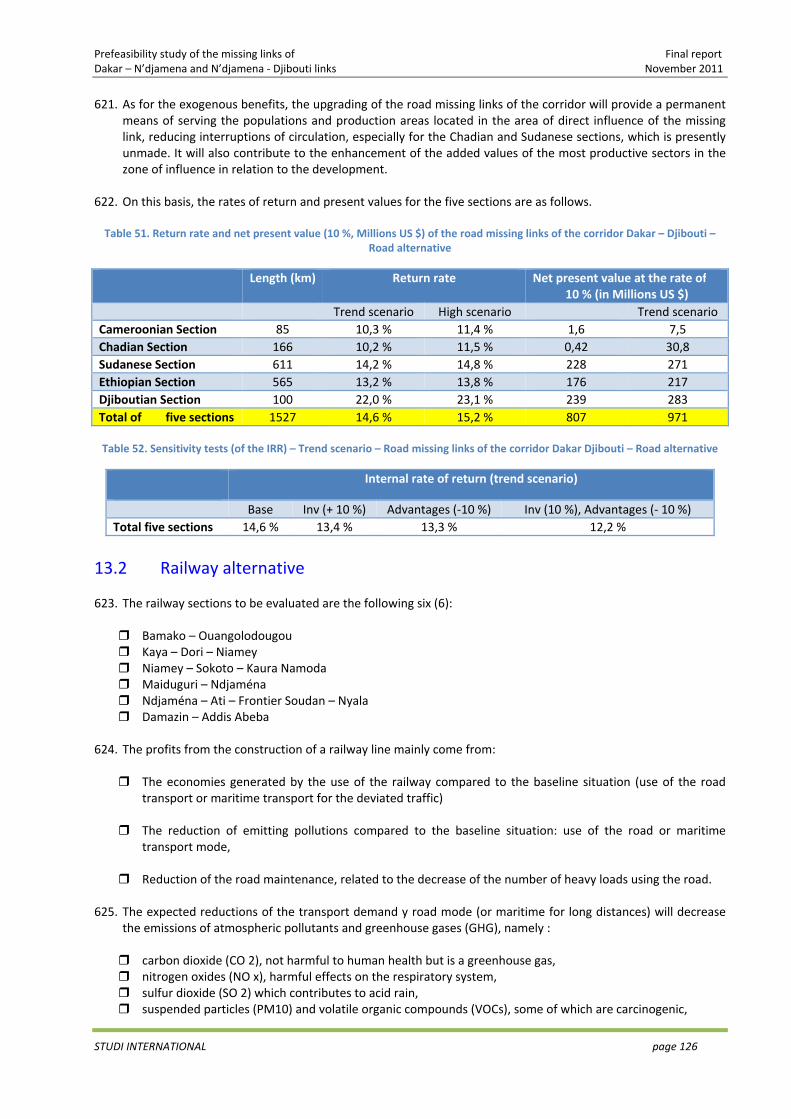
Prefeasibility study of the missing links of Final report Dakar – N’djamena and N’djamena ‐ Djibouti links November 2011
STUDI INTERNATIONAL page 126
621. As for the exogenous benefits, the upgrading of the road missing links of the corridor will provide a permanent means of serving the populations and production areas located in the area of direct influence of the missing link, reducing interruptions of circulation, especially for the Chadian and Sudanese sections, which is presently unmade. It will also contribute to the enhancement of the added values of the most productive sectors in the zone of influence in relation to the development.
622. On this basis, the rates of return and present values for the five sections are as follows. Table 51. Return rate and net present value (10 %, Millions US $) of the road missing links of the corridor Dakar – Djibouti –
Road alternative
Length (km) Return rate Net present value at the rate of10 % (in Millions US $)
Trend scenario High scenario Trend scenario Cameroonian Section 85 10,3 % 11,4 % 1,6 7,5Chadian Section 166 10,2 % 11,5 % 0,42 30,8Sudanese Section 611 14,2 % 14,8 % 228 271Ethiopian Section 565 13,2 % 13,8 % 176 217Djiboutian Section 100 22,0 % 23,1 % 239 283Total of five sections 1527 14,6 % 15,2 % 807 971
Table 52. Sensitivity tests (of the IRR) – Trend scenario – Road missing links of the corridor Dakar Djibouti – Road alternative
Internal rate of return (trend scenario)
Base Inv (+ 10 %) Advantages (‐10 %) Inv (10 %), Advantages (‐ 10 %)Total five sections 14,6 % 13,4 % 13,3 % 12,2 %
13.2 Railway alternative
623. The railway sections to be evaluated are the following six (6):
Bamako – Ouangolodougou Kaya – Dori – Niamey Niamey – Sokoto – Kaura Namoda Maiduguri – Ndjaména Ndjaména – Ati – Frontier Soudan – Nyala Damazin – Addis Abeba
624. The profits from the construction of a railway line mainly come from:
The economies generated by the use of the railway compared to the baseline situation (use of the road transport or maritime transport for the deviated traffic)
The reduction of emitting pollutions compared to the baseline situation: use of the road or maritime transport mode,
Reduction of the road maintenance, related to the decrease of the number of heavy loads using the road.
625. The expected reductions of the transport demand y road mode (or maritime for long distances) will decrease the emissions of atmospheric pollutants and greenhouse gases (GHG), namely :
carbon dioxide (CO 2), not harmful to human health but is a greenhouse gas, nitrogen oxides (NO x), harmful effects on the respiratory system, sulfur dioxide (SO 2) which contributes to acid rain, suspended particles (PM10) and volatile organic compounds (VOCs), some of which are carcinogenic,
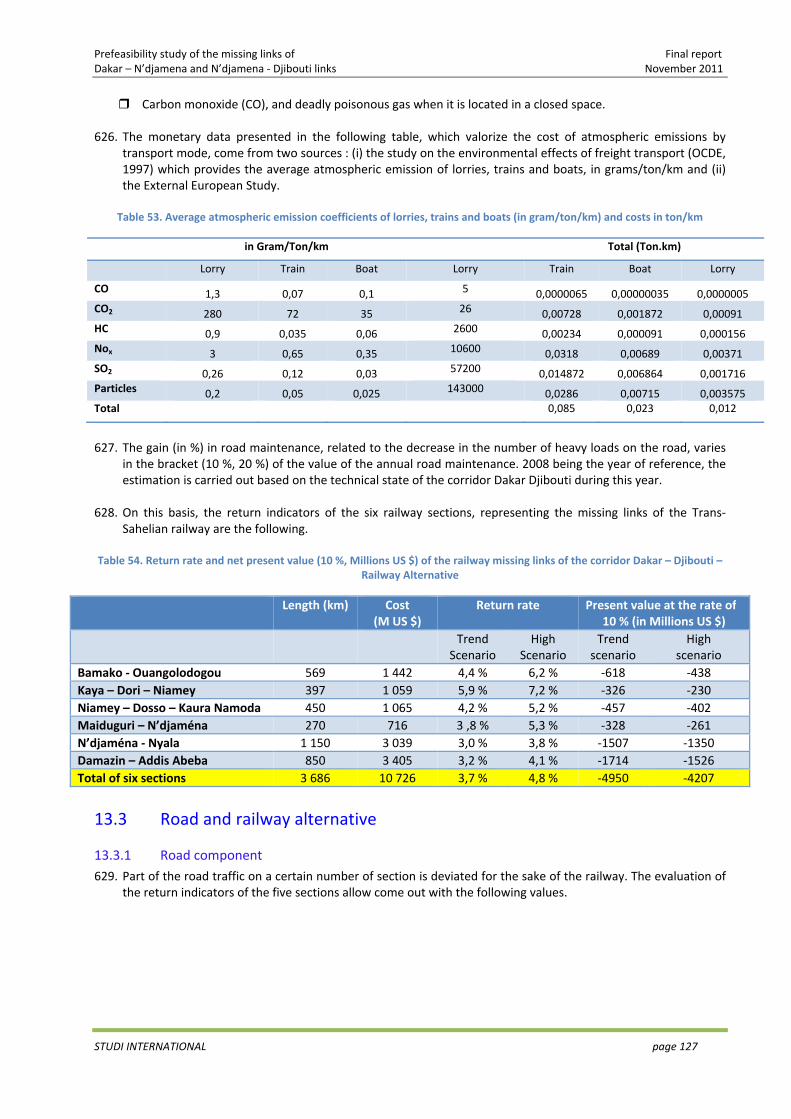
Prefeasibility study of the missing links of Final report Dakar – N’djamena and N’djamena ‐ Djibouti links November 2011
STUDI INTERNATIONAL page 127
Carbon monoxide (CO), and deadly poisonous gas when it is located in a closed space.
626. The monetary data presented in the following table, which valorize the cost of atmospheric emissions by transport mode, come from two sources : (i) the study on the environmental effects of freight transport (OCDE, 1997) which provides the average atmospheric emission of lorries, trains and boats, in grams/ton/km and (ii) the External European Study.
Table 53. Average atmospheric emission coefficients of lorries, trains and boats (in gram/ton/km) and costs in ton/km
in Gram/Ton/km Total (Ton.km)
Lorry Train Boat Lorry Train Boat Lorry
CO 1,3 0,07 0,1 5 0,0000065 0,00000035 0,0000005 CO2 280 72 35 26 0,00728 0,001872 0,00091 HC 0,9 0,035 0,06 2600 0,00234 0,000091 0,000156 Nox 3 0,65 0,35 10600 0,0318 0,00689 0,00371 SO2 0,26 0,12 0,03 57200 0,014872 0,006864 0,001716 Particles 0,2 0,05 0,025 143000 0,0286 0,00715 0,003575 Total 0,085 0,023 0,012
627. The gain (in %) in road maintenance, related to the decrease in the number of heavy loads on the road, varies
in the bracket (10 %, 20 %) of the value of the annual road maintenance. 2008 being the year of reference, the estimation is carried out based on the technical state of the corridor Dakar Djibouti during this year.
628. On this basis, the return indicators of the six railway sections, representing the missing links of the Trans‐
Sahelian railway are the following. Table 54. Return rate and net present value (10 %, Millions US $) of the railway missing links of the corridor Dakar – Djibouti –
Railway Alternative
Length (km) Cost
(M US $) Return rate Present value at the rate of
10 % (in Millions US $) Trend
Scenario High
Scenario Trend
scenario High
scenario Bamako ‐ Ouangolodogou 569 1 442 4,4 % 6,2 % ‐618 ‐438Kaya – Dori – Niamey 397 1 059 5,9 % 7,2 % ‐326 ‐230Niamey – Dosso – Kaura Namoda 450 1 065 4,2 % 5,2 % ‐457 ‐402Maiduguri – N’djaména 270 716 3 ,8 % 5,3 % ‐328 ‐261N’djaména ‐ Nyala 1 150 3 039 3,0 % 3,8 % ‐1507 ‐1350Damazin – Addis Abeba 850 3 405 3,2 % 4,1 % ‐1714 ‐1526Total of six sections 3 686 10 726 3,7 % 4,8 % ‐4950 ‐4207
13.3 Road and railway alternative
13.3.1 Road component 629. Part of the road traffic on a certain number of section is deviated for the sake of the railway. The evaluation of
the return indicators of the five sections allow come out with the following values.
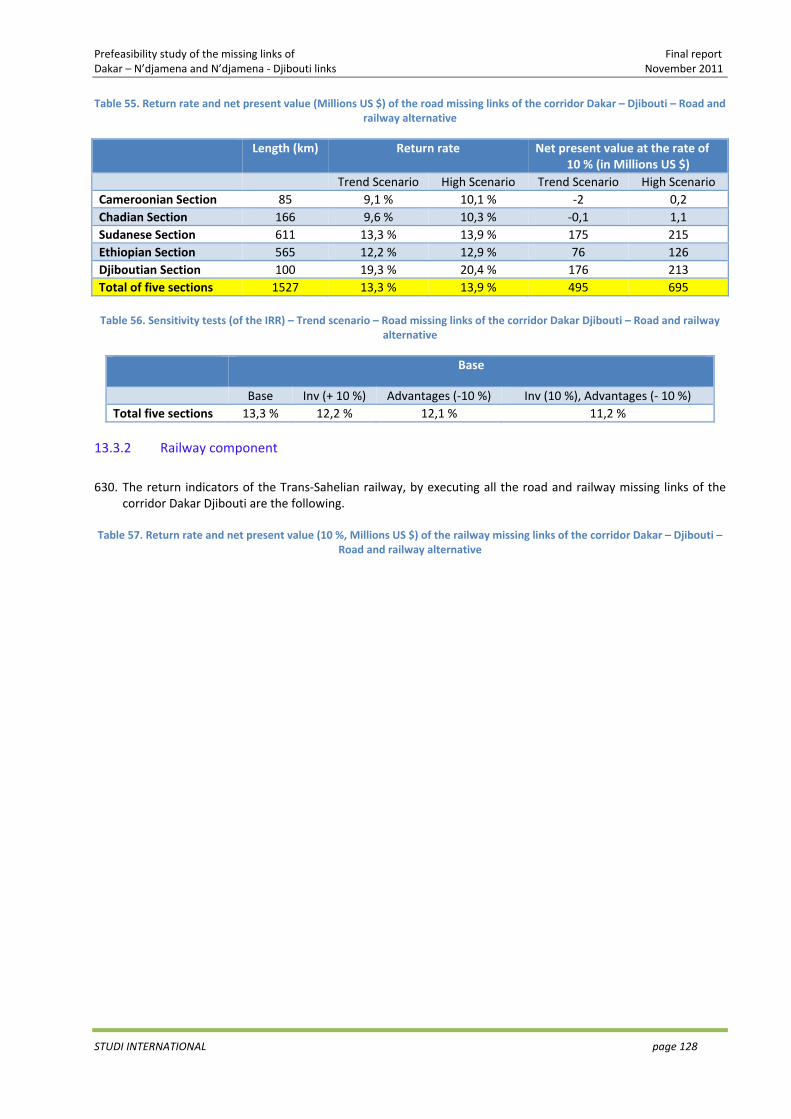
Prefeasibility study of the missing links of Final report Dakar – N’djamena and N’djamena ‐ Djibouti links November 2011
STUDI INTERNATIONAL page 128
Table 55. Return rate and net present value (Millions US $) of the road missing links of the corridor Dakar – Djibouti – Road and railway alternative
Length (km) Return rate Net present value at the rate of
10 % (in Millions US $) Trend Scenario High Scenario Trend Scenario High ScenarioCameroonian Section 85 9,1 % 10,1 % ‐2 0,2Chadian Section 166 9,6 % 10,3 % ‐0,1 1,1Sudanese Section 611 13,3 % 13,9 % 175 215Ethiopian Section 565 12,2 % 12,9 % 76 126Djiboutian Section 100 19,3 % 20,4 % 176 213Total of five sections 1527 13,3 % 13,9 % 495 695 Table 56. Sensitivity tests (of the IRR) – Trend scenario – Road missing links of the corridor Dakar Djibouti – Road and railway
alternative
Base
Base Inv (+ 10 %) Advantages (‐10 %) Inv (10 %), Advantages (‐ 10 %)Total five sections 13,3 % 12,2 % 12,1 % 11,2 %
13.3.2 Railway component
630. The return indicators of the Trans‐Sahelian railway, by executing all the road and railway missing links of the
corridor Dakar Djibouti are the following. Table 57. Return rate and net present value (10 %, Millions US $) of the railway missing links of the corridor Dakar – Djibouti –
Road and railway alternative
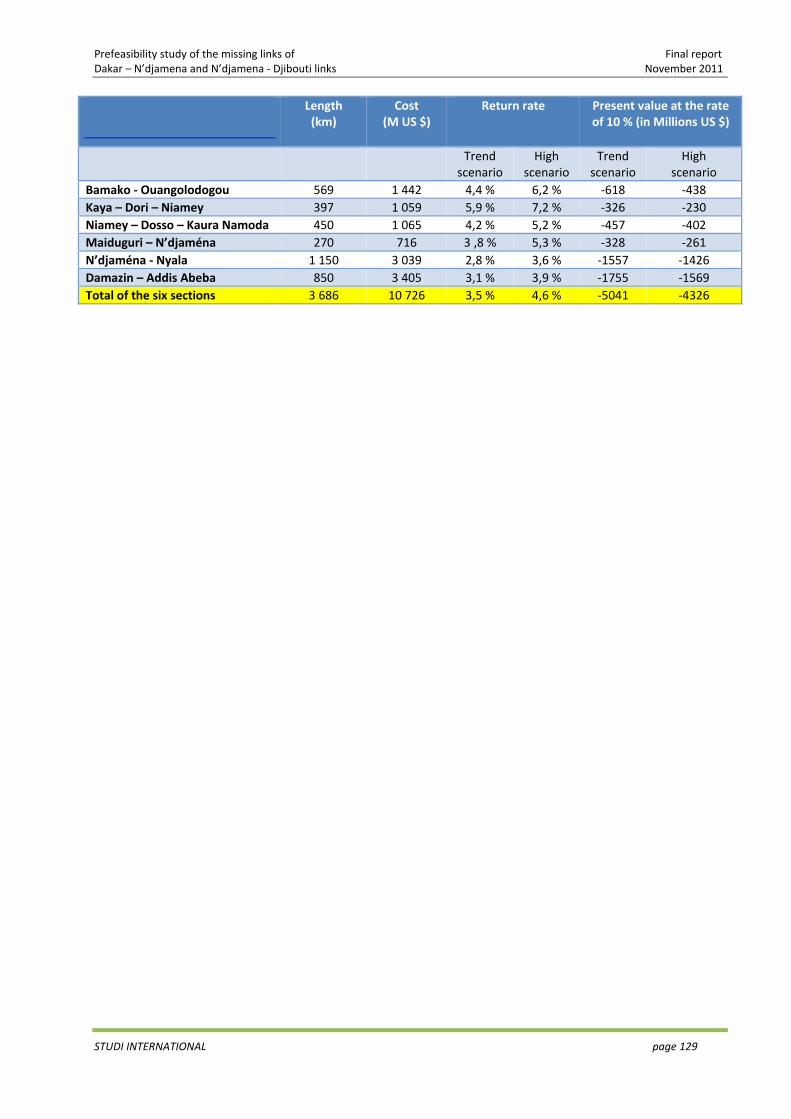
Prefeasibility study of the missing links of Final report Dakar – N’djamena and N’djamena ‐ Djibouti links November 2011
STUDI INTERNATIONAL page 129
Length (km)
Cost(M US $)
Return rate Present value at the rate of 10 % (in Millions US $)
Trend scenario
High scenario
Trend scenario
High scenario
Bamako ‐ Ouangolodogou 569 1 442 4,4 % 6,2 % ‐618 ‐438Kaya – Dori – Niamey 397 1 059 5,9 % 7,2 % ‐326 ‐230Niamey – Dosso – Kaura Namoda 450 1 065 4,2 % 5,2 % ‐457 ‐402Maiduguri – N’djaména 270 716 3 ,8 % 5,3 % ‐328 ‐261N’djaména ‐ Nyala 1 150 3 039 2,8 % 3,6 % ‐1557 ‐1426Damazin – Addis Abeba 850 3 405 3,1 % 3,9 % ‐1755 ‐1569Total of the six sections 3 686 10 726 3,5 % 4,6 % ‐5041 ‐4326
Prefeasibility study of the missing links of Final report Dakar – N’djamena and N’djamena ‐ Djibouti links November 2011
STUDI INTERNATIONAL page 130
13.4 Recommandations
631. Regarding the road missing links of the corridor, relating to the Cameroonian (85 km), Sudanese (611 km, Ethiopian (565 km) and Djiboutian (100 km), the economic eligibility of the road development is acquired, for the two suggested alternatives (road, road and railway). This justifies moving to the following stages: Preliminary Design (APS), Detailed preliminary design (APD) and Tender Documents (DAO).
632. The PIDA80 study, whose works were recently completed (November 2011) confirm these results and recommend a leveling as soon as possible of all the Transafricans’ road missing links and in particular the TAH 681 et 5.
633. ECCAS and IGAD have in this context an important role in promoting the corridor and the sections that concern
them among donors.
634. Concerning the Chadian Abeche Adré Sudan Border section of the Corridor (166 km), the detailed studies being carried out by STUDI International (2011) hold a management of bituminous concrete surfacing type on the entire itinerary, with works including (i) earthworks of total water off of the platform, (ii) the construction of a pavement covered of 7 m wide, lined on both sides with shoulders of 1.5 m, (iii) the construction of sanitation facilities and 5 bridges as well as (iv) safety, signaling and environment protection facilities.
635. The total cost excluding taxes of the construction work of the Chadian section amounted to 253 million USD at
2011 price, to which are added the cost of monitoring and follow‐up of work (estimated at 7 % of the investment) and physical hazards estimated at 5 % of costs, that makes a total cost of 285 million USD and a cost per kilometer of 1.71 million USD.
636. Economic calculations highlight the eligibility of the economic development of the Chadian section as well as its
positive impacts on national, regional and continental economies. The rate of return for the whole axis is 11.5 %, broadly acceptable in terms of income of the population of the zone of influence of the project. If the investments are reduced by 10 % (business competition) and benefits increased by 10 %, the rate of return would reach 13 %.
637. ECCAS, favored partner of Chad and IGAD, favored partner of Sudan, will all provide support for the valuation
of Abeche Adré Sudan border section with donors, as an important part of the corridor Dakar Djibouti, allowing (i ) to ensure satisfactory service conditions for users of direct and expanded zone of influence of the project, (ii) optimize the marketing and supply networks in the region, (iii) strengthen the trade between the countries covered by the corridor and (iv) offer Chad a new alternative of opening to the sea (via Sudan Port or Djibouti Port) for the procurement of goods and merchandise as well as the evacuation of export products.
638. Regarding the corridor’s railway missing links, the simulation of the developments impacts show a quite limited
modification between the “railway only alternative” and the “road and railway” alternative.
639. The overall return rates of the development of the railway missing links reach 3,7 % for the trend scenario and 4,8 % for the high scenario, values which are judged acceptable with regards to the important investment amounts in infrastructure. If the investments decrease by 10 % and the advantages are increased by 10 %, the return rate would reach 5,8 % for the high scenario and a minimum of 4,6 % for the trend scenario.
13.5 Implementation schedule
640. The Kaya – Dori – Niamey railway line and the rehabilitation of the existing Ouagadougou – Kaya section have recently been the object of a call for bids relating to the Preliminary Design (APS) and Detailed Preliminary Design (APD) studies. The financing is ensured by the European Union (9th FED) and the Owner is the CEDEAO. The acquisition process is finished and the contract with the consultant has been signed (source: UEMOA). The study should have started in March 2011, but was postponed following the socio‐political problems of the Ivory
80 Program Infrastructure for Development of Africa – Phase III report transport – November 2011 81 The leveling of the TAH 6 missing links is one of the first four priority projects (out of 24) retained by the PIDA
Prefeasibility study of the missing links of Final report Dakar – N’djamena and N’djamena ‐ Djibouti links November 2011
STUDI INTERNATIONAL page 131
Coast. It is to be pointed out that this situation was followed with a practically total interruption of the SITARAIL railway activity (source : SOPAFER‐B).
641. Regarding the Bamako – Bougouni – Sikasso – Ouangolodougou railway line, the Preliminary Design of the
project has been ongoing since March 2011 with the USTDA82 funding.
642. For the railway line Niamey ‐ Dosso, UEMOA has launched (November 2011) expressions of interest for establishing a short list of consultants in order to carry out supplementary investigations on the line, for an amount of 250 million FCFA (Source: UEMOA)
643. Concerning the other railway sections, the interaction (network effect) would require to execute the
subsequent stages (APS, ...) in parallel for the entire sections. This deals with the following sections: (i) Dosso – Kaura Namoda (360 km), (ii) Maiduguri – N’djaména (270 km), (iii) N’djaména – Nyala (1,150 km), and (iv) Damazin – Addis Abeba (850 km).
644. In order to optimize the duration of implementation of the APS studies, it is recommended to divide the
missing links (not being the subject of ongoing or not programmed studies to be subject to a special study in the short term) into seven (7) lots, in the following way :
Dosso – Kaura Namoda (360 km) Maiduguri – Ndjamena (270 km) N’djamena – Ati (370 km) Ati – Sudan Border (440 km) Frontière Sudan – Nyala (340 km) Damazin – Sudan Border – Mendi (430 km) Mendi – Addis Abeba (420 km)
645. Creating a management authority for the corridor study could be a solution to guarantee the role of regional
integration and ensure a good level of competitiveness and performance of the corridor, including all modes. However, and despite the fact that this alternative could lead to far very favorable results for some corridors in Africa, as the Northeast Corridor (linking five (5) countries in East Africa) or the Maputo Corridor (South Africa ‐ Maputo), its implementation could face some constraints, particularly fiscal and / or related to the availability of sufficiently experienced human resources in the activity.
646. Also, what is recommended and like that proposed in PIDA83 project, both in terms of infrastructure and
transport and transit facilitation measures, including shares of facilities and / or equipment concession, privatization or assembly of PPP schemes, is that the four regional economic communities (RECs) involved84 in the corridor plan actions to be established, in coordination with the countries served by the corridor, represented by the concerned national authorities, especially the ministries of transport, infrastructure, transport safety agencies, customs institutions, etc.. These authorities will then take on the implementation of these actions in each country. To do this, the support of the RECs, especially in funding research and promotion of projects with donors and the private sector, is highly recommended.
647. At the national level and in relation to the planned actions, national committees for monitoring / evaluation
can be mounted, comprising officials from various concerned institutions. Monitoring and evaluation should cover both the study and implementation of projects decided in consultation with the RECs and the operational plan (management and operation) of the corridor.
648. These committees could also play the role of observatories, with data collection providing information on the
status of projects development, the incurred difficulties (technical, operational, institutional, etc.) and all data informing on the performance of sections of the corridor across each country, as well as for prospective analysis / appraisal.
82 USTDA : United States and Trade Development Agency 83 Program Infrastructure for Development of Africa – Novembre 2011 84 ECOWAS, ECCAS, COMESA and IGAD
Prefeasibility study of the missing links of Final report Dakar – N’djamena and N’djamena ‐ Djibouti links November 2011
STUDI INTERNATIONAL page 132
649. From each country, these elements feed into a central database at each RECs. RECs can help fund this data collection, which will be updated permanently. A clear institutional framework must be defined for these committees, defining their role, the pattern of their coordination with the RECs and the financing mode of their activities.
650. Inter‐REC Coordination is more required, since four RECs (ECOWAS, ECCAS, COMESA and IGAD) will interfere in
the planning and management of development projects and leveling the corridor Dakar Djibouti. This should be coordinated by NEPAD, operational body of the African Union which in addition to its wide visibility into all transportation projects in the continent must have decision elements promoting competitiveness of the corridor of the study and ensure its interfacing with other corridors serving the Continent.
651. The databases of RECs can also be fed by data from the NEPAD to allow comparative analysis with projects in
other regions or other corridors, as well as a sharing of experiences. NEPAD will be a platform for inter‐CER exchange of information and feedback.
652. An entire year (2012) is retained for funding research to carry out the APS studies of the seven
(7) lots, followed by a year (12 months) for (i) preparing terms of reference (2.5 months), (ii) launching call for interest and establishing short lists of consultants (3 months), (iii) preparing the consultants’ proposals (2.5 months), (iv) selecting consultants and signing the contracts (4 months).
653. APS studies shall last at most 3 years for all lots, including periods of validation and management of interfaces between studies, followed by a meeting with donors. They shall cover all activities :
Data collection and critical analysis of the existing documents Technical studies: searching for the best layout, QPS of the retained layout, geological and geotechnical studies, hydrological and hydraulic studies, bridges’ designs, sites’ searching for stations, architectural and technical studies, study of the rolling stock, signaling designs, telecommunication studies, operation designs
Social and environmental impacts’ study Economic and financial study Institutional studies and participation of the private sector.

Prefeasibility study of the missing links of Final report Dakar – N’djamena and N’djamena ‐ Djibouti links November 2011
STUDI INTERNATIONAL page 133
Table 58. Implementation schedule of railway missing links
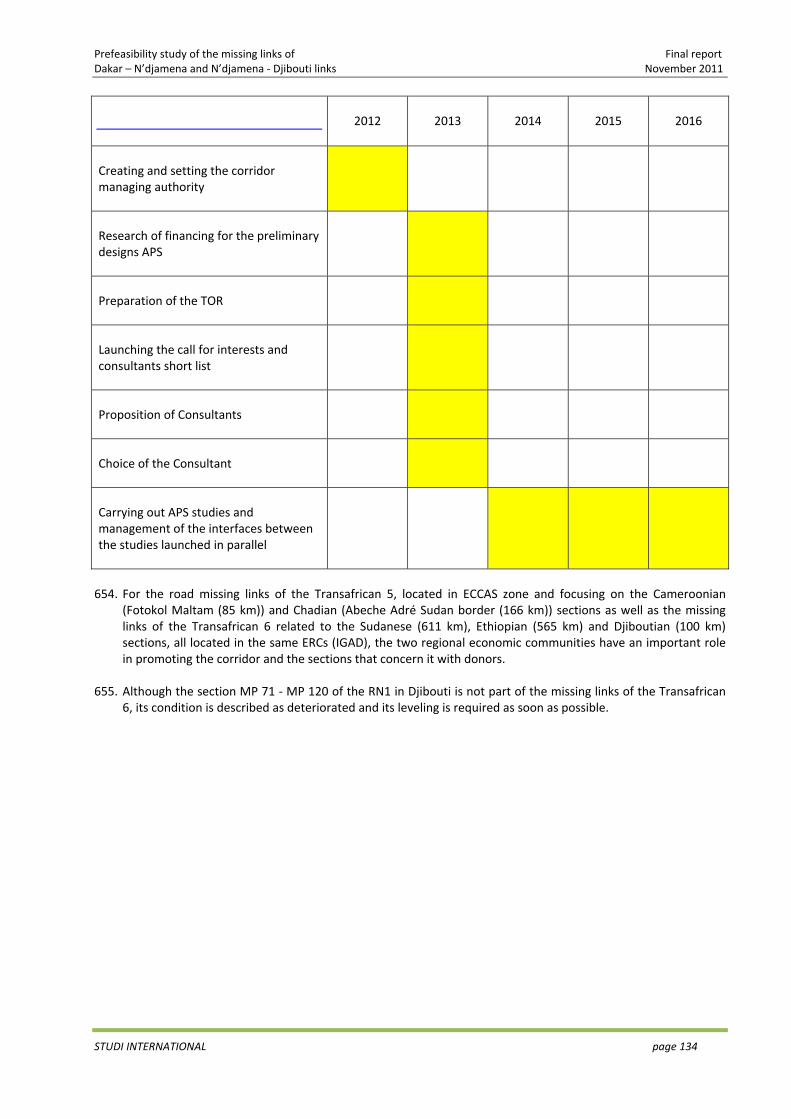
Prefeasibility study of the missing links of Final report Dakar – N’djamena and N’djamena ‐ Djibouti links November 2011
STUDI INTERNATIONAL page 134
2012 2013 2014 2015 2016
Creating and setting the corridor managing authority
Research of financing for the preliminary designs APS
Preparation of the TOR
Launching the call for interests and consultants short list
Proposition of Consultants
Choice of the Consultant
Carrying out APS studies and management of the interfaces between the studies launched in parallel
654. For the road missing links of the Transafrican 5, located in ECCAS zone and focusing on the Cameroonian
(Fotokol Maltam (85 km)) and Chadian (Abeche Adré Sudan border (166 km)) sections as well as the missing links of the Transafrican 6 related to the Sudanese (611 km), Ethiopian (565 km) and Djiboutian (100 km) sections, all located in the same ERCs (IGAD), the two regional economic communities have an important role in promoting the corridor and the sections that concern it with donors.
655. Although the section MP 71 ‐ MP 120 of the RN1 in Djibouti is not part of the missing links of the Transafrican
6, its condition is described as deteriorated and its leveling is required as soon as possible.
Prefeasibility study of the missing links of Final report Dakar – N’djamena and N’djamena ‐ Djibouti links November 2011
STUDI INTERNATIONAL page 135
14 RISKS ANALYSIS
656. The economies of most countries along the corridor are vulnerable to external shocks, and to the weather conditions. Undiversified, they mainly depend on the agricultural and mining products’ exports (for some of them). In addition to favorable economic conditions, the achievement of macroeconomic forecasts including those retained in the high scenario (GDP growth in the long term by 6% and by 5% in the very long term with the perspective of African integration), requires in particular the restoration of budgetary discipline and continuing efforts of economic and structural reform, especially with regards to the mobilization of fiscal resources. A lessening of development efforts and economic diversification will lead to macroeconomic malfunctions that affect the volume of the travel demand along the Dakar – Djibouti corridor.
657. The support of the development partners may be limited due to the fact that several partners are experiencing a difficult economic situation, with presently a slow recovery following a period of recession triggered by the international financial crisis, and worsening budget deficits. This is especially true for the United States, France, England and Japan, countries which are directly involved through bilateral aid, or indirectly through multilateral aid, and which have been the main development partners of the countries of the Sub‐Saharan Africa. However, this risk is to be tempered by the fact that the impact of development assistance on the financial balance of donor countries is often low, and by the advent of new partner countries, such as China and South Korea. As a mitigation measure, it is appropriate that development partners set up mechanisms to ensure the availability of resources in accordance with their commitments.
658. Political instability is another risk that could affect the demand along the Dakar ‐ Djibouti corridor, or some of
its sections. This risk is either (i) direct, linked to the political context of the countries crossed by the corridor, especially Sudan, with the crisis in Darfur and the unstable context of North – South separation, or (ii) indirect, with regards to a number of countries with a sea facade and which play an important role in the transport or disposal of products of landlocked countries crossed by the corridor, from or towards the rest of the world.
659. The increase in world energy prices may also pose a risk for the savings and investments of the countries
crossed by the corridor, most of which being net importers of hydrocarbons. The option towards "more railway", as well as the accelerated hydropower programs and the railway electrification is a mitigation measure which is worth to be considered, in order to reduce its impact.
660. Significant variations in the exchange rates between the currencies of countries in the area of direct and
extended influence of the corridor would affect international trade between these countries. Activating convergence agreements between countries of the same regional economic community (REC) and between the different RECs would allow the recovery of the exchange rate (relative) compatible with the hypotheses of the foreign trade prevision model.
661. Low achievement levels in direct foreign investment (FDI) will have a negative impact on economic
growth and poverty reduction. Improving the business environment and in general, and promoting a political and socio‐economically attractive environment, is an imperative for countries along the corridor to ensure the objectives set for economic growth, generating profits and promoting trade and exchanges.
662. The construction of the corridor’s road and railway missing links can lead to negative impacts on the
environmental level (sensitive areas. public and / or private property...). In accordance with the procedures of most donors, the feasibility study of any proposed infrastructure will include an Environmental and Social Impact Assessment (ESIA). In addition, arrangements will have to be taken in order to integrate the Environmental and Social Management Plans (ESMP) in the procurement documents for the execution of development works.
663. The presence of illegal practices along the corridor, particularly in the West and Centre, the absence of
standardization of customs procedures and the low efficiency of customs services, constitute a considerable
Prefeasibility study of the missing links of Final report Dakar – N’djamena and N’djamena ‐ Djibouti links November 2011
STUDI INTERNATIONAL page 136
obstacle to the regional integration of the countries crossed by the corridor, in the sense that these factors continue to significantly affect both the transit time and costs. The attractiveness of the different sections (road and rail) which compose the Dakar – Djibouti corridor and their competitiveness compared to other competing transportation alternatives, are subject to a progressive reduction in the short term and a total removal of these constraints on the medium term, in addition to ensuring a service quality and capacity adapted to the demand.
The UEMOA, in coordination with CEDEAO, has established a number of measures to improve the competitiveness of regional corridors and community roads of the member countries:
setting an observatory of abnormal practices along some regional corridors building one‐stop border posts and harmonizing customs procedures in several countries (use of the
computerized SYDONIA + + system, ...) contribution of the UEMOA and CEDEAO to fund these actions.
Similar measures are highly recommended for the Dakar ‐ Djibouti corridor, which must be adopted as part of a joint action plan with the relevant regional economic communities CEDEAO, CEEAC,COMESA, IGAD (ECOWAS. ECCAS, COMESA, IGAD), expected to assist and support countries served by the corridor, in order to maximize the generalized transport costs.
664. Regarding the capabilities of the organs which are in charge piloting the policies and programs to be
implemented both for road transport and railway along the corridor. it is recommended that the funding of the technico‐economic feasibility studies of the corridor’s infrastructures also includes funding for training or technical assistance for the road and rail agencies of the countries crossed by the corridor. This assistance shall mainly include (i) aspects of harmonization of the design standards for road and railway components. (ii) maintenance needs and maintenance strategies and (iii) aspects of cooperation between the bodies of the different countries to ensure an optimal management of the infrastructures, equipment and road and railway flows via the corridor. This particular initiative was adopted for the regional road corridor in East Africa, linking Arusha (Tanzania) to Athi River, located at 35 km South of Nairobi (Kenya). Funding for technical assistance to road agencies in both countries, as part of respectively the SADEC (for Tanzania) and COMESA (for Kenya), has facilitated the consultations with respect to the harmonization of the design standards of the road axis between the two countries served, particularly in terms of the axle load limit, the cross sections, and the longitudinal profile, and define a maintenance strategy for the infrastructure.

Prefeasibility study of the missing links of Final report Dakar – N’djamena and N’djamena ‐ Djibouti links November 2011
STUDI INTERNATIONAL page 137
Table 59. Risks control matrix
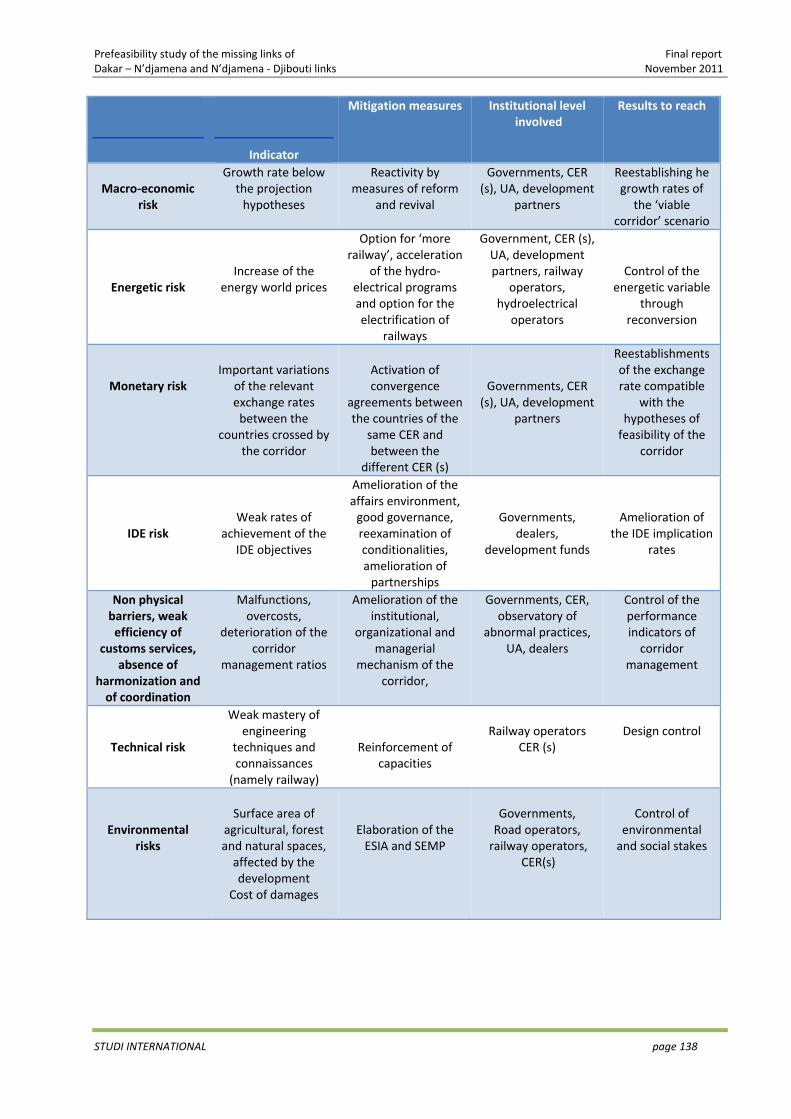
Prefeasibility study of the missing links of Final report Dakar – N’djamena and N’djamena ‐ Djibouti links November 2011
STUDI INTERNATIONAL page 138
Indicator
Mitigation measures Institutional level involved
Results to reach
Macro‐economic
risk
Growth rate below the projection hypotheses
Reactivity by measures of reform
and revival
Governments, CER (s), UA, development
partners
Reestablishing he growth rates of the ‘viable
corridor’ scenario
Energetic risk
Increase of the energy world prices
Option for ‘more railway’, acceleration
of the hydro‐electrical programs and option for the electrification of
railways
Government, CER (s), UA, development partners, railway
operators, hydroelectrical
operators
Control of the
energetic variable through
reconversion
Monetary risk
Important variations
of the relevant exchange rates between the
countries crossed by the corridor
Activation of convergence
agreements between the countries of the
same CER and between the
different CER (s)
Governments, CER
(s), UA, development partners
Reestablishments of the exchange rate compatible
with the hypotheses of feasibility of the
corridor
IDE risk
Weak rates of achievement of the
IDE objectives
Amelioration of the affairs environment, good governance, reexamination of conditionalities, amelioration of partnerships
Governments,
dealers, development funds
Amelioration of
the IDE implication rates
Non physical barriers, weak efficiency of
customs services, absence of
harmonization and of coordination
Malfunctions, overcosts,
deterioration of the corridor
management ratios
Amelioration of the institutional,
organizational and managerial
mechanism of the corridor,
Governments, CER, observatory of
abnormal practices, UA, dealers
Control of the performance indicators of corridor
management
Technical risk
Weak mastery of engineering
techniques and connaissances (namely railway)
Reinforcement of
capacities
Railway operators CER (s)
Design control
Environmental risks
Surface area of
agricultural, forest and natural spaces, affected by the development
Cost of damages
Elaboration of the ESIA and SEMP
Governments, Road operators, railway operators,
CER(s)
Control of environmental and social stakes
Prefeasibility study of the missing links of Final report Dakar – N’djamena and N’djamena ‐ Djibouti links November 2011
STUDI INTERNATIONAL page 139
15 CONCLUSION
665. The study focuses on the feasibility of the missing links of Dakar Djibouti corridor, with its both road and rail components. The road part is formed of the missing links of TAH 5 and 6, while the railway part consists of the missing links of the Trans‐Sahelian railway.
666. Its purpose is to analyze in a strategic manner the global demand for transport on these missing links and
provide recommendations on the implementation of the most appropriate development option in terms of layout, technical and organization standards. It is listed in the African projects judged integrators, aiming to support innovative approaches to mobilize the necessary resources for infrastructure development along the regional corridors.
667. The Transafrican 5, also known as Trans‐Sahelian, links Dakar to N'djamena, on a linear of 4434 km. The
Transafrican 6 connects N'djamena to Djibouti and covers a length of 4219 km, i.e. a road component of the corridor of 8653 km long.
668. The existing railway component of the corridor consists of the following lines:
Dakar Bamako (1228 km), in meter gauge (1000 mm), Ouangolodogou ‐ Ouagadougou ‐ Kaya (648 km), also in meter gauge (1000 mm), Kaura Namoda ‐ Zaria ‐ Kaduna ‐ Jos ‐ Bauchi ‐ Maiduguri (1219 km), located entirely in Nigeria, in narrow gauge (1067 mm)
Two variants in Sudan: a first variant formed by Nyala Sennar Damazin (1230 km) and a second variant consists of Nyala Sennar Gedaref (1240 km). They are both in narrow gauge (1067 mm)
finally, Addis Ababa Djibouti (781 km), of meter gauge (1000 mm).
669. The first variant is long of 5106 km, while the second variant has a length of 5116 km. 670. In 2003, the lengths of the road missing links identified by the SWECO study 2003 relating to the Transafrican 5
and Transafrican 6 rise respectively to 610 km and 2257 km.
671. In 2011, all the missing links of the Transafrican 5 was the subject of rehabilitation and leveling, with the exception of the Cameroonian section between Fotokol and Maltam (85 km). As for the Transafrican 6, the missing links affect the four countries crossed by the infrastructure (Chad, Sudan, Ethiopia, Djibouti), for a total length of 1442 km.
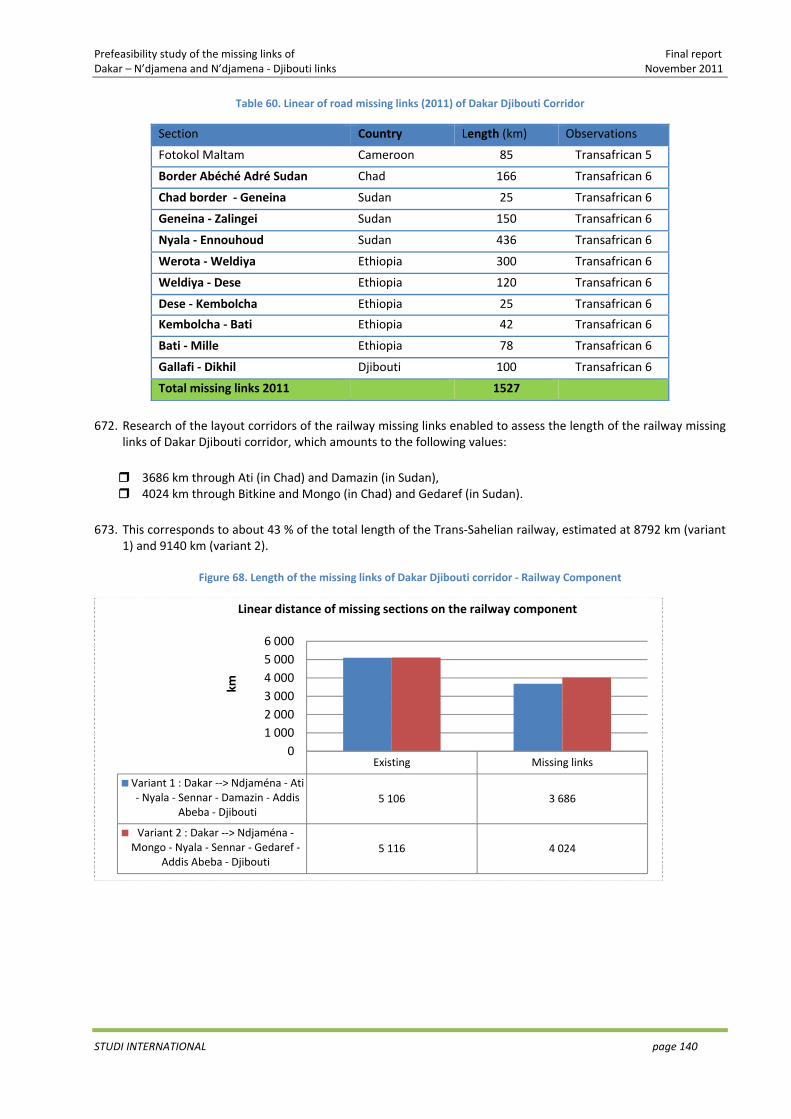
Prefeasibility study of the missing links of Final report Dakar – N’djamena and N’djamena ‐ Djibouti links November 2011
STUDI INTERNATIONAL page 140
Table 60. Linear of road missing links (2011) of Dakar Djibouti Corridor
Section Country Length (km) Observations
Fotokol Maltam Cameroon 85 Transafrican 5
Border Abéché Adré Sudan Chad 166 Transafrican 6
Chad border ‐ Geneina Sudan 25 Transafrican 6
Geneina ‐ Zalingei Sudan 150 Transafrican 6
Nyala ‐ Ennouhoud Sudan 436 Transafrican 6
Werota ‐ Weldiya Ethiopia 300 Transafrican 6
Weldiya ‐ Dese Ethiopia 120 Transafrican 6
Dese ‐ Kembolcha Ethiopia 25 Transafrican 6
Kembolcha ‐ Bati Ethiopia 42 Transafrican 6
Bati ‐ Mille Ethiopia 78 Transafrican 6
Gallafi ‐ Dikhil Djibouti 100 Transafrican 6
Total missing links 2011 1527
672. Research of the layout corridors of the railway missing links enabled to assess the length of the railway missing
links of Dakar Djibouti corridor, which amounts to the following values:
3686 km through Ati (in Chad) and Damazin (in Sudan), 4024 km through Bitkine and Mongo (in Chad) and Gedaref (in Sudan).
673. This corresponds to about 43 % of the total length of the Trans‐Sahelian railway, estimated at 8792 km (variant
1) and 9140 km (variant 2).
Figure 68. Length of the missing links of Dakar Djibouti corridor ‐ Railway Component
Existing Missing links
Variant 1 : Dakar ‐‐> Ndjaména ‐ Ati ‐ Nyala ‐ Sennar ‐ Damazin ‐ Addis
Abeba ‐ Djibouti5 106 3 686
Variant 2 : Dakar ‐‐> Ndjaména ‐Mongo ‐ Nyala ‐ Sennar ‐ Gedaref ‐
Addis Abeba ‐ Djibouti5 116 4 024
01 0002 0003 0004 0005 0006 000
km
Linear distance of missing sections on the railway component
Prefeasibility study of the missing links of Final report Dakar – N’djamena and N’djamena ‐ Djibouti links November 2011
STUDI INTERNATIONAL page 141
674. In terms of transport demand, its inter‐country component, which represents the ultimate purpose of the corridor and its layout, and which mainly involves three sub‐segments85, it was assessed for two scenarios of GDP growth: (i) a trend scenario, which holds the very long‐term maintenance of the target value of the African countries’ economies convergence, set at 6 % in the long term to 5 % in the very long term and (ii) a high scenario, which retains a progressive improvement of the business climate of the countries included in the zone of influence and the same rate of convergence. This scenario also takes into account the effect of "integration of Africa," estimated by the study on quantifying scenarios for RECs rationalization (2011)86 and which assesses the growth of GDP and imports by country between reference year (2008) and the year of integration service.
675. The estimate of GDP in the very long term of the countries included in the zone of influence of the project
highlights the three following key results :
The combined GDP of the space formed by the ten countries crossed by the corridor varies according to the growth scenario (trend, high), between 1100 billion USD and 1140 Billion USD, which corresponds to an average annual growth rate of 4.8 % for the trend scenario and 4.9 % for the high scenario,
It reached according to the growth scenario, between 2500 billion USD and 2600 billion USD for the space formed by the countries crossed by the corridor and the thirteen countries that are neighboring them, representing slightly moderate growth rates, reaching respectively 4.6 % and 4.8 %,
The two spaces composed by (i) the ten countries crossed by the corridor and (ii) the ten countries crossed by the corridor plus their neighboring countries, represent in 2040, respectively 22 % and 52 % of mainland GDP, which puts clearly the obvious economic weight of the project area.
676. For these two scenarios, exchanges of countries in the area of influence of the project and having to take place
via the corridor were evaluated by 2040. The economic model developed by the consultant highlighted the following two relevant factors :
for the trend scenario, the exchange will reach 29.4 million tonnes, of which 10.4 million tons transported by railway and 19 million tonnes transported by road,
as for the high scenario, they are estimated at 30.7 million tonnes with a railway share of 12.8 million tonnes, the share of the road component would reach 17.9 million tonnes.
677. The layout corridors of lesser constraints, relating to the railway component of the corridor missing links, were
developed through the massive amount of information in the database information system (GIS) implemented by the consultant. Two corridor alternatives are proposed:
A first alternative, passing by Ati (in Chad) and Damazin (in Sudan), A second alternative, passing by Mongo (in Chad) and Gedaref (in Sudan).
678. It is recommended to choose the first alternative (Dakar ‐ N'djamena ‐ Ati ‐ Abeche ‐ Nyala ‐ Sennar ‐ Damazin ‐ Nekemte ‐ Addis Ababa ‐ Djibouti), given the benefits of this alternative in terms of cost, of access to certain mineral deposits (in the west of Ethiopia), of a less important negative impact at the environmental level and consistent with the Ethiopian railway Master Plan.
679. Regarding the tracks gauge, we recommend the standard gauge (1435 mm) for the entire corridor, in response
to statements by the African Union, adopted in Algiers (2008) the conclusions of the conference on African railways networks (Johannesburg, 2007), recommending equal quality of service between different railway
85 The first segment consists of international trade between the countries crossed by the corridor. The second sub‐segment includes the trade of the countries covered by the corridor with the thirteen countries bordering them. The third sub‐segment includes the trade of the ten countries crossed by the corridor with the rest of the world 86 Consultant : STUDI International
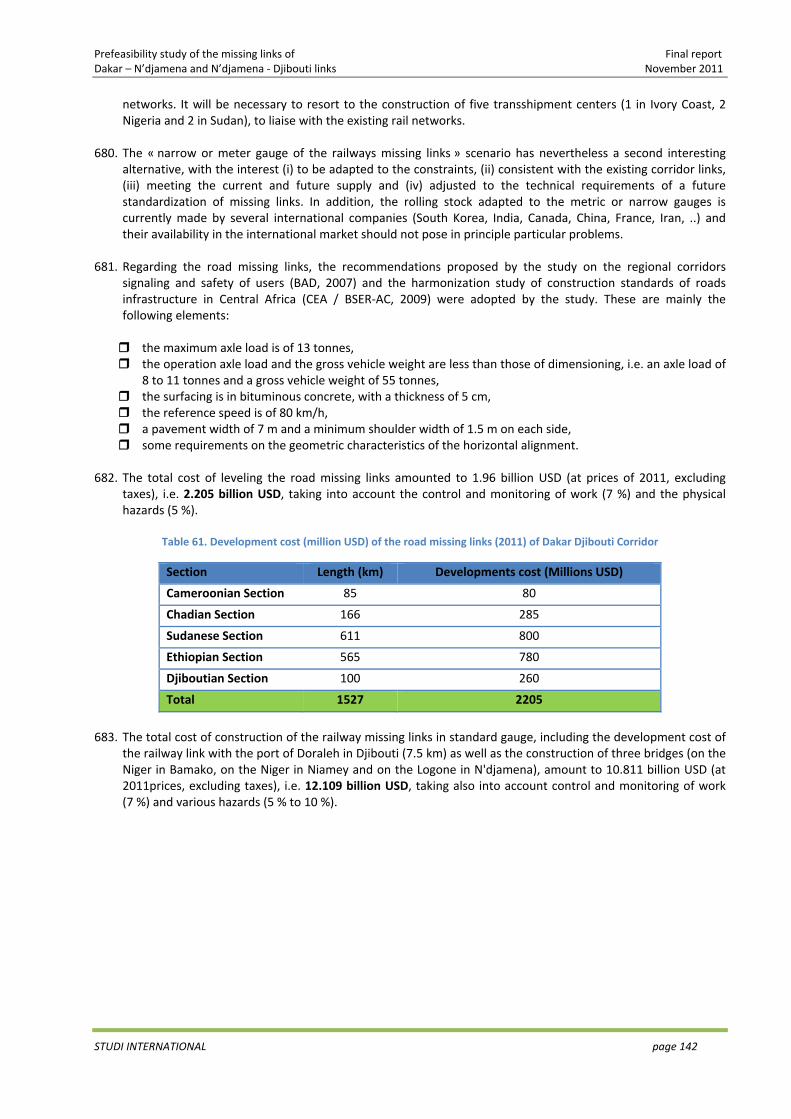
Prefeasibility study of the missing links of Final report Dakar – N’djamena and N’djamena ‐ Djibouti links November 2011
STUDI INTERNATIONAL page 142
networks. It will be necessary to resort to the construction of five transshipment centers (1 in Ivory Coast, 2 Nigeria and 2 in Sudan), to liaise with the existing rail networks.
680. The « narrow or meter gauge of the railways missing links » scenario has nevertheless a second interesting
alternative, with the interest (i) to be adapted to the constraints, (ii) consistent with the existing corridor links, (iii) meeting the current and future supply and (iv) adjusted to the technical requirements of a future standardization of missing links. In addition, the rolling stock adapted to the metric or narrow gauges is currently made by several international companies (South Korea, India, Canada, China, France, Iran, ..) and their availability in the international market should not pose in principle particular problems.
681. Regarding the road missing links, the recommendations proposed by the study on the regional corridors signaling and safety of users (BAD, 2007) and the harmonization study of construction standards of roads infrastructure in Central Africa (CEA / BSER‐AC, 2009) were adopted by the study. These are mainly the following elements:
the maximum axle load is of 13 tonnes, the operation axle load and the gross vehicle weight are less than those of dimensioning, i.e. an axle load of 8 to 11 tonnes and a gross vehicle weight of 55 tonnes,
the surfacing is in bituminous concrete, with a thickness of 5 cm, the reference speed is of 80 km/h, a pavement width of 7 m and a minimum shoulder width of 1.5 m on each side, some requirements on the geometric characteristics of the horizontal alignment.
682. The total cost of leveling the road missing links amounted to 1.96 billion USD (at prices of 2011, excluding taxes), i.e. 2.205 billion USD, taking into account the control and monitoring of work (7 %) and the physical hazards (5 %).
Table 61. Development cost (million USD) of the road missing links (2011) of Dakar Djibouti Corridor
Section Length (km) Developments cost (Millions USD)
Cameroonian Section 85 80
Chadian Section 166 285
Sudanese Section 611 800
Ethiopian Section 565 780
Djiboutian Section 100 260
Total 1527 2205
683. The total cost of construction of the railway missing links in standard gauge, including the development cost of
the railway link with the port of Doraleh in Djibouti (7.5 km) as well as the construction of three bridges (on the Niger in Bamako, on the Niger in Niamey and on the Logone in N'djamena), amount to 10.811 billion USD (at 2011prices, excluding taxes), i.e. 12.109 billion USD, taking also into account control and monitoring of work (7 %) and various hazards (5 % to 10 %).
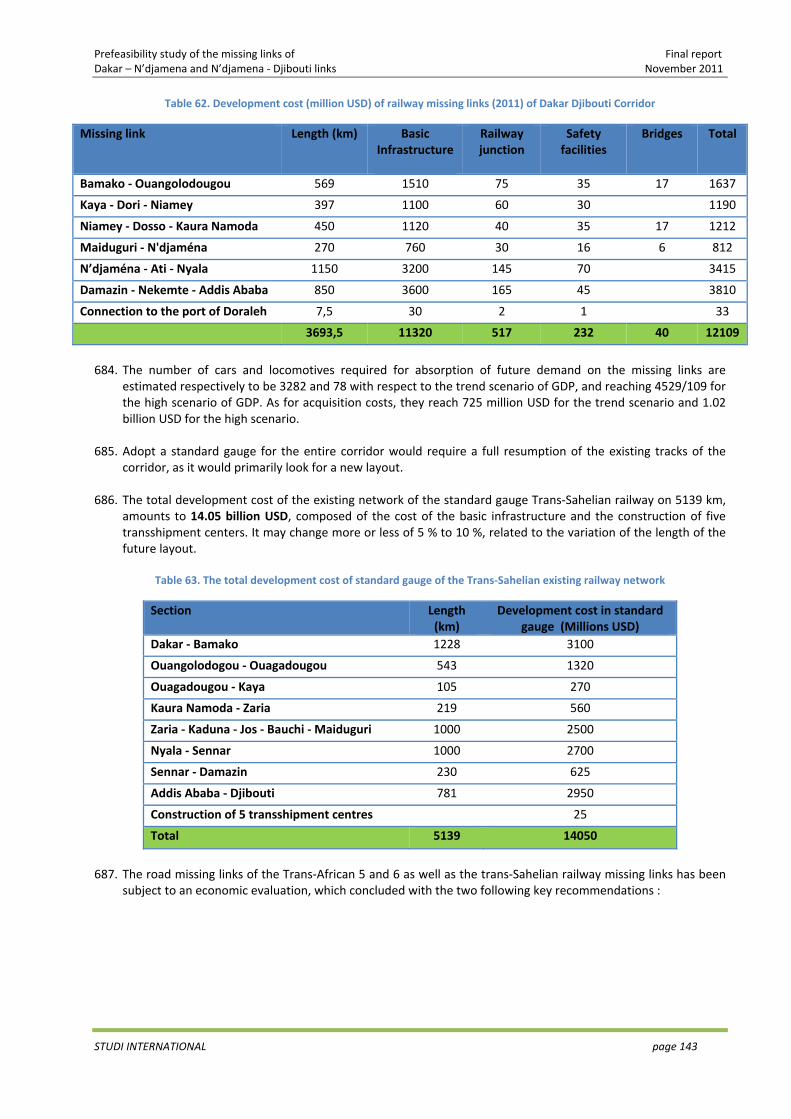
Prefeasibility study of the missing links of Final report Dakar – N’djamena and N’djamena ‐ Djibouti links November 2011
STUDI INTERNATIONAL page 143
Table 62. Development cost (million USD) of railway missing links (2011) of Dakar Djibouti Corridor
Missing link Length (km) Basic Infrastructure
Railway junction
Safety facilities
Bridges Total
Bamako ‐ Ouangolodougou 569 1510 75 35 17 1637
Kaya ‐ Dori ‐ Niamey 397 1100 60 30 1190
Niamey ‐ Dosso ‐ Kaura Namoda 450 1120 40 35 17 1212
Maiduguri ‐ N'djaména 270 760 30 16 6 812
N’djaména ‐ Ati ‐ Nyala 1150 3200 145 70 3415
Damazin ‐ Nekemte ‐ Addis Ababa 850 3600 165 45 3810
Connection to the port of Doraleh 7,5 30 2 1 33
3693,5 11320 517 232 40 12109
684. The number of cars and locomotives required for absorption of future demand on the missing links are
estimated respectively to be 3282 and 78 with respect to the trend scenario of GDP, and reaching 4529/109 for the high scenario of GDP. As for acquisition costs, they reach 725 million USD for the trend scenario and 1.02 billion USD for the high scenario.
685. Adopt a standard gauge for the entire corridor would require a full resumption of the existing tracks of the
corridor, as it would primarily look for a new layout.
686. The total development cost of the existing network of the standard gauge Trans‐Sahelian railway on 5139 km, amounts to 14.05 billion USD, composed of the cost of the basic infrastructure and the construction of five transshipment centers. It may change more or less of 5 % to 10 %, related to the variation of the length of the future layout.
Table 63. The total development cost of standard gauge of the Trans‐Sahelian existing railway network
Section Length(km)
Development cost in standard gauge (Millions USD)
Dakar ‐ Bamako 1228 3100
Ouangolodogou ‐ Ouagadougou 543 1320
Ouagadougou ‐ Kaya 105 270
Kaura Namoda ‐ Zaria 219 560
Zaria ‐ Kaduna ‐ Jos ‐ Bauchi ‐ Maiduguri 1000 2500
Nyala ‐ Sennar 1000 2700
Sennar ‐ Damazin 230 625
Addis Ababa ‐ Djibouti 781 2950
Construction of 5 transshipment centres 25
Total 5139 14050
687. The road missing links of the Trans‐African 5 and 6 as well as the trans‐Sahelian railway missing links has been
subject to an economic evaluation, which concluded with the two following key recommendations :
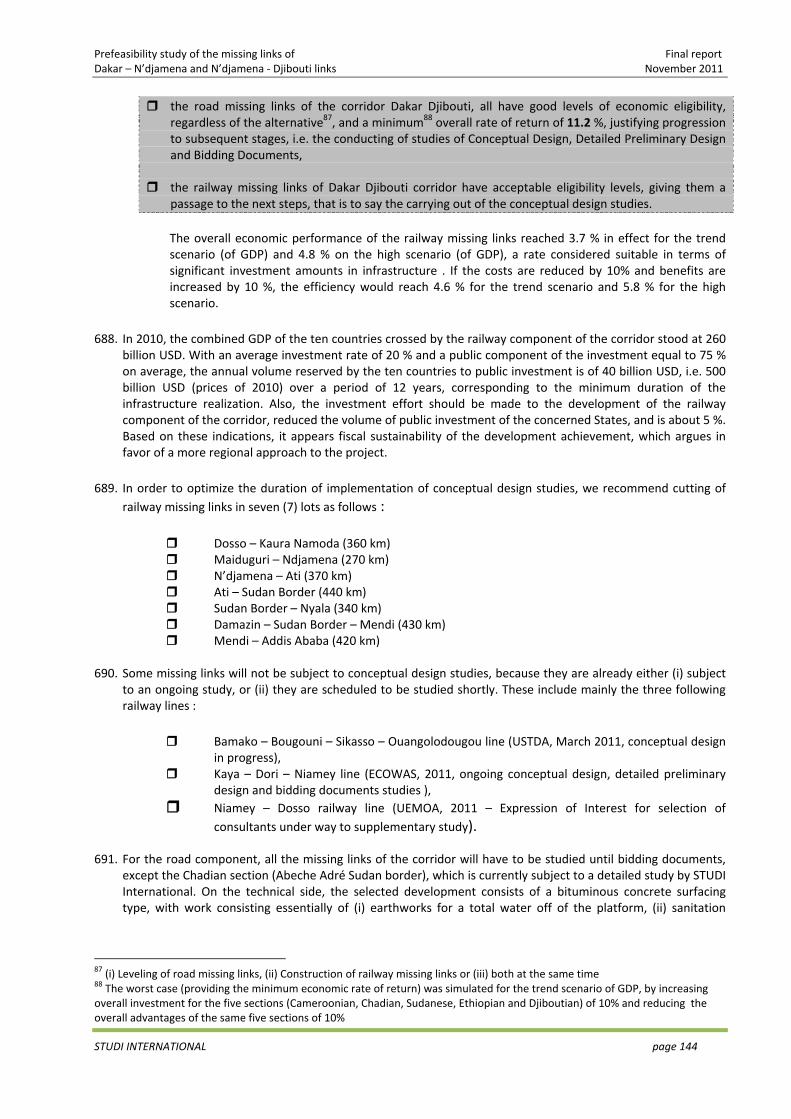
Prefeasibility study of the missing links of Final report Dakar – N’djamena and N’djamena ‐ Djibouti links November 2011
STUDI INTERNATIONAL page 144
the road missing links of the corridor Dakar Djibouti, all have good levels of economic eligibility, regardless of the alternative87, and a minimum88 overall rate of return of 11.2 %, justifying progression to subsequent stages, i.e. the conducting of studies of Conceptual Design, Detailed Preliminary Design and Bidding Documents,
the railway missing links of Dakar Djibouti corridor have acceptable eligibility levels, giving them a passage to the next steps, that is to say the carrying out of the conceptual design studies.
The overall economic performance of the railway missing links reached 3.7 % in effect for the trend scenario (of GDP) and 4.8 % on the high scenario (of GDP), a rate considered suitable in terms of significant investment amounts in infrastructure . If the costs are reduced by 10% and benefits are increased by 10 %, the efficiency would reach 4.6 % for the trend scenario and 5.8 % for the high scenario.
688. In 2010, the combined GDP of the ten countries crossed by the railway component of the corridor stood at 260
billion USD. With an average investment rate of 20 % and a public component of the investment equal to 75 % on average, the annual volume reserved by the ten countries to public investment is of 40 billion USD, i.e. 500 billion USD (prices of 2010) over a period of 12 years, corresponding to the minimum duration of the infrastructure realization. Also, the investment effort should be made to the development of the railway component of the corridor, reduced the volume of public investment of the concerned States, and is about 5 %. Based on these indications, it appears fiscal sustainability of the development achievement, which argues in favor of a more regional approach to the project.
689. In order to optimize the duration of implementation of conceptual design studies, we recommend cutting of
railway missing links in seven (7) lots as follows :
Dosso – Kaura Namoda (360 km) Maiduguri – Ndjamena (270 km) N’djamena – Ati (370 km) Ati – Sudan Border (440 km) Sudan Border – Nyala (340 km) Damazin – Sudan Border – Mendi (430 km) Mendi – Addis Ababa (420 km)
690. Some missing links will not be subject to conceptual design studies, because they are already either (i) subject
to an ongoing study, or (ii) they are scheduled to be studied shortly. These include mainly the three following railway lines :
Bamako – Bougouni – Sikasso – Ouangolodougou line (USTDA, March 2011, conceptual design
in progress), Kaya – Dori – Niamey line (ECOWAS, 2011, ongoing conceptual design, detailed preliminary
design and bidding documents studies ), Niamey – Dosso railway line (UEMOA, 2011 – Expression of Interest for selection of
consultants under way to supplementary study). 691. For the road component, all the missing links of the corridor will have to be studied until bidding documents,
except the Chadian section (Abeche Adré Sudan border), which is currently subject to a detailed study by STUDI International. On the technical side, the selected development consists of a bituminous concrete surfacing type, with work consisting essentially of (i) earthworks for a total water off of the platform, (ii) sanitation
87 (i) Leveling of road missing links, (ii) Construction of railway missing links or (iii) both at the same time 88 The worst case (providing the minimum economic rate of return) was simulated for the trend scenario of GDP, by increasing overall investment for the five sections (Cameroonian, Chadian, Sudanese, Ethiopian and Djiboutian) of 10% and reducing the overall advantages of the same five sections of 10%
Prefeasibility study of the missing links of Final report Dakar – N’djamena and N’djamena ‐ Djibouti links November 2011
STUDI INTERNATIONAL page 145
strengthening, (iii) the construction of five bridges, (iv) a pavement covered of 7 m wide, lined on both sides with shoulders of 1.5 m and (v) safety, signaling and environment protection facilities.
692. Financially, the cost excluding taxes, of the Chadian section’s development raises in prices of the year 2011 to
285 million USD and has a sufficient economic eligibility, with a rate of return for all the itinerary of 11.5 %. The analysis of simulation results of sensitivity tests shows that in the worst case, the project managed to achieve a minimum rate of return of 9.8 %, an acceptable level of income compared to the population incomes of the section’s area of influence.
693. Regarding the performance schedule of studies:
3 years (2012 – 2014) were selected for funding research and conducting Conceptual Design, Detailed Preliminary Design and Bidding Documents’ studies of the road missing links,
5 years (2012 – 2016) were selected for funding research and conducting Conceptual Design studies of the railway missing links.
694. For the road missing links, the construction period ranged from 9 months (Chad Border El Geneina, Dese
Kembolcha) and can reach up to 36 months for Gallafi Dikhil Djiboutian section. It is recommended that the procedures necessary for funding research, the drafting of the TOR, the selection of Consultants and works carrying out be undertaken and implemented as soon as possible. The year 2018 may be retained as a target so that the entire road component of the corridor is operational.
695. As for the railway component of the corridor, the year 2017 is proposed as a target for the completion of
missing links’ conceptual design studies. 696. The four regional economic communities crossed by the corridor (ECOWAS, ECCAS, COMESA and IGAD) will
have to plan all the selected measures, in coordination with the countries served by the corridor. 697. At the national level and in relation to planned actions, national committees for monitoring and evaluation will
have to be formed, composed of managers from various active institutions in the transport sector. 698. Coordination between the ERCs is required, it can be provided in consultation with the NEPAD which has a high
profile on all transportation projects in Africa, providing the interface of organization and coordination of Dakar Djibouti corridor with the other corridors serving the Continent.
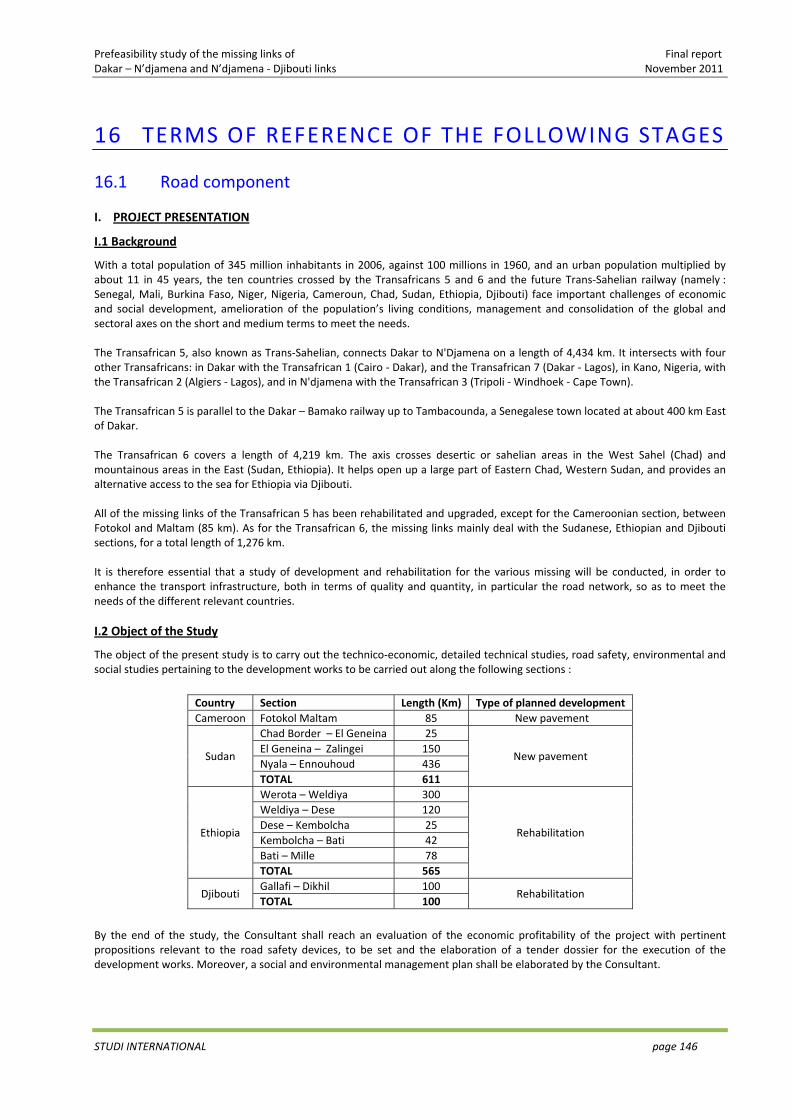
Prefeasibility study of the missing links of Final report Dakar – N’djamena and N’djamena ‐ Djibouti links November 2011
STUDI INTERNATIONAL page 146
16 TERMS OF REFERENCE OF THE FOLLOWING STAGES
16.1 Road component
I. PROJECT PRESENTATION
I.1 Background
With a total population of 345 million inhabitants in 2006, against 100 millions in 1960, and an urban population multiplied by about 11 in 45 years, the ten countries crossed by the Transafricans 5 and 6 and the future Trans‐Sahelian railway (namely : Senegal, Mali, Burkina Faso, Niger, Nigeria, Cameroun, Chad, Sudan, Ethiopia, Djibouti) face important challenges of economic and social development, amelioration of the population’s living conditions, management and consolidation of the global and sectoral axes on the short and medium terms to meet the needs. The Transafrican 5, also known as Trans‐Sahelian, connects Dakar to N'Djamena on a length of 4,434 km. It intersects with four other Transafricans: in Dakar with the Transafrican 1 (Cairo ‐ Dakar), and the Transafrican 7 (Dakar ‐ Lagos), in Kano, Nigeria, with the Transafrican 2 (Algiers ‐ Lagos), and in N'djamena with the Transafrican 3 (Tripoli ‐ Windhoek ‐ Cape Town). The Transafrican 5 is parallel to the Dakar – Bamako railway up to Tambacounda, a Senegalese town located at about 400 km East of Dakar. The Transafrican 6 covers a length of 4,219 km. The axis crosses desertic or sahelian areas in the West Sahel (Chad) and mountainous areas in the East (Sudan, Ethiopia). It helps open up a large part of Eastern Chad, Western Sudan, and provides an alternative access to the sea for Ethiopia via Djibouti. All of the missing links of the Transafrican 5 has been rehabilitated and upgraded, except for the Cameroonian section, between Fotokol and Maltam (85 km). As for the Transafrican 6, the missing links mainly deal with the Sudanese, Ethiopian and Djibouti sections, for a total length of 1,276 km. It is therefore essential that a study of development and rehabilitation for the various missing will be conducted, in order to enhance the transport infrastructure, both in terms of quality and quantity, in particular the road network, so as to meet the needs of the different relevant countries. I.2 Object of the Study
The object of the present study is to carry out the technico‐economic, detailed technical studies, road safety, environmental and social studies pertaining to the development works to be carried out along the following sections :
Country Section Length (Km) Type of planned development Cameroon Fotokol Maltam 85 New pavement
Sudan
Chad Border – El Geneina 25
New pavement El Geneina – Zalingei 150 Nyala – Ennouhoud 436 TOTAL 611
Ethiopia
Werota – Weldiya 300
Rehabilitation
Weldiya – Dese 120 Dese – Kembolcha 25 Kembolcha – Bati 42 Bati – Mille 78 TOTAL 565
Djibouti Gallafi – Dikhil 100
Rehabilitation TOTAL 100
By the end of the study, the Consultant shall reach an evaluation of the economic profitability of the project with pertinent propositions relevant to the road safety devices, to be set and the elaboration of a tender dossier for the execution of the development works. Moreover, a social and environmental management plan shall be elaborated by the Consultant.

Prefeasibility study of the missing links of Final report Dakar – N’djamena and N’djamena ‐ Djibouti links November 2011
STUDI INTERNATIONAL page 147
II. CONTENT OF THE STUDY
II.1 PHASE 1 : PRELIMINARY DESIGN
During this phase, the Consultant shall elaborate an establishment report which shall manly comprise : II.1.1 Methodological reframing, team mobilization, planning and programming
This task comprises the collection of information relevant to:
• The presentation of the project context and objectives • Description of the methodology projected to carry out the tasks • The time chart of team mobilization on site and at the head office • Previsional schedule of the services relevant to the different activities and important tasks. • Any other information relating to the implementation of tasks.
II.1.2 Collection and analysis of available documents
This task comprises the collection of information relevant to:
• The background of the construction and maintenance works carried out (reinforcement, refilling, routine or periodical maintenance….).
• Previous traffic counting • Data on the axle loads • Geotechnical data • Pluviometric and climactic data • Cartographic data • etc.
II.1.3 General routes’ reconnaissance
The Consultant shall proceed to the reconnaissance of the existing route, in order to point out :
• the details relevant to the crossed environment (villages, lands, orchards or plantations, protected sites or spaces, classified forests.…)
• the geometric characteristics (planes, longitudinal and transversal) • flood areas (blue points) and accident probing areas (black points) • the inventory of existing bridges and hydraulic structures (Nature, dimensions, structural and functional condition…) • case of the existing roadways: survey of the deteriorations (deformations, stripping. cracking.…). • inventory of natural materials deposits and quarries, as well as water points • etc.
II.1.4 Analysis and approval of the design standards and proposing general development principles
The Consultant shall proceed to an analysis of the standards to be applied for the project. A comparative analysis shall be presented in order to come out with the effects on the project. The comparison shall concern:
• road typologies and classifications • conditions of application of the reference speeds • minimum geometric values • alignment continuity rules • norms of visibility • cross‐sections standards • development principles of bridges • the projected development principles (rectifications of alignment and longitudinal profile, widening,…) • etc…
II.2 PHASE 2 : PRELIMINARY DESIGN
This phase shall mainly comprise the field works, summary technical studies, environmental study and economic study.
Prefeasibility study of the missing links of Final report Dakar – N’djamena and N’djamena ‐ Djibouti links November 2011
STUDI INTERNATIONAL page 148
II.2.1 Field Works
II.2.1.1 Topographic Works of the conceptual design (Topographic surveys of the register)
• Establishment and implantation of the base polygon and its connection to the general leveling of the country • Topographic survey of the register at 1/5000th of the running sections and existing axes • Survey of the cross‐sections at the level of the homogenous areas and singular points (high points. low points, change
of profile, flows, high slopes…) • Survey of the longitudinal profile at 1/5000th / 1/500th • Survey of the existing hydraulic structures with indication of the direction and characteristics of the structure
II.2.1.2 Geotechnical Campaign of the conceptual design
The Consultant will identify the nature of the bearing soils encountered, the availability materials of viability which are necessary for the development of the pavement and coating, and shall propose dimensioning methods to adopt. It will also conduct surveys, tests and studies, as may be necessary to identify the existing features of the road platform. The program of the geotechnical works (to be performed by the National Laboratory of Public Works) is detailed as follows.
Bearing soil Manual wells with a depth of 1.5 m every 2 km in average, considering the homogenous areas
Laboratory tests – Complete identification tests
Granulometry
Water content
Atterberg limits (LL.IP)
Sand equivalent for sand materials
Proctor – CBR
Consolidation and shearing tests for the samples from areas of compressible soils
Selected natural materials borrow pits including the evaluation of the potential in compliance with the project’s needs
Manual wells with a depth of 2m (4 sampling by borrow pit)
Laboratory tests – complete identification tests:
Granulometry
Water content
Atterberg limits (LL. IP)
Sand equivalent for the sand materials
Proctor – CBR
Sand deposits including the evaluation of the potential in compliance with the project needs Sand equivalent (4 samplings by borrow pit)
Massive rock materials including the evaluation of the potential in conformity with the project needs: Los Angeles / Micro Deval : (4 samplings by quarry)
Adhesiveness tests: 2 tests by quarry The deposits and quarries shall be accurately located on the maps at 1/ 50,000th or 1 / 20,000th and the available volumes shall be evaluated through a reconnaissance campaign. The Consultant shall ensure that the amounts listed are sufficient to meet the needs of works and that the location of borrow pits will be economically acceptable, with regards to the sites of intervention. For this purpose and based on the results, it will elaborate a materials’ use plan. The Consultant shall deliver a table listing all the known pits which are suitable to be used following the layout.
II.2.1.3 Traffic counts and surveys
The Consultant shall collect data on the traffic, analyze and complete them by counts and origin‐destination (O/D) surveys. From the collected data, the Consultant shall determine:
• Past and present traffic levels,
Prefeasibility study of the missing links of Final report Dakar – N’djamena and N’djamena ‐ Djibouti links November 2011
STUDI INTERNATIONAL page 149
• The composition and volume of the traffic by typology on the project, • Traffic ventilation by products’ repartition, origin and destination, • Vehicles’ occupation, • Forecasts of the average annual daily traffic, split into normal, derived, and induced traffic.
The traffic counting shall be made based on a period of 24 hours, and during a week. The Consultant shall define in its technical proposal the number of counting posts, the counting survey methodology, and the results’ examination appraoch.
II.2.1.4 Socio‐economic surveys
The Consultant shall also carry out socio‐economic surveys at the level of the direct influence area of the project, the objective being to assess the present socio‐economic characteristics, the potentials, and the positive effects which are to be generated by the development.
II.2.1.5 Axles weighing campaign
A campaign of vehicles weighing shall be organized on the different counting posts. during six days (except Sunday). the daily hours to be retained being from 8 h 00 to 13 h 00 then from 14 h 00 to 17 h. and that. in the 2 circulation directions (3 days by direction).
The weighing shall be carried out using a mobile balance with a sufficient scope and shall be accompanied with observations allowing establish :
‐ Axles configuration,
‐ respective weights,
‐ blowing pressures of tyres and inter‐axes dimensions,
‐ type of vehicle (trademark. model. distance covered),
‐ nature of the loading,
‐ origin and destination of the vehicle.
The results of the campaign shall be exploited in order to provide:
‐ distribution and configuration of the vehicles,
‐ load repartition by axle and total rolling weights,
‐ the overloads with regards to the axles of 8.16 tons and 13 tons,
‐ the average aggressiveness by traffic direction, including all configurations, as well as the respective average aggressiveness by configuration, and following the type of transported goods.
II.2.2 Summary technical studies
II.2.2.1 Geotechnical studies
The information gathered previously, including traffic assessment data, geotechnical data and the results of the axles weighing campaign, shall be used to define, the structure or constitution of the new pavement or of the reinforcement, and if necessary with a division by homogeneous sections. The Consultant will propose the best pavement structures which are suitable for the different platform soils, for the traffic characteristics along the project’s lifetime (20 years), considering the availability of natural materials that can be used for the pavement. To this end, the road structure options shall be presented (soft, hard, semi‐rigid, hand/inverse, ...) and compared by considering technical, economic and environmental criteria. The preliminary designs of the dimensioning shall highlight both the assumptions used for determining the pavement thickness, the origin of materials, and any useful recommendations for their implementation. Similarly, a comparison of the results obtained by conventional methods (catalogs, local standards, ...) has to be carried out over the results obtained by the computational models and methods, which are generally more reassuring. A geotechnical report will be prepared and submitted by the Consultant, separately from the technical file
Prefeasibility study of the missing links of Final report Dakar – N’djamena and N’djamena ‐ Djibouti links November 2011
STUDI INTERNATIONAL page 150
II.2.2.2 Hydrological and hydraulic studies
Based on the climate and rainfall data collected, the Consultant will start with a statistical analysis to determine the pluviometry for the different climatic zones crossed. Data from the closest weather stations will be adopted. Maps of Staff and the various cartographic materials are to be collected in order to be used for the determination and delineation of watersheds of the project. The different features are to be highlighted (area. slope. perimeter. length of thalweg. runoff coefficient ....). The sites visit will reinforce the office data office. The Consultant will present and analyze various methods for determining the flows of each type of watershed by considering the corresponding characteristics. The analysis shall enable the choice of the project flows for each category of basins after comparison of the flows resulting from each method. Once the flows of the project are known, the Consultant will conduct the hydraulic dimensioning of the longitudinal and cross structures, along with the bridges. The following frequencies will be taken into account:
• drainge and longitudinal collectors: the ten‐year flood • recovery of small and medium streams (single or multiple box culverts): 20‐year flood • crossing by bridge: centennial flood • exceptional structures: the choice of the flood is subject to the client's consent
The hydraulic design should take into consideration the conditions of the flow including the flow and speed within the constraints of erosion and soil type. The proposed works will be designed to use a maximum of standardized elements.
II.2.2.3 Road studies of the conceptual design
The first step will consist of defining the basic elements of the project design. The Consultant will mainly provide:
• the category of the road and the speed reference to be adopted by homogeneous section
• the design principles of the route (route deviations. rectification of curves. widening side ...)
• the principles of change in the longitudinal profile (enhancement. correction of ramps. improving visibility ...)
• the cross‐section standard by homogeneous type, taking into account the traffic data, the normative vehicle profile, the crossed field, ...
Based on the conceptual design surveys and the reconnaissance results, the Consultant will prepare a register topographic survey of the existing road including:
A plan at 1/5,000th mentioning :
− the existing road.
− the axis of the projected road.
− horizontal radius with the length of curbs.
− the numbering of profiles.
− the axis dimensions.
− the position of existing structures and their rapid description (dimensioning and state).
A longitudinal profile at 1/5,000 and 1/500th with :
− the numbering of the profiles.
− the dimensions at the axis of the projected road and the field.
− partial distances.
− slopes and ramps.
− position of existing structures.
The Consultant shall indicate on its register’s survey:
‐ The nature of the existing vegetation (savanna. forest. live or ancient plantations) bordering the road
‐ State of the sanitation network (ditches, water line, waterfalls, nozzles, box culverts...)
Prefeasibility study of the missing links of Final report Dakar – N’djamena and N’djamena ‐ Djibouti links November 2011
STUDI INTERNATIONAL page 151
‐ The situation and the main characteristics of the bridges and their state (length, number of lanes, nature du deck, supports...)
‐ The particularly deteriorated areas of the road, indicating the apparent causes of these degradations (failing sanitation to be heightened. strong slope for ravines...).
II.2.2.4 Conceptual design of the bridges studies
The Consultant will conduct an inventory and a detailed diagnosis of the characteristics and conditions of the existing structures (structural and functional), to provide the type of intervention to be planned (rehabilitation and reinforcement, reconstruction or doubling). Depending on the type of intervention to propose, the Consultant will proceed with the definition of the works needed in the stucture’s design, in terms of hydraulic outlet, pre‐dimensioning of the bridge structure, and foundations. Variants of structures (reinforced concrete bridges. prestressed. metal. mixed ...) are to be proposed, evaluated and compared, in order to propose the most appropriate structure’s option. The conceptual design dossier will include principle drawings for the development of structures (cross section, longitudinal section, plan view, ...).
II.2.2.5 Study of specific developments (Village crossings. crossroads. important slopes. ravines. weighing areas, toll plazas, common border crossings, retaining walls…)
The Consultant shall conduct the necessary investigations and studies to propose solutions and developments relevant to the different special points located along the layout, namely :
• crossings of agglomerations and villages • crossroads and other intersections • compressible areas and crossing of ponds • high embankment slopes and landslips • erosions and ravines • transport facilitation amenities (and possibly of multimodality) • …
Urban developments: The crossing by the road project of specific points such as villages requires the suggestion of specific arrangements adapted to the crossed zones’ conditions and to the functional needs of these areas (parking, rest areas, areas of commerce). Particular attention will be given to the security and functionality of the various solutions. Parking areas will be provided systematically in main villages and there where parking needs are identified. Other urban developments are also necessary (pedestrian crossings, stairs to the high slopes, riparian access ...). The principles and conditions of use of these facilities will be screened closely with the government and the local authorities. Transport facilitation facilities and multimodality: The facilities of transport facilitation will cover the common border points, weighing areas of heavy‐weight vehicles, heavy‐weight vehicles parking areas and possibly the toll plazas and multimodal platforms. They will include studies on site selection, establishment of a functional program, research facilities, buildings and equipment studies. They will be carried out in close collaboration with the authorities of the concerned countries. The implementation selection criteria concern the terrain, visibility, geotechnical conditions, proximity to the electricity and water networks... The functional program shall include the conditions and the free flow of traffic and access, the necessary space for parking, buildings and possibly storage sheds at the weighing stations, as well as the functionality of access and organization of buildings and offices in order to minimize the layover time. Buildings to be planned concern offices and administrations, staff accommodation in the event of removal from the site, toilets, septic tanks ... The equipment and furnishings of buildings, offices accommodations ... are planned in the project after approval of the authorities . The study will also cover the supply of electricity grids and drinking water and possible alternatives in the event of removal, such as drillings, solar energy ... Slope gullies stabilization and other particular issues: Regarding important damages such as significant sloughs, failure and slips of slope, important gullies erosion, the Consultant will prepare a detailed diagnosis of the causes of degradation and will conduct necessary topographical and geotechnical investigations allowing the suggestion of best suited solutions.
Prefeasibility study of the missing links of Final report Dakar – N’djamena and N’djamena ‐ Djibouti links November 2011
STUDI INTERNATIONAL page 152
First, it is important to determine the causes of this degradation in order to conduct their disposal. Generally the water supply and soil type are major causes of these damages. Retaining Solutions: The solutions to introduce range from a simple bank cutting angle (taking into account the angle of friction) with water collection, to a creation of more complex structures such as retaining walls (gabions, concrete, masonry, , etc ...) or major earthworks with stabilization mainly in gullies. The landscape designs will be provided mainly at intersections and villages’ crossings. The envisaged solutions use largely local materials and will highlight local specificities. The mission will be concluded through the preparation of a note relating to special arrangements with specific management plans of villages crossings, border crossings, weighing and heavy‐weight vehicles parking areas as well as special arrangements related to the stability.
II.2.2.6 Study of road safety, signaling and safety equipment
Diagnostic of road safety conditions: The technical section on road safety will begin with a diagnosis of the existing road conditions in terms of visibility, geometric characteristics, identifying the critical points that require improvement. Dangerous bends, sinuous areas, long downgrades ... will be listed to be improved. Crossings of the villages and surrounding areas, especially schools and worship places, will be identified. They represent generally critical points to be addressed specifically, as well as junctions and various intersections of which the visibility and the development configuration conditions are to be analyzed. Areas with specific aspects such as animal crossings will also be identified. The statistics of road accidents will be collected from the authorities and supplemented by surveys with residents. The causes of accidents will be identified and analyzed. Although road safety conditions of the existing ground road are completely different from future development, knowledge of existing conditions can guide the approach to the proposals of appropriate measures. Proposed measures to road safety issues: The first measure to be adopted for the project will involve the design of a road which complies with all safety rules and ensure good visibility and comfort conditions. For this purpose, the curves, sharp bends, areas with reduced visibility, long downhills ... will be redeveloped to meet current standards. This remains insufficient, requiring further development and accompanying and sensitivity measures such as awareness signs, illustrations and displays in the locations of major accidents, but also appropriate signage and adequate safety and tailback devices. Signage studies:
Road markings, traffic signs, traffic guidance equipment and security features will be determined from the final layout plans, for both the current section and Y junctions or crossings and intersections. Prior to the detailed design, there will be the definition of the basic principles in terms "what to signpost? How to signpost? With which device." At the same time, points and particular crossings (sharp bends, cities, reduced visibility ...) will be identified to be treated specifically. Particular attention will be given near the villages, intersections, schools, markets, places of worship. This step will lead to a set of principles and conditions to be applied for the use of various safety and signage devices. Studies of protection and tailback devices: The safety devices are essential equipment for any road project, but present relatively high costs. The decision to use or not a guardrail and the choice of the type to be adopted (GSR, GS2 or GS4), for a given point, must be made with flexibility. These safety devices represent typically a significant additional cost, hence the need to reflect on the systematic application of the standard or to make exceptions by being limited to the dangerous points and to the great heights of the embankments. This mission will be concluded with a road safety note summarizing all the amenities to be offered.
Prefeasibility study of the missing links of Final report Dakar – N’djamena and N’djamena ‐ Djibouti links November 2011
STUDI INTERNATIONAL page 153
II.2.2.7 Identification and location of the various existing networks
The Consultant shall verify for the identification and location of the various networks (electricity, potable water, telephone, optic fiber ...) on the works’ right‐of‐way, In addition, the Consultant shall establish if necessary all the plans and estimates corresponding to the possible relocation works or protection of such networks, working closely with the service providers in charge.
II.2.2.8 Elaboration of the bills of quantities estimates and confidential estimation of the works
The Consultant has to establish the bills of quantities of the different posts of works and quantities as well as the confidential estimation of the works. For this purpose, an analysis of the unitary prices shall be made mainly based on the last similar contracts.
II.2.3 ENVIRONMENTAL STUDY
II.2.3.1 Purpose and objectives of the impact study
The purpose of the environmental and social study is to assess the potential impacts on the environment, in order to check out how to ensure its sustainability. Specifically, it will be:
• identify positive and negative impacts of the project in the area, • analyze these impacts, • propose mitigation and / or compensation measures for the negative impacts and measures to enhance positive
impacts, • elaborate an environmental and social management plan, • establish a resettlement plan of the populations affected by the implementation of the project, • develop an environmental monitoring and surveillance program.
II.2.3.2 Project’s context and justification
The study will expose the context for the project integration and its purpose. In this regard, it will describe the present situation of the transport on the project’s corridor, explain the purpose motivating the project and present the constraints and requirements for its implementation. The presentation of the context of the project’s integration should help identify the environmental, social, economic and technical stakes, at the local, regional, national and international scales. A summary will be developed to facilitate understanding of the document. The Consultant will also define the situation from the environmental side of the road project, with the project on one hand and without the project on the other hand, to better assess the feasibility of the project.
II.2.3.3 Juridical and institutional framework of the project
In this part, the Consultant will carry out a critical analysis and present the agreements, laws, national and international regulation, along with the texts which govern the different project components and aspects from the construction up to the operation phase.
II.2.3.4 Description of the receiving environment
The purpose is to delineate and justify the area of the study, then describe the components of the delineated area. Delimitation of the study area The delineation must be sufficient to cover all planned activities including transport infrastructure. access roads to the site and residential areas neighboring to the site. This part shall include cadastral and topographic data of the land where structures will be erected for the project.
Description of the areas’ pertinent components
Prefeasibility study of the missing links of Final report Dakar – N’djamena and N’djamena ‐ Djibouti links November 2011
STUDI INTERNATIONAL page 154
The description of the biophysical environment will expose as much as possible the relationships and interactions between the different components of the environment, in order to allow delineate the ecosystems of particular interest. The inventories must reflect the social, cultural and economic values, related to the described components. In order for this to be carried out, the following issues shall be addressed: climate, air quality and odors, water quality and water resources, topography, soils, geology, hydrology, hydraulic regime of interconnection between the interior lands and rivers (floods. cross drainage), biodiversity, ecology and nature conservation including ecosystems, habitats, species of commercial importance, areas sensitive to erosion and landslides, aquatic and semi‐aquatic environments, and so on. The description of the human environment will relate the territory planning efforts and the already known projects in the area. The current and historical human heritage will be described in order to help understand the local communities, their use of various elements of the environment and their perception of the project. The description and analysis of the initial state of the project should not be limited solely to the project’s right‐of‐way, but will also extend to the materials borrow pits. The Consultant will also analyze the current state of access or tracks related to the corridor in order to provide them rehabilitation and facilitate the movement of people in riparian communities towards the main road of the project and thus facilitate also the access to social and health infrastructure then the flow of products to larger centers. Public consultations will be held with people, the authorities and all stakeholders of the project in order to understand their aspirations vis‐à‐vis the project and explain them the possible expected positive and negative impacts, with accompanying and / or mitigation measures to be implemented to reduce or offset those adverse impacts and / or improve the existing situation at lower negative impacts. The Consultant will provide the overall situation in terms of inequality between men and women, and the profile of gender in the area of influence. It will propose specific actions toward women, but also to children in the project
II.2.3.5 Determination of the development options
The purpose is to select, using discriminating parameters, the most relevant option to the project.
Selection of the option
For this selection, the Consultant shall describe, on the environmental and social levels, the advantages and disadvantages of the proposed alternatives (odentified and suggested by the technical studies) in order to feed the multi‐criteria analysis, which shall lead to the choice of the best option.
Description of the selected option
This will consist of describing the activities, developments, works and equipment provided during the various phases of the project’s implementation, as well as the temporary, permanent and related infrastructures, and facilities, the construction phase, the location for building the installation of major equipment, the activities and releases during the operational phase, and the decommissioning or abandonment of the project.
II.2.3.6 Impacts’ analysis of the retained option
It will identify and assess the impacts of various activities of the selected option on the components of the environment described above. These impacts will be determined according to the different phases of the project and will lead to propose measures to mitigate or reduce negative impacts or compensate for unavoidable residual impacts.
Impacts’ determination and evaluation
Identify the significant negative and positive impacts during the phases of development and operations, evaluate them on the basis of the methodology and analyze them in relation with their environmental and social impacts. The main impact of the selected option to be analyzed will include what follows:
‐ Disruption of the aquatic environment, ‐ Effects on soil quality, surface water and groundwater, ‐ Effects on vegetation, wildlife and their habitats, ‐ Expected changes on the quality of ambient air, ‐ change in the sound Climate of the area, ‐ Impacts on the natural and cultural heritage,
Prefeasibility study of the missing links of Final report Dakar – N’djamena and N’djamena ‐ Djibouti links November 2011
STUDI INTERNATIONAL page 155
‐ Effects on lot sizes and setbacks before buildings, changing access to buildings,destruction of existing subdivisions, the fragmentation of properties and expropriation of buildings,
‐ Loss of agricultural products, the loss of land and economic values of agricultural land, ‐ Impacts on the infrastructures of public and community services such as electrical lines
and poles, water intakes and so on, ‐ Social impacts of the entire project on population and quality of life, for example: the relocation of individuals
and activities, ‐ Nuisance caused by noise or dust during the construction period, and inconvenience to traffic during construction, ‐ Effects on the safety of motorists, cyclists and pedestrians and the major risks for customers and the
neighborhood.
The impacts’ determination and evaluation criteria will be based on the following elements :
impact intensity or magnitude, impact extent, duration of impact, frequency of impact, probability of impact, engendering effect, sensitivity or vulnerability of the component, uniqueness or rarity of the component, the value of the component for the population, formal reconnaissance of the component by a law, as menaced or protected. risk for the health, safety and welfare of the population.
II.2.3.7 Impacts’ mitigation
The study specified the actions, structures, corrections projected at the different stages of the project’s implementation, to eliminate the negative impacts associated with the selected option, or to reduce their intensity, as well as actions meant to maximize the positive impacts. The study provided an assessment of the proposed mitigation measures, as well as an estimation of their costs.
Environmental and social management plan
The environmental and social management plan should include impacts’ mitigation measures of the project’s activities, according to the following outline:
- all mitigation measures or compensation identified and agreed as part of the project, - identification and accountability of involved parties in the implementation of the environmental management plan of
the environment, - the proposed provisions for capacity reinforcement of institutions and national parties to ensure the implementation of
the Environmental Management Plan and the monitoring of its implementation, - the implementation schedule of the Environmental Management Plan, in line with the overall schedule of the project, - arrangements to ensure funding and effective implementation of the Environmental Management Plan at the different
phases of the project, - monitoring indicators for the plan’s implementation.
The environmental management plan will be summed up in a table that follows the outline proposed by the Client. In addition to these elements, the Environmental Management Plan will also include a monitoring and control program of the recommended measures and assess the estimated cost.
Environmental monitoring program
The project’s initiator must propose a program of the environmental monitoring during the impact assessment that will contain in particular:
- the list of items that require monitoring, - characteristics of the monitoring program (implementation schedule. human and financial resources allocated to the
program), - the commitments of the initiator regarding the delivery of the monitoring reports (number. frequency. content)
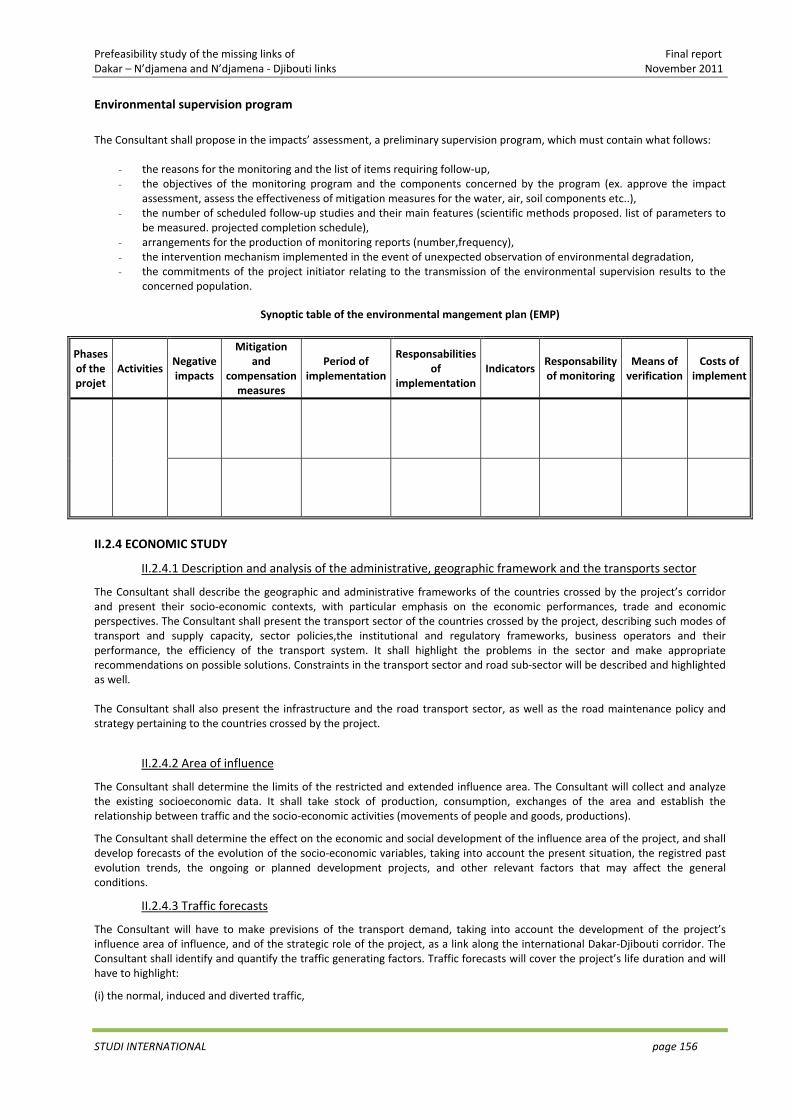
Prefeasibility study of the missing links of Final report Dakar – N’djamena and N’djamena ‐ Djibouti links November 2011
STUDI INTERNATIONAL page 156
Environmental supervision program
The Consultant shall propose in the impacts’ assessment, a preliminary supervision program, which must contain what follows:
- the reasons for the monitoring and the list of items requiring follow‐up, - the objectives of the monitoring program and the components concerned by the program (ex. approve the impact
assessment, assess the effectiveness of mitigation measures for the water, air, soil components etc..), - the number of scheduled follow‐up studies and their main features (scientific methods proposed. list of parameters to
be measured. projected completion schedule), - arrangements for the production of monitoring reports (number,frequency), - the intervention mechanism implemented in the event of unexpected observation of environmental degradation, - the commitments of the project initiator relating to the transmission of the environmental supervision results to the
concerned population.
Synoptic table of the environmental mangement plan (EMP)
Phases of the projet
Activities Negative impacts
Mitigation and
compensation measures
Period of implementation
Responsabilities of
implementationIndicators
Responsability of monitoring
Means of verification
Costs of implement
II.2.4 ECONOMIC STUDY
II.2.4.1 Description and analysis of the administrative, geographic framework and the transports sector
The Consultant shall describe the geographic and administrative frameworks of the countries crossed by the project’s corridor and present their socio‐economic contexts, with particular emphasis on the economic performances, trade and economic perspectives. The Consultant shall present the transport sector of the countries crossed by the project, describing such modes of transport and supply capacity, sector policies,the institutional and regulatory frameworks, business operators and their performance, the efficiency of the transport system. It shall highlight the problems in the sector and make appropriate recommendations on possible solutions. Constraints in the transport sector and road sub‐sector will be described and highlighted as well. The Consultant shall also present the infrastructure and the road transport sector, as well as the road maintenance policy and strategy pertaining to the countries crossed by the project.
II.2.4.2 Area of influence
The Consultant shall determine the limits of the restricted and extended influence area. The Consultant will collect and analyze the existing socioeconomic data. It shall take stock of production, consumption, exchanges of the area and establish the relationship between traffic and the socio‐economic activities (movements of people and goods, productions).
The Consultant shall determine the effect on the economic and social development of the influence area of the project, and shall develop forecasts of the evolution of the socio‐economic variables, taking into account the present situation, the registred past evolution trends, the ongoing or planned development projects, and other relevant factors that may affect the general conditions.
II.2.4.3 Traffic forecasts
The Consultant will have to make previsions of the transport demand, taking into account the development of the project’s influence area of influence, and of the strategic role of the project, as a link along the international Dakar‐Djibouti corridor. The Consultant shall identify and quantify the traffic generating factors. Traffic forecasts will cover the project’s life duration and will have to highlight:
(i) the normal, induced and diverted traffic,
Prefeasibility study of the missing links of Final report Dakar – N’djamena and N’djamena ‐ Djibouti links November 2011
STUDI INTERNATIONAL page 157
(ii) the fixed or variable growth rates during the project life (20 years) for each segment of the traffic and each vehicle category,
(iii) the distribution of volumes between the local, domestic and international traffic.
The forecasts shall be given in three growth rates (moderate, medium and high). In developing the traffic forecasts, the Consultant will have to pay particular attention to the future traffic composition and changes in the vehicles’categories, due to the amelioration of the existing roads’ state.
II.2.4.4 Maintenance costs
The different costs of the maintenance operations. adapted to the solutions given by the technical part. shall be carefully determined. and that in accordance with the Employer.
II.2.4.5 Economic analysis
The Consultant shall analyze he different alternatives envisaged using the HDM IV model. The period of analysis is fixed at 20 years. The results of the economic study will be presented in the form of tables. with the different intervention alternatives. their cost. their internal rate of return and their net present value. Sensitivity tests shall be determined in common agreement with the Employer and the non‐quantifiable advantages shall be properly commented.
The software HDM‐4 (Highway Design Maintenance) software for economic evaluation of road projects, developed by the World Bank, is a powerful assistance tool in developing and managing a road network.
This software is conditioned to meet the broader needs of road agencies, governmental institutions (Ministries, ..) and international financial organizations, through the various applications it offers, developed in order to meet a number of elements and mainly the definition and analysis of projects.
Tool for decision support, HDM IV allows the evaluation of the economic, technical, social, environmental benefits of investments in road infrastructure and guides the user to the most relevant financial choices at the main levels of the project.
At the end of this Preliminary Design APS. the consultant has to establish :
• An Conceptual design technical report comprising :
- Description of the project existing condition.
- Road and geometric study.
- Special developments.
- Hydrological and hydraulic study.
- Geotechnical study.
- Bridges design.
- Study of border points
• Bills of quantities. quantity estimates and preliminary estimation of the works
• Economic studies and traffic report
• Environmental impacts assessment studies report
• A drawings file comprising :
Road part :
- Location map
- Horizontal alignment and longitudinal profile
- Standard cross‐sections by homogenous area
- Standard drainage plans
- Signaling and devices standard plans
Bridges part :
- Standard ground plan
- Standard longitudinal section
- Standard cross section
- Plans of equipments
II.3 PHASE 3 : DETAILED PRELIMINARY DESIGN AND TENDER DOCUMENTS
Prefeasibility study of the missing links of Final report Dakar – N’djamena and N’djamena ‐ Djibouti links November 2011
STUDI INTERNATIONAL page 158
Based on the choices and orientations retained following the APS studies. the Consultant will elaborate a Detailed preliminary design of the project (APD). II.3.1 Field works
II.3.1.1 Topographic works of the Detailed Preliminary Design (APD)
• Side band survey at 1/2000th of the running section (platform. axis. ditches. embankment) over a minimum width of 80 m
• The side bands will be surveyed in the form of cross‐sections every 40 m in average and at the level of the particular points (high points. low. change of profile. flows…)
• Side band survey at 1/500th in villages and important crossroads • Side band survey at 1/1000th at the level of the layout deviations over a minimum width of 100 m • Survey of the water line of the existing hydraulic structures with indication of the direction and the characteristics of
the structure. the surveys shall extend over a minimum width of 50 m on both sides of the road • Detail survey at 1/200th in the alignment of structures • Survey of the cross‐sections of important river beds with a frequency of five profiles by river over a minimum width of
100 m • The existing networks (electricity. telephone. potable water. etc…) will be surveyed in close collaboration with the
dealers
II.3.1.2 Geotechnical works of the detailed preliminary design
During this study phase. the consultant will conduct surveys at each option of structure retained in Stage 1. The geotechnical survey is to conduct the following work:
‐ Dynamic penetrometer: in the alignment of important embankments and hydraulic structures ‐ Core drilling in the alignment of structures to be built (1 boring by pressing) ‐ pressuremeter drillings and / or Static Penetrometer (depending on the type of soil) (1 drilling by pressing) ‐ carrying out SPT tests in powdery layers ‐ Intact sample collection and carrying out laboratory tests (1 sample every 2 m in average and changes in the nature
of the basement); ‐ etc ...
The geotechnical engineering works include any supply constraints and implementation relating to core drilling including the intact sampling every two meters and with each change of materials. including packaging. transportation. .. (SPT tests every 1.50 m in the sand).
Laboratory tests on intact samples collected by core drilling
• Granulometric and sedimentometric analysis
• Atterberg limits
• Water content
• Volumic weight
• Specific weight for the grains
• CaCO3 content
• Sulfate content
• consolidation tests
• UU shearing tests
• CD shearing tests
• Box tri‐axial test
• Los Angeles (for the rocky materials)
II.3.2 Detailed Technical Designs
The Consultant will develop the detailed preliminary design before taking into account the solution adopted by the Employer on completion APS studies. Based on the results obtained and approved, the Consultant shall verify the dimensioning of structures or sanitation (bridges, culverts, box culverts, gutters, nozzled passages, ditches, etc..), of the roadways, etc. . It shall check their constitution and that of

Prefeasibility study of the missing links of Final report Dakar – N’djamena and N’djamena ‐ Djibouti links November 2011
STUDI INTERNATIONAL page 159
the recommended coating. It will adapt the topographical, geotechnical, hydrological and hydraulic works as indicated below, in order to define precisely the quality of the work to be performed.
II.3.2.1 Geotechnical studies
The Consultant shall check the roadway structure proposed in Stage 1 compared to the APD data (updated traffic, geotechnical testing, ...). In addition, it will establish the detailed plan for land movement and use of materials by considering the geotechnical soil support data and materials deposits on the one hand, and the detailed quantities of cubatures earthworks and pavement, on the other.
II.3.2.2 hydrological and hydraulic studies
The hydrological and hydraulic studies conducted in the APS phase are to be confirmed during the present APD phase by considering the new data from detailed topography, especially in regard to transversal hydraulic works and bridges. The hydraulic studies in the APD phase include the design of the longitudinal drainage system, mainly ditches. To this end, the Consultant will conduct the necessary calculations, evidencing for every elementary ditch, the flow velocity and the critical lengths to comment on the nature and dimensions of ditches (earthen or paved) and the need for expansion or creation of outlets in cases where the critical length is reached.
II.3.2.3 detailed road studies
Based on the detailed topographic surveys, the consultant shall proceed to the road study mainly considering the principles retained at the end of the APS studies (layout rectifications, modification in the longitudinal profile…) The project geometric conception shall answer the standards in force by ensuring comfort and safety conditions while considering the project financial constraints. The consultant shall optimize the layout and the longitudinal profile so to reach a compromise between the technical and economic considerations. The geometric design shall include the constraints related to the other parts of the project, such as the landform, drainage, geotechnical conditions of the soils crossed… From the collected elements, the consultant shall during the detailed preliminary design :
⎯ Define the geometric axis and alignment (plan at 1/2000th)
⎯ Define the red line. A longitudinal profile shall be established for this (1/2000th et 1/200th) as well as standard cross sections (1/100th or 1/200th)
⎯ Project changes of the deteriorated nozzles and all metal nozzles with concrete nozzles after verification of the dimensioning
⎯ Plan the necessary repairing of concrete structures in good condition (bridges, aqueduct)
⎯ Plan sufficient ditches and gutters to collect without overflow the runoff water of the platform and possibly its ancillaries. It shall be appropriate to verify by calculations the critical lengths of ditches in order to envisage the construction of transition structures
⎯ Plan the setting of safety barriers on embankment or high slope
⎯ Plan for turf and grass planting in order to protect the soil against the aggressiveness of runoff water ⎯ consider the improvement of existing intersections ⎯ provide facilities for the urban integration of the track: Access to local residents, sidewalks, off areas for trucks,
parking areas and bus taxis, covered walkways to cross the road, safety equipment to protect pedestrians, ... ⎯ provide landscaping, such as parks or other ⎯ present a study of horizontal and vertical signaling in accordance with standards ⎯ establish a particular technical estimate of earthworks, pavement and wastewater systems (nozzles, culverts) ⎯ make a detailed bill of quantity of all the works
II.3.2.4 Technical detailed studies of the structures and dimensioning of foundations
Prefeasibility study of the missing links of Final report Dakar – N’djamena and N’djamena ‐ Djibouti links November 2011
STUDI INTERNATIONAL page 160
Detailed studies of the structures will include geotechnical studies to define (i) the crossing of the obstacle, (ii) the importance of earthworks (cut or fill), (iii) foundations and (iv) the stability calculation of the structure. The geotechnical report will include:
• the result of borings,
• geological sections,
• the results of pressure tests,
• the nature and characteristics of the soils in place,
• the map of the potential rocky horizon,
• propositions on the type structure to be built,
• proposing the type of foundation.
The technical documents shall comprise:
• the general plan of the implantation at the scales of 1/500 or 1/200 (possibly 1/100th),
• the longitudinal profile at the 1/500th and 1/50th or 1/200th and 1/20th or 1/100th and 1/10th,
• the longitudinal section at 1/500th or 1/200th,
• the detailed transversal section at 1/20th or 1/50th,
• special technical provisions (CCTP),
• bill of quantities to be implemented,
• the calculation note, from the foundations until the deck,
• the complete access project,
• the infrastructure calculation note.
• An architectural study of the structure for its integration in the site (urban or landscape).
II.2.3.5 Studies of specific facilities / transport facilitation / multimodality
Based on the recommendations of the Administration at the end of the conceptual design proposals, the detailed studies of specific facilities will be conducted on the basis of topographic supports and surveys of detailed conceptual design. They concern especially the following points:
Urban developments: The developments concern the parking areas, rest areas, commercial areas.... They will be subject to specific plans at 1/500th. Pedestrian crossings, stairs for the high slopes, riparian access ... will be shown on the horizontal views and will be subject to detailed standard plans.
Arrangements of transport facilitation and multimodalities: The developments of transport facilitation will cover the common border points, heavy‐weight vehicles weighing areas, heavy‐weight vehicles parking areas and possibly the toll plazas and multimodal platforms. They will be subject to specific plans at 1/1000th.
The buildings to provide concern offices and administrations, staff accommodations in the event of removal from the site, toilets, septic tanks ... They will be subject to architectural plans and development plans for each building type.
Equipment and furnishings of buildings, offices accommodations... are planned in the project after approval of the authorities, the corresponding specifications and characteristics will be detailed.
Slope gullies stabilization and other particular issues: Regarding important damages such as significant sloughs, failure and slips of slope, important gullies erosion …. Standard plans of specific areas’ treatment will be established with specific plans for the most critical areas.
Retaining Solutions: The development of different families of slopes will be subject to standard drawings, by type of slope, height and features. Retaining structures in reinforced concrete or gabions will be subject to detail drawings for each type of retaining structure.
II.3.2.6 Study of road safety / signaling / Equipment
Prefeasibility study of the missing links of Final report Dakar – N’djamena and N’djamena ‐ Djibouti links November 2011
STUDI INTERNATIONAL page 161
Road safety measures: the first phase of the conceptual design allowed to conduct (i) diagnosis of the safety conditions of the existing road by identifying the critical areas requiring improvement, (ii) junctions, villages’crossings, schools and places of worship which generally represent the critical points to be addressed specifically, (iii) the statistics of road accidents and their causes. The provisional proposals concerned the improvements of the identified dangerous points such as sinuosity, sharp bends, and poor visibility areas, long downhill... which are to be redeveloped to meet current standards. All these visibility and geometry developments will be treated at the geometric plans of the road. Accompanying measures will address the awareness, illustrations and displays signs in the locations of major accidents, but also an appropriate signage and adequate safety devices and restraint systems Road markings This is the current section marking (edge and center lines) and the special marking (warning arrows, STOP lines, junctions marking, etc.) the conditions and zoning of application of different types will be defined. The current instructions and procedures will be used for road markings. Project drawings include detailed drawings of each road markings used, longitudinal, transversal scratching, arrows, refuge bays, etc. The detailed drawings of junctions include details of signaling and markings. Traffic signs Traffic signs, includes the installation of panels in order to facilitate traffic and make it safer, but also for users information. As part of this project, traffic signs will cover:
- triangular or circular limitation and mandatory signs, concerning the speed limit, bends, steep slopes and critical points signaling,
- rectangular informatory, place‐name signs, at the entrances and outlets of population centers, and indications of major rivers,
- directional signs located at major intersections. For the choice of location of these panels, an analysis based on the following criteria will be conducted:
- indication of the names of the rivers in terms of important bridges, - indication of entrances and outlets of all the crossed villages and towns, - indication of speed limits in homogeneous sections according to the corresponding reference speed and reminder of its
limitations, - marking of specific items such as steep turns, series of curves and reserve curves, steep slopes, overtaking and passing
forbidden and end of ban … - Installation of stop signs on the side road at all encountered intersections and junctions, - Implementation of directional signs at major intersections.
Constituting potential barriers on shoulders, they are set up without overabundance in places where their perception of distance by the user is provided day and night. Safety equipement The safety devices are essential equipment for any road project, but represent relatively high costs. The decision to use or not a guardrail and the choice of the type to be adopted (GSR, GS2 and GS4), for a given point, must be made with flexibility. The installation of the guardrail shall be done on the verge of a width of 1.0 m (including shoulder rounding). These safety devices represent generally a significant additional cost, hence the need to reflect on the systematic application of the standard or to make exceptions by being limited to the dangerous points and the great heights of the embankments. The choice rests, after an analysis of the safety conditions of the concerned item, on the main following parameters:
- Height difference between the pavement and the natural terrain, - Plane geometry of the concerned area (tangent track or radius of curvature), - Slope of the longitudinal section prior to the relevant section, - Existence or not of bridges.,
In addition to the guardrails, the project will plan the following equipment:

Prefeasibility study of the missing links of Final report Dakar – N’djamena and N’djamena ‐ Djibouti links November 2011
STUDI INTERNATIONAL page 162
- milestones to be located all the kilometers at the corresponding MP, - bends markers at the tight curves level (minimum radii, particularly dangerous curves, etc ...).
II.3.2.7 Various existing networks
The first phase of conceptual design had consisted in an identification of the existing networks in close collaboration with the concerned dealers across the project countries. The identification of these networks will be held as follows:
- surveys of apparent existing networks, - surveys by dealers for the characteristics and drawings of the networks, - detailed visits to confirm the exact position of these networks, - transfer on computer file of the identified networks’ drawings.
Once the networks are identified, it is necessary to overlay the project in terms of dealers’ networks. This will reveal the networks or parts of networks affected by the project and the need to divert or protect. The consultant will prepare a proposal for diversion and protection of various networks, which will be sent to dealers for validation and estimation of cost of diversion or protection work. The selected works will be synthesized on the drawing and attached to the Bidding Documents for consulting companies.
II.3.2.8 Resettlement Action Plan (RAP) of the population affected by the project
a) Development of the Relocation Action Plan (PAR) In the event where the chosen layout option involves the displacement of more than 200 people, a Relocation Action Plan (RAP) will be carried out. The objective of the Resettlement Action Plan (PAR) is to clearly identify all property affected by the road project and the recommended solutions in consultation with the owner (compensation, relocation, etc.). b) Socio‐economic surveys and studies These surveys will be designed, conducted and analyzed by the Consultant. Based on these investigations, contacts and conducted socio‐economic studies, the consultant will identify the affected populations and the wasted space and identify the different categories of affected people. Vulnerability criteria will be defined allowing characterizing the affected population. The aim is to detect the vulnerable population that will be displaced. Particular attention will be given to socio‐economic groups affected by the project requiring mitigation or compensation measures. The census will cover:
i) the occupants of the affected area (distinction between the existing persons prior to the decision of the project and the people who came to settle in the area affected by the change after the decision to carry out the project),
ii) the essential characteristics of the households to be moved, including a description of the types of employment and household organization, livelihoods (of income from both formal and informal economic activities) and the level of living (including health status) of the displaced population,
iii) public infrastructure and the social services affected by the project,
iv) information on vulnerable groups or persons for whom special arrangements must be made.
In addition, the Consultant will analyze land tenure systems and allocation of property rights applicable to the project as well as the social organization within the scope of the study (systems and characteristics). This census will be developed based on the components of the project, surveys of the affected population and interviews with local authorities, NGOs, etc. The Consultant will build on the impact categories identified to develop a matrix of affected assets and the magnitude of these losses (partial or total).
c) Establishment of the resettlement principles
Prefeasibility study of the missing links of Final report Dakar – N’djamena and N’djamena ‐ Djibouti links November 2011
STUDI INTERNATIONAL page 163
This is to identify the main objectives of the displacement plan and compensatory surface. These objectives will be defined in consultation with the relevant authorities. The principles of resettlement will be based on those set by the guidelines of the funder.
d) Establishment of the organizational responsibilities of resettlement Based on a participatory approach involving the affected populations, the institutional framework for the implementation of the resettlement plan will be proposed and will include:
• Identification of key actors in the resettlement process.
• Identification of the organizations responsible for the implementation of the RAP (social assessment procedures of micro‐projects for the identification of resettlement needs). The role of the decentralized territorial communities will be particularly analyzed and defined.
• The arrangements for ensuring appropriate coordination (mixed group) between the bodies involved in the implementation and the affected people.
• A flow chart of implementation of the plan will be developed by the Consultant.
e) Establishment of criteria and eligibility dates Criteria for determining eligibility for compensation and any other form of resettlement assistance will be identified according to the census carried out before and the socio‐economic characteristics of the affected population (or group), the regulatory framework of the Plan, Plan objectives, etc.. The deadline for eligibility will also be specified. f) Selection and characterization of resettlement sites Based on some criteria selection that he will develop (ability of selected sites (cultural and agricultural), cost, location, accessibility to water, to social services, to economic zones or critical natural resources for socio‐ economic activities, etc..), the Consultant will assess the potential relocation sites previously identified with the help of the concerned population and local authorities. g) Establishment of the program of the resettlement plan implementation The Consultant will propose a program of implementation of the resettlement plan. This program will contain the different steps for implementing the plan of which the development of host sites (if needed). h) Budget, financing, monitoring and evaluation of resettlement A methodology for assessing the value of the losses will be developed by type of asset allocated according to the law in force. The property inventory method and the procedure will be developed with the aim to be consistent with the affected population on the proposed compensation. A matrix of rights / due will be developed (affected people, type of loss, forms and costs of compensation). The overall cost of resettlement will be estimated. Funding sources will also be specified.
Systems for monitoring of resettlement activities will be offered (results to be evaluated, monitoring frequency, persons responsible for monitoring, etc..) as well as indicators of performance monitoring (monitoring of compensation, the results of resettlement activities, assessment of the socio ‐economic and living standards of the resettlement of population over a significant period of time following the relocation, etc.).. i) Handling of complaints procedures The terms of conflict resolution (which may arise between the affected communities or between resettlers and host communities), the claims of affected populations, grievances may come from community members dissatisfied from the eligibility criteria will be proposed.
These terms will be clear and simple providing fast and effective response on the one hand and to avoid claims outside the competence of the Plan (define complaints categories in advance).
The RAP will be developed in detail, in accordance with the policy and procedures of the World Bank and the Senegalese law in this area.
The optimization of RAP is done by:

Prefeasibility study of the missing links of Final report Dakar – N’djamena and N’djamena ‐ Djibouti links November 2011
STUDI INTERNATIONAL page 164
• The real involvement of the affected population by allowing them to participate effectively in planning and implementing resettlement programs.
• Optimizing the design of the project through which we seek to avoid or at least to minimize population displacement.
• The phasing of the preparation of resettlement plans, the payment of compensation, the population displacement on the one hand and civil engineering works so as to avoid further inconvenience to the displaced persons.
• Integration with host populations. We will strive to that the PAR will ensure not only the social acceptability of host populations but will also pay particular attention to socio‐economic elements of spatial planning (planning) that may not be perceived by the concerned communities themselves (eg provision of social infrastructure (schools, health centers, etc..) and / or economic (fountains, water tower) given the profile of populations and early population dynamics).
• Establishment of an implementation program taking into account all the elements identified in the resettlement plan, including the development of host sites when applicable.
• The establishment of mechanisms for monitoring and evaluation. For this, we define the indicators for monitoring, the results to be evaluated, the data to be collected, frequency and responsibilities of monitoring and evaluation.
The resettlement plan must be designed and implemented as a development plan. We will conduct the identification of the most relevant provisions for the provision of social services to resettled people and host communities.
The RAP will consider the cumulative impacts of activities and the indirect impacts related to changes on the natural environment in the activities of people in the project area.
To do this, in addition to formal compensation measures provided in the compensation plans, will be defined the most relevant tools allowing for agencies of work execution to improve at an acceptable cost the living conditions of people living near the project area .
The synthesis of the RAP will be presented as a summary matrix constituting the substance and the main result of all tests performed as part of the Plan.
The Consultant will consider the displacement of the weekly markets in order to reduce congestion on main roads.
The Consultant will make the inventory of markets located along the roadways. The Consultant will propose, in consultation with the client and local managers the right solutions on the technical and financial level in order to enable the development of a market that meets the basic safety rules for operators. During this phase, the consultant must establish:
• A Detailed preliminary design report comprising :
- Description of the existing road condition
- Detailed road and geometric study
- Special developments
- Detailed hydrological and hydraulic study
- Detailed geotechnical study
- Detailed preliminary design of the bridges
- Ressettlement Action Plan (RAP)
• A confidential file (in separate volume) composed :
- Detailed and summary bills of quantities
- Confidential estimates
• A drawings file comprising :
Road part:
- Location map at the scale of 1/200 000th
- Location map of the deposits and quarries at the scale 1/200 000th
- Standard Cross sections Profils en Travers Types
- The horizontal alignment and longitudinal profile at the scale 1/2000th and 1/200th
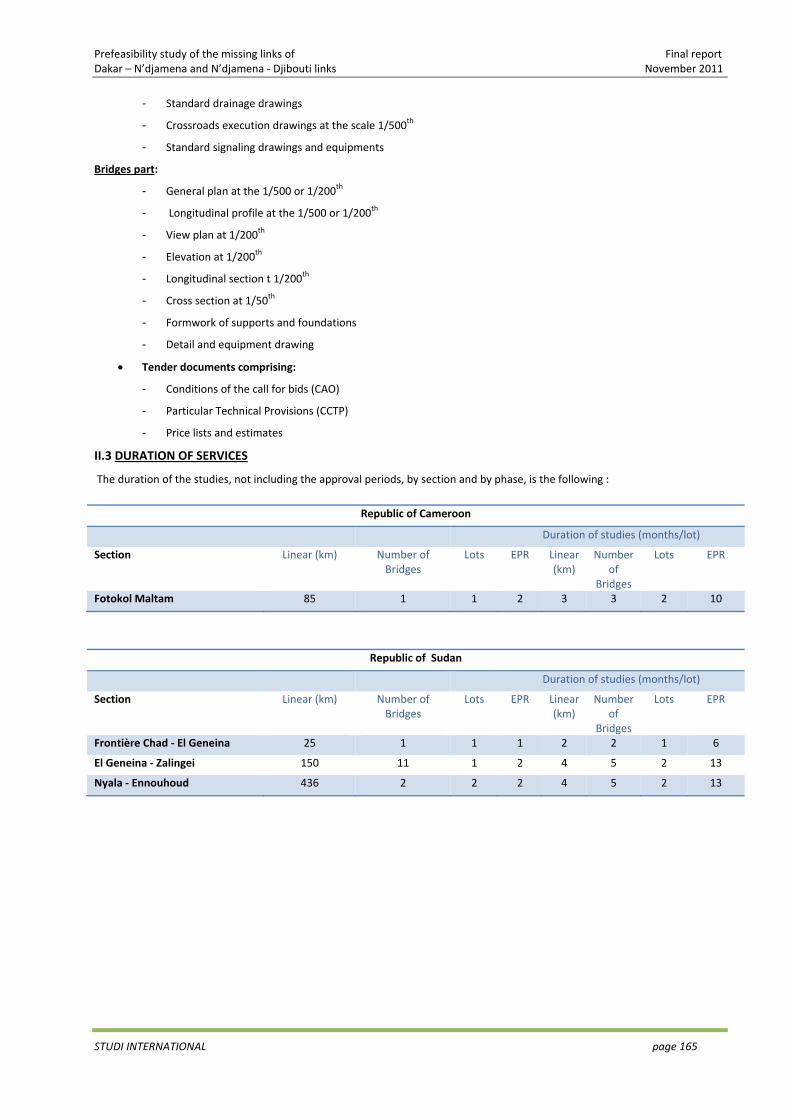
Prefeasibility study of the missing links of Final report Dakar – N’djamena and N’djamena ‐ Djibouti links November 2011
STUDI INTERNATIONAL page 165
- Standard drainage drawings
- Crossroads execution drawings at the scale 1/500th
- Standard signaling drawings and equipments
Bridges part:
- General plan at the 1/500 or 1/200th
- Longitudinal profile at the 1/500 or 1/200th
- View plan at 1/200th
- Elevation at 1/200th
- Longitudinal section t 1/200th
- Cross section at 1/50th
- Formwork of supports and foundations
- Detail and equipment drawing
• Tender documents comprising:
- Conditions of the call for bids (CAO)
- Particular Technical Provisions (CCTP)
- Price lists and estimates
II.3 DURATION OF SERVICES
The duration of the studies, not including the approval periods, by section and by phase, is the following :
Republic of Cameroon
Duration of studies (months/lot)
Section Linear (km) Number of Bridges
Lots EPR Linear (km)
Number of
Bridges
Lots EPR
Fotokol Maltam 85 1 1 2 3 3 2 10
Republic of Sudan
Duration of studies (months/lot)
Section Linear (km) Number of Bridges
Lots EPR Linear (km)
Number of
Bridges
Lots EPR
Frontière Chad ‐ El Geneina 25 1 1 1 2 2 1 6
El Geneina ‐ Zalingei 150 11 1 2 4 5 2 13
Nyala ‐ Ennouhoud 436 2 2 2 4 5 2 13
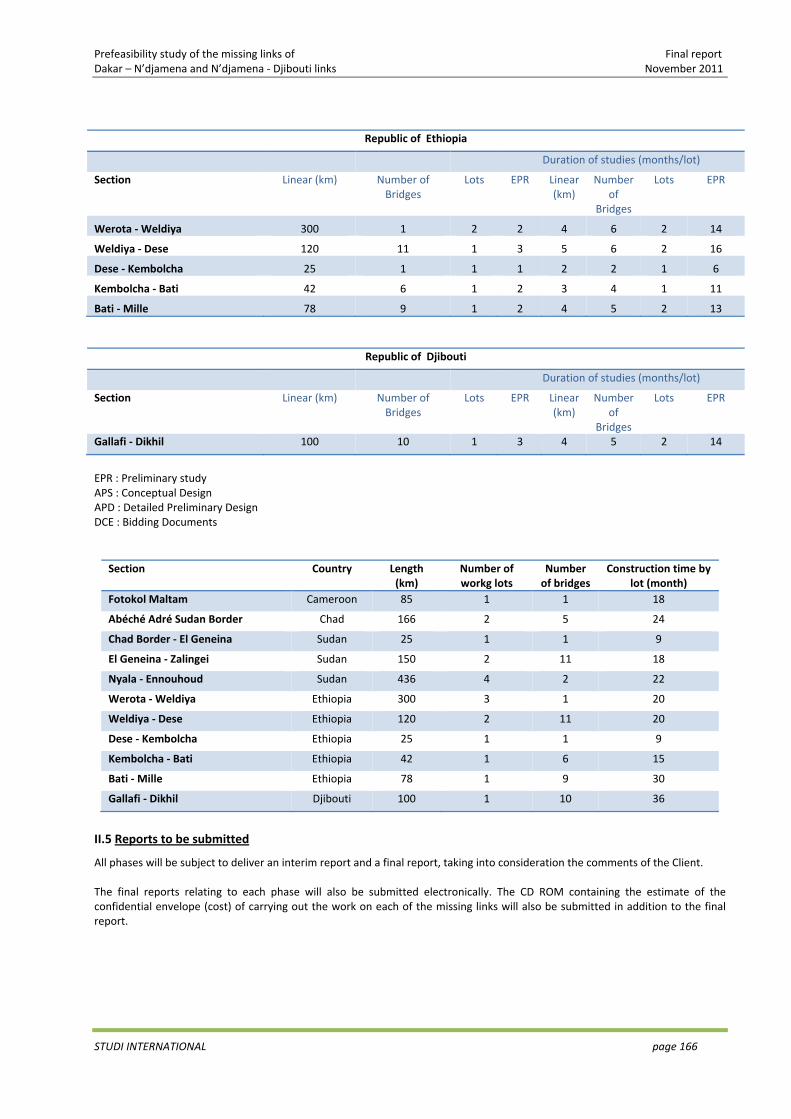
Prefeasibility study of the missing links of Final report Dakar – N’djamena and N’djamena ‐ Djibouti links November 2011
STUDI INTERNATIONAL page 166
Republic of Ethiopia
Duration of studies (months/lot)
Section Linear (km) Number of Bridges
Lots EPR Linear (km)
Number of
Bridges
Lots EPR
Werota ‐ Weldiya 300 1 2 2 4 6 2 14
Weldiya ‐ Dese 120 11 1 3 5 6 2 16
Dese ‐ Kembolcha 25 1 1 1 2 2 1 6
Kembolcha ‐ Bati 42 6 1 2 3 4 1 11
Bati ‐ Mille 78 9 1 2 4 5 2 13
Republic of Djibouti
Duration of studies (months/lot)
Section Linear (km) Number of Bridges
Lots EPR Linear (km)
Number of
Bridges
Lots EPR
Gallafi ‐ Dikhil 100 10 1 3 4 5 2 14
EPR : Preliminary study APS : Conceptual Design APD : Detailed Preliminary Design DCE : Bidding Documents
Section Country Length (km)
Number of workg lots
Number of bridges
Construction time by lot (month)
Fotokol Maltam Cameroon 85 1 1 18
Abéché Adré Sudan Border Chad 166 2 5 24
Chad Border ‐ El Geneina Sudan 25 1 1 9
El Geneina ‐ Zalingei Sudan 150 2 11 18
Nyala ‐ Ennouhoud Sudan 436 4 2 22
Werota ‐ Weldiya Ethiopia 300 3 1 20
Weldiya ‐ Dese Ethiopia 120 2 11 20
Dese ‐ Kembolcha Ethiopia 25 1 1 9
Kembolcha ‐ Bati Ethiopia 42 1 6 15
Bati ‐ Mille Ethiopia 78 1 9 30
Gallafi ‐ Dikhil Djibouti 100 1 10 36
II.5 Reports to be submitted
All phases will be subject to deliver an interim report and a final report, taking into consideration the comments of the Client. The final reports relating to each phase will also be submitted electronically. The CD ROM containing the estimate of the confidential envelope (cost) of carrying out the work on each of the missing links will also be submitted in addition to the final report.
Prefeasibility study of the missing links of Final report Dakar – N’djamena and N’djamena ‐ Djibouti links November 2011
STUDI INTERNATIONAL page 167
16.2 Railway component
The terms of reference presented in the following sections deal with the Preliminary Design of the Project APS of the construction of a lot (among the 7 recommended lots) of a railway missing link of the corridor Dakar Djibouti.
A. Objectives of the study The sectoral objective of the study is to contribute to the implementation of the program of rehabilitation and upgrading of the transport infrastructures of the African Continent, which favors the regional and continental economic integration of Africa, the development of the agricultural, mine and industrial areas crossed by the corridor Dakar Djibouti
B. Description of the study The proposed study is a study of feasibility of the construction of a railway located between …. and …., with a length of …. km. it shall be carried out in a unique phase and consists in an analysis of the technical, economic, financial, environmental, institutional feasibility and of the participation of the private sector for the construction of a new railway. It shall rely on the existing documents of the countries crossed by the future way, of the concerned regional economic communities (CER), as well as the data that the Consultant will collect by its means, in order to refine the analyses. In order to accomplish its assignment, the Consultant shall carry out the following activities :
(i) Activity 1 : Collection and critical analysis of existing documents (ii) Activity 2 : Technical studies (iii) Activity 3 : Environmental and social impacts assessments (iv) Activity 4 : Economic and financial studies (v) Activity 5 : Institutional study and participation of the private sector
C. Activity 1 : Collection and critical analysis of existing documents
C.1 searched elements
a) Required data for the reconnaissance of the project area
Documents supporting the identification and analysis of the area of direct and extended influence of the project will be collected, including:
- the latest atlas of the countries crossed by the future path and atlas / monographs by region - maps of the regions covered by the project - existing aerial photographs covering the project area
b) Required data for the technical study
the following data and information is to be collected:
General data (statistics, pluviometry…), Applicable technical standards, General policy of the transport sector in the countries crossed by the track, Geotechnical data (existing deposits and quarries, geological and geotechnical characteristics, availability of the
materials,…), Hydrological characteristics and measures on the main river flows Data relevant to the rolling material, operation costs, present remote communication and signaling system, encountered
constraints,…
c) Required data for the analysis of the reference network (network competing to the future railway)
Retrospective data of the transport demand and some explicative variables
Data about the characteristics of the various existing transport modes in the countries crossed by the way
Prefeasibility study of the missing links of Final report Dakar – N’djamena and N’djamena ‐ Djibouti links November 2011
STUDI INTERNATIONAL page 168
d) Required data for the analysis of the national, regional and international socio‐economic context of transport
The Consultant will collect the documents and data allowing an analysis of the macro‐economic context, of national and regional transport of the countries crossed by the future track, as well as the perspectives of their evolution. We mention among these documents:
Statistic yearbooks of the macro‐economic aggregates Prospective studies Population counting data Regional monographs Other documents and data relevant to the orientations of economic development regional and national
strategies relevant to the transport, agriculture, industry, mines, investment and fight against poverty
e) other data necessary for the evaluation of the financial and economic return and institutional data
The consultant also will collect data needed to evaluate the components needed to analyze the economic and financial return of the project as well as the evaluation of the institutional component, including:
tasks and unit costs of the existing rail network maintenance components needed to calculate various operating costs the rules and laws for private participation in various economic sectors, ...
f) Required data for the environmental study
The following are among the data which shall be collected from the starting of the study and which shall later help the environmental study :
statistic documents, databases, regional studies, monographs thematic maps, previous expertise in the study area reports of studies carried out in the project areas document collection from institutions likely to have information on the project areas possibly, research projects carried out in the project area
C.2 Visual Inspection The available data will be complemented by site visits to confirm the current field conditions and identify all items in the area of influence of the project. These visits will allow complete the analysis of existing documents by the visualization of the constraints of the possible corridors of the project, including:
visualization of the landform visualization and identification of public facilities identification of road networks in the project area research of the main geotechnical and geological elements to establish a proposed program of geotechnical
reconnaissance investigation of the hydrological constraints identification of towns, villages, agricultural landscape, socio‐economic/commercial important centers located in the
project area This visit will also allow decide on the initial proposals for solutions, directly on the field particularly in regard to the alternative layout, the enhancement of the red line at the level of flood plains and pond areas, the development of specific points. These preliminary proposals will be analyzed and confirmed in the subsequent studies. C.3 Examination of previous results of the counting and O/D survey campaigns the objective of this task is to examine the results of previous counting campaigns and O/D surveys over the last ten years on the reference network (road component). The results of counting campaigns and survey conducted over the last decade of the reference network will be counted, principally to:
• estimate the overall average annual daily traffic (AADT) per counting position and per year • estimate the average annual growth rate of AADT by traffic post over the last ten years • estimate the average percentage of HL by post and its average annual growth rate • synthesis of O / D matrices by post and to identify national and international traffic segments.

Prefeasibility study of the missing links of Final report Dakar – N’djamena and N’djamena ‐ Djibouti links November 2011
STUDI INTERNATIONAL page 169
C.4 Delineation of the project area of influence and transport zoning
A zoning of transport will be prepared as a result of compilation of the findings identified during the field visit, the spatial distribution of urbanization, population centers, employment centers and other social groups, which will be based on the data of atlases, aerial photographs, maps, results of the past counting and O / D survey campaigns that will better identify the area of influence of the future line. The Consultant will conduct a division of the overall area of influence of the study in homogeneous transport areas based on the following concepts:
each zone corresponds to a union of administrative entities to allow its socio‐economic characterization based on the available statistics
the zoning to be developed will be as close as possible to the zoning of the last general census of traffic or transport
plans, in order to allow the comparison of results. C.5 Identification of the locations of the counting and O/D survey campaigns
The Consultant will proceed with the location of counting stations and O/D surveys. These locations will be selected:
after examining the network topology in the project area identifying the competing routes to the future railway link and agglomerations which are likely to generate and / or
attract significant traffic keeping as much as possible the counting stations and O/D surveys selected for the previous campaigns, in order to be
able to compare the results The counting posts and O/D survey will be located on the sections draining an important traffic volume on the main axes (national and regional roads) of the reference network (road components). C.6 Hydrological and hydrogeological overview Prior to the delineation of watersheds, a field reconnaissance will be carried out allowing:
- the identification of runoff and rivers, - the understanding of geological, soil characteristics and land use of the different watersheds, - evaluation of the highest water levels (PHE) observed particularly at the level of floodlands and bridges, - maps study (1 / 50 000 th) of the hydrographic system to identify watersheds and its main characteristics, - the definition of hydrological and hydrogeological parameters to be taken into account in technical calculations.
C.7 Geological and geotechnical overview
During this activity, a preliminary assessment of geological and geotechnical conditions will be carried out in the area of influence of the project. Based on the information presented in the previous geotechnical studies, maps and observations made during field visits, the evaluation will be a general description of existing formations in the area of influence of project and a preliminary census of materials deposits. The evaluations presented in this activity will be subject to confirmation after completion of the geological and geotechnical investigations to be carried out during the subsequent activities.
D. Activity 2 : Technical studies The methodology of the second activity of technical studies comprises :
Research of the best layout corridors Conceptual design studies of the retained layout Geological and geotechnical studies Hydrological and hydraulic studies The designs of structures, river crossings, viaducts, tunnels…. Architectural studies of buildings, stations, warehouses… Rolling stocks studies Telecommunication and management studies Operation and maintenance studies
Prefeasibility study of the missing links of Final report Dakar – N’djamena and N’djamena ‐ Djibouti links November 2011
STUDI INTERNATIONAL page 170
D.1 Finding the optimal layout The proposed approach for determining the optimal route of the future railway line passes through three main phases:
- Determination of the railway line corridor which has the "least constraints" in the area of influence of the project, - Production of digital topographic database of "best" route corridor with least constraint identified during the first
phase, - Sketch of the optimal plot(s) of the railway line.
The term ‘optimal’ encloses a number of technical, economic and environmental considerations permitting a classification of plot options in order of merit in order to find the best plot to meet these considerations. This goes through several stages of document preparation, materials to guide and direct the selection of corridors. These include maps, satellite images, aerial photographs, the return to 1/20.000 th and physical, environmental and soil occupation data. Four steps punctuate the completion of this phase:
- Knowledge of the initial context - Analysis of constraints by environment - Synthesis and prioritization of constraints - Determination of (the) corridor (s) plot of "least constraint"
D.2 APS studies of the selected option
a) Definition of the basic design criteria
Prior to the geometric design, we shall present a clear definition of design criteria for the various elements of the railway. These include the following:
- Arming the track and ballast
- Turnouts
- Characteristics of horizontal alignment
- Inter‐axes of tracks
- Characteristics of longitudinal profile
- Rail gauge of structures
These criteria and standards are to be presented to the Client for approval before they are considered for further study.
b) layout design
The first step in selecting the optimal layout principles:
- analysis of the general principles for design and reference standards to be applied to the sections of the layout,
- definition of geometric and functional criteria to be applied to the layout to meet all required standards,
‐ identification of the factors that influence the course including the high ravines and high embankments, rock cuttings, wetlands, buildings and village crossings, geotechnical conditions, environmental, structures, drainage, ..
Once the basics set, the horizontal axis will be designed based on photogrammetric restitution at 1 / 20 000th. The consultant will use the computer resources at its disposal, mainly the linear infrastructures design software. Geometric construction will be carried out directly on the 3 Dimensions restitution files (X, Y and Z files) on which all the soil occupation data will be displayed.
The optimization of the longitudinal profile will be based on the obtained cubatures. Thus, the quantities of cut and fill will be optimized in order to balance them and reduce the amount of borrow fill and transport distances. Several passages are required to obtain a layout which is best optimized with respect to field conditions.
The standard cross sections of the different homogenous sections will then be defined. The definition of the implementation of cross‐sections will take into consideration the types of retaining walls, slopes and embankments, the steps to be planned, ditches and concrete gutters, ...
Prefeasibility study of the missing links of Final report Dakar – N’djamena and N’djamena ‐ Djibouti links November 2011
STUDI INTERNATIONAL page 171
c) Platform design
Once the line’s axis is finalized, the Consultant will undertake the design of the railway line platform. The conformation of the cut and fill will consider the findings and recommendations of the geotechnical study. The earthworks of the railway will be designed according to the criteria of the project, taking into account the sources of materials, transport distances and the stability of the finished product. In places where the carrying capacity of the soil, slope stability or habitations are a concern, the geotechnical engineer will participate directly in the design of the embankment and auxiliary works.
Based on the geotechnical criteria and design standards, the design team will make cross sections covering all situations. These cross sections will be applied to the new layouts and to the basic topography in order to define the proposed cut and fill volumes. Once these volumes established, earthworks cubature will be calculated. The design team will consider problems such as transport distances and cut and fill. Where appropriate, track layout revisions will be proposed to reduce project costs. When the stability of the embankment is placed, the team will design a special drainage system or other remedial actions.
d) Design of the lanes superstructure
The design of the superstructure of the road will mainly consist in two tasks:
‐ The design and specification of structural elements and dimensions of the roadway,
‐ Detail of the layout of the lanes, such as link curves, road slope and the geometry of connections.
The design of the lanes superstructure will be compatible with the standards retained by the Client. It will include the selection of rail, traverses, fasteners, connection components and ballasts, as well as the essential dimensions of the tracks and the installation of connections.
e) Tracks design and disposition (connection and deposit tracks)
The Consultant will organize the disposition of tracks in stations, terminals, and various areas of maintenance and storage especially in the main terminals. These provisions will be based on operational requirements. The avoidance loops will be long enough to integrate the longest trains provided by the operation study. Warehouses and terminals will have enough channels to allow maneuvering of cars and storage of unused rolling stock. The disposition of warehouses will also provide access to the rolling stock maintenance facilities.
f) Reestablishment of communications
in the study of reestablishment of existing roads (roads), special attention will be paid to the type and extent of the intersected track, in particular the characteristics of its cross section. The longitudinal profile of the recoveries should follow as much as possible the existing platform, whenever possible and appropriate.
Apart from the possible level crossings, restoration works are of the following types: overpass (PS), subway (PI), pedestrian (PP) and agricultural passage (PA). This choice will be based on the implantation conditions of tracks and the type of recovery. Standard development plans are subsequently provided. D.3 Geological and geotechnical data
a) Geological studies
The geological approach is of paramount importance for the layout selection and arrangements for all technical and geotechnical studies.
This study will be based on geological maps at the scale of 1/50,000 or 1/100,000 th and on a geological reconnaissance of ground, covering both the current section that the particular passages. It will present a geological profile of the corridor selected and guide decisions when choosing between different alternatives.
Special studies will deal with the track’s critical points including bridges, large embankments and tunnels which geological land data will be established. Similarly, the search for backfill and massive rock quarries will be based on the recommendations of the geological studies that will guide the decision‐maker in the search areas of these materials
b) Consistency of the campaign
The geotechnical campaign to be carried out will mainly consist in carrying out the following tests and borings :
‐ For the railway platform: Sampling following the equidistance from the homogenous sections of the field Corresponding identificqtion tests (Proctor, CBR, Granulometry, atterberg limits, water content, specific weight,
shearing and compressibility tests in the case of compressible soils,…) ;
Prefeasibility study of the missing links of Final report Dakar – N’djamena and N’djamena ‐ Djibouti links November 2011
STUDI INTERNATIONAL page 172
‐ For the particular banks: Manual wells with samplings and laboratory tests;
‐ For the quarries and materials borrow pits (with a minimum of 3 samplings by quarry): Massive rock quarries (ballast) and aggregates ‐ Los Angeles tests ‐ Micro‐deval tests Materials deposits for fills and lateritic materials. ‐ sampling ‐ proctor – CBR tests ‐ identification tests: complete granulometric analysis, Atterberg limits (LL, IP), dry density, etc…
‐ for the bridges and particular passages (tunnels, compressible soils…): Static (or dynamic) penetration tests Core drilling and interpretation tests on intact samples.
The borings for the structures and particular passages will be carried out in second phase depending on the options retained for each structures.
c) Geotechnical studies
Based on the results of the geotechnical survey, geotechnical studies will allow the following conclusions about:
• The size of railway platform
• The source of fill material and platform to use with a list of the deposits by location, characteristics and quantities of materials available,
• An inventory of massive rock quarries available indicating the potential of each quarry, material characteristics and possibilities of their use (ballast, aggregates for concrete ...)
• The preliminary dimensioning of the foundations of structures and characteristics of the soils depth,
• The geotechnical summary studies for crossing areas of compressible soils by providing provisions and measures,
• The geotechnical summary studies at the level of high embankments by providing solutions to stabilize them (slopes, off‐sets ...)
• The geotechnical summary studies at level of the potential tunnels by studying their feasibility and measures to be considered.
D.4 Hydrological and hydraulic studies
This study aims to review and define the parameters characterizing the hydrologic and hydraulic parameters affecting the area affected by the route chosen and that will be used for the design of bridges, viaducts and works relating to hydraulic transversal and longitudinal hydraulic structures. The study will be performed with particular care, given that the correct dimensioning of hydraulic structures affects the duration of the project.
Based on the existing data, hydrological analysis will be conducted according to the following different phases:
• collection of rainfall data,
• Statistical analysis of hydrological data on the rivers crossed by the railway line,
• determination of extensions and geomorphological features of the watershed through which the future railway line passes,
• analysis of calculation methods and the hydrological conditions of their application according to the characteristics of watersheds,
• establishment of the design flow rate to be adopted for checking the design of various hydraulic,
• development of a probabilistic model of available hydrometric data available
• for hydraulic structures with major dimensions and for which hydrometric data are not available, we shall use a mathematical model rainfall‐runoff, which, based on geomorphological characteristics of the basins, allows determine the project hydrogaph through the unit hydrograph method.
Based on the results of the hydrological study, hydraulic analysis will be developed through the verification of flow conditions performed on longitudinal and transverse drainage structures.
Prefeasibility study of the missing links of Final report Dakar – N’djamena and N’djamena ‐ Djibouti links November 2011
STUDI INTERNATIONAL page 173
The results will be synthesized in tabular form in which the geometric characteristics of hydraulic structures will be indicated (size, length, slope, etc. ..) and the hydraulic characteristics (flow, depth of water upstream, speed, etc.) .
The verification of bridges will be carried out by calculating the profile of back flows (constant motion) due to the bed reduction caused by the presence of the structure. It will determine the free height, the need for protection works upstream and downstream of the structure due to the scour generated and, after the calculation of the erosion depth; the necessary works for the protection of foundations will be defined.
D.5 Studies of structures The choice of the type of structure to be planned will consider the recommendations and standards recognized in the field. The applicable economic conditions of the various known structures, metal structures, reinforced concrete, prestressed concrete or mixed structure, will be considered.
In parallel, the reflection will consider the full scope of the work, the number of supports in the water which is to be minimize ...
Based on the recommendations and advice to the Owner, the Consultant will conduct the pre‐dimensioning of various structures. It will ensure as uniform as possible the characteristics of structures (span, types, number of spans, etc. ..) to facilitate the execution of works. The various components of the structure will be dimensioned (foundations, abutments and piers, trimmer, deck, beams, equipment, special provisions, etc ...). D.6 Sites research for stations, architectural and technical studies The search for sites for stations will be conducted in conformity with the development plans of the crossed agglomerations. Depending on traffic flows measured by economic studies, the Consultant will elaborate the sketches at scales compatible with the study (during the APS) of buildings, docks, parks, shops, warehouses and other facilities necessary to support rail operations. The studies will be prepared in sufficient detail to estimate the construction costs.
The Consultant will recommend in particular a uniform method for documenting unit costs, estimates of quantity and cost calculations. Cost estimates will be compiled by field of design, broken down by activity groups and summarized in order to be included in the technical design report.
The activity will be concluded with the provision of technical and design documentation as follows:
‐ model of the General Plan of the structures of the proposed buildings
‐ Preliminary designs for the stations of large, medium and small size
‐ Technical descriptions of the facilities
‐ Detailed list of capacities for different types of design
‐ Estimated price of the structures
D.7 Rolling stock studies
a) Analysis of the logistic chain
From the data collected, an analysis will be conducted on the transport chain which will be based in part on transport flows and also on the relations to be created between different modes of transport (mainly road and rail) to minimize costs and improve the couple (reliability / speed). This analysis will determine in particular the different operations to be performed (loading, transport, transshipment, unloading, storage ...) and make proposals for transportation plans. It will also identify important areas and towns located near the corridor and which are to be served. In this section, the areas to be created for storage, maintenance, and for a set of ancillary services relating to operation of logistics services such as oil products distribution, food products storage facilities, for example, activities of consolidation / deconsolidation ... maintenance activities will be determined. The analysis of the logistic chain shall develop in particular the aspects related to the expected performance and means of managing the interfaces between transport modes and between countries allowing optimal use of resources to implement, as only a close coordination between the different operators ( shippers, carriers, authorities, area managers, ...) will ensure the smooth flow of transport and the implementation and observance of time and length of passenger and goods transport.
Prefeasibility study of the missing links of Final report Dakar – N’djamena and N’djamena ‐ Djibouti links November 2011
STUDI INTERNATIONAL page 174
b) Technical studies
Depending on traffic forecasts, the Consultant will determine the characteristics of the necessary rolling stock. It will also evaluate the policies of maintenance, rehabilitation and modernization of existing railways companies. Based on the information collected, the types and costs of rehabilitations which are necessary to harmonize the level of service with the existing rail network will be estimated. Control operations, visit of trains, maintenance, repair and revision of rolling stock and their place will be defined. The Consultant will determine the maintenance methods for each type of equipment, installations, depots and workshops necessary facilities and equipment, staffing and staff training needed for maintenance of rolling stock.
c) necessary investments and operation costs
Will primarily be estimated:
‐ the necessary investment in rolling stock, ‐ the necessary investment in installation: containerization area, logistics platform, ..
An estimate of operating costs of rail transport including: the costs of energy consumption, training costs, salaries for drivers, maintenance, station operations, maneuvers of trains, container handling costs , terminal costs ... will be conducted. D.8 Signaling designs
The consultant will begin with an analysis of the existing signaling system on the corridor Djibouti Dakar, and the various alternatives such as support for the main signaling system. Will be particularly examined the design criteria associated with the most important signaling system to be implement, the aim being to ensure the best compatibility between different sections of the corridor, a maximum interoperability between different systems of circulation, but also the necessary rehabilitation of the current line if necessary, thus harmonizing the level of service throughout the future corridor. In this context, will be particularly analyzed the systems available on the market, indicating the advantages and disadvantages of each, considering aspects such as: ‐ The operating principle ‐ Technical services ‐ The level of implementation ‐ Business suppliers and after‐sales technical assistance ‐ Price The approach will be, however, be conducted while avoiding as far as possible references to manufacturers of systems and taking into account primarily the design of systems. For each of these systems, the basic architecture will be presented, along with all the data to choose a system which design and performance best fits their needs, on which basis later studies will be developed. The signaling system core and protection of the train will be composed of interlocking elements and their channel partners, the train protection systems and the interfaces between the two. Indeed these systems cooperate with each other, with the aim to ensure safe movement of trains and efficient operation of the line. The signaling study will consider the facilities and elements collected in the field pattern of channels and program operation of the line. In the paths between two specific points, such as stations and deposit lanes, intermediate signals will be provided. D.9 Telecommunication studies The telecommunication study will lead to the elaboration of the following documents:
- Program of the new telecommunication facilities - Typical diagram of the relationship of telecommunication with the existing facilities - Definition of the adopted technologies and explicative notes - Brief estimation
Prefeasibility study of the missing links of Final report Dakar – N’djamena and N’djamena ‐ Djibouti links November 2011
STUDI INTERNATIONAL page 175
In order to study the telecommunication demands, the required services are mainly the following :
‐ management telephony. Automatic telephony in stations ‐ Security telephony. Omnibus and regulation telephony ‐ train‐land radiotelephony ‐ transmission system ‐ Information to users ‐ Video monitoring ‐ Fire and intrusion detection ‐ radio‐communication system
D.10 Operation studies The general criteria of the railway operation are divided in two parts :
- Maintenance part - Operation part
These criteria form the base for the elaboration of a maintenance plan and an operation plan of the future line.
a) Maintenance plan
The objective of the maintenance plan is the conservation of the infrastructure and superstructure of the future line (set of structures, systems, facilities and equipment) in optimal conditions and operating status during their life cycle, so to meet the requirements for quality and service. The basic principles which should be developed through proper procedures are:
‐ Achieve a high degree of system security: customers, employees, property and environment
‐ Achieve a high degree of service availability and component systems and facilities
‐ Keep an image in accordance with the quality characteristics of the system
‐ Get the quality standards established by minimizing operating costs.
In addition and regarding the people performing the maintenance:
‐ consider the safety and health of workers as fundamental conditions in the performance of work that are relevant of the maintenance plan,
‐ ensure better working environment between workers of the maintenance personnel.
User safety is the most important aspect in all railway operations. This is why maintenance should pay special attention to all the systems involved in it, by applying the procedures and adopting all necessary measures to guarantee it.
b) operation Plan
the following themes will be considered by the Consultant, in order to ensure qn optimal operation of the railway line :
• Organization of the Control Post • Operation posts in the control post • Line inspectors • Conductors • Security • Itinerary book • Optimum management of the rolling stock and equipment • Traffic regulation • Traffic signals regulation • Control of and resolution of damages from the Control post
Prefeasibility study of the missing links of Final report Dakar – N’djamena and N’djamena ‐ Djibouti links November 2011
STUDI INTERNATIONAL page 176
E. Activity 3 : Environmental and social impacts assessment E.1 Generalities / Basic data In this first section, basic data will be established, allowing put the environmental and social impacts study in its original context :
• General introduction: preamble, project context, background, study progress, conclusions of previous studies, • Objectives of the project, • Geographic situation of the project area, • Regulatory framework, • identification of interveners : Employer, fund provider, consulting firm, etc, • delineation of the study perimeter. • Temporal horizon of the study • Justification of the project
E.2 Analysis of the initial state of the environment The purpose of this section is to analyze the initial state of the project site (or more precisely the perimeter of the study) and its natural, socio‐economic and human environment mainly focusing on the natural and human resources which may be affected by the project. This phase, which is the basis of the impacts previsions, shall help define the key descriptors of the environment such as analysis of environments and landscapes, which shall include not only a description of their current state, but also an assessment of their potential and their sensitivities considering their initial state and their own dynamics. The choice of environment descriptors to remember will require in particular good knowledge of the general characteristics of these environments, the functions they provide and their sensitivity to anthropic actions. The detailed analysis of the initial state of the environment within the scope of the study will focus on the most vulnerable communities of the human and natural environment as well as the wealth to be protected: agricultural, forest, water, hydraulic, leisure, housing, culture spaces, etc.. This analysis will be conducted in two stages:
(i) Collection and critical analysis of the data: in the first stage, the Consultant will collect basic data on the perimeter of the study. This task will be based on the site visit in order to identify relevant data and describe the initial state of the environment. This visit will be complemented by the collection and consultation of all documents that may contribute to the enrichment of the study, such as literature, government statistics, thematic maps, etc.
(ii) Analysis of sensitivities: The Consultant will carefully assess the vulnerability of the environment and natural resources, particularly with respect to the expected development of railway traffic. This analysis will be illustrated by maps of sensitivity.
The analysis of the initial state shall be made separately for the natural environment and the socio‐economic environment :
a) Characterization of the human and socio‐economic environment: This part is reserved to the descriptors of the human and socio‐economic environment and shall include :
• Soil occupation, • Urbanism and territory planning regulations, • Inventory of areas of servitudes and existing and projected public facilities in the study perimeter, • Demographic data, • Socio‐economic situation: economic activities (agriculture, industry, mines, tourism, services), formal income housing
structure and life conditions (life quality and mode) level of equipment in basic infrastructures (roads, different networks, transport, etc.), public health (main causes of diseases, public health centers), etc.
• socio‐cultural: customary organization of villages located within the perimeter of the study, cultural activities and tourism, cultural and archaeological sites, monuments classified or listed, practices and traditional cult places, etc..
• present and foreseeable state of human perception: Current status of air pollution, current levels of noise and vibration, landscape and visual aspects.
• current oratics of natural resources exploitation: collection of wood for energy production or construction, gathering, hunting, etc..
Prefeasibility study of the missing links of Final report Dakar – N’djamena and N’djamena ‐ Djibouti links November 2011
STUDI INTERNATIONAL page 177
b) Characterization of the natural environment: This part concerns the descriptors of the natural environment and includes the physical and biological elements. E.3 Project description In this chapter, the key project data, useful for understanding it are summed up. To this end, a summary of the technical studies will be conducted to highlight the main elements of the project which may have environmental impacts. We will develop the following sub‐chapters: Project context, Project description, Construction phase The information necessary and relevant to an understanding of the project and for identifying potential impacts on the environment will be extracted from the technical files of the study, summarized and presented in the EIS in a more simple and more easily comprehensible way for the reader and evaluator of the environmental and social impacts study. E.4 Identification and evaluation of the project possible impacts After an exhaustive analysis of the initial state of the environment and the description of the main elements of the project, the Consultant shall identify the potential impacts based on scientific methods, objective, practical and reproducible. This chapter which constitutes the central phase of the environmental impacts study, is the result of the matricial superposition of the project components and of the environmental components. It will analyze the previsible direct and indirect consequences of the project on the environment in both its human and natural components. We will distinguish separately the potential impacts in the construction and operation phases of the railway line. The consultant will then quantify and evaluate their consequence on the environment (social and natural) in the light of the standards in force. The various impacts identified will be prioritized and presented as an interaction matrix clearly showing the quality of the impact (positive or negative), its importance, its probability of occurrence, its apparition time and duration, and its reversibility. E.5 Support measures We shall distinguish separately measures minimizing the nuisances of the construction phase and those of the operation phase of the project. These measures should in particular allow:
- integrate the proposed development in the natural and artificial landscape - limit the inconveniences caused to local residents both during the construction phase and during the operational phase, - protect human security in both the normal use conditions of the new railway line and in the event of storms or other
particular circumstances, - improve the life conditions and social welfare of local population, - limit the risks of natural resources deterioration (waste management, wastewater and storm water, etc.). and protect
the biodiversity in the area. For the construction phase as in the operation phase, particular emphasis will be given to measures allowing safeguard the interests of local populations, the protection and sustainable management of forest ecosystems (flora and fauna), protection of agricultural areas, protection against soil erosion risks (including losses of vegetal cover), and pollution and the protection of water resources from all deterioration sources. As for impacts, the recommended measures will be prioritized in terms of priority and urgency. E.6 Resettlement Action Plans (RAP) The Resettlement Action Plans (RAP) elaborated for the project axis will be in conformity with the procedures of the countries crossed by the future railway track, mainly the legal, institutional and political context of compensation and rehabilitation, consultation procedures, complaints management system, etc., while integrating the possible data relevant to one or several sections of the project (impacts, specific compensation and rehabilitation measures).
Prefeasibility study of the missing links of Final report Dakar – N’djamena and N’djamena ‐ Djibouti links November 2011
STUDI INTERNATIONAL page 178
E.7 Summary and social and environmental report This chapter shall deal with the conclusions of the social and environmental impacts study and :
• highlight the project advantages, its consequences and the major environment risks, • demonstrate the efficiency on the long term of the proposed measures.
F. Activity 4 : Financial and economic studies
F.1 Economic studies The main purpose of this section is the analysis of past evolution trends and the projection of the explanatory variables related to the request in order to allow the estimation of the projected traffic.
a) Analysis of the socio‐economic context and projection of the main macro‐economic aggregates
The Consultant shall prepare the macroeconomic framework of the countries included in the area of influence of the project, involving an analysis of the trends of the main economic indicators over the past two five‐year terms:
• population growth, • GDP and GDP per capita and their repartition between productive sectors, • growth of investments by sector and particularly in the transport sector, • consumption growth, • growth of exports / imports • evolution of the vehicles carriage stock and motorization rate by region / area ...
This analysis will be accompanied by an analysis of the development of production sectors (primary, secondary and tertiary) and the evolution of each sector in terms of production volume and added sectoral value. The Consultant will also analyze the different prospective studies and the development prospects of the various productive sectors, including transport sector, which will later lead to the identification of the different traffic projection scenarios. The foreign trade of the countries crossed by the future track with the bordering countries, the rest of the world as well as their progression will be largely examined, considering the future vocation of the new railway line, as an international and trade connecting link.
b) Analysis of the socio‐economic context on the area of influence of the project qnd projection of the main indicators
The area of influence of the new railway line depends on a number of factors that influence the future development of traffic, especially the road network topology, which is the main competitor to the new line, the structure and spatial distribution of urban and rural populations, their life conditions (income, motorization rates, travel purposes), the nature of economic and social activities. The difficulties impeding the mobility in the area will be identified in particular. The diagnosis of the present and provisional socio‐economic situation of the area of influence of the project will be therefore mainly based on the collection, maintenance and analysis of a series of demographic, socio‐economic, and territory planning data which shall be drawn from statistical yearbooks, atlases and monography as well as any previous study in relation to the productive or transport sectors in the area. To develop traffic forecasts, the Consultant will carry out projections of different socio‐economic and demographic indicators for the horizons of the study (the ultimate horizon is 30 years with 5 years projections), at the level of the area of influence, based on the various retrospective and prospective documents available.
c) Traffic study
the future traffic drained by the new railway line will be mainly composed of two segments :
- a traffic deviated at the expense of competing transport modes (maritime or road) which shall be called reference network,
- an induced traffic resulting from the new development following the decrease in transportation general costs.
Prefeasibility study of the missing links of Final report Dakar – N’djamena and N’djamena ‐ Djibouti links November 2011
STUDI INTERNATIONAL page 179
c.1) Retrospective analysis of the traffic on the reference network The purpose of this analysis is to assess the traffic progress tendency recorded on the reference network likely to be in competition with the future railway line. b) Projections of traffic on the reference network The purpose of this section is estimating the projected traffic on the reference network by study horizon. The reference network is the network covering the direct and extended area of influence of the project and future competitor to the railway line. The Consultant shall explain in its methodology the approach used to assess the demand for transport, including international, on the reference network. To estimate growth rates, three planning hypotheses will be considered:
a high hypothesis (optimistic) an average hypothesis (trend) a weak hypothesis (pessimistic)
c) Traffic previsions on the new line The future traffic which shall be drained by the new railway is mainly composed of :
- a deviated traffic at the expense of the reference network, - an induced traffic resulting from the new development following the decrease in transport costs.
The Consultant shall explain in its approach the calculation model and the hypotheses retained for the transfer of the demand on the reference network and the new railway line. Being an integral part of an international and national connection, the servicing of the new railway line shall generate an induced traffic, consequence of the advantages relating to improving access to the regions crossed by the new railway line, but also to its impact on the socio‐economic development and the commercialization of agricultural, mine and industrial products, at the regional and international scales. In its approach, the Consultant will clarify the calculation model and the assumptions used for the allocation of demand in the reference network and the new railway line. As part of a binding interest in both national and international commissioning of the new rail line will generate an induced traffic as a result of the benefits of opening up the regions crossed by the new railway, but also its impact on the socio‐economic development and marketing of agricultural, industrial, mining, ... on a regional and international. The Consultant will assess transport demand induced, depending on the prospects for economic development included in the strategies and trends of countries included in the project area of influence.
d) Rolling stock prevision Based on the demand estimation, the Consultant shall determine the number of trains to circulate on the different horizons and the success keys of the project.
e) Economic evaluation
a) Preamble The assessment of the economic feasibility of the development shall be based on a comparative analysis between two situations: situation "with project" which involves the completion of the railway line and situation "without project" where it is assumed that the operation of transport routes is similar to that which currently exists, that is to say that the service level of the alternative "reference network" is frozen at its current state. The economic evaluation will be made from the perspective of the community by the updated balance method that will consist in the comparison of benefits and costs spread over time, which implies the use of a discount rate, concept elaborated by analogy with the interest rate and representing the present time preference.
Prefeasibility study of the missing links of Final report Dakar – N’djamena and N’djamena ‐ Djibouti links November 2011
STUDI INTERNATIONAL page 180
b) Baseline situation or "without project" In the baseline situation or "without project", the prevision of commercial traffic can be performed using the same methodology used for commercial traffic with the project, without considering the traffic generated by the new railway platform and considering the evolution rates by traffic segment comparable to the current situation which will gradually decrease over time, as a result of any reduction in the service quality.
c) Situation "with project" The « direct » cost/advantages analysis of the situation « with » project shall be conducted based on the investment plan data, by operating the economic transformation of the financial data of the project and that trying each time to eliminate price “distortions” on the prices when they do not correspond to the “market prices”.
d) Assessment of return indicators
The Consultant will analyze the various alternatives considered. The period of analysis is 30 years. The results of the economic study will be presented in tables, with the different alternatives of action, their cost, internal rate of return and net present value. Sensitivity tests should be elaborated in agreement with the Client and non‐quantifiable benefits shall be properly commented.
F.2 Financial studies The financial analysis is a key point in the study of the new railway platform by explaining the factors which allow judging the consistency of all technical, economic and financial decisions. It is considered from the perspective of the Contractor (as opposed to the economic study where the calculations are considered in terms of community) in the event that the new railway line will have an autonomous commercial management and will aim at a margin to return the invested capital. Compared to the economic assessment approach, investment costs, operation costs and expenses and other income generated by the management of new development should be increased by taxes and other, unless the project will benefit in the future profit from tax exemption. Indirect taxes, mainly VAT, are fixed on the basis of the law in force. However, options can be planned for the total or partial VAT exemption of the project. Included in financial calculations, amortization depends on the duration of immobilization and should serve to ensure current maintenance and renewals related to wear and / obsolescence. The necessary appropriations to cover major repairs for the infrastructure components subject to particular wear effects are also included in the evaluation Financial expenses arise from the project financing, the result of Need Working Capital (BFR), the capital injection and the use of credit financing. The BFR Working capital is the difference between current assets and current liabilities and is estimated on the basis of ratios of achievement of revenues and expenses and assumptions about the payment terms. Financial charges are therefore defined from the credit (s), interest rates, the repayment period, the presence or absence of a grace period, the cost of insurance required and commission costs. These elements are related to the nature / origin of the credit, such as Development Bank or Agency, Development Fund, supplier credits, etc.. The main operation products shall come from passenger and freight revenues. From the above, the Consultant will prepare a financial statement on the establishment of the new railway line, will assess the financial internal rate of return (FIRR) and the possibilities of the project to ensure debt service. The Consultant will also develop a provisional operation account over thirty years, for the various demand scenarios considered.
G. Activity 5 : Institutional studies and participation of the private sector G.1 Institutional studies The Consultant will examine the institutional framework ruling the future railway operation, taking into account the international nature of the track. Models of institutional arrangements between the countries crossed by the road and possibly the CER which are concerned by the corridor will be analyzed, including customs services, in order to provide the best arrangement to ensure smooth traffic on the new track. The institutional analysis report will focus on these elements but also any related issues which include in particular: (i) the need for a strategic planning framework of the network,
Prefeasibility study of the missing links of Final report Dakar – N’djamena and N’djamena ‐ Djibouti links November 2011
STUDI INTERNATIONAL page 181
(ii) the problem of overlapping responsibilities of government agencies, (iii) the various forms of operating entities, (iv) the importance of strong institutions in the public sector, particularly those in charge of the environment, (v) proposals for legal and institutional amelioration, in particular a regulating body and a steering mechanism of the project. G.2 Participation of the private sector
In its approach, the consultant will review the current procedure for concession in the transport sector of the countries crossed by the railway and draw the required lessons and recommendations. It will also examine the following questions:
- The most appropriate mechanism of public‐private partnership, given the economic and financial characteristics of the project,
- Identification of risks for the project for both the countries crossed by the future track and the potential private sector operators,
- Various options, including direct funding by governments in the countries crossed by the future track or by donors to provide the potential investors with an overview of the proposed transaction,
- The various solutions for steering the project itself and for the operation once the project is implemented (regulating body)
- The most appropriate purchase procedure for the chosen mechanism of public‐private partnership
- Measures to improve the private sector development and the competitive power of road and rail transport and analysis of the delegation of powers from the public service to the private sector.
H. Reports to be delivered
First establishment report Progress reports Technical study report Environmental impact study report Economic and financial studies report Institutional study report and participation of the private sector Draft final report Final report
Prefeasibility study of the missing links of Final report Dakar – N’djamena and N’djamena ‐ Djibouti links November 2011
STUDI INTERNATIONAL page 182
17 APPENDICES
17.1 Status of the Transafrican 5 in 2011
17.1.1 Missing links in 2003 of the Transafrican 5 and new characteristics in 2011 699. In 2003, the five sections of the Transafrican 5 classified as missing links are:
Saraya – Faleme in Senegal (45 km)
Faleme – Kénièba – Kati (300 km) and Kita – Bamako (180 km) in Mali
Fotokol – Maltam (85 km) in Cameroon 700. In the current situation (2011), these three sections are presented as follows. The presented elements were
collected by the Consultant in the field and among different institutions (UEMOA, AATR, ministries). 701. UEMOA and the Republics of Senegal and Mali have launched an international tender in 2006 for the
development and leveling of the highway between Dakar and Bamako (739), via the south of Tambacounda. This tender is part of the road development program and transport facilitation on the corridor Bamako ‐ Dakar by the south (Bamako‐Kati‐Kita‐Saraya‐Kenieba‐Faleme‐Kedougou‐Tambacounda‐M'Birkelane Kaolack‐Dakar).
702. The major components of the program are the following :
Development and strengthening of the following road sections on the corridor:
o Planning and tarring of Saraya ‐ Faleme (45 km) o Development and tarring of the Senegal ‐ Kita ‐ Kati border section (429 km) o Construction of a bridge over the Bafing (248 ml), a bridge on the Bale (80 ml) and a bridge on the
Faleme at the border between the two countries (250 ml) o Rehabilitation of the section Kédougou ‐ Saraya in Senegal (61 km) o Rehabilitation of M'birkilane ‐ Tambacounda section in Senegal (235 km) o Mitigation work and measures of environmental impacts including compensation of the population o Awareness of HIV / AIDS, malaria, road safety and environmental protection
Related Facilities :
(a) Detailed studies of rural roads and boreholes (b) Development of rural roads (100 km) (c) Carrying out of 18 boreholes (d) Rehabilitation of social infrastructure (e) Construction of rest areas for drivers every 150 km
Transport and transit’s facilitation measures :
(a) Construction of an equipped juxtaposed checkpoint at the border (b) Supply and installation of axle weight on the corridor and a scanner at the checkpoint at the border (c) Supply and installation of a radio communication system
703. The cost of the entire program (in 2005 prices) is estimated at 200.8 million UA (1 UA = 785 FCFA in 2005). The
financing is ensured by an ADF loan for the two states (58.16 million UA), an ADF grant to the UEMOA (7.9 million UA), loans from several donors (JBIC, IDB, KFW) and contribution of the two states to the tune of 17.4 million UA.
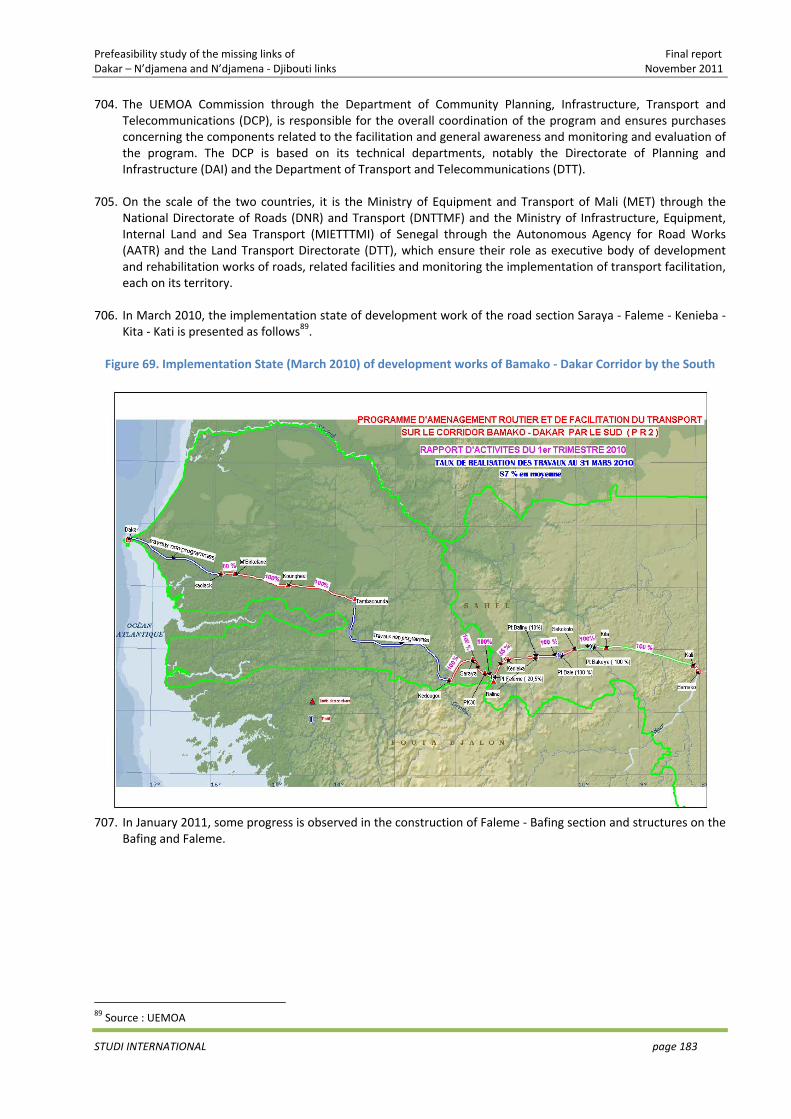
Prefeasibility study of the missing links of Final report Dakar – N’djamena and N’djamena ‐ Djibouti links November 2011
STUDI INTERNATIONAL page 183
704. The UEMOA Commission through the Department of Community Planning, Infrastructure, Transport and Telecommunications (DCP), is responsible for the overall coordination of the program and ensures purchases concerning the components related to the facilitation and general awareness and monitoring and evaluation of the program. The DCP is based on its technical departments, notably the Directorate of Planning and Infrastructure (DAI) and the Department of Transport and Telecommunications (DTT).
705. On the scale of the two countries, it is the Ministry of Equipment and Transport of Mali (MET) through the
National Directorate of Roads (DNR) and Transport (DNTTMF) and the Ministry of Infrastructure, Equipment, Internal Land and Sea Transport (MIETTTMI) of Senegal through the Autonomous Agency for Road Works (AATR) and the Land Transport Directorate (DTT), which ensure their role as executive body of development and rehabilitation works of roads, related facilities and monitoring the implementation of transport facilitation, each on its territory.
706. In March 2010, the implementation state of development work of the road section Saraya ‐ Faleme ‐ Kenieba ‐
Kita ‐ Kati is presented as follows89. Figure 69. Implementation State (March 2010) of development works of Bamako ‐ Dakar Corridor by the South
707. In January 2011, some progress is observed in the construction of Faleme ‐ Bafing section and structures on the
Bafing and Faleme.
89 Source : UEMOA
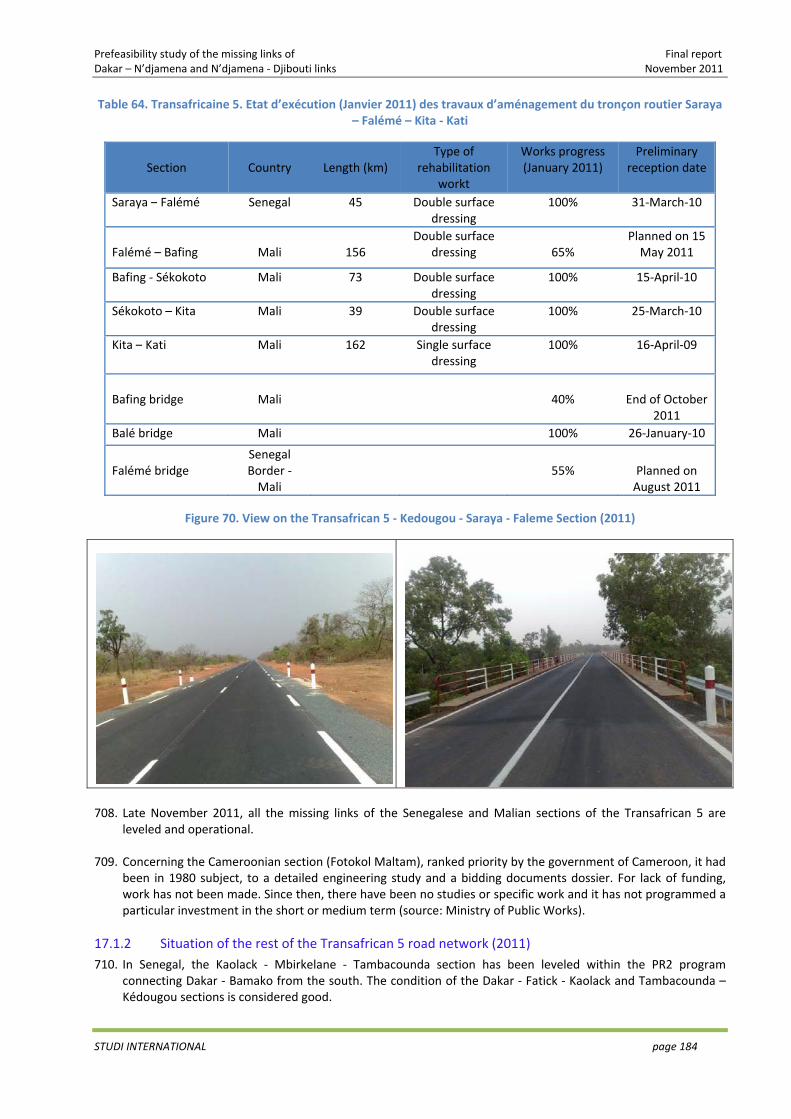
Prefeasibility study of the missing links of Final report Dakar – N’djamena and N’djamena ‐ Djibouti links November 2011
STUDI INTERNATIONAL page 184
Table 64. Transafricaine 5. Etat d’exécution (Janvier 2011) des travaux d’aménagement du tronçon routier Saraya – Falémé – Kita ‐ Kati
Section
Country Length (km)
Type of rehabilitation
workt
Works progress (January 2011)
Preliminary reception date
Saraya – Falémé Senegal 45 Double surface dressing
100% 31‐March‐10
Falémé – Bafing
Mali 156
Double surface dressing
65%
Planned on 15 May 2011
Bafing ‐ Sékokoto Mali 73 Double surface dressing
100% 15‐April‐10
Sékokoto – Kita Mali 39 Double surface dressing
100% 25‐March‐10
Kita – Kati Mali 162 Single surface dressing
100% 16‐April‐09
Bafing bridge
Mali
40% End of October
2011 Balé bridge Mali 100% 26‐January‐10
Falémé bridge
Senegal Border ‐ Mali
55% Planned on
August 2011
Figure 70. View on the Transafrican 5 ‐ Kedougou ‐ Saraya ‐ Faleme Section (2011)
708. Late November 2011, all the missing links of the Senegalese and Malian sections of the Transafrican 5 are
leveled and operational. 709. Concerning the Cameroonian section (Fotokol Maltam), ranked priority by the government of Cameroon, it had
been in 1980 subject, to a detailed engineering study and a bidding documents dossier. For lack of funding, work has not been made. Since then, there have been no studies or specific work and it has not programmed a particular investment in the short or medium term (source: Ministry of Public Works).
17.1.2 Situation of the rest of the Transafrican 5 road network (2011) 710. In Senegal, the Kaolack ‐ Mbirkelane ‐ Tambacounda section has been leveled within the PR2 program
connecting Dakar ‐ Bamako from the south. The condition of the Dakar ‐ Fatick ‐ Kaolack and Tambacounda – Kédougou sections is considered good.
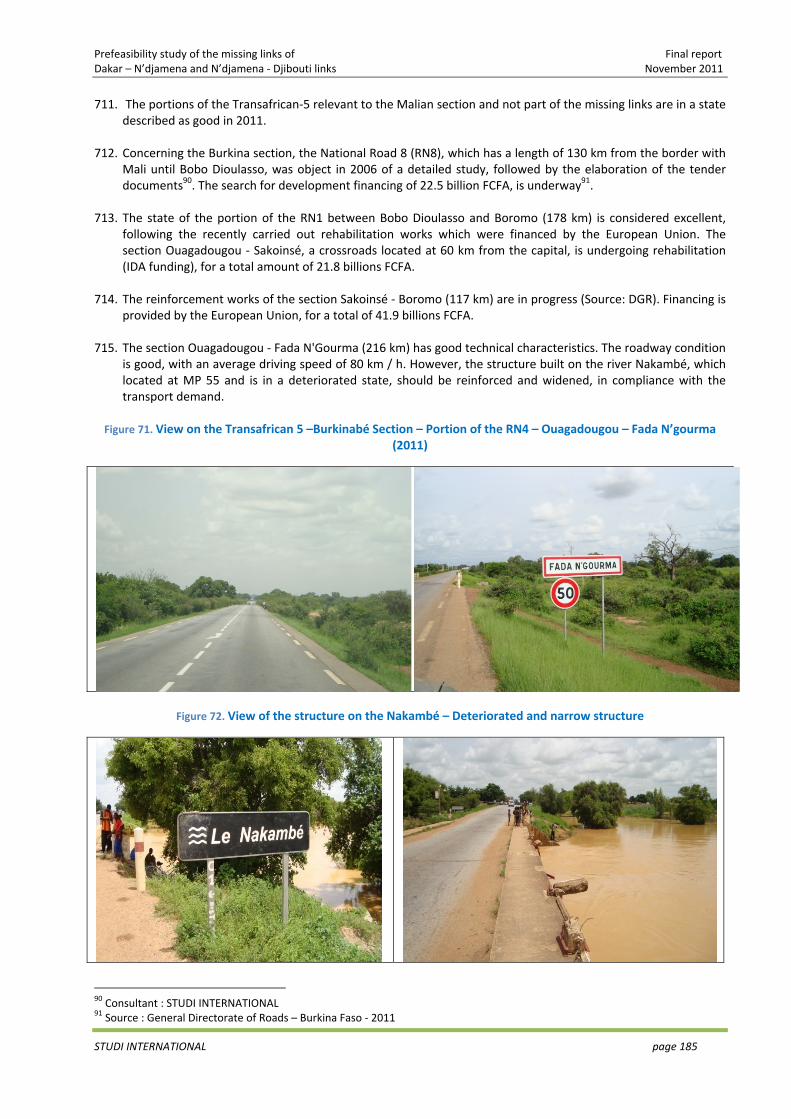
Prefeasibility study of the missing links of Final report Dakar – N’djamena and N’djamena ‐ Djibouti links November 2011
STUDI INTERNATIONAL page 185
711. The portions of the Transafrican‐5 relevant to the Malian section and not part of the missing links are in a state described as good in 2011.
712. Concerning the Burkina section, the National Road 8 (RN8), which has a length of 130 km from the border with
Mali until Bobo Dioulasso, was object in 2006 of a detailed study, followed by the elaboration of the tender documents90. The search for development financing of 22.5 billion FCFA, is underway91.
713. The state of the portion of the RN1 between Bobo Dioulasso and Boromo (178 km) is considered excellent,
following the recently carried out rehabilitation works which were financed by the European Union. The section Ouagadougou ‐ Sakoinsé, a crossroads located at 60 km from the capital, is undergoing rehabilitation (IDA funding), for a total amount of 21.8 billions FCFA.
714. The reinforcement works of the section Sakoinsé ‐ Boromo (117 km) are in progress (Source: DGR). Financing is
provided by the European Union, for a total of 41.9 billions FCFA. 715. The section Ouagadougou ‐ Fada N'Gourma (216 km) has good technical characteristics. The roadway condition
is good, with an average driving speed of 80 km / h. However, the structure built on the river Nakambé, which located at MP 55 and is in a deteriorated state, should be reinforced and widened, in compliance with the transport demand.
Figure 71. View on the Transafrican 5 –Burkinabé Section – Portion of the RN4 – Ouagadougou – Fada N’gourma
(2011)
Figure 72. View of the structure on the Nakambé – Deteriorated and narrow structure
90 Consultant : STUDI INTERNATIONAL 91 Source : General Directorate of Roads – Burkina Faso ‐ 2011
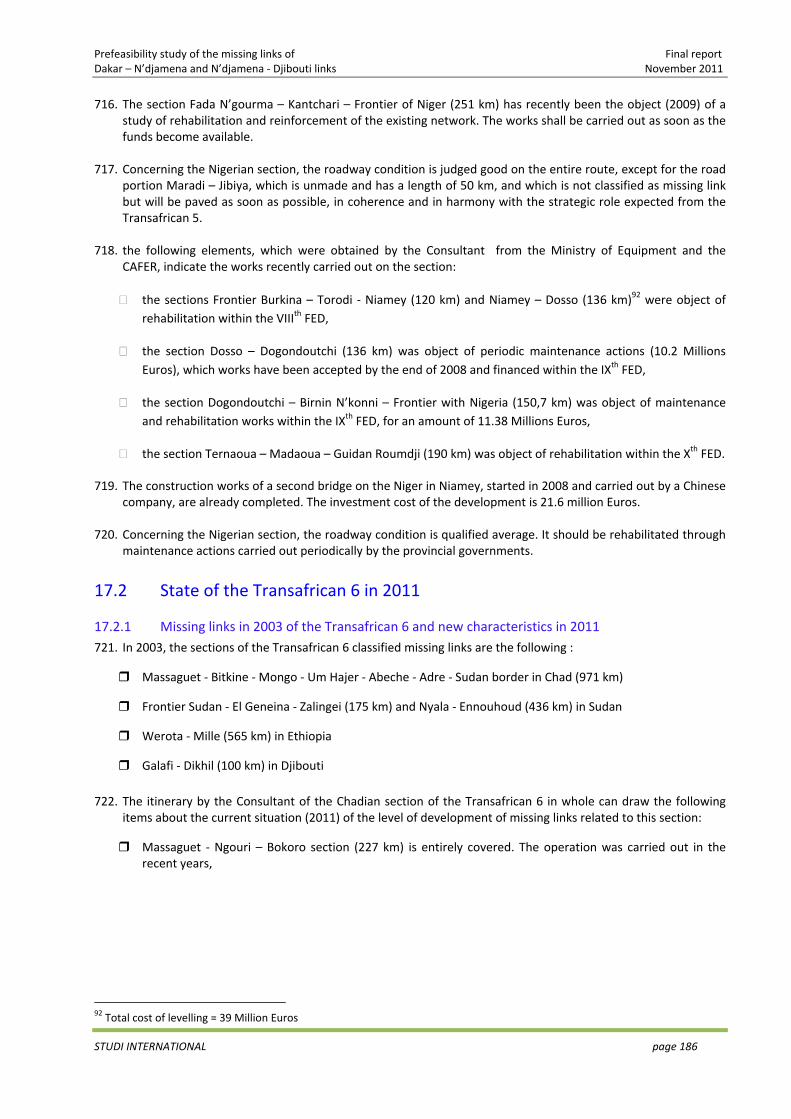
Prefeasibility study of the missing links of Final report Dakar – N’djamena and N’djamena ‐ Djibouti links November 2011
STUDI INTERNATIONAL page 186
716. The section Fada N’gourma – Kantchari – Frontier of Niger (251 km) has recently been the object (2009) of a study of rehabilitation and reinforcement of the existing network. The works shall be carried out as soon as the funds become available.
717. Concerning the Nigerian section, the roadway condition is judged good on the entire route, except for the road
portion Maradi – Jibiya, which is unmade and has a length of 50 km, and which is not classified as missing link but will be paved as soon as possible, in coherence and in harmony with the strategic role expected from the Transafrican 5.
718. the following elements, which were obtained by the Consultant from the Ministry of Equipment and the
CAFER, indicate the works recently carried out on the section:
the sections Frontier Burkina – Torodi ‐ Niamey (120 km) and Niamey – Dosso (136 km)92 were object of rehabilitation within the VIIIth FED,
the section Dosso – Dogondoutchi (136 km) was object of periodic maintenance actions (10.2 Millions Euros), which works have been accepted by the end of 2008 and financed within the IXth FED,
the section Dogondoutchi – Birnin N’konni – Frontier with Nigeria (150,7 km) was object of maintenance and rehabilitation works within the IXth FED, for an amount of 11.38 Millions Euros,
the section Ternaoua – Madaoua – Guidan Roumdji (190 km) was object of rehabilitation within the Xth FED.
719. The construction works of a second bridge on the Niger in Niamey, started in 2008 and carried out by a Chinese company, are already completed. The investment cost of the development is 21.6 million Euros.
720. Concerning the Nigerian section, the roadway condition is qualified average. It should be rehabilitated through
maintenance actions carried out periodically by the provincial governments.
17.2 State of the Transafrican 6 in 2011
17.2.1 Missing links in 2003 of the Transafrican 6 and new characteristics in 2011 721. In 2003, the sections of the Transafrican 6 classified missing links are the following :
Massaguet ‐ Bitkine ‐ Mongo ‐ Um Hajer ‐ Abeche ‐ Adre ‐ Sudan border in Chad (971 km)
Frontier Sudan ‐ El Geneina ‐ Zalingei (175 km) and Nyala ‐ Ennouhoud (436 km) in Sudan
Werota ‐ Mille (565 km) in Ethiopia
Galafi ‐ Dikhil (100 km) in Djibouti
722. The itinerary by the Consultant of the Chadian section of the Transafrican 6 in whole can draw the following items about the current situation (2011) of the level of development of missing links related to this section:
Massaguet ‐ Ngouri – Bokoro section (227 km) is entirely covered. The operation was carried out in the recent years,
92 Total cost of levelling = 39 Million Euros
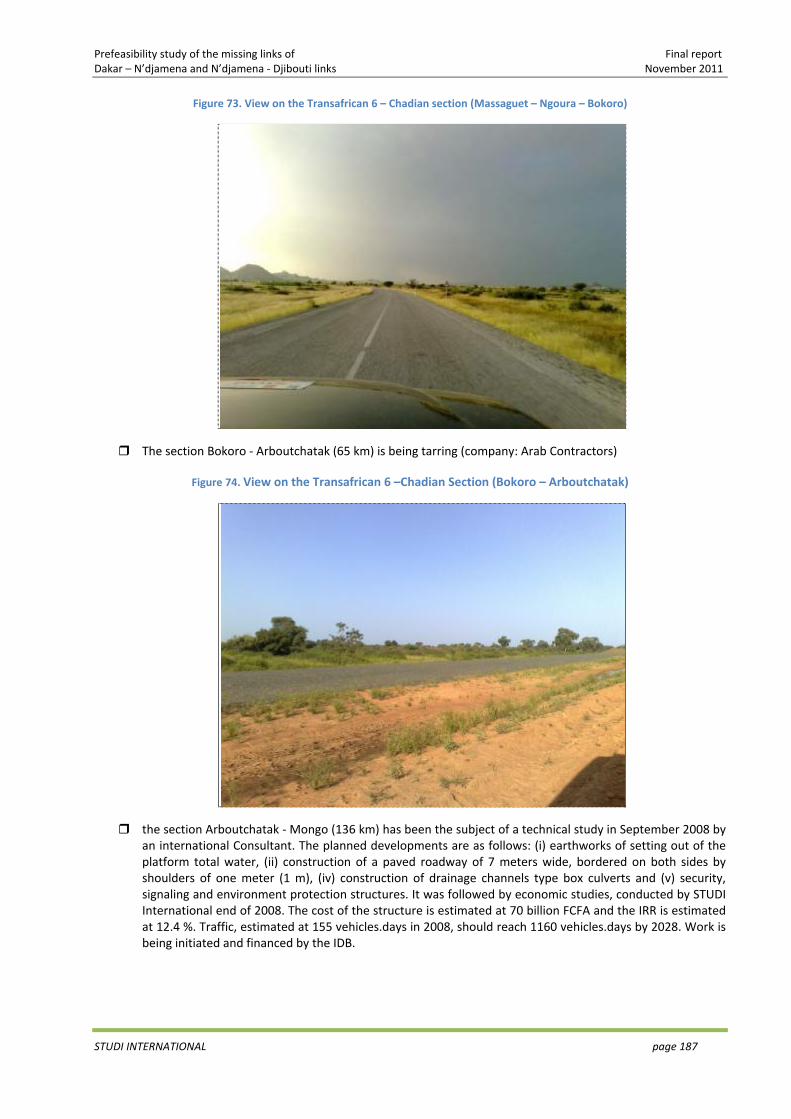
Prefeasibility study of the missing links of Final report Dakar – N’djamena and N’djamena ‐ Djibouti links November 2011
STUDI INTERNATIONAL page 187
Figure 73. View on the Transafrican 6 – Chadian section (Massaguet – Ngoura – Bokoro)
The section Bokoro ‐ Arboutchatak (65 km) is being tarring (company: Arab Contractors)
Figure 74. View on the Transafrican 6 –Chadian Section (Bokoro – Arboutchatak)
the section Arboutchatak ‐ Mongo (136 km) has been the subject of a technical study in September 2008 by an international Consultant. The planned developments are as follows: (i) earthworks of setting out of the platform total water, (ii) construction of a paved roadway of 7 meters wide, bordered on both sides by shoulders of one meter (1 m), (iv) construction of drainage channels type box culverts and (v) security, signaling and environment protection structures. It was followed by economic studies, conducted by STUDI International end of 2008. The cost of the structure is estimated at 70 billion FCFA and the IRR is estimated at 12.4 %. Traffic, estimated at 155 vehicles.days in 2008, should reach 1160 vehicles.days by 2028. Work is being initiated and financed by the IDB.
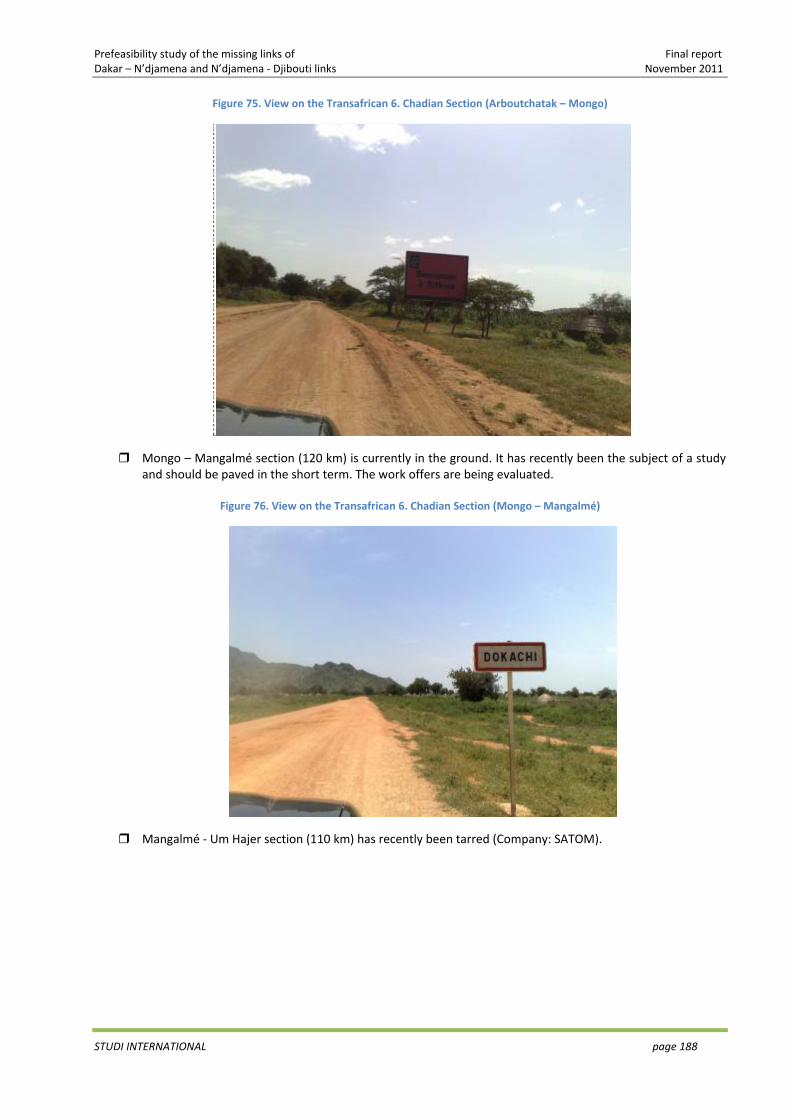
Prefeasibility study of the missing links of Final report Dakar – N’djamena and N’djamena ‐ Djibouti links November 2011
STUDI INTERNATIONAL page 188
Figure 75. View on the Transafrican 6. Chadian Section (Arboutchatak – Mongo)
Mongo – Mangalmé section (120 km) is currently in the ground. It has recently been the subject of a study and should be paved in the short term. The work offers are being evaluated.
Figure 76. View on the Transafrican 6. Chadian Section (Mongo – Mangalmé)
Mangalmé ‐ Um Hajer section (110 km) has recently been tarred (Company: SATOM).
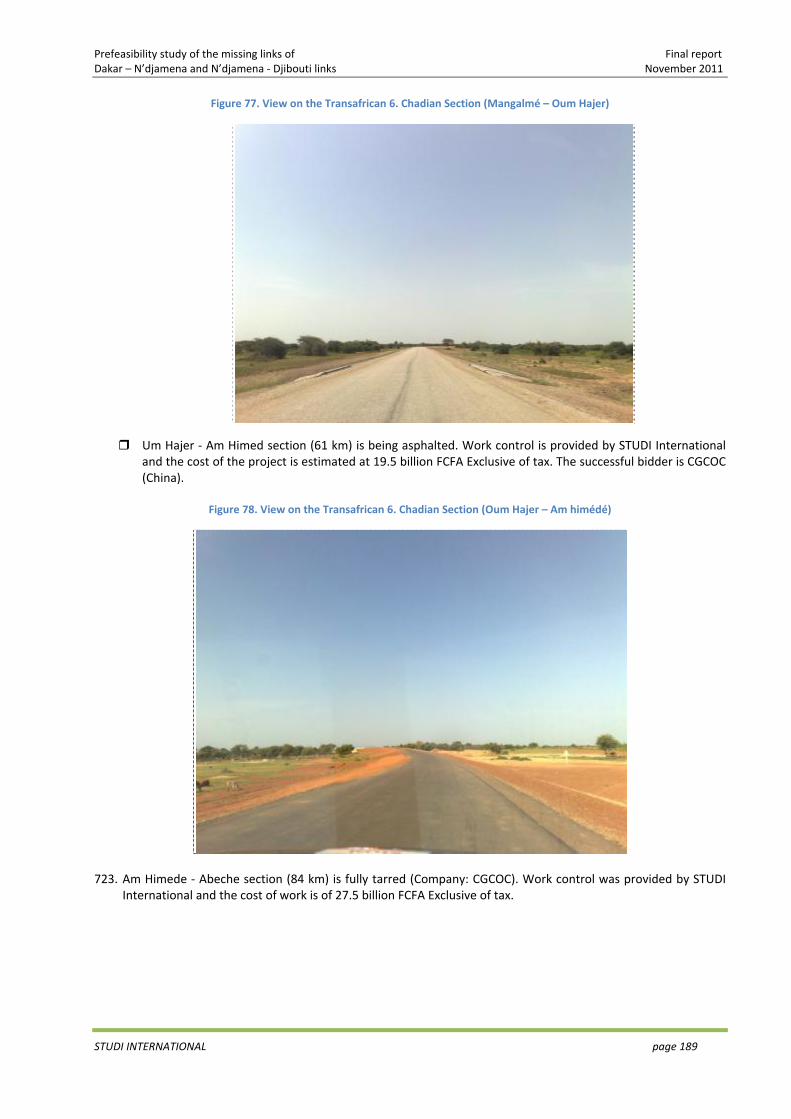
Prefeasibility study of the missing links of Final report Dakar – N’djamena and N’djamena ‐ Djibouti links November 2011
STUDI INTERNATIONAL page 189
Figure 77. View on the Transafrican 6. Chadian Section (Mangalmé – Oum Hajer)
Um Hajer ‐ Am Himed section (61 km) is being asphalted. Work control is provided by STUDI International and the cost of the project is estimated at 19.5 billion FCFA Exclusive of tax. The successful bidder is CGCOC (China).
Figure 78. View on the Transafrican 6. Chadian Section (Oum Hajer – Am himédé)
723. Am Himede ‐ Abeche section (84 km) is fully tarred (Company: CGCOC). Work control was provided by STUDI
International and the cost of work is of 27.5 billion FCFA Exclusive of tax.
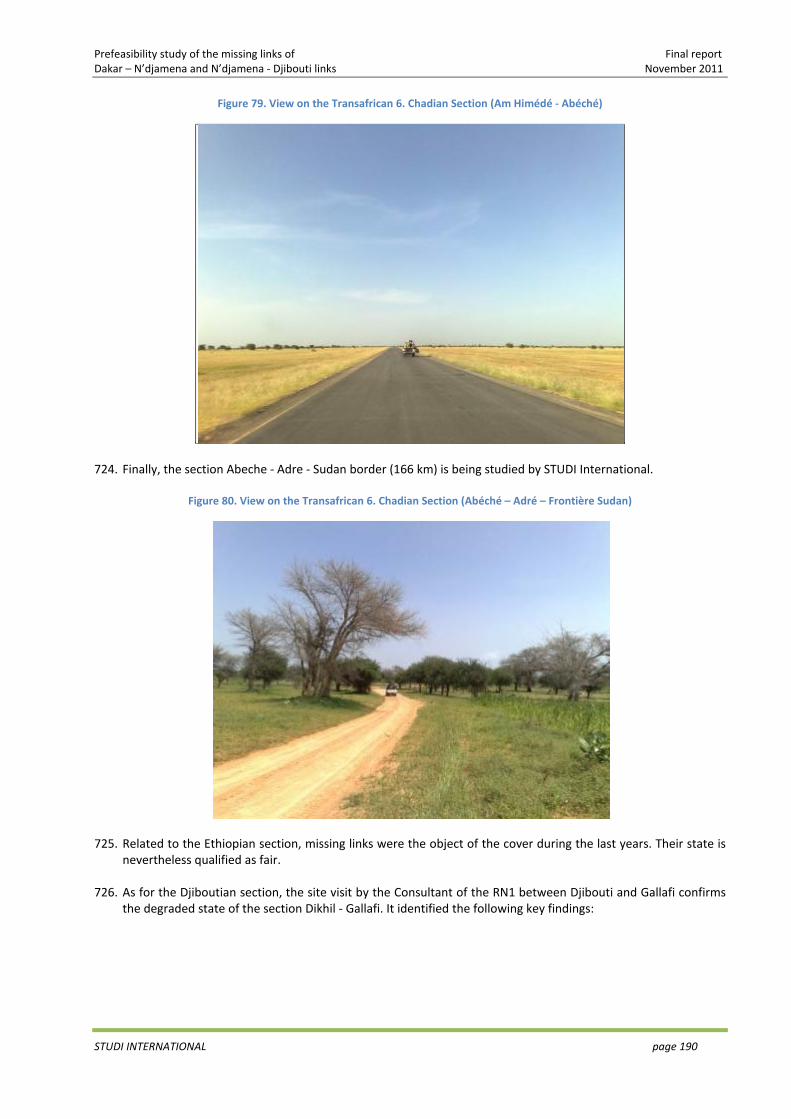
Prefeasibility study of the missing links of Final report Dakar – N’djamena and N’djamena ‐ Djibouti links November 2011
STUDI INTERNATIONAL page 190
Figure 79. View on the Transafrican 6. Chadian Section (Am Himédé ‐ Abéché)
724. Finally, the section Abeche ‐ Adre ‐ Sudan border (166 km) is being studied by STUDI International.
Figure 80. View on the Transafrican 6. Chadian Section (Abéché – Adré – Frontière Sudan)
725. Related to the Ethiopian section, missing links were the object of the cover during the last years. Their state is
nevertheless qualified as fair. 726. As for the Djiboutian section, the site visit by the Consultant of the RN1 between Djibouti and Gallafi confirms
the degraded state of the section Dikhil ‐ Gallafi. It identified the following key findings:
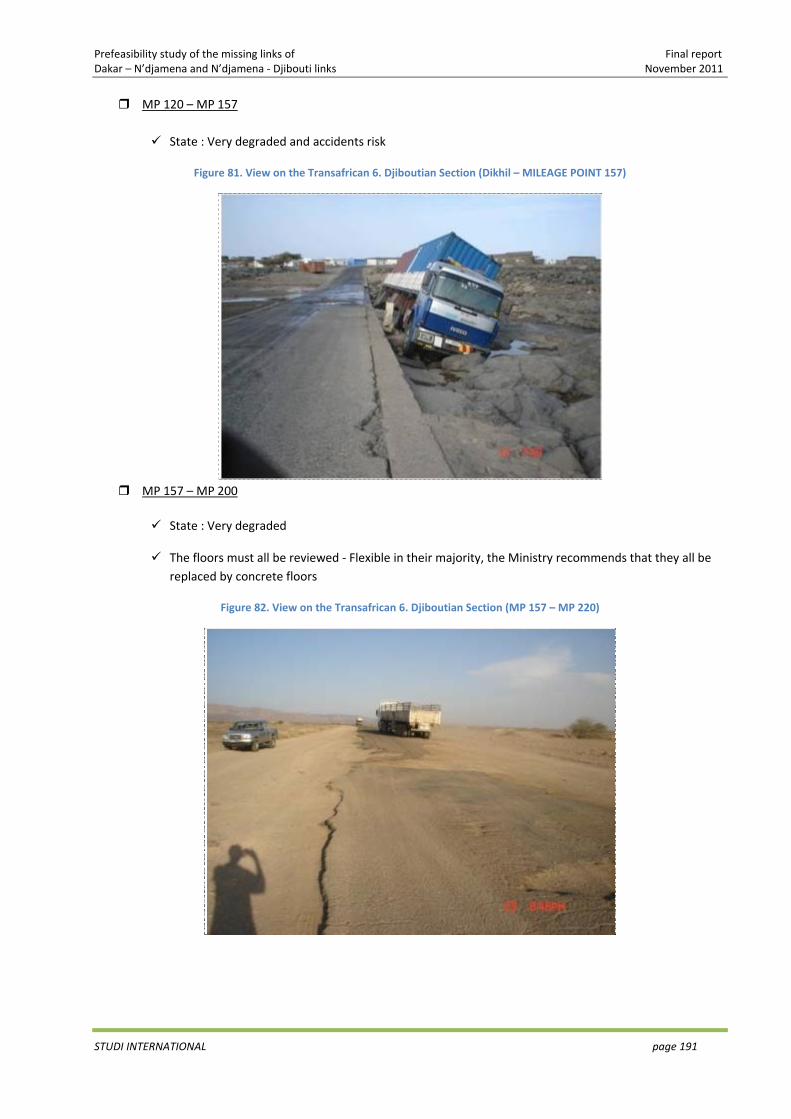
Prefeasibility study of the missing links of Final report Dakar – N’djamena and N’djamena ‐ Djibouti links November 2011
STUDI INTERNATIONAL page 191
MP 120 – MP 157
State : Very degraded and accidents risk
Figure 81. View on the Transafrican 6. Djiboutian Section (Dikhil – MILEAGE POINT 157)
MP 157 – MP 200
State : Very degraded
The floors must all be reviewed ‐ Flexible in their majority, the Ministry recommends that they all be replaced by concrete floors
Figure 82. View on the Transafrican 6. Djiboutian Section (MP 157 – MP 220)
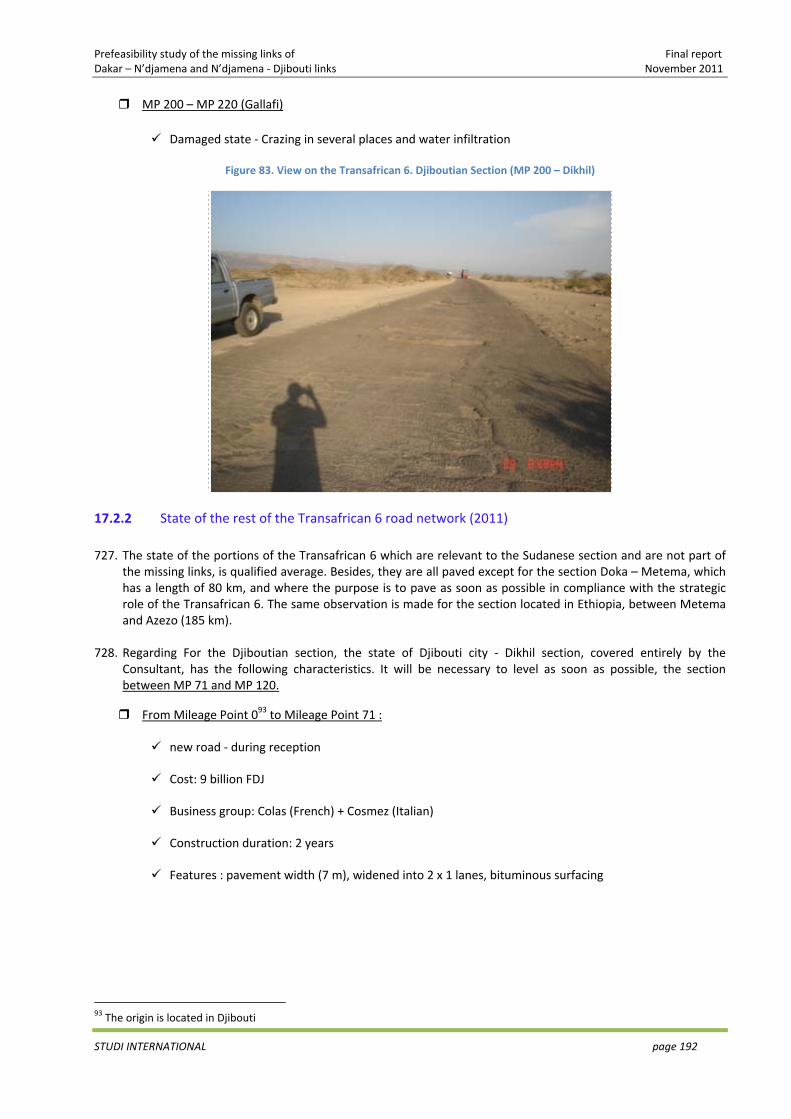
Prefeasibility study of the missing links of Final report Dakar – N’djamena and N’djamena ‐ Djibouti links November 2011
STUDI INTERNATIONAL page 192
MP 200 – MP 220 (Gallafi)
Damaged state ‐ Crazing in several places and water infiltration
Figure 83. View on the Transafrican 6. Djiboutian Section (MP 200 – Dikhil)
17.2.2 State of the rest of the Transafrican 6 road network (2011) 727. The state of the portions of the Transafrican 6 which are relevant to the Sudanese section and are not part of
the missing links, is qualified average. Besides, they are all paved except for the section Doka – Metema, which has a length of 80 km, and where the purpose is to pave as soon as possible in compliance with the strategic role of the Transafrican 6. The same observation is made for the section located in Ethiopia, between Metema and Azezo (185 km).
728. Regarding For the Djiboutian section, the state of Djibouti city ‐ Dikhil section, covered entirely by the
Consultant, has the following characteristics. It will be necessary to level as soon as possible, the section between MP 71 and MP 120.
From Mileage Point 093 to Mileage Point 71 :
new road ‐ during reception
Cost: 9 billion FDJ
Business group: Colas (French) + Cosmez (Italian)
Construction duration: 2 years
Features : pavement width (7 m), widened into 2 x 1 lanes, bituminous surfacing
93 The origin is located in Djibouti
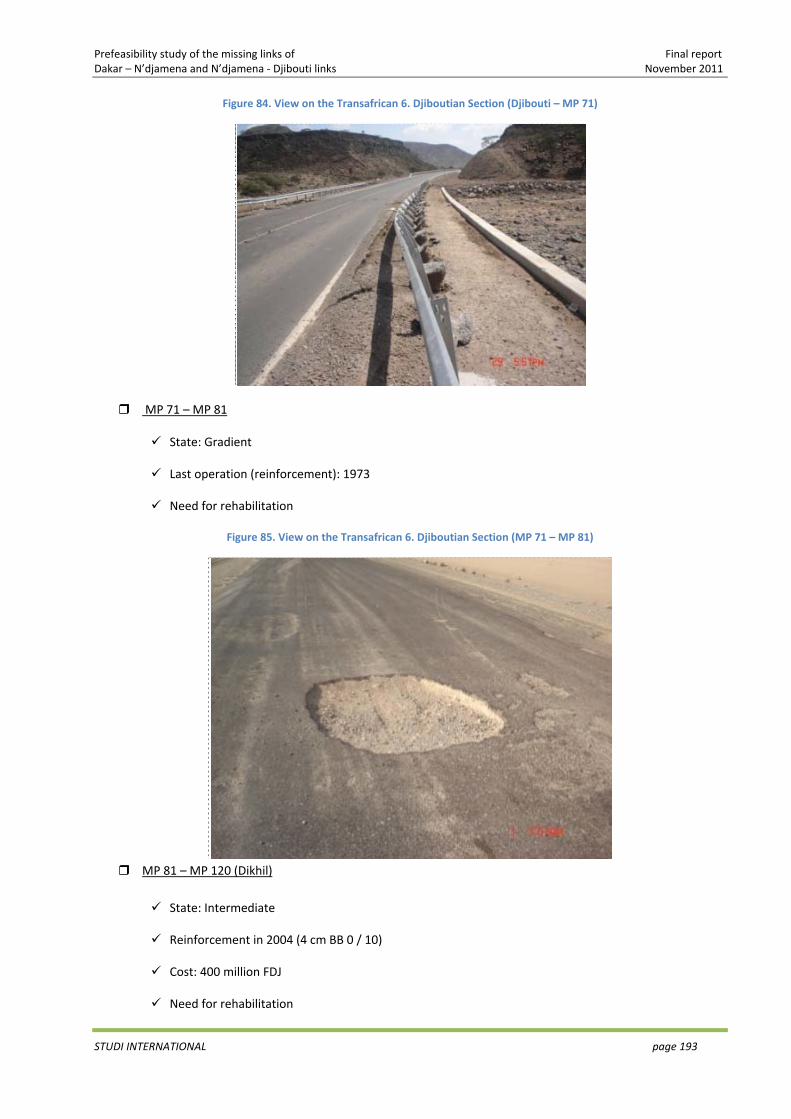
Prefeasibility study of the missing links of Final report Dakar – N’djamena and N’djamena ‐ Djibouti links November 2011
STUDI INTERNATIONAL page 193
Figure 84. View on the Transafrican 6. Djiboutian Section (Djibouti – MP 71)
MP 71 – MP 81
State: Gradient
Last operation (reinforcement): 1973
Need for rehabilitation
Figure 85. View on the Transafrican 6. Djiboutian Section (MP 71 – MP 81)
MP 81 – MP 120 (Dikhil)
State: Intermediate
Reinforcement in 2004 (4 cm BB 0 / 10)
Cost: 400 million FDJ
Need for rehabilitation

Prefeasibility study of the missing links of Final report Dakar – N’djamena and N’djamena ‐ Djibouti links November 2011
STUDI INTERNATIONAL page 194
Figure 86. View on the Transafrican 6. Djiboutian Section (MP 81 – Dikhil)
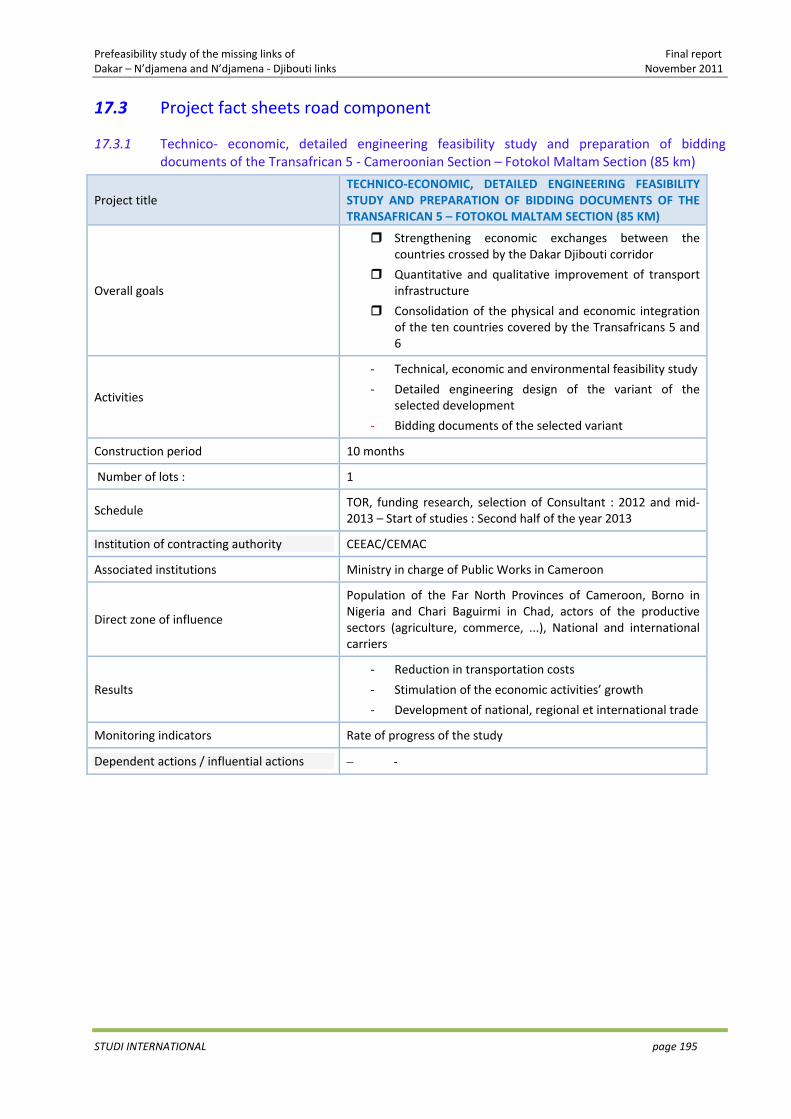
Prefeasibility study of the missing links of Final report Dakar – N’djamena and N’djamena ‐ Djibouti links November 2011
STUDI INTERNATIONAL page 195
17.3 Project fact sheets road component
17.3.1 Technico‐ economic, detailed engineering feasibility study and preparation of bidding documents of the Transafrican 5 ‐ Cameroonian Section – Fotokol Maltam Section (85 km)
Project title TECHNICO‐ECONOMIC, DETAILED ENGINEERING FEASIBILITY STUDY AND PREPARATION OF BIDDING DOCUMENTS OF THE TRANSAFRICAN 5 – FOTOKOL MALTAM SECTION (85 KM)
Overall goals
Strengthening economic exchanges between the countries crossed by the Dakar Djibouti corridor
Quantitative and qualitative improvement of transport infrastructure
Consolidation of the physical and economic integration of the ten countries covered by the Transafricans 5 and 6
Activities
‐ Technical, economic and environmental feasibility study
‐ Detailed engineering design of the variant of the selected development
‐ Bidding documents of the selected variant
Construction period 10 months
Number of lots : 1
Schedule TOR, funding research, selection of Consultant : 2012 and mid‐2013 – Start of studies : Second half of the year 2013
Institution of contracting authority CEEAC/CEMAC
Associated institutions Ministry in charge of Public Works in Cameroon
Direct zone of influence
Population of the Far North Provinces of Cameroon, Borno in Nigeria and Chari Baguirmi in Chad, actors of the productive sectors (agriculture, commerce, ...), National and international carriers
Results
‐ Reduction in transportation costs
‐ Stimulation of the economic activities’ growth
‐ Development of national, regional et international trade
Monitoring indicators Rate of progress of the study
Dependent actions / influential actions − ‐
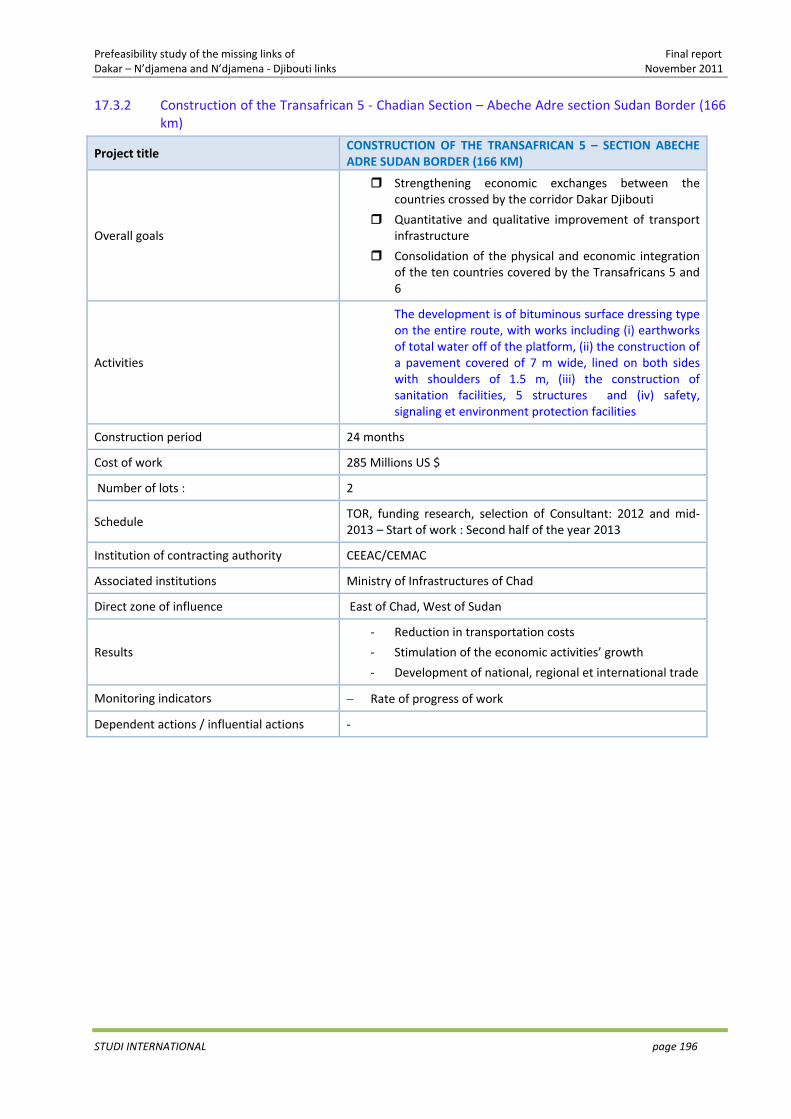
Prefeasibility study of the missing links of Final report Dakar – N’djamena and N’djamena ‐ Djibouti links November 2011
STUDI INTERNATIONAL page 196
17.3.2 Construction of the Transafrican 5 ‐ Chadian Section – Abeche Adre section Sudan Border (166 km)
Project title CONSTRUCTION OF THE TRANSAFRICAN 5 – SECTION ABECHE ADRE SUDAN BORDER (166 KM)
Overall goals
Strengthening economic exchanges between the countries crossed by the corridor Dakar Djibouti
Quantitative and qualitative improvement of transport infrastructure
Consolidation of the physical and economic integration of the ten countries covered by the Transafricans 5 and 6
Activities
The development is of bituminous surface dressing type on the entire route, with works including (i) earthworks of total water off of the platform, (ii) the construction of a pavement covered of 7 m wide, lined on both sides with shoulders of 1.5 m, (iii) the construction of sanitation facilities, 5 structures and (iv) safety, signaling et environment protection facilities
Construction period 24 months
Cost of work 285 Millions US $
Number of lots : 2
Schedule TOR, funding research, selection of Consultant: 2012 and mid‐2013 – Start of work : Second half of the year 2013
Institution of contracting authority CEEAC/CEMAC
Associated institutions Ministry of Infrastructures of Chad
Direct zone of influence East of Chad, West of Sudan
Results
‐ Reduction in transportation costs
‐ Stimulation of the economic activities’ growth
‐ Development of national, regional et international trade
Monitoring indicators − Rate of progress of work
Dependent actions / influential actions ‐

Prefeasibility study of the missing links of Final report Dakar – N’djamena and N’djamena ‐ Djibouti links November 2011
STUDI INTERNATIONAL page 197
17.3.3 Technico ‐ economic, detailed engineering feasibility study and preparation of bidding document of the Transafrican 6. Sudanese Section – Chad border El Geneina Section (25 km)
Project title
TECHNICO‐ECONOMIC, DETAILED ENGINEERING FEASIBILITY STUDY AND PREPARATION OF BIDDING DOCUMENTS OF THE TRANSAFRICAN 6. SUDANESE SECTION – CHAD BORDER EL GENEINA SECTION (25 KM)
Overall goals
Strengthening economic exchanges between the countries crossed by the corridor Dakar Djibouti
Quantitative and qualitative improvement of transport infrastructure
Consolidation of the physical and economic integration of the ten countries covered by the Transafricans 5 and 6
Activities
‐ Technical, economic and environmental feasibility study
‐ Detailed engineering design of the variant of the selected development
‐ Bidding documents of the selected variant
Construction period 6 months
Number of lots : 1
Schedule TOR, funding research, selection of Consultant: 2012 ‐ Start of studies : Early 2013
Institution of contracting authority IGAD
Associated institutions Ministry of Housing, Lands and Public Utilities
Direct zone of influence Population of Provinces of West Darfour in Sudan and Ouaddaï in Chad, actors of the productive sectors, National and international carriers
Results
‐ Reduction in transportation costs
‐ Stimulation of the economic activities’ growth
‐ Development of national, regional et international trade
Monitoring indicators − Rate of progress of the study
Dependent actions / influential actions ‐

Prefeasibility study of the missing links of Final report Dakar – N’djamena and N’djamena ‐ Djibouti links November 2011
STUDI INTERNATIONAL page 198
17.3.4 Technico ‐ economic, detailed engineering feasibility study and preparation of bidding document of the Transafrican 6. Sudanese Section – El Geneina – Zalingei Section (150 km)
Project title
TECHNICO‐ECONOMIC, DETAILED ENGINEERING FEASIBILITY STUDY AND PREPARATION OF BIDDING DOCUMENTS OF THE TRANSAFRICAN 6. SUDANESE SECTION – EL GENEINA ZALINGEI SECTION (150 KM)
Overall goals
Strengthening economic exchanges between the countries crossed by the corridor Dakar Djibouti
Quantitative and qualitative improvement of transport infrastructure
Consolidation of the physical and economic integration of the ten countries covered by the Transafricans 5 and 6
Activities
‐ Technical, economic and environmental feasibility study
‐ Detailed engineering design of the variant of the selected development
‐ Bidding documents of the selected variant
Construction period 13 months
Number of lots : 1
Schedule TOR, funding research, selection of Consultant : 2012 and mid‐2013 ‐ Start of studies : Second half of the year 2013
Institution of contracting authority IGAD
Associated institutions Ministry of Housing, Lands and Public Utilities
Direct zone of influence Population of South Darfour and Western Darfour Province, actors of the productive sectors, National and international carriers
Results
‐ Reduction in transportation costs
‐ Stimulation of the economic activities’ growth
‐ Development of national, regional et international trade
Monitoring indicators − Rate of progress of the study
Dependent actions / influential actions ‐
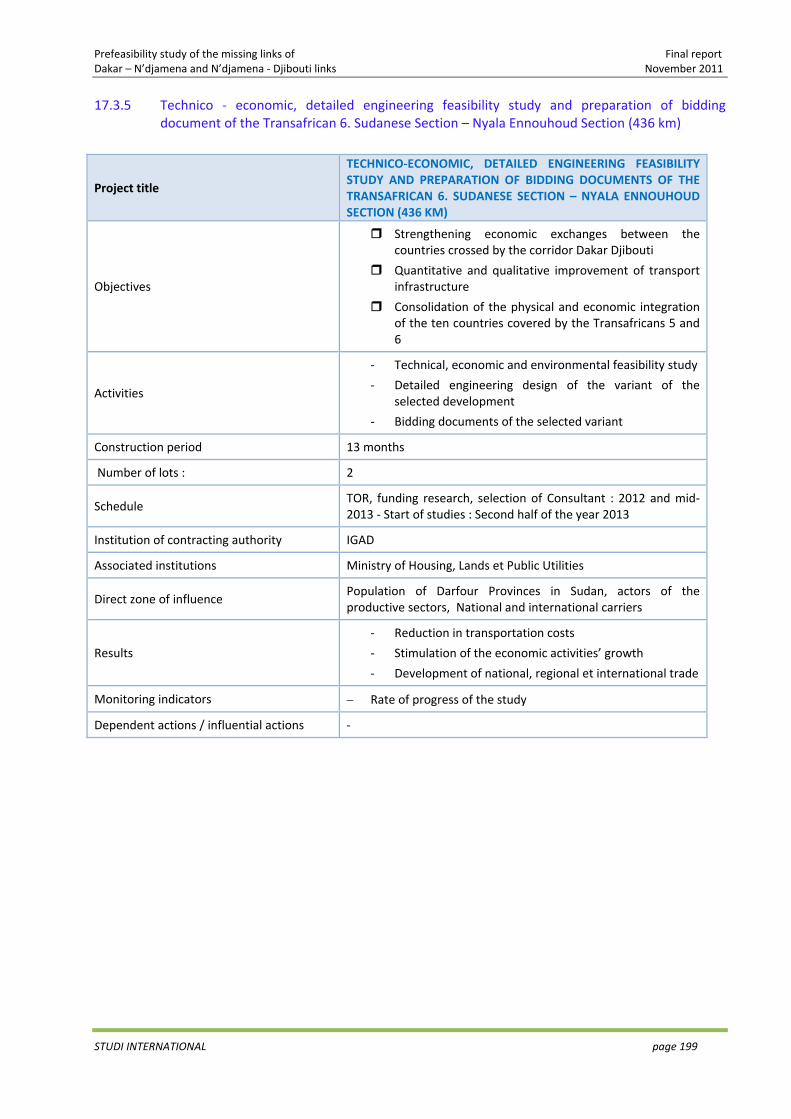
Prefeasibility study of the missing links of Final report Dakar – N’djamena and N’djamena ‐ Djibouti links November 2011
STUDI INTERNATIONAL page 199
17.3.5 Technico ‐ economic, detailed engineering feasibility study and preparation of bidding document of the Transafrican 6. Sudanese Section – Nyala Ennouhoud Section (436 km)
Project title
TECHNICO‐ECONOMIC, DETAILED ENGINEERING FEASIBILITY STUDY AND PREPARATION OF BIDDING DOCUMENTS OF THE TRANSAFRICAN 6. SUDANESE SECTION – NYALA ENNOUHOUD SECTION (436 KM)
Objectives
Strengthening economic exchanges between the countries crossed by the corridor Dakar Djibouti
Quantitative and qualitative improvement of transport infrastructure
Consolidation of the physical and economic integration of the ten countries covered by the Transafricans 5 and 6
Activities
‐ Technical, economic and environmental feasibility study
‐ Detailed engineering design of the variant of the selected development
‐ Bidding documents of the selected variant
Construction period 13 months
Number of lots : 2
Schedule TOR, funding research, selection of Consultant : 2012 and mid‐2013 ‐ Start of studies : Second half of the year 2013
Institution of contracting authority IGAD
Associated institutions Ministry of Housing, Lands et Public Utilities
Direct zone of influence Population of Darfour Provinces in Sudan, actors of the productive sectors, National and international carriers
Results
‐ Reduction in transportation costs
‐ Stimulation of the economic activities’ growth
‐ Development of national, regional et international trade
Monitoring indicators − Rate of progress of the study
Dependent actions / influential actions ‐

Prefeasibility study of the missing links of Final report Dakar – N’djamena and N’djamena ‐ Djibouti links November 2011
STUDI INTERNATIONAL page 200
17.3.6 Technico ‐ economic, detailed engineering feasibility study and preparation of bidding documents of the Transafrican 6. Ethiopian Section – Werota Weldiya Section (300 km)
Project title
TECHNICO‐ECONOMIC, DETAILED ENGINEERING FEASIBILITY STUDY AND PREPARATION OF BIDDING DOCUMENTS OF THE TRANSAFRICAN 6. ETHIOPIAN SECTION –WEROTA WELDIYA SECTION (300 KM)
Objectives
Strengthening economic exchanges between the countries crossed by the corridor Dakar Djibouti
Quantitative and qualitative improvement of transport infrastructure
Consolidation of the physical and economic integration of the ten countries covered by the Transafricans 5 and 6
Activities
‐ Technical, economic and environmental feasibility study
‐ Detailed engineering design of the variant of the selected development
‐ Bidding documents of the selected variant
Construction period 14 months
Number of lots : 2
Schedule TOR, funding research, selection of Consultant : 2012 and mid‐2013 ‐ Start of studies : Second half of the year 2013
Institution of contracting authority IGAD
Associated institutions Ethiopian Road Authority
Direct zone of influence Amhara Regional State, actors of the productive sectors, National and international carriers
Results
‐ Reduction in transportation costs
‐ Stimulation of the economic activities’ growth
‐ Development of national, regional et international trade
Monitoring indicators − Rate of progress of the study
Dependent actions / influential actions ‐

Prefeasibility study of the missing links of Final report Dakar – N’djamena and N’djamena ‐ Djibouti links November 2011
STUDI INTERNATIONAL page 201
17.3.7 Technico ‐ economic, detailed engineering feasibility study and preparation of bidding documents of the Transafrican 6. Ethiopian Section ‐ Weldiya – Dese Section (120 km)
Project title
TECHNICO‐ECONOMIC, DETAILED ENGINEERING FEASIBILITY STUDY AND PREPARATION OF BIDDING DOCUMENTS OF THE TRANSAFRICAN 6. ETHIOPIAN SECTION – WELDIYA DESE SECTION (120 KM)
Objectives
Strengthening economic exchanges between the countries crossed by the corridor Dakar Djibouti
Quantitative and qualitative improvement of transport infrastructure
Consolidation of the physical and economic integration of the ten countries covered by the Transafricans 5 and 6
Activities
‐ Technical, economic and environmental feasibility study
‐ Detailed engineering design of the variant of the selected development
‐ Bidding documents of the selected variant
Construction period 16 months
Number of lots : 1
Schedule TOR, funding research, selection of Consultant : 2012 and mid‐2013 ‐ Start of studies : Second half of the year 2013
Institution of contracting authority IGAD
Associated institutions Ethiopian Road Authority
Direct zone of influence Amhara Regional State, actors of the productive sectors, National and international carriers
Results
‐ Reduction in transportation costs
‐ Stimulation of the economic activities’ growth
‐ Development of national, regional et international trade
Monitoring indicators − Rate of progress of the study
Dependent actions / influential actions ‐
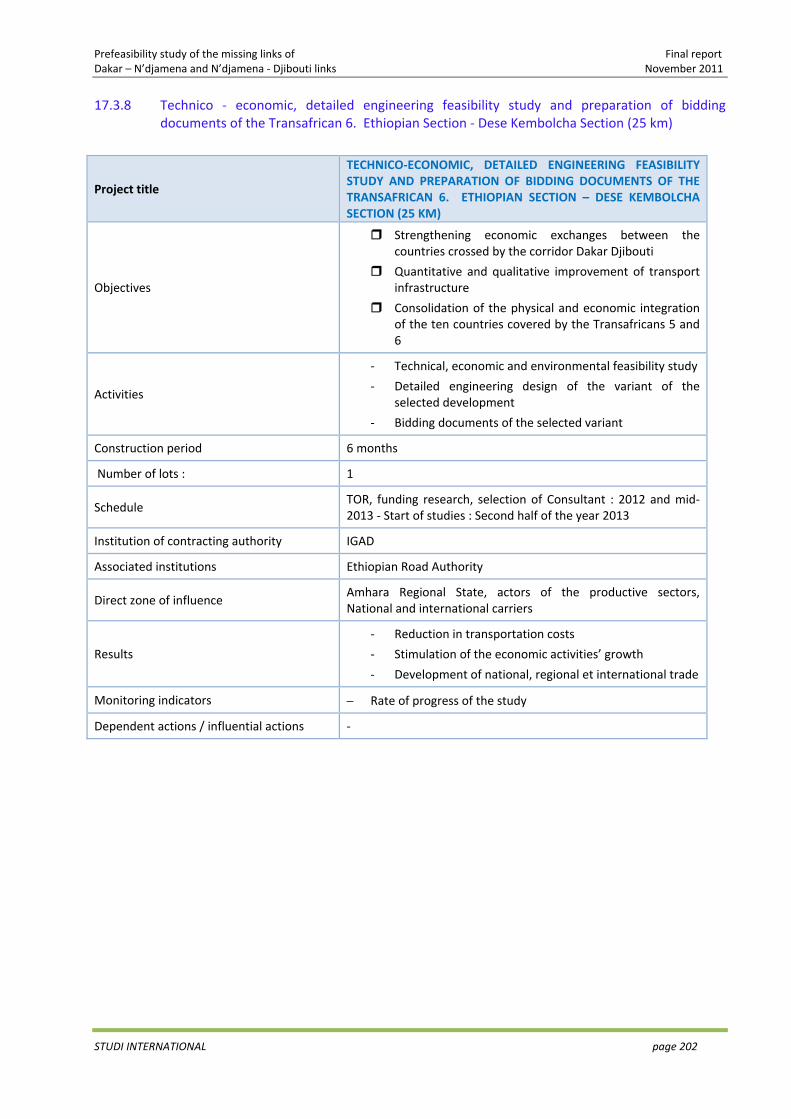
Prefeasibility study of the missing links of Final report Dakar – N’djamena and N’djamena ‐ Djibouti links November 2011
STUDI INTERNATIONAL page 202
17.3.8 Technico ‐ economic, detailed engineering feasibility study and preparation of bidding documents of the Transafrican 6. Ethiopian Section ‐ Dese Kembolcha Section (25 km)
Project title
TECHNICO‐ECONOMIC, DETAILED ENGINEERING FEASIBILITY STUDY AND PREPARATION OF BIDDING DOCUMENTS OF THE TRANSAFRICAN 6. ETHIOPIAN SECTION – DESE KEMBOLCHA SECTION (25 KM)
Objectives
Strengthening economic exchanges between the countries crossed by the corridor Dakar Djibouti
Quantitative and qualitative improvement of transport infrastructure
Consolidation of the physical and economic integration of the ten countries covered by the Transafricans 5 and 6
Activities
‐ Technical, economic and environmental feasibility study
‐ Detailed engineering design of the variant of the selected development
‐ Bidding documents of the selected variant
Construction period 6 months
Number of lots : 1
Schedule TOR, funding research, selection of Consultant : 2012 and mid‐2013 ‐ Start of studies : Second half of the year 2013
Institution of contracting authority IGAD
Associated institutions Ethiopian Road Authority
Direct zone of influence Amhara Regional State, actors of the productive sectors, National and international carriers
Results
‐ Reduction in transportation costs
‐ Stimulation of the economic activities’ growth
‐ Development of national, regional et international trade
Monitoring indicators − Rate of progress of the study
Dependent actions / influential actions ‐

Prefeasibility study of the missing links of Final report Dakar – N’djamena and N’djamena ‐ Djibouti links November 2011
STUDI INTERNATIONAL page 203
17.3.9 Technico ‐ economic, detailed engineering feasibility study and preparation of bidding documents of the Transafrican 6. Ethiopian Section ‐ Kembolcha – Bati Section (42 km)
Project title
TECHNICO‐ECONOMIC, DETAILED ENGINEERING FEASIBILITY STUDY AND PREPARATION OF BIDDING DOCUMENTS OF THE TRANSAFRICAN 6. ETHIOPIAN SECTION –KEMBOLCHA BATI SECTION (42 KM)
Objectives
Strengthening economic exchanges between the countries crossed by the corridor Dakar Djibouti
Quantitative and qualitative improvement of transport infrastructure
Consolidation of the physical and economic integration of the ten countries covered by the Transafricans 5 and 6
Activities
‐ Technical, economic and environmental feasibility study
‐ Detailed engineering design of the variant of the selected development
‐ Bidding documents of the selected variant
Construction period 11 months
Number of lots : 1
Schedule TOR, funding research, selection of Consultant : 2012 and mid‐2013 ‐ Start of studies : Second half of the year 2013
Institution of contracting authority IGAD
Associated institutions Ethiopian Road Authority
Direct zone of influence Amhara Regional State, actors of the productive sectors, National and international carriers
Results
‐ Reduction in transportation costs
‐ Stimulation of the economic activities’ growth
‐ Development of national, regional et international trade
Monitoring indicators − Rate of progress of the study
Dependent actions / influential actions ‐
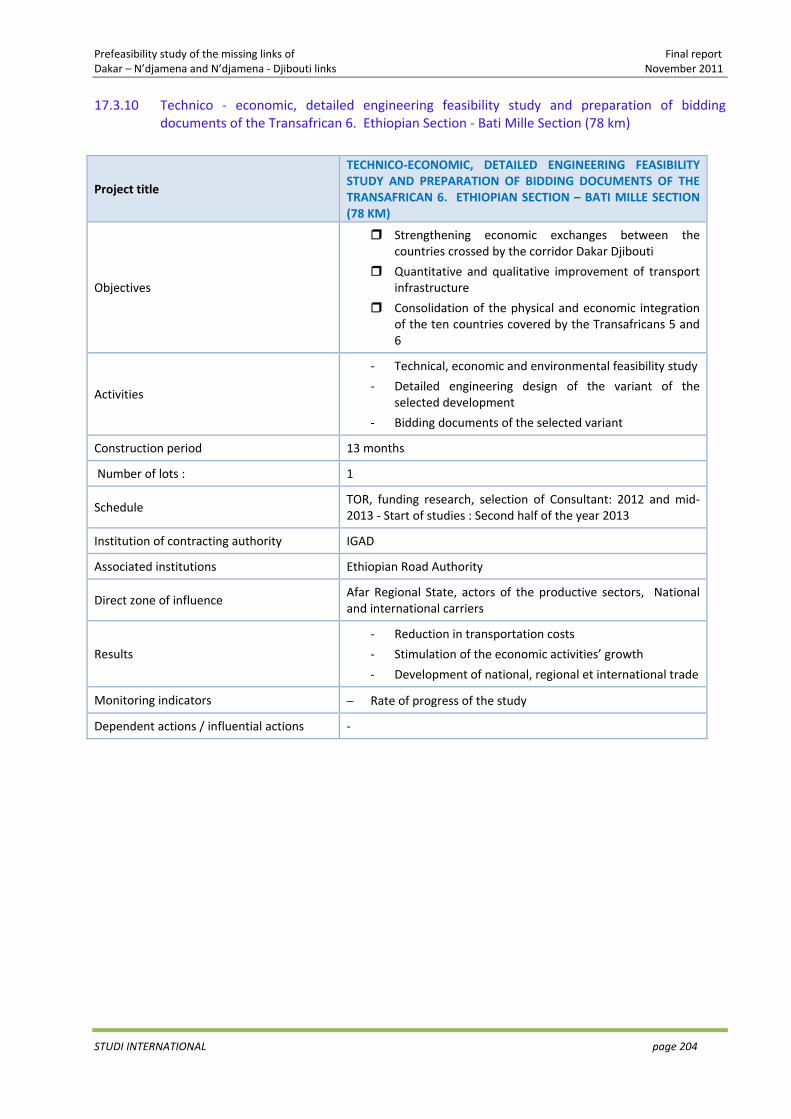
Prefeasibility study of the missing links of Final report Dakar – N’djamena and N’djamena ‐ Djibouti links November 2011
STUDI INTERNATIONAL page 204
17.3.10 Technico ‐ economic, detailed engineering feasibility study and preparation of bidding documents of the Transafrican 6. Ethiopian Section ‐ Bati Mille Section (78 km)
Project title
TECHNICO‐ECONOMIC, DETAILED ENGINEERING FEASIBILITY STUDY AND PREPARATION OF BIDDING DOCUMENTS OF THE TRANSAFRICAN 6. ETHIOPIAN SECTION – BATI MILLE SECTION (78 KM)
Objectives
Strengthening economic exchanges between the countries crossed by the corridor Dakar Djibouti
Quantitative and qualitative improvement of transport infrastructure
Consolidation of the physical and economic integration of the ten countries covered by the Transafricans 5 and 6
Activities
‐ Technical, economic and environmental feasibility study
‐ Detailed engineering design of the variant of the selected development
‐ Bidding documents of the selected variant
Construction period 13 months
Number of lots : 1
Schedule TOR, funding research, selection of Consultant: 2012 and mid‐2013 ‐ Start of studies : Second half of the year 2013
Institution of contracting authority IGAD
Associated institutions Ethiopian Road Authority
Direct zone of influence Afar Regional State, actors of the productive sectors, National and international carriers
Results
‐ Reduction in transportation costs
‐ Stimulation of the economic activities’ growth
‐ Development of national, regional et international trade
Monitoring indicators − Rate of progress of the study
Dependent actions / influential actions ‐

Prefeasibility study of the missing links of Final report Dakar – N’djamena and N’djamena ‐ Djibouti links November 2011
STUDI INTERNATIONAL page 205
17.3.11 Technico ‐ economic, detailed engineering feasibility study and preparation of bidding documents of the Transafrican 6. Djiboutian Section ‐ Gallafi – Dikhil Section (100 km)
Project title
TECHNICO‐ECONOMIC, DETAILED ENGINEERING FEASIBILITY STUDY AND PREPARATION OF BIDDING DOCUMENTS OF THE TRANSAFRICAN 6. DJIBOUTIAN SECTION – GALLAFI DIKHIL SECTION (100 KM)
Objectives
Strengthening economic exchanges between the countries crossed by the corridor Dakar Djibouti
Quantitative and qualitative improvement of transport infrastructure
Consolidation of the physical and economic integration of the ten countries covered by the Transafricans 5 and 6
Activities
‐ Technical, economic and environmental feasibility study
‐ Detailed engineering design of the variant of the selected development
‐ Bidding documents of the selected variant
Construction period 14 months
Number of lots : 1
Schedule TOR, funding research, selection of Consultant : 2012 and mid‐2013 ‐ Start of studies : Second half of the year 2013
Institution of contracting authority IGAD
Associated institutions General Directorate of Roads
Direct zone of influence The whole population of Djibouti, Somali and Afar Regional State (Ethiopia), actors of the productive sectors, National and international carriers
Results
‐ Reduction in transportation costs
‐ Stimulation of the economic activities’ growth
‐ Development of national, regional et international trade
Monitoring indicators − Rate of progress of the study
Dependent actions / influential actions ‐

Prefeasibility study of the missing links of Final report Dakar – N’djamena and N’djamena ‐ Djibouti links November 2011
STUDI INTERNATIONAL page 206
17.3.12 Technico ‐ economic, detailed engineering feasibility study and preparation of bidding documents of the Transafrican 6. Djiboutian Section ‐ Section MP 71 – MP 12094
Project title
TECHNICO‐ECONOMIC, DETAILED ENGINEERING FEASIBILITY STUDY AND PREPARATION OF BIDDING DOCUMENTS OF THE TRANSAFRICAN 6. DJIBOUTIAN SECTION – SECTION MP 71 – MP 120 (49 KM)
Objectives
Strengthening economic exchanges between the countries crossed by the corridor Dakar Djibouti
Quantitative and qualitative improvement of transport infrastructure
Consolidation of the physical and economic integration of the ten countries covered by the Transafricans 5 and 6
Activities
‐ Technical, economic and environmental feasibility study
‐ Detailed engineering design of the variant of the selected development
‐ Bidding documents of the selected variant
Construction period 9 months
Number of lots : 1
Schedule TOR, funding research, selection of Consultant : 2012 and mid‐2013 ‐ Start of studies : Second half of the year 2013
Institution of contracting authority IGAD
Associated institutions General Directorate of Roads
Direct zone of influence The whole population of Djibouti, Somali and Afar Regional State (Ethiopia), actors of the productive sectors, National and international carriers
Results
‐ Reduction in transportation costs
‐ Stimulation of the economic activities’ growth
‐ Development of national, regional et international trade
Monitoring indicators − Rate of progress of the study
Dependent actions / influential actions ‐
94 This section was not retained as missing link by the SWECO study 2003 but its current state, described as deteriorated, requires its upgrade
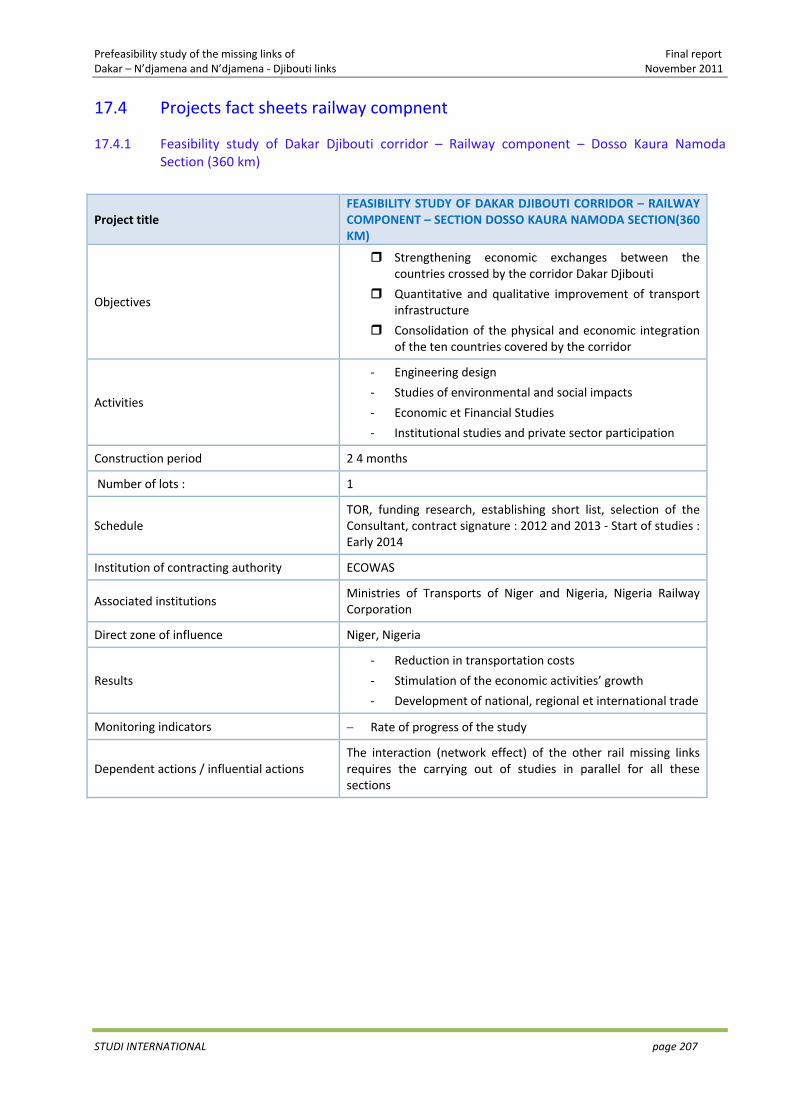
Prefeasibility study of the missing links of Final report Dakar – N’djamena and N’djamena ‐ Djibouti links November 2011
STUDI INTERNATIONAL page 207
17.4 Projects fact sheets railway compnent
17.4.1 Feasibility study of Dakar Djibouti corridor – Railway component – Dosso Kaura Namoda Section (360 km)
Project title FEASIBILITY STUDY OF DAKAR DJIBOUTI CORRIDOR – RAILWAY COMPONENT – SECTION DOSSO KAURA NAMODA SECTION(360 KM)
Objectives
Strengthening economic exchanges between the countries crossed by the corridor Dakar Djibouti
Quantitative and qualitative improvement of transport infrastructure
Consolidation of the physical and economic integration of the ten countries covered by the corridor
Activities
‐ Engineering design
‐ Studies of environmental and social impacts
‐ Economic et Financial Studies
‐ Institutional studies and private sector participation
Construction period 2 4 months
Number of lots : 1
Schedule TOR, funding research, establishing short list, selection of the Consultant, contract signature : 2012 and 2013 ‐ Start of studies : Early 2014
Institution of contracting authority ECOWAS
Associated institutions Ministries of Transports of Niger and Nigeria, Nigeria Railway Corporation
Direct zone of influence Niger, Nigeria
Results
‐ Reduction in transportation costs
‐ Stimulation of the economic activities’ growth
‐ Development of national, regional et international trade
Monitoring indicators − Rate of progress of the study
Dependent actions / influential actions The interaction (network effect) of the other rail missing links requires the carrying out of studies in parallel for all these sections
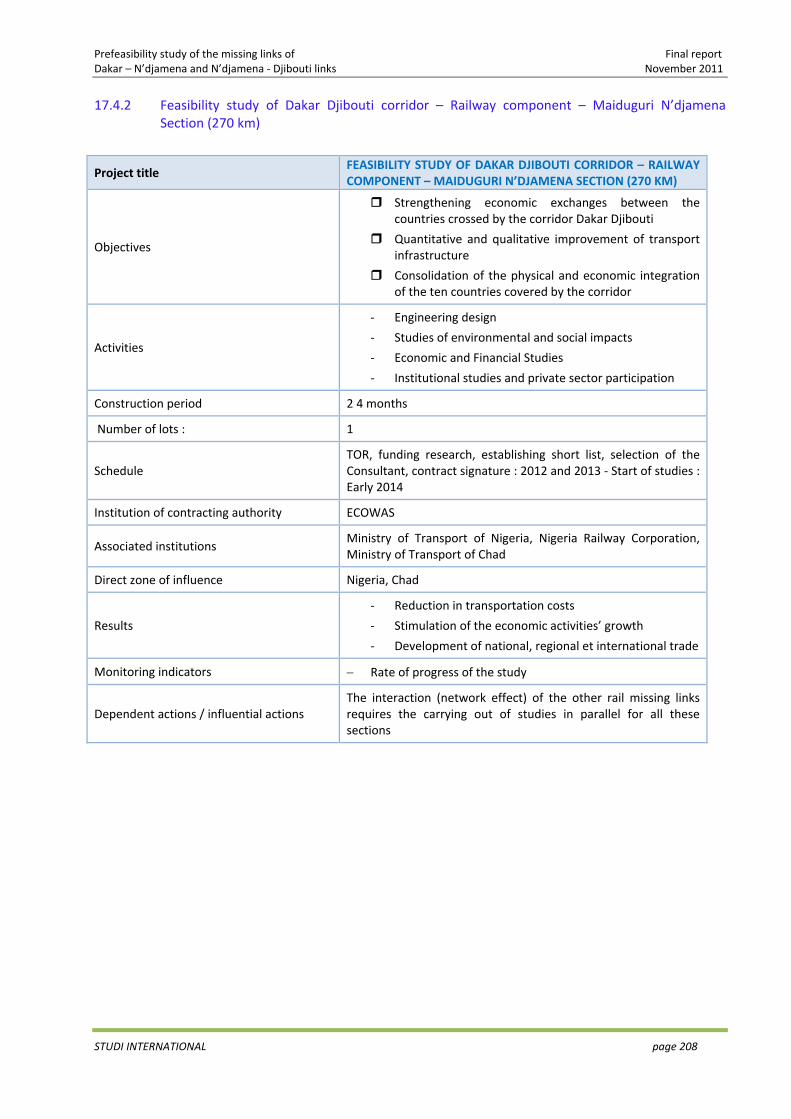
Prefeasibility study of the missing links of Final report Dakar – N’djamena and N’djamena ‐ Djibouti links November 2011
STUDI INTERNATIONAL page 208
17.4.2 Feasibility study of Dakar Djibouti corridor – Railway component – Maiduguri N’djamena Section (270 km)
Project title FEASIBILITY STUDY OF DAKAR DJIBOUTI CORRIDOR – RAILWAY COMPONENT – MAIDUGURI N’DJAMENA SECTION (270 KM)
Objectives
Strengthening economic exchanges between the countries crossed by the corridor Dakar Djibouti
Quantitative and qualitative improvement of transport infrastructure
Consolidation of the physical and economic integration of the ten countries covered by the corridor
Activities
‐ Engineering design
‐ Studies of environmental and social impacts
‐ Economic and Financial Studies
‐ Institutional studies and private sector participation
Construction period 2 4 months
Number of lots : 1
Schedule TOR, funding research, establishing short list, selection of the Consultant, contract signature : 2012 and 2013 ‐ Start of studies : Early 2014
Institution of contracting authority ECOWAS
Associated institutions Ministry of Transport of Nigeria, Nigeria Railway Corporation, Ministry of Transport of Chad
Direct zone of influence Nigeria, Chad
Results
‐ Reduction in transportation costs
‐ Stimulation of the economic activities’ growth
‐ Development of national, regional et international trade
Monitoring indicators − Rate of progress of the study
Dependent actions / influential actions The interaction (network effect) of the other rail missing links requires the carrying out of studies in parallel for all these sections
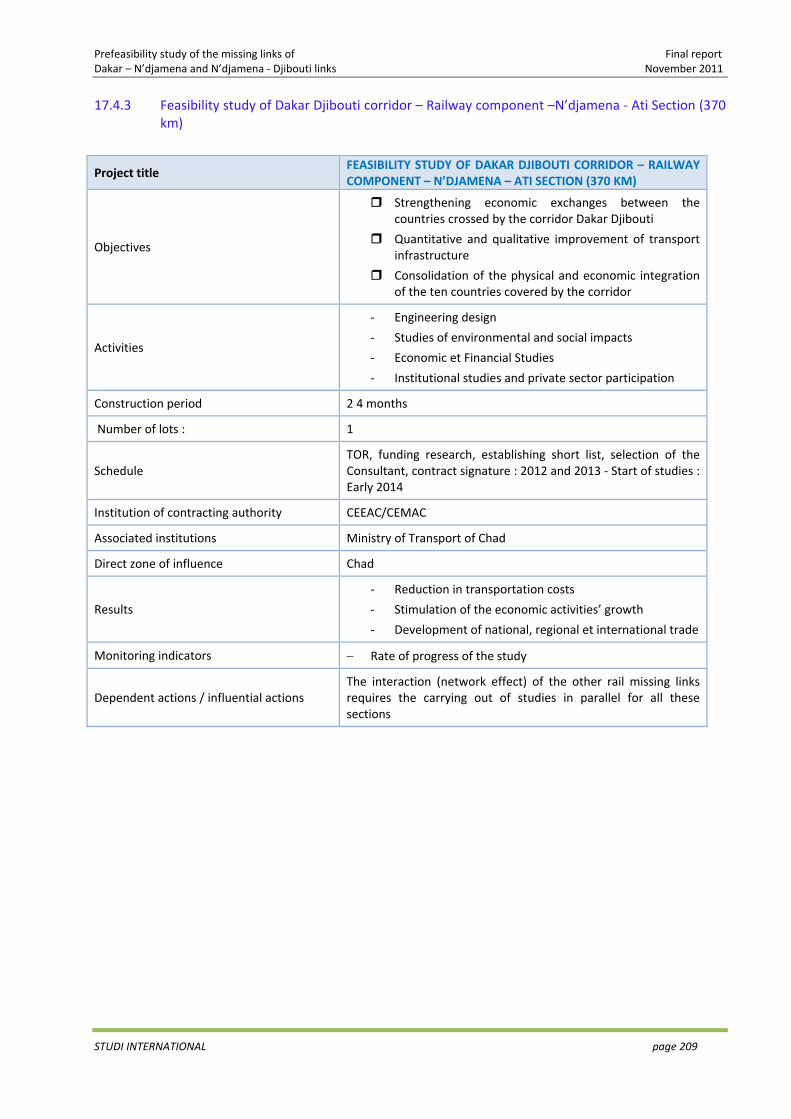
Prefeasibility study of the missing links of Final report Dakar – N’djamena and N’djamena ‐ Djibouti links November 2011
STUDI INTERNATIONAL page 209
17.4.3 Feasibility study of Dakar Djibouti corridor – Railway component –N’djamena ‐ Ati Section (370 km)
Project title FEASIBILITY STUDY OF DAKAR DJIBOUTI CORRIDOR – RAILWAY COMPONENT – N’DJAMENA – ATI SECTION (370 KM)
Objectives
Strengthening economic exchanges between the countries crossed by the corridor Dakar Djibouti
Quantitative and qualitative improvement of transport infrastructure
Consolidation of the physical and economic integration of the ten countries covered by the corridor
Activities
‐ Engineering design
‐ Studies of environmental and social impacts
‐ Economic et Financial Studies
‐ Institutional studies and private sector participation
Construction period 2 4 months
Number of lots : 1
Schedule TOR, funding research, establishing short list, selection of the Consultant, contract signature : 2012 and 2013 ‐ Start of studies : Early 2014
Institution of contracting authority CEEAC/CEMAC
Associated institutions Ministry of Transport of Chad
Direct zone of influence Chad
Results
‐ Reduction in transportation costs
‐ Stimulation of the economic activities’ growth
‐ Development of national, regional et international trade
Monitoring indicators − Rate of progress of the study
Dependent actions / influential actions The interaction (network effect) of the other rail missing links requires the carrying out of studies in parallel for all these sections

Prefeasibility study of the missing links of Final report Dakar – N’djamena and N’djamena ‐ Djibouti links November 2011
STUDI INTERNATIONAL page 210
17.4.4 Feasibility study of Dakar Djibouti corridor – Railway component –Ati Chad border/Sudan Section (440 km)
Project title FEASIBILITY STUDY OF DAKAR DJIBOUTI CORRIDOR – RAILWAY COMPONENT –ATI – CHAD BORDER/SUDAN SECTION (440 KM)
Objectives
Strengthening economic exchanges between the countries crossed by the corridor Dakar Djibouti
Quantitative and qualitative improvement of transport infrastructure
Consolidation of the physical and economic integration of the ten countries covered by the corridor
Activities
‐ Engineering design
‐ Studies of environmental and social impacts
‐ Economic et Financial Studies
‐ Institutional studies and private sector participation
Construction period 2 4 months
Number of lots : 1
Schedule TOR, funding research, establishing short list, selection of the Consultant, contract signature : 2012 and 2013 ‐ Start of studies : Early 2014
Institution of contracting authority CEEAC/CEMAC
Associated institutions Ministry of Transports of Chad/Ministry of Transport of Sudan/ Sudan Railways Corporation
Direct zone of influence Chad, Sudan
Results
‐ Reduction in transportation costs
‐ Stimulation of the economic activities’ growth
‐ Development of national, regional et international trade
Monitoring indicators − Rate of progress of the study
Dependent actions / influential actions The interaction (network effect) of the other rail missing links requires the carrying out of studies in parallel for all these sections
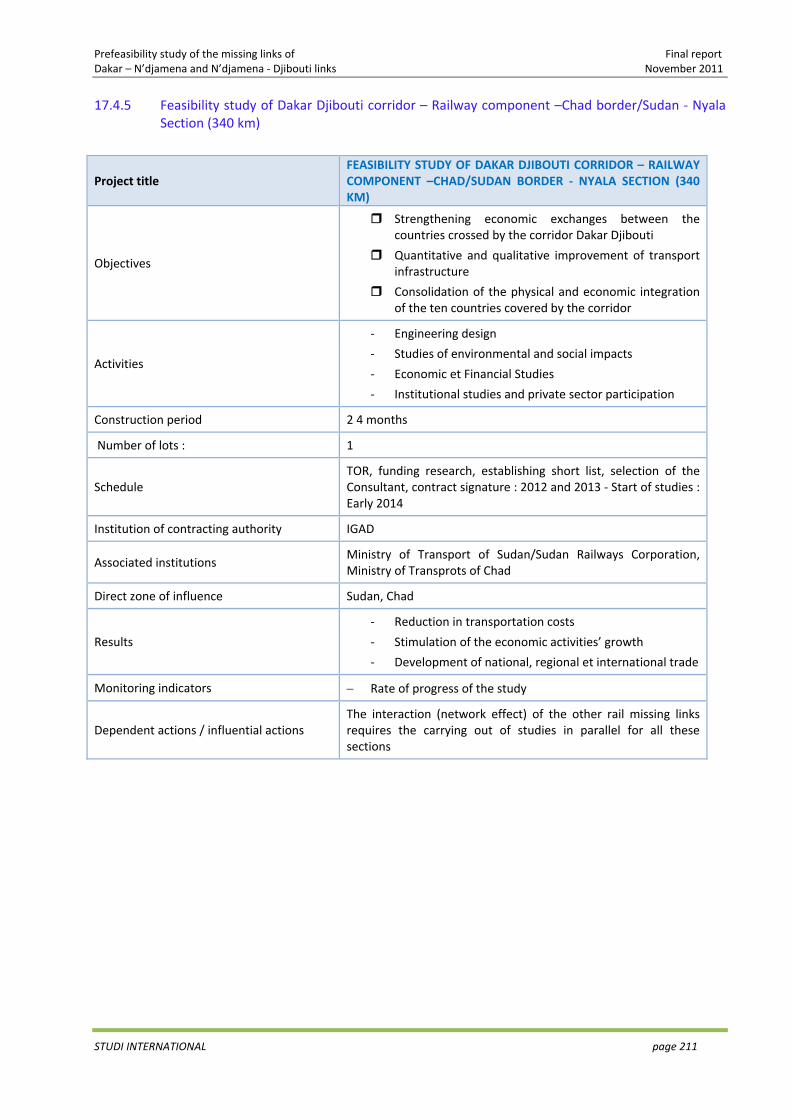
Prefeasibility study of the missing links of Final report Dakar – N’djamena and N’djamena ‐ Djibouti links November 2011
STUDI INTERNATIONAL page 211
17.4.5 Feasibility study of Dakar Djibouti corridor – Railway component –Chad border/Sudan ‐ Nyala Section (340 km)
Project title FEASIBILITY STUDY OF DAKAR DJIBOUTI CORRIDOR – RAILWAY COMPONENT –CHAD/SUDAN BORDER ‐ NYALA SECTION (340 KM)
Objectives
Strengthening economic exchanges between the countries crossed by the corridor Dakar Djibouti
Quantitative and qualitative improvement of transport infrastructure
Consolidation of the physical and economic integration of the ten countries covered by the corridor
Activities
‐ Engineering design
‐ Studies of environmental and social impacts
‐ Economic et Financial Studies
‐ Institutional studies and private sector participation
Construction period 2 4 months
Number of lots : 1
Schedule TOR, funding research, establishing short list, selection of the Consultant, contract signature : 2012 and 2013 ‐ Start of studies : Early 2014
Institution of contracting authority IGAD
Associated institutions Ministry of Transport of Sudan/Sudan Railways Corporation, Ministry of Transprots of Chad
Direct zone of influence Sudan, Chad
Results
‐ Reduction in transportation costs
‐ Stimulation of the economic activities’ growth
‐ Development of national, regional et international trade
Monitoring indicators − Rate of progress of the study
Dependent actions / influential actions The interaction (network effect) of the other rail missing links requires the carrying out of studies in parallel for all these sections
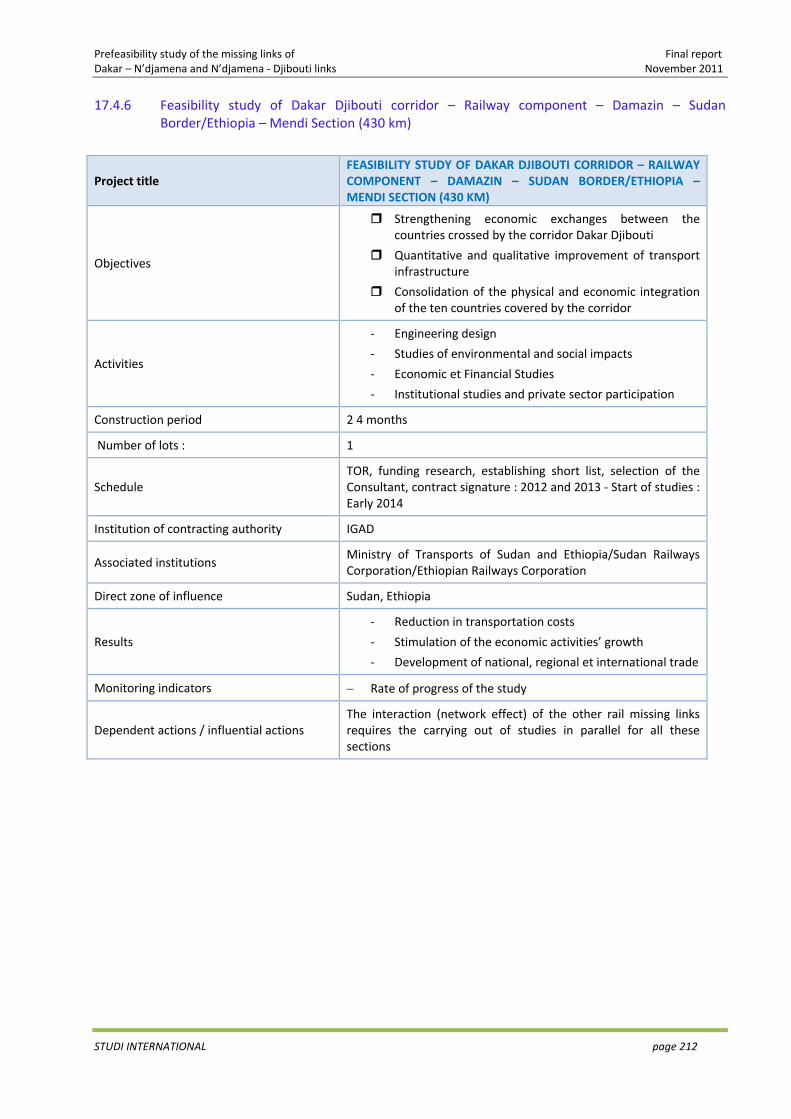
Prefeasibility study of the missing links of Final report Dakar – N’djamena and N’djamena ‐ Djibouti links November 2011
STUDI INTERNATIONAL page 212
17.4.6 Feasibility study of Dakar Djibouti corridor – Railway component – Damazin – Sudan Border/Ethiopia – Mendi Section (430 km)
Project title FEASIBILITY STUDY OF DAKAR DJIBOUTI CORRIDOR – RAILWAY COMPONENT – DAMAZIN – SUDAN BORDER/ETHIOPIA – MENDI SECTION (430 KM)
Objectives
Strengthening economic exchanges between the countries crossed by the corridor Dakar Djibouti
Quantitative and qualitative improvement of transport infrastructure
Consolidation of the physical and economic integration of the ten countries covered by the corridor
Activities
‐ Engineering design
‐ Studies of environmental and social impacts
‐ Economic et Financial Studies
‐ Institutional studies and private sector participation
Construction period 2 4 months
Number of lots : 1
Schedule TOR, funding research, establishing short list, selection of the Consultant, contract signature : 2012 and 2013 ‐ Start of studies : Early 2014
Institution of contracting authority IGAD
Associated institutions Ministry of Transports of Sudan and Ethiopia/Sudan Railways Corporation/Ethiopian Railways Corporation
Direct zone of influence Sudan, Ethiopia
Results
‐ Reduction in transportation costs
‐ Stimulation of the economic activities’ growth
‐ Development of national, regional et international trade
Monitoring indicators − Rate of progress of the study
Dependent actions / influential actions The interaction (network effect) of the other rail missing links requires the carrying out of studies in parallel for all these sections
Prefeasibility study of the missing links of Final report Dakar – N’djamena and N’djamena ‐ Djibouti links November 2011
STUDI INTERNATIONAL page 213
17.4.7 Feasibility study of Dakar Djibouti corridor – Railway component –Mendi – Addis Abeba Section (420 km)
Project title FEASIBILITY STUDY OF DAKAR DJIBOUTI CORRIDOR – RAILWAY COMPONENT –MENDI ADDIS ABEBA SECTION (420 KM)
Objectives
Strengthening economic exchanges between the countries crossed by the corridor Dakar Djibouti
Quantitative and qualitative improvement of transport infrastructure
Consolidation of the physical and economic integration of the ten countries covered by the corridor
Activities
‐ Engineering design
‐ Studies of environmental and social impacts
‐ Economic et Financial Studies
‐ Institutional studies and private sector participation
Construction period 2 4 months
Number of lots : 1
Schedule TOR, funding research, establishing short list, selection of the Consultant, contract signature : 2012 and 2013 ‐ Start of studies : Early 2014
Institution of contracting authority IGAD
Associated institutions Ministry of Transports of Ethiopia/ Ethiopian Railways Corporation
Direct zone of influence Ethiopia, Sudan
Results
‐ Reduction in transportation costs
‐ Stimulation of the economic activities’ growth
‐ Development of national, regional et international trade
Monitoring indicators − Rate of progress of the study
Dependent actions / influential actions The interaction (network effect) of the other rail missing links requires the carrying out of studies in parallel for all these sections

Prefeasibility study of the missing links of Final report Dakar – N’djamena and N’djamena ‐ Djibouti links November 2011
STUDI INTERNATIONAL page 214
17.5 Profitability indicators road component
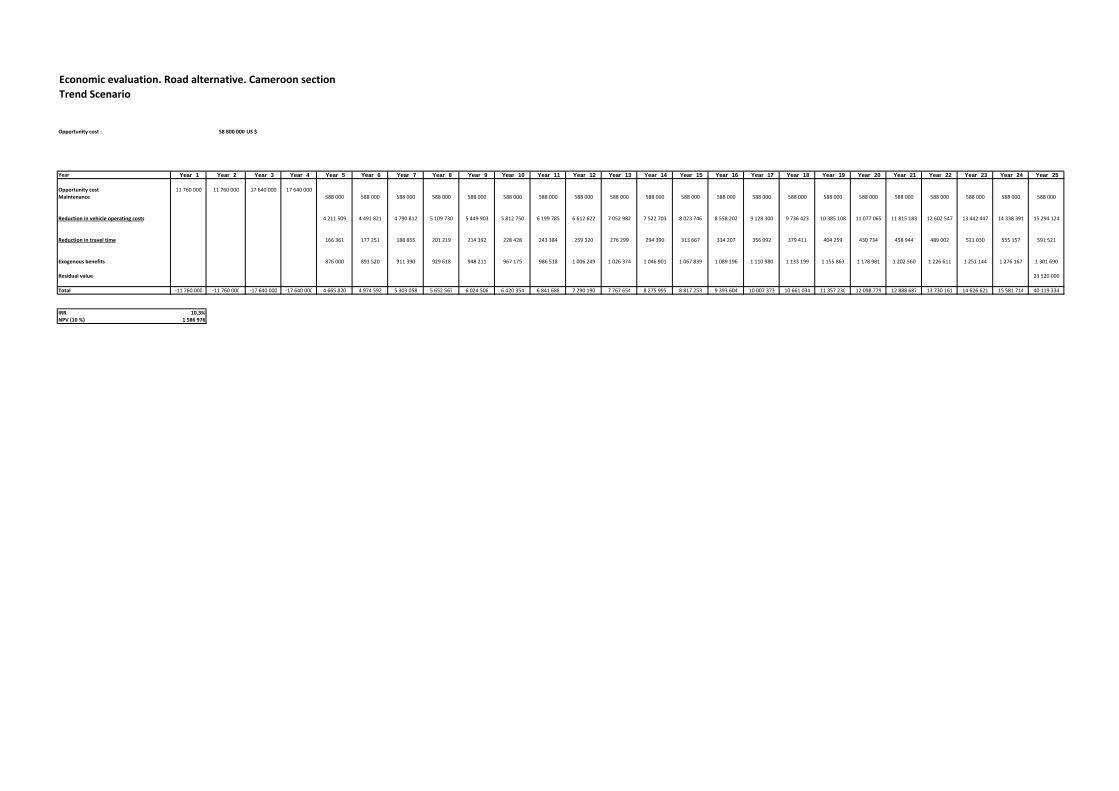
Economic evaluation. Road alternative. Cameroon sectionTrend Scenario
Opportunity cost : 58 800 000 US $ 1 1
Year Year 1 Year 2 Year 3 Year 4 Year 5 Year 6 Year 7 Year 8 Year 9 Year 10 Year 11 Year 12 Year 13 Year 14 Year 15 Year 16 Year 17 Year 18 Year 19 Year 20 Year 21 Year 22 Year 23 Year 24 Year 25
Opportunity cost 11 760 000 11 760 000 17 640 000 17 640 000Maintenance 588 000 588 000 588 000 588 000 588 000 588 000 588 000 588 000 588 000 588 000 588 000 588 000 588 000 588 000 588 000 588 000 588 000 588 000 588 000 588 000 588 000
Reduction in vehicle operating costs 4 211 509 4 491 821 4 790 812 5 109 730 5 449 903 5 812 750 6 199 785 6 612 622 7 052 982 7 522 703 8 023 746 8 558 202 9 128 300 9 736 423 10 385 108 11 077 065 11 815 183 12 602 547 13 442 447 14 338 391 15 294 124
Reduction in travel time 166 361 177 251 188 855 201 219 214 392 228 428 243 384 259 320 276 299 294 390 313 667 334 207 356 092 379 411 404 259 430 734 458 944 489 002 521 030 555 157 591 521
Exogenous benefits 876 000 893 520 911 390 929 618 948 211 967 175 986 518 1 006 249 1 026 374 1 046 901 1 067 839 1 089 196 1 110 980 1 133 199 1 155 863 1 178 981 1 202 560 1 226 611 1 251 144 1 276 167 1 301 690
Residual value 23 520 000
Total ‐11 760 000 ‐11 760 000 ‐17 640 000 ‐17 640 000 4 665 870 4 974 592 5 303 058 5 652 567 6 024 506 6 420 354 6 841 688 7 290 190 7 767 654 8 275 995 8 817 253 9 393 604 10 007 373 10 661 034 11 357 230 12 098 779 12 888 687 13 730 161 14 626 621 15 581 714 40 119 334
IRR 10,3%NPV (10 %) 1 586 976
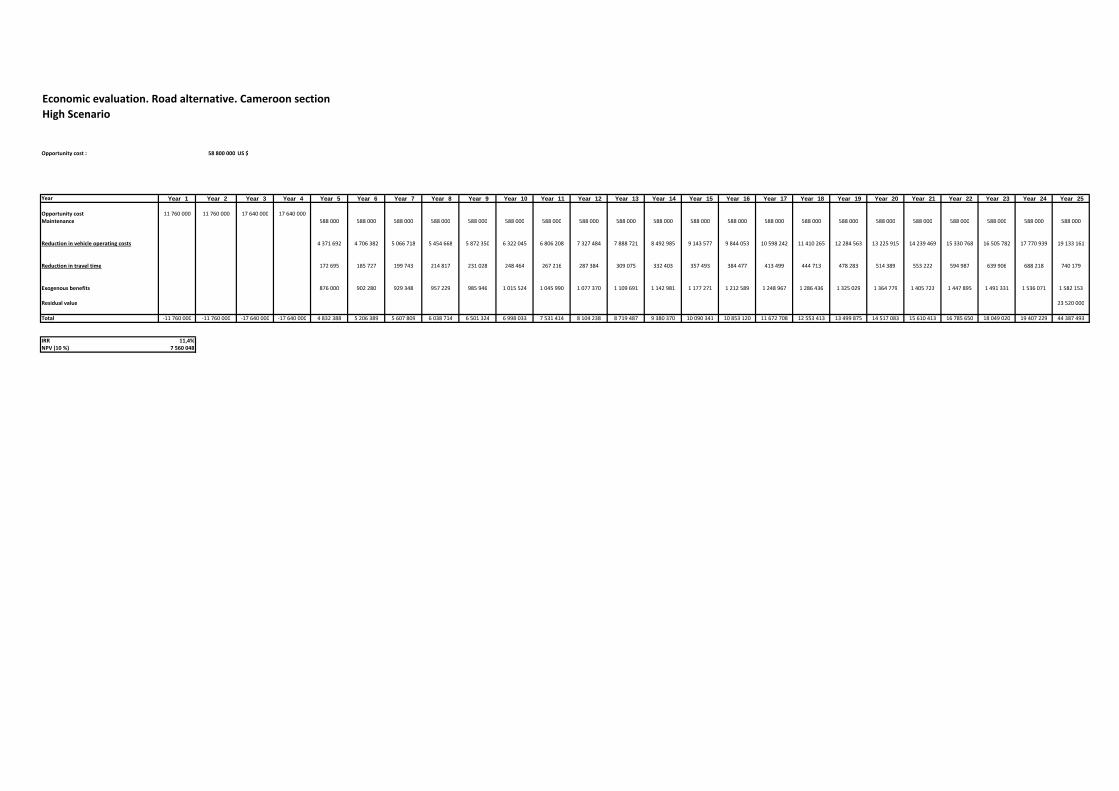
Economic evaluation. Road alternative. Cameroon sectionHigh Scenario
Opportunity cost : 58 800 000 US $ 1 1
Year Year 1 Year 2 Year 3 Year 4 Year 5 Year 6 Year 7 Year 8 Year 9 Year 10 Year 11 Year 12 Year 13 Year 14 Year 15 Year 16 Year 17 Year 18 Year 19 Year 20 Year 21 Year 22 Year 23 Year 24 Year 25
Opportunity cost 11 760 000 11 760 000 17 640 000 17 640 000Maintenance 588 000 588 000 588 000 588 000 588 000 588 000 588 000 588 000 588 000 588 000 588 000 588 000 588 000 588 000 588 000 588 000 588 000 588 000 588 000 588 000 588 000
Reduction in vehicle operating costs 4 371 692 4 706 382 5 066 718 5 454 668 5 872 350 6 322 045 6 806 208 7 327 484 7 888 721 8 492 985 9 143 577 9 844 053 10 598 242 11 410 265 12 284 563 13 225 915 14 239 469 15 330 768 16 505 782 17 770 939 19 133 161
Reduction in travel time 172 695 185 727 199 743 214 817 231 028 248 464 267 216 287 384 309 075 332 403 357 493 384 477 413 499 444 713 478 283 514 389 553 222 594 987 639 906 688 218 740 179
Exogenous benefits 876 000 902 280 929 348 957 229 985 946 1 015 524 1 045 990 1 077 370 1 109 691 1 142 981 1 177 271 1 212 589 1 248 967 1 286 436 1 325 029 1 364 779 1 405 723 1 447 895 1 491 331 1 536 071 1 582 153
Residual value 23 520 000
Total ‐11 760 000 ‐11 760 000 ‐17 640 000 ‐17 640 000 4 832 388 5 206 389 5 607 809 6 038 714 6 501 324 6 998 033 7 531 414 8 104 238 8 719 487 9 380 370 10 090 341 10 853 120 11 672 708 12 553 413 13 499 875 14 517 083 15 610 413 16 785 650 18 049 020 19 407 229 44 387 493
IRR 11,4%NPV (10 %) 7 560 048
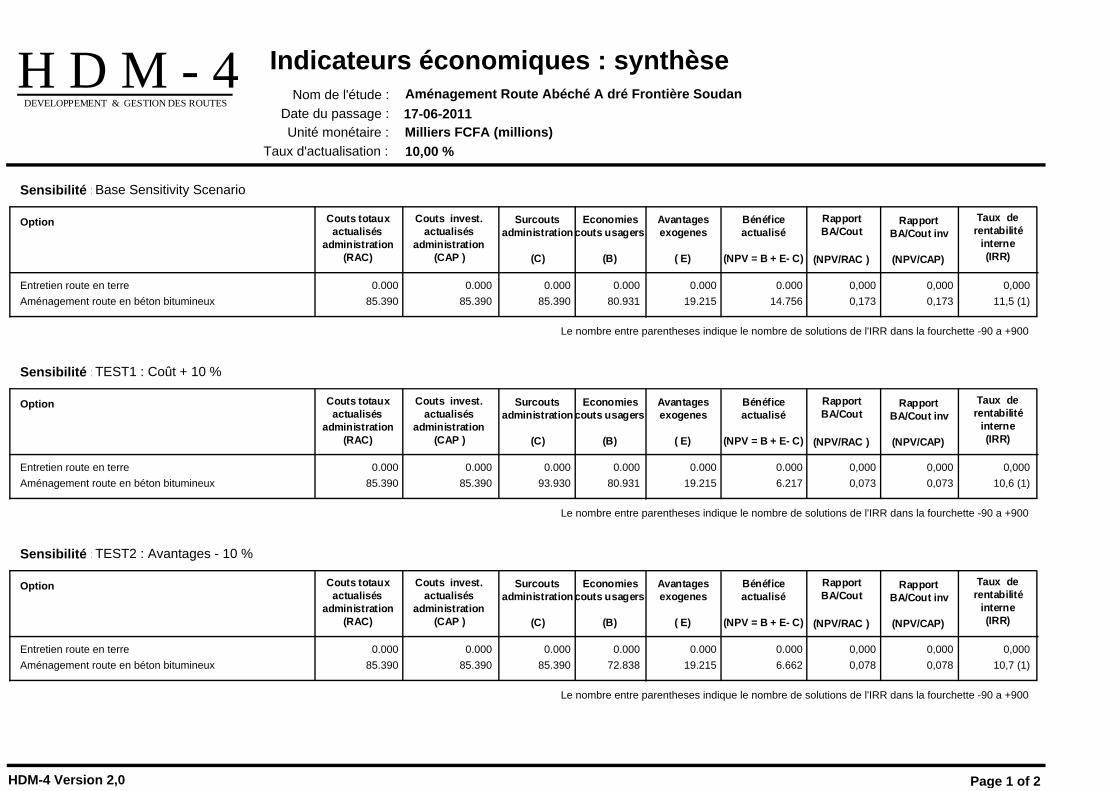
Indicateurs économiques : synthèseNom de l'étude : Aménagement Route Abéché A dré Frontière Soudan
Date du passage : 17-06-2011Milliers FCFA (millions)
H D M - 4DEVELOPPEMENT & GESTION DES ROUTES
10,00 %Unité monétaire :
Taux d'actualisation :
Option
Base Sensitivity ScenarioSensibilité :
Couts totauxactualisés
administration(RAC)
Couts invest.actualisés
administration(CAP )
Surcoutsadministration
(C)
Economiescouts usagers
(B)
Avantagesexogenes
( E)
Bénéficeactualisé
(NPV = B + E- C)
RapportBA/Cout
(NPV/RAC )
RapportBA/Cout inv
(NPV/CAP)
Taux derentabilité
interne(IRR)
0.000Entretien route en terre 0.000 0.000 0.000 0,000 0,000 0,0000.0000.00085.390Aménagement route en béton bitumineux 80.931 19.215 14.756 0,173 0,173 11,5 (1)85.39085.390
Le nombre entre parentheses indique le nombre de solutions de l'IRR dans la fourchette -90 a +900
Option
TEST1 : Coût + 10 %Sensibilité :
Couts totauxactualisés
administration(RAC)
Couts invest.actualisés
administration(CAP )
Surcoutsadministration
(C)
Economiescouts usagers
(B)
Avantagesexogenes
( E)
Bénéficeactualisé
(NPV = B + E- C)
RapportBA/Cout
(NPV/RAC )
RapportBA/Cout inv
(NPV/CAP)
Taux derentabilité
interne(IRR)
0.000Entretien route en terre 0.000 0.000 0.000 0,000 0,000 0,0000.0000.00085.390Aménagement route en béton bitumineux 80.931 19.215 6.217 0,073 0,073 10,6 (1)93.93085.390
Le nombre entre parentheses indique le nombre de solutions de l'IRR dans la fourchette -90 a +900
Option
TEST2 : Avantages - 10 %Sensibilité :
Couts totauxactualisés
administration(RAC)
Couts invest.actualisés
administration(CAP )
Surcoutsadministration
(C)
Economiescouts usagers
(B)
Avantagesexogenes
( E)
Bénéficeactualisé
(NPV = B + E- C)
RapportBA/Cout
(NPV/RAC )
RapportBA/Cout inv
(NPV/CAP)
Taux derentabilité
interne(IRR)
0.000Entretien route en terre 0.000 0.000 0.000 0,000 0,000 0,0000.0000.00085.390Aménagement route en béton bitumineux 72.838 19.215 6.662 0,078 0,078 10,7 (1)85.39085.390
Le nombre entre parentheses indique le nombre de solutions de l'IRR dans la fourchette -90 a +900
Page 1 of 2HDM-4 Version 2,0
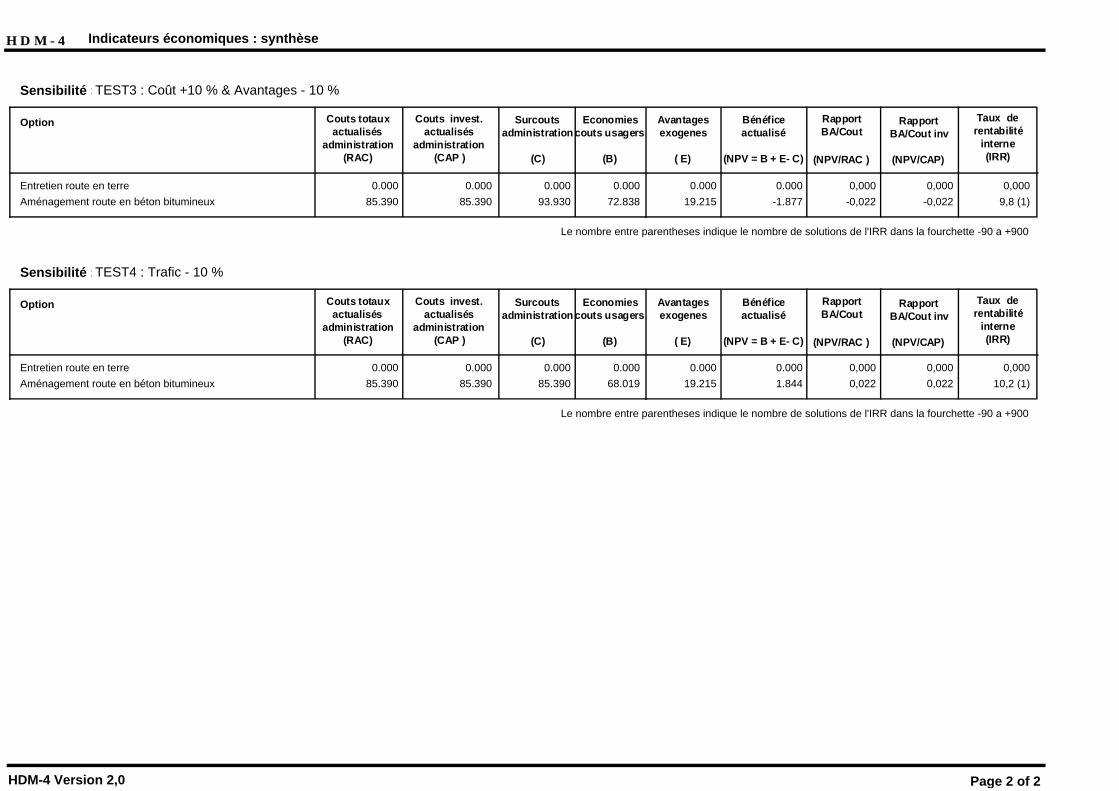
H D M - 4 Indicateurs économiques : synthèse
Option
TEST3 : Coût +10 % & Avantages - 10 %Sensibilité :
Couts totauxactualisés
administration(RAC)
Couts invest.actualisés
administration(CAP )
Surcoutsadministration
(C)
Economiescouts usagers
(B)
Avantagesexogenes
( E)
Bénéficeactualisé
(NPV = B + E- C)
RapportBA/Cout
(NPV/RAC )
RapportBA/Cout inv
(NPV/CAP)
Taux derentabilité
interne(IRR)
0.000Entretien route en terre 0.000 0.000 0.000 0,000 0,000 0,0000.0000.00085.390Aménagement route en béton bitumineux 72.838 19.215 -1.877 -0,022 -0,022 9,8 (1)93.93085.390
Le nombre entre parentheses indique le nombre de solutions de l'IRR dans la fourchette -90 a +900
Option
TEST4 : Trafic - 10 %Sensibilité :
Couts totauxactualisés
administration(RAC)
Couts invest.actualisés
administration(CAP )
Surcoutsadministration
(C)
Economiescouts usagers
(B)
Avantagesexogenes
( E)
Bénéficeactualisé
(NPV = B + E- C)
RapportBA/Cout
(NPV/RAC )
RapportBA/Cout inv
(NPV/CAP)
Taux derentabilité
interne(IRR)
0.000Entretien route en terre 0.000 0.000 0.000 0,000 0,000 0,0000.0000.00085.390Aménagement route en béton bitumineux 68.019 19.215 1.844 0,022 0,022 10,2 (1)85.39085.390
Le nombre entre parentheses indique le nombre de solutions de l'IRR dans la fourchette -90 a +900
Page 2 of 2HDM-4 Version 2,0
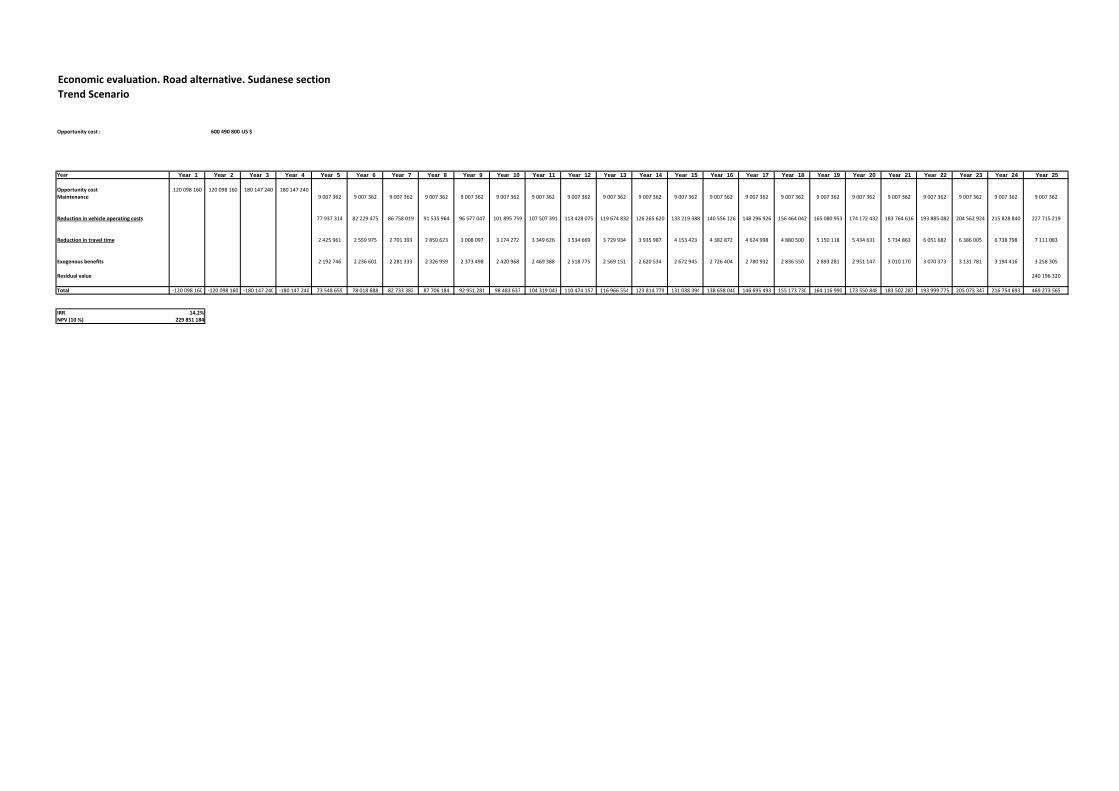
Economic evaluation. Road alternative. Sudanese sectionTrend Scenario
Opportunity cost : 600 490 800 US $ 1 1
Year Year 1 Year 2 Year 3 Year 4 Year 5 Year 6 Year 7 Year 8 Year 9 Year 10 Year 11 Year 12 Year 13 Year 14 Year 15 Year 16 Year 17 Year 18 Year 19 Year 20 Year 21 Year 22 Year 23 Year 24 Year 25
Opportunity cost 120 098 160 120 098 160 180 147 240 180 147 240Maintenance 9 007 362 9 007 362 9 007 362 9 007 362 9 007 362 9 007 362 9 007 362 9 007 362 9 007 362 9 007 362 9 007 362 9 007 362 9 007 362 9 007 362 9 007 362 9 007 362 9 007 362 9 007 362 9 007 362 9 007 362 9 007 362
Reduction in vehicle operating costs 77 937 314 82 229 475 86 758 019 91 535 964 96 577 047 101 895 759 107 507 391 113 428 075 119 674 832 126 265 620 133 219 388 140 556 126 148 296 926 156 464 042 165 080 953 174 172 432 183 764 616 193 885 082 204 562 924 215 828 840 227 715 219
Reduction in travel time 2 425 961 2 559 975 2 701 393 2 850 623 3 008 097 3 174 272 3 349 626 3 534 669 3 729 934 3 935 987 4 153 423 4 382 872 4 624 998 4 880 500 5 150 118 5 434 631 5 734 863 6 051 682 6 386 005 6 738 798 7 111 083
Exogenous benefits 2 192 746 2 236 601 2 281 333 2 326 959 2 373 498 2 420 968 2 469 388 2 518 775 2 569 151 2 620 534 2 672 945 2 726 404 2 780 932 2 836 550 2 893 281 2 951 147 3 010 170 3 070 373 3 131 781 3 194 416 3 258 305
Residual value 240 196 320
Total ‐120 098 160 ‐120 098 160 ‐180 147 240 ‐180 147 240 73 548 659 78 018 688 82 733 382 87 706 184 92 951 281 98 483 637 104 319 043 110 474 157 116 966 554 123 814 779 131 038 394 138 658 040 146 695 493 155 173 730 164 116 990 173 550 848 183 502 287 193 999 775 205 073 347 216 754 693 469 273 565
IRR 14,2%NPV (10 %) 229 851 184
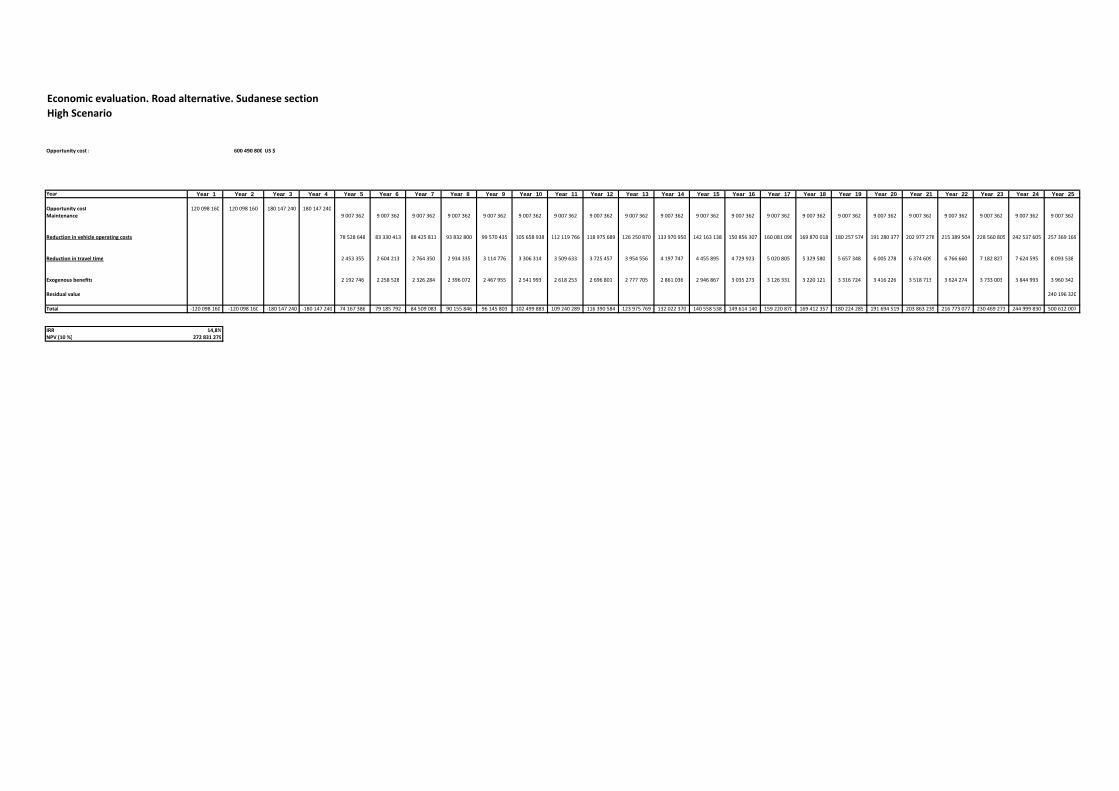
Economic evaluation. Road alternative. Sudanese sectionHigh Scenario
Opportunity cost : 600 490 800 US $ 1 1
Year Year 1 Year 2 Year 3 Year 4 Year 5 Year 6 Year 7 Year 8 Year 9 Year 10 Year 11 Year 12 Year 13 Year 14 Year 15 Year 16 Year 17 Year 18 Year 19 Year 20 Year 21 Year 22 Year 23 Year 24 Year 25
Opportunity cost 120 098 160 120 098 160 180 147 240 180 147 240Maintenance 9 007 362 9 007 362 9 007 362 9 007 362 9 007 362 9 007 362 9 007 362 9 007 362 9 007 362 9 007 362 9 007 362 9 007 362 9 007 362 9 007 362 9 007 362 9 007 362 9 007 362 9 007 362 9 007 362 9 007 362 9 007 362
Reduction in vehicle operating costs 78 528 648 83 330 413 88 425 811 93 832 800 99 570 435 105 658 938 112 119 766 118 975 689 126 250 870 133 970 950 142 163 138 150 856 307 160 081 096 169 870 018 180 257 574 191 280 377 202 977 278 215 389 504 228 560 805 242 537 605 257 369 169
Reduction in travel time 2 453 355 2 604 213 2 764 350 2 934 335 3 114 776 3 306 314 3 509 633 3 725 457 3 954 556 4 197 747 4 455 895 4 729 923 5 020 805 5 329 580 5 657 348 6 005 278 6 374 609 6 766 660 7 182 827 7 624 595 8 093 538
Exogenous benefits 2 192 746 2 258 528 2 326 284 2 396 072 2 467 955 2 541 993 2 618 253 2 696 801 2 777 705 2 861 036 2 946 867 3 035 273 3 126 331 3 220 121 3 316 724 3 416 226 3 518 713 3 624 274 3 733 003 3 844 993 3 960 342
Residual value 240 196 320
Total ‐120 098 160 ‐120 098 160 ‐180 147 240 ‐180 147 240 74 167 386 79 185 792 84 509 083 90 155 846 96 145 803 102 499 883 109 240 289 116 390 584 123 975 769 132 022 370 140 558 538 149 614 140 159 220 870 169 412 357 180 224 285 191 694 519 203 863 239 216 773 077 230 469 273 244 999 830 500 612 007
IRR 14,8%NPV (10 %) 272 831 279
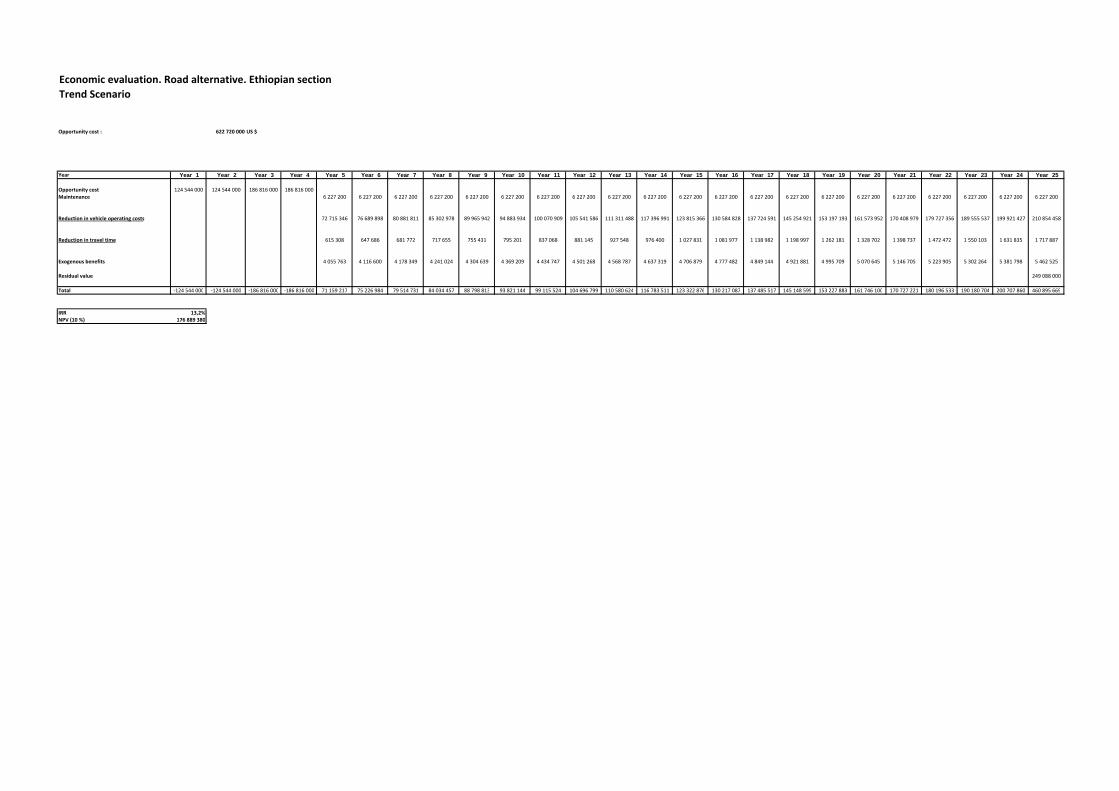
Economic evaluation. Road alternative. Ethiopian sectionTrend Scenario
Opportunity cost : 622 720 000 US $ 1 1
Year Year 1 Year 2 Year 3 Year 4 Year 5 Year 6 Year 7 Year 8 Year 9 Year 10 Year 11 Year 12 Year 13 Year 14 Year 15 Year 16 Year 17 Year 18 Year 19 Year 20 Year 21 Year 22 Year 23 Year 24 Year 25
Opportunity cost 124 544 000 124 544 000 186 816 000 186 816 000Maintenance 6 227 200 6 227 200 6 227 200 6 227 200 6 227 200 6 227 200 6 227 200 6 227 200 6 227 200 6 227 200 6 227 200 6 227 200 6 227 200 6 227 200 6 227 200 6 227 200 6 227 200 6 227 200 6 227 200 6 227 200 6 227 200
Reduction in vehicle operating costs 72 715 346 76 689 898 80 881 811 85 302 978 89 965 942 94 883 934 100 070 909 105 541 586 111 311 488 117 396 991 123 815 366 130 584 828 137 724 591 145 254 921 153 197 193 161 573 952 170 408 979 179 727 356 189 555 537 199 921 427 210 854 458
Reduction in travel time 615 308 647 686 681 772 717 655 755 431 795 201 837 068 881 145 927 548 976 400 1 027 831 1 081 977 1 138 982 1 198 997 1 262 181 1 328 702 1 398 737 1 472 472 1 550 103 1 631 835 1 717 887
Exogenous benefits 4 055 763 4 116 600 4 178 349 4 241 024 4 304 639 4 369 209 4 434 747 4 501 268 4 568 787 4 637 319 4 706 879 4 777 482 4 849 144 4 921 881 4 995 709 5 070 645 5 146 705 5 223 905 5 302 264 5 381 798 5 462 525
Residual value 249 088 000
Total ‐124 544 000 ‐124 544 000 ‐186 816 000 ‐186 816 000 71 159 217 75 226 984 79 514 731 84 034 457 88 798 813 93 821 144 99 115 524 104 696 799 110 580 624 116 783 511 123 322 876 130 217 087 137 485 517 145 148 599 153 227 883 161 746 100 170 727 221 180 196 533 190 180 704 200 707 860 460 895 669
IRR 13,2%NPV (10 %) 176 889 380
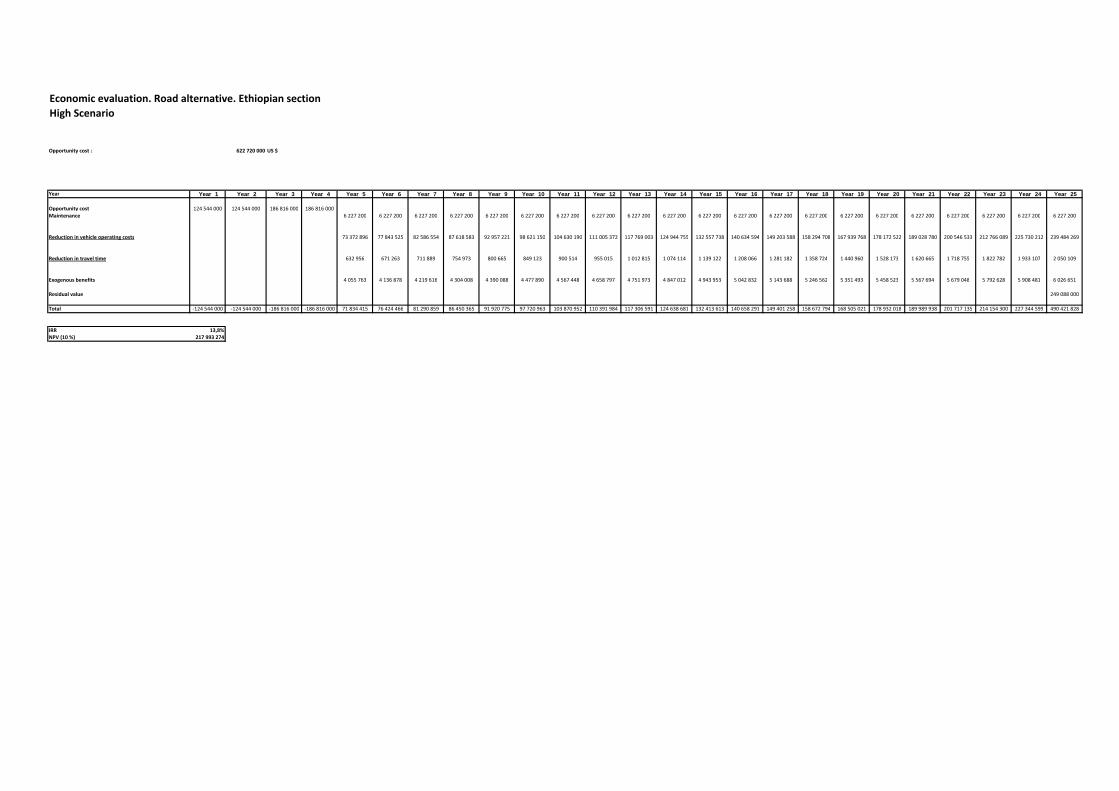
Economic evaluation. Road alternative. Ethiopian sectionHigh Scenario
Opportunity cost : 622 720 000 US $ 1 1
Year Year 1 Year 2 Year 3 Year 4 Year 5 Year 6 Year 7 Year 8 Year 9 Year 10 Year 11 Year 12 Year 13 Year 14 Year 15 Year 16 Year 17 Year 18 Year 19 Year 20 Year 21 Year 22 Year 23 Year 24 Year 25
Opportunity cost 124 544 000 124 544 000 186 816 000 186 816 000Maintenance 6 227 200 6 227 200 6 227 200 6 227 200 6 227 200 6 227 200 6 227 200 6 227 200 6 227 200 6 227 200 6 227 200 6 227 200 6 227 200 6 227 200 6 227 200 6 227 200 6 227 200 6 227 200 6 227 200 6 227 200 6 227 200
Reduction in vehicle operating costs 73 372 896 77 843 525 82 586 554 87 618 583 92 957 221 98 621 150 104 630 190 111 005 372 117 769 003 124 944 755 132 557 738 140 634 594 149 203 588 158 294 708 167 939 768 178 172 522 189 028 780 200 546 533 212 766 089 225 730 212 239 484 269
Reduction in travel time 632 956 671 263 711 889 754 973 800 665 849 123 900 514 955 015 1 012 815 1 074 114 1 139 122 1 208 066 1 281 182 1 358 724 1 440 960 1 528 173 1 620 665 1 718 755 1 822 782 1 933 107 2 050 109
Exogenous benefits 4 055 763 4 136 878 4 219 616 4 304 008 4 390 088 4 477 890 4 567 448 4 658 797 4 751 973 4 847 012 4 943 953 5 042 832 5 143 688 5 246 562 5 351 493 5 458 523 5 567 694 5 679 048 5 792 628 5 908 481 6 026 651
Residual value 249 088 000
Total ‐124 544 000 ‐124 544 000 ‐186 816 000 ‐186 816 000 71 834 415 76 424 466 81 290 859 86 450 365 91 920 775 97 720 963 103 870 952 110 391 984 117 306 591 124 638 681 132 413 613 140 658 291 149 401 258 158 672 794 168 505 021 178 932 018 189 989 938 201 717 135 214 154 300 227 344 599 490 421 828
IRR 13,8%NPV (10 %) 217 993 274
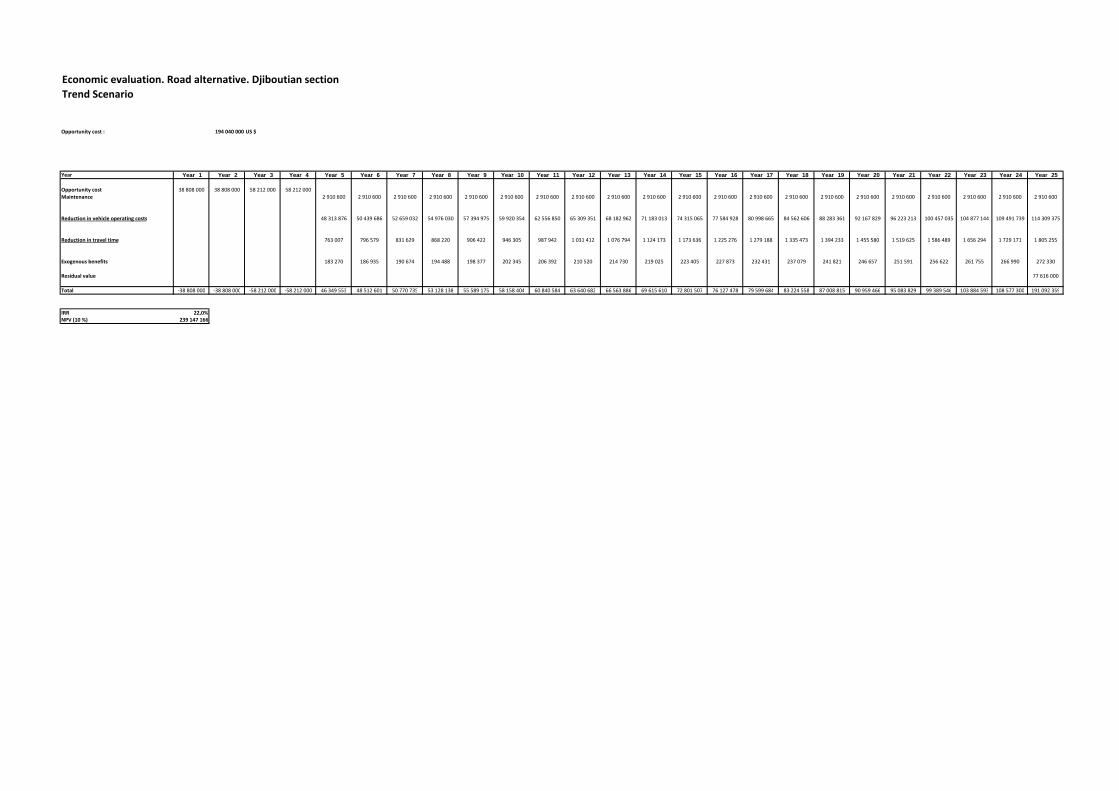
Economic evaluation. Road alternative. Djiboutian sectionTrend Scenario
Opportunity cost : 194 040 000 US $ 1 1
Year Year 1 Year 2 Year 3 Year 4 Year 5 Year 6 Year 7 Year 8 Year 9 Year 10 Year 11 Year 12 Year 13 Year 14 Year 15 Year 16 Year 17 Year 18 Year 19 Year 20 Year 21 Year 22 Year 23 Year 24 Year 25
Opportunity cost 38 808 000 38 808 000 58 212 000 58 212 000Maintenance 2 910 600 2 910 600 2 910 600 2 910 600 2 910 600 2 910 600 2 910 600 2 910 600 2 910 600 2 910 600 2 910 600 2 910 600 2 910 600 2 910 600 2 910 600 2 910 600 2 910 600 2 910 600 2 910 600 2 910 600 2 910 600
Reduction in vehicle operating costs 48 313 876 50 439 686 52 659 032 54 976 030 57 394 975 59 920 354 62 556 850 65 309 351 68 182 962 71 183 013 74 315 065 77 584 928 80 998 665 84 562 606 88 283 361 92 167 829 96 223 213 100 457 035 104 877 144 109 491 739 114 309 375
Reduction in travel time 763 007 796 579 831 629 868 220 906 422 946 305 987 942 1 031 412 1 076 794 1 124 173 1 173 636 1 225 276 1 279 188 1 335 473 1 394 233 1 455 580 1 519 625 1 586 489 1 656 294 1 729 171 1 805 255
Exogenous benefits 183 270 186 935 190 674 194 488 198 377 202 345 206 392 210 520 214 730 219 025 223 405 227 873 232 431 237 079 241 821 246 657 251 591 256 622 261 755 266 990 272 330
Residual value 77 616 000
Total ‐38 808 000 ‐38 808 000 ‐58 212 000 ‐58 212 000 46 349 553 48 512 601 50 770 735 53 128 138 55 589 175 58 158 404 60 840 584 63 640 682 66 563 886 69 615 610 72 801 507 76 127 478 79 599 684 83 224 558 87 008 815 90 959 466 95 083 829 99 389 546 103 884 593 108 577 300 191 092 359
IRR 22,0%NPV (10 %) 239 147 166

Economic evaluation. Road alternative. Djiboutian sectionHigh Scenario
Opportunity cost : 194 040 000 US $ 1 1
Year Year 1 Year 2 Year 3 Year 4 Year 5 Year 6 Year 7 Year 8 Year 9 Year 10 Year 11 Year 12 Year 13 Year 14 Year 15 Year 16 Year 17 Year 18 Year 19 Year 20 Year 21 Year 22 Year 23 Year 24 Year 25
Opportunity cost 38 808 000 38 808 000 58 212 000 58 212 000Maintenance 2 910 600 2 910 600 2 910 600 2 910 600 2 910 600 2 910 600 2 910 600 2 910 600 2 910 600 2 910 600 2 910 600 2 910 600 2 910 600 2 910 600 2 910 600 2 910 600 2 910 600 2 910 600 2 910 600 2 910 600 2 910 600
Reduction in vehicle operating costs 48 761 340 51 494 305 54 380 451 57 428 364 60 647 112 64 046 270 67 635 949 71 426 830 75 430 190 79 657 939 84 122 653 88 837 616 93 816 855 99 075 182 104 628 241 110 492 553 116 685 563 123 225 697 130 132 412 137 426 255 145 128 927
Reduction in travel time 771 265 814 579 860 325 908 640 959 669 1 013 564 1 070 486 1 130 605 1 194 100 1 261 162 1 331 991 1 406 798 1 485 806 1 569 252 1 657 386 1 750 469 1 848 781 1 952 614 2 062 280 2 178 106 2 300 437
Exogenous benefits 183 270 188 768 194 431 200 264 206 272 212 460 218 834 225 399 232 161 239 126 246 300 253 689 261 299 269 138 277 212 285 529 294 095 302 917 312 005 321 365 331 006
Residual value 77 616 000
Total ‐38 808 000 ‐38 808 000 ‐58 212 000 ‐58 212 000 46 805 275 49 587 052 52 524 607 55 626 668 58 902 453 62 361 694 66 014 669 69 872 234 73 945 852 78 247 627 82 790 344 87 587 503 92 653 360 98 002 972 103 652 239 109 617 950 115 917 839 122 570 629 129 596 097 137 015 126 222 465 770
IRR 23,1%NPV (10 %) 283 276 300
Prefeasibility study of the missing links of Final report Dakar – N’djamena and N’djamena ‐ Djibouti links November 2011
STUDI INTERNATIONAL page 215
17.6 Profitability indicators railway component
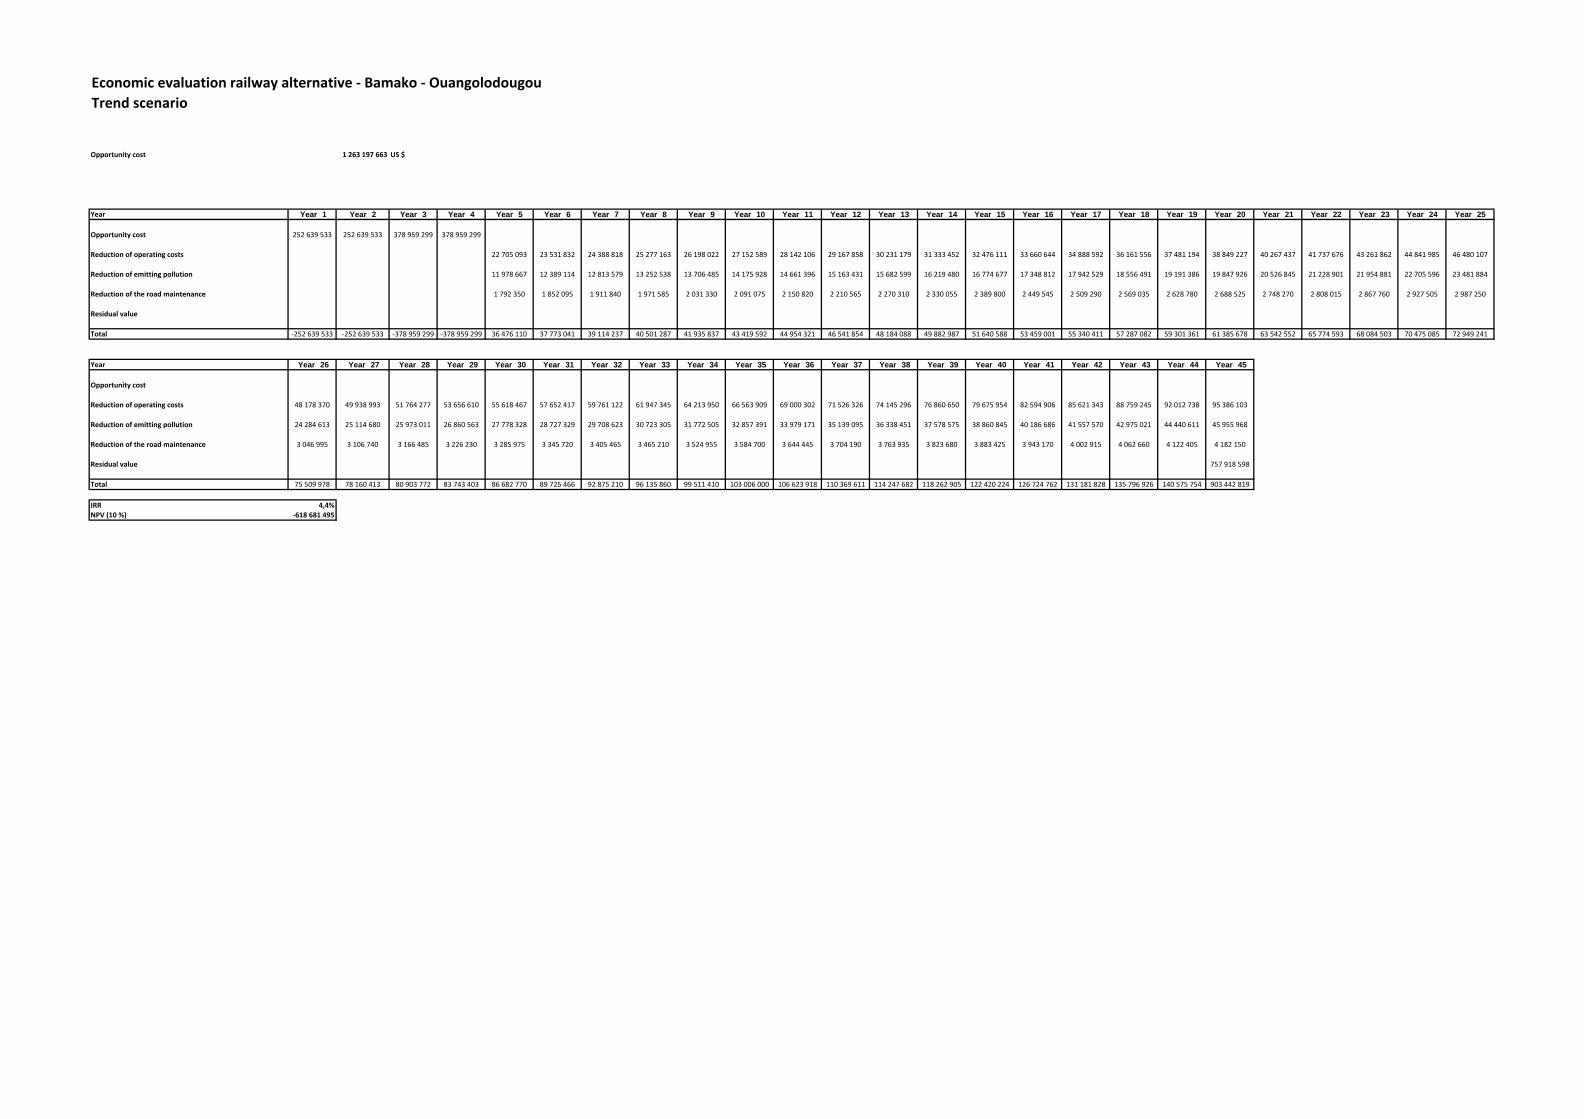
Economic evaluation railway alternative ‐ Bamako ‐ OuangolodougouTrend scenario
Opportunity cost 1 263 197 663 US $ 1 1
Year Year 1 Year 2 Year 3 Year 4 Year 5 Year 6 Year 7 Year 8 Year 9 Year 10 Year 11 Year 12 Year 13 Year 14 Year 15 Year 16 Year 17 Year 18 Year 19 Year 20 Year 21 Year 22 Year 23 Year 24 Year 25
Opportunity cost 252 639 533 252 639 533 378 959 299 378 959 299
Reduction of operating costs 22 705 093 23 531 832 24 388 818 25 277 163 26 198 022 27 152 589 28 142 106 29 167 858 30 231 179 31 333 452 32 476 111 33 660 644 34 888 592 36 161 556 37 481 194 38 849 227 40 267 437 41 737 676 43 261 862 44 841 985 46 480 107
Reduction of emitting pollution 11 978 667 12 389 114 12 813 579 13 252 538 13 706 485 14 175 928 14 661 396 15 163 431 15 682 599 16 219 480 16 774 677 17 348 812 17 942 529 18 556 491 19 191 386 19 847 926 20 526 845 21 228 901 21 954 881 22 705 596 23 481 884
Reduction of the road maintenance 1 792 350 1 852 095 1 911 840 1 971 585 2 031 330 2 091 075 2 150 820 2 210 565 2 270 310 2 330 055 2 389 800 2 449 545 2 509 290 2 569 035 2 628 780 2 688 525 2 748 270 2 808 015 2 867 760 2 927 505 2 987 250
Residual value
Total ‐252 639 533 ‐252 639 533 ‐378 959 299 ‐378 959 299 36 476 110 37 773 041 39 114 237 40 501 287 41 935 837 43 419 592 44 954 321 46 541 854 48 184 088 49 882 987 51 640 588 53 459 001 55 340 411 57 287 082 59 301 361 61 385 678 63 542 552 65 774 593 68 084 503 70 475 085 72 949 241
Year Year 26 Year 27 Year 28 Year 29 Year 30 Year 31 Year 32 Year 33 Year 34 Year 35 Year 36 Year 37 Year 38 Year 39 Year 40 Year 41 Year 42 Year 43 Year 44 Year 45
Opportunity cost
Reduction of operating costs 48 178 370 49 938 993 51 764 277 53 656 610 55 618 467 57 652 417 59 761 122 61 947 345 64 213 950 66 563 909 69 000 302 71 526 326 74 145 296 76 860 650 79 675 954 82 594 906 85 621 343 88 759 245 92 012 738 95 386 103
Reduction of emitting pollution 24 284 613 25 114 680 25 973 011 26 860 563 27 778 328 28 727 329 29 708 623 30 723 305 31 772 505 32 857 391 33 979 171 35 139 095 36 338 451 37 578 575 38 860 845 40 186 686 41 557 570 42 975 021 44 440 611 45 955 968
Reduction of the road maintenance 3 046 995 3 106 740 3 166 485 3 226 230 3 285 975 3 345 720 3 405 465 3 465 210 3 524 955 3 584 700 3 644 445 3 704 190 3 763 935 3 823 680 3 883 425 3 943 170 4 002 915 4 062 660 4 122 405 4 182 150
Residual value 757 918 598
Total 75 509 978 78 160 413 80 903 772 83 743 403 86 682 770 89 725 466 92 875 210 96 135 860 99 511 410 103 006 000 106 623 918 110 369 611 114 247 682 118 262 905 122 420 224 126 724 762 131 181 828 135 796 926 140 575 754 903 442 819
IRR 4,4%NPV (10 %) ‐618 681 495
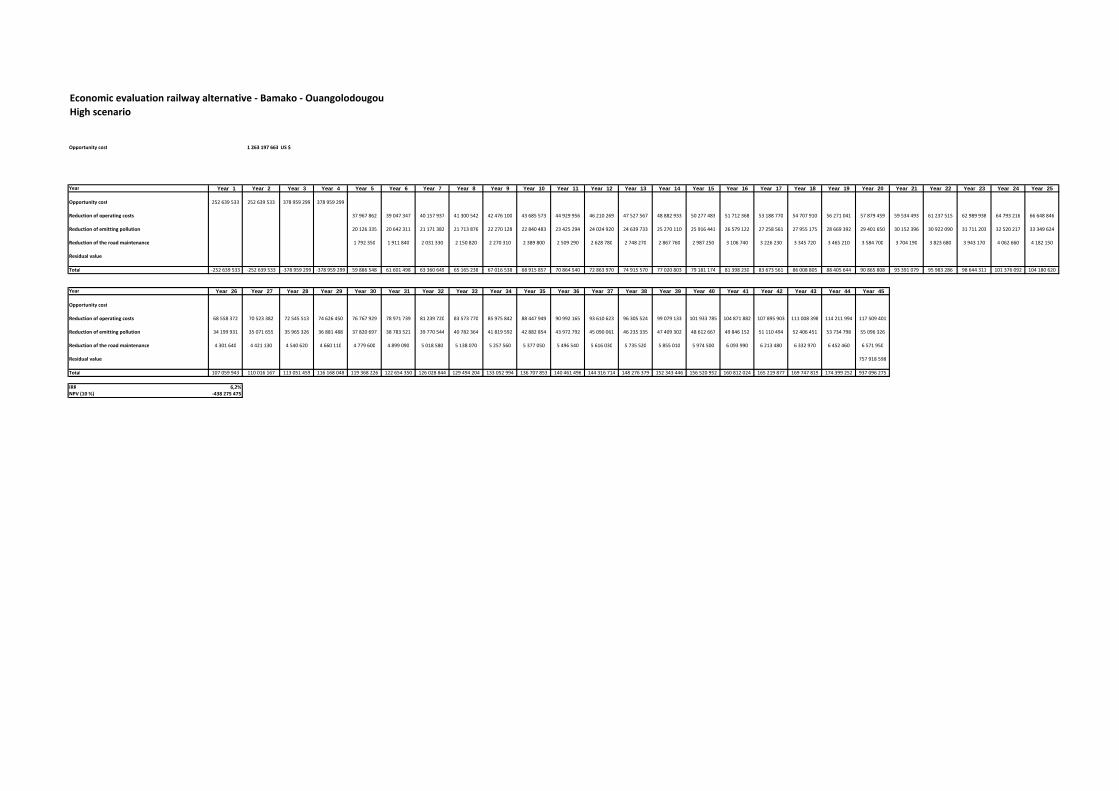
Economic evaluation railway alternative ‐ Bamako ‐ OuangolodougouHigh scenario
Opportunity cost 1 263 197 663 US $ 1 1
Year Year 1 Year 2 Year 3 Year 4 Year 5 Year 6 Year 7 Year 8 Year 9 Year 10 Year 11 Year 12 Year 13 Year 14 Year 15 Year 16 Year 17 Year 18 Year 19 Year 20 Year 21 Year 22 Year 23 Year 24 Year 25
Opportunity cost 252 639 533 252 639 533 378 959 299 378 959 299
Reduction of operating costs 37 967 862 39 047 347 40 157 937 41 300 542 42 476 100 43 685 573 44 929 956 46 210 269 47 527 567 48 882 933 50 277 483 51 712 368 53 188 770 54 707 910 56 271 041 57 879 459 59 534 493 61 237 515 62 989 938 64 793 216 66 648 846
Reduction of emitting pollution 20 126 335 20 642 311 21 171 382 21 713 876 22 270 128 22 840 483 23 425 294 24 024 920 24 639 733 25 270 110 25 916 441 26 579 122 27 258 561 27 955 175 28 669 392 29 401 650 30 152 396 30 922 090 31 711 203 32 520 217 33 349 624
Reduction of the road maintenance 1 792 350 1 911 840 2 031 330 2 150 820 2 270 310 2 389 800 2 509 290 2 628 780 2 748 270 2 867 760 2 987 250 3 106 740 3 226 230 3 345 720 3 465 210 3 584 700 3 704 190 3 823 680 3 943 170 4 062 660 4 182 150
Residual value
Total ‐252 639 533 ‐252 639 533 ‐378 959 299 ‐378 959 299 59 886 548 61 601 498 63 360 649 65 165 238 67 016 538 68 915 857 70 864 540 72 863 970 74 915 570 77 020 803 79 181 174 81 398 230 83 673 561 86 008 805 88 405 644 90 865 808 93 391 079 95 983 286 98 644 311 101 376 092 104 180 620
Year Year 26 Year 27 Year 28 Year 29 Year 30 Year 31 Year 32 Year 33 Year 34 Year 35 Year 36 Year 37 Year 38 Year 39 Year 40 Year 41 Year 42 Year 43 Year 44 Year 45
Opportunity cost
Reduction of operating costs 68 558 372 70 523 382 72 545 513 74 626 450 76 767 929 78 971 739 81 239 720 83 573 770 85 975 842 88 447 949 90 992 165 93 610 623 96 305 524 99 079 133 101 933 785 104 871 882 107 895 903 111 008 398 114 211 994 117 509 401
Reduction of emitting pollution 34 199 931 35 071 655 35 965 326 36 881 488 37 820 697 38 783 521 39 770 544 40 782 364 41 819 592 42 882 854 43 972 792 45 090 061 46 235 335 47 409 302 48 612 667 49 846 152 51 110 494 52 406 451 53 734 798 55 096 326
Reduction of the road maintenance 4 301 640 4 421 130 4 540 620 4 660 110 4 779 600 4 899 090 5 018 580 5 138 070 5 257 560 5 377 050 5 496 540 5 616 030 5 735 520 5 855 010 5 974 500 6 093 990 6 213 480 6 332 970 6 452 460 6 571 950
Residual value 757 918 598
Total 107 059 943 110 016 167 113 051 459 116 168 048 119 368 226 122 654 350 126 028 844 129 494 204 133 052 994 136 707 853 140 461 496 144 316 714 148 276 379 152 343 446 156 520 952 160 812 024 165 219 877 169 747 819 174 399 252 937 096 275
IRR 6,2%NPV (10 %) ‐438 275 475

Economic evaluation railway alternative ‐ Kaya ‐ Dori ‐ NiameyTrend scenario
Opportunity cost 927 688 159 US $ 1 1
Year Year 1 Year 2 Year 3 Year 4 Year 5 Year 6 Year 7 Year 8 Year 9 Year 10 Year 11 Year 12 Year 13 Year 14 Year 15 Year 16 Year 17 Year 18 Year 19 Year 20 Year 21 Year 22 Year 23 Year 24 Year 25
Opportunity cost 185 537 632 185 537 632 278 306 448 278 306 448
Reduction of operating costs 28 772 481 29 348 855 29 939 293 30 544 213 31 164 046 31 799 238 32 450 249 33 117 556 33 801 653 34 503 049 35 222 271 35 959 866 36 716 397 37 492 450 38 288 627 39 105 554 39 943 878 40 804 270 41 687 421 42 594 048 43 524 896
Reduction of emitting pollution 18 300 739 18 552 162 18 806 347 19 063 293 19 323 000 19 585 465 19 850 685 20 118 653 20 389 360 20 662 798 20 938 952 21 217 810 21 499 354 21 783 565 22 070 420 22 359 895 22 651 963 22 946 591 23 243 748 23 543 395 23 845 492
Reduction of the road maintenance 1 250 550 1 292 235 1 333 920 1 375 605 1 417 290 1 458 975 1 500 660 1 542 345 1 584 030 1 625 715 1 667 400 1 709 085 1 750 770 1 792 455 1 834 140 1 875 825 1 917 510 1 959 195 2 000 880 2 042 565 2 084 250
Residual value
Total ‐185 537 632 ‐185 537 632 ‐278 306 448 ‐278 306 448 48 323 770 49 193 252 50 079 560 50 983 111 51 904 336 52 843 678 53 801 594 54 778 554 55 775 043 56 791 561 57 828 624 58 886 761 59 966 522 61 068 469 62 193 187 63 341 274 64 513 351 65 710 056 66 932 049 68 180 008 69 454 637
Year Year 26 Year 27 Year 28 Year 29 Year 30 Year 31 Year 32 Year 33 Year 34 Year 35 Year 36 Year 37 Year 38 Year 39 Year 40 Year 41 Year 42 Year 43 Year 44 Year 45
Opportunity cost
Reduction of operating costs 44 480 730 45 462 349 46 470 573 47 506 258 48 570 284 49 663 567 50 787 053 51 941 722 53 128 589 54 348 706 55 603 161 56 893 083 58 219 639 59 584 040 60 987 540 62 431 437 63 917 077 65 445 853 67 019 211 68 638 648
Reduction of emitting pollution 24 149 994 24 456 854 24 766 019 25 077 433 25 391 036 25 706 762 26 024 540 26 344 297 26 665 952 26 989 419 27 314 606 27 641 417 27 969 747 28 299 487 28 630 519 28 962 719 29 295 956 29 630 090 29 964 975 30 300 453
Reduction of the road maintenance 2 125 935 2 167 620 2 209 305 2 250 990 2 292 675 2 334 360 2 376 045 2 417 730 2 459 415 2 501 100 2 542 785 2 584 470 2 626 155 2 667 840 2 709 525 2 751 210 2 792 895 2 834 580 2 876 265 2 917 950
Residual value 556 612 895
Total 70 756 660 72 086 822 73 445 897 74 834 681 76 253 995 77 704 689 79 187 638 80 703 749 82 253 956 83 839 225 85 460 553 87 118 970 88 815 542 90 551 367 92 327 584 94 145 366 96 005 928 97 910 523 99 860 451 658 469 946
IRR 5,9%NPV (10 %) ‐326 592 474
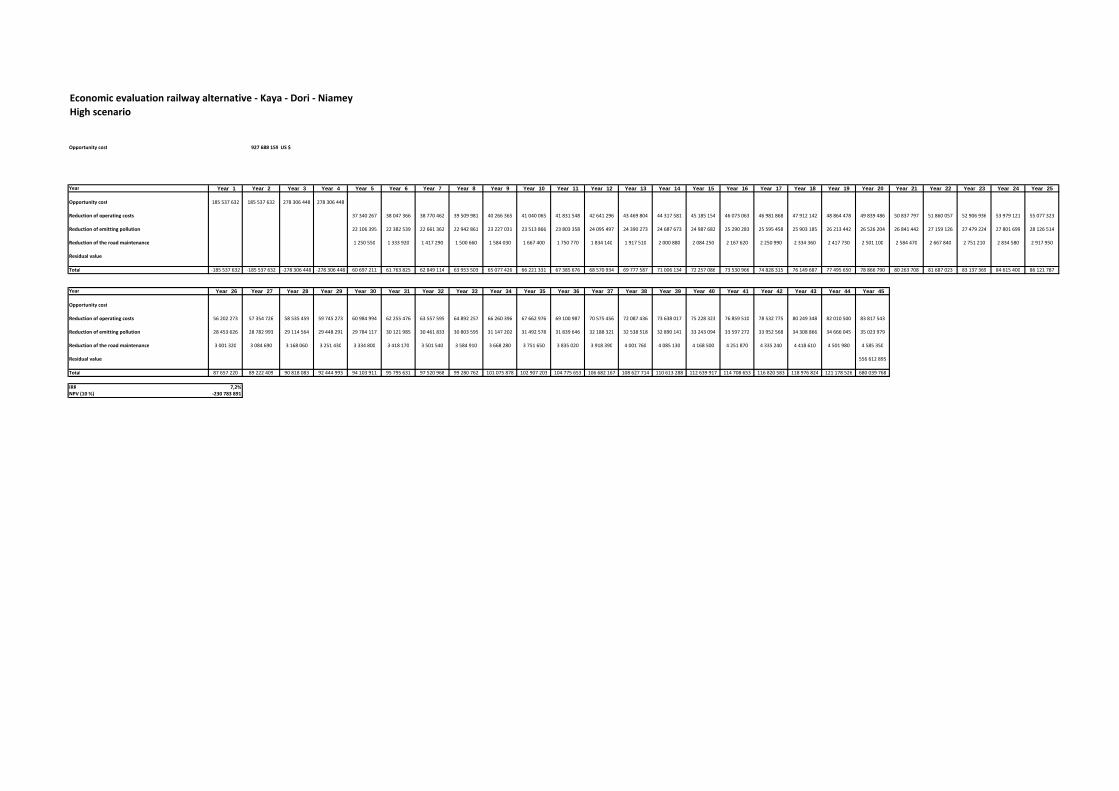
Economic evaluation railway alternative ‐ Kaya ‐ Dori ‐ NiameyHigh scenario
Opportunity cost 927 688 159 US $ 1 1
Year Year 1 Year 2 Year 3 Year 4 Year 5 Year 6 Year 7 Year 8 Year 9 Year 10 Year 11 Year 12 Year 13 Year 14 Year 15 Year 16 Year 17 Year 18 Year 19 Year 20 Year 21 Year 22 Year 23 Year 24 Year 25
Opportunity cost 185 537 632 185 537 632 278 306 448 278 306 448
Reduction of operating costs 37 340 267 38 047 366 38 770 462 39 509 981 40 266 365 41 040 065 41 831 548 42 641 296 43 469 804 44 317 581 45 185 154 46 073 063 46 981 868 47 912 142 48 864 478 49 839 486 50 837 797 51 860 057 52 906 936 53 979 121 55 077 323
Reduction of emitting pollution 22 106 395 22 382 539 22 661 362 22 942 861 23 227 031 23 513 866 23 803 358 24 095 497 24 390 273 24 687 673 24 987 682 25 290 283 25 595 458 25 903 185 26 213 442 26 526 204 26 841 442 27 159 126 27 479 224 27 801 699 28 126 514
Reduction of the road maintenance 1 250 550 1 333 920 1 417 290 1 500 660 1 584 030 1 667 400 1 750 770 1 834 140 1 917 510 2 000 880 2 084 250 2 167 620 2 250 990 2 334 360 2 417 730 2 501 100 2 584 470 2 667 840 2 751 210 2 834 580 2 917 950
Residual value
Total ‐185 537 632 ‐185 537 632 ‐278 306 448 ‐278 306 448 60 697 211 61 763 825 62 849 114 63 953 503 65 077 426 66 221 331 67 385 676 68 570 934 69 777 587 71 006 134 72 257 086 73 530 966 74 828 315 76 149 687 77 495 650 78 866 790 80 263 708 81 687 023 83 137 369 84 615 400 86 121 787
Year Year 26 Year 27 Year 28 Year 29 Year 30 Year 31 Year 32 Year 33 Year 34 Year 35 Year 36 Year 37 Year 38 Year 39 Year 40 Year 41 Year 42 Year 43 Year 44 Year 45
Opportunity cost
Reduction of operating costs 56 202 273 57 354 726 58 535 459 59 745 273 60 984 994 62 255 476 63 557 595 64 892 257 66 260 396 67 662 976 69 100 987 70 575 456 72 087 436 73 638 017 75 228 323 76 859 510 78 532 775 80 249 348 82 010 500 83 817 543
Reduction of emitting pollution 28 453 626 28 782 993 29 114 564 29 448 291 29 784 117 30 121 985 30 461 833 30 803 595 31 147 202 31 492 578 31 839 646 32 188 321 32 538 518 32 890 141 33 243 094 33 597 272 33 952 568 34 308 866 34 666 045 35 023 979
Reduction of the road maintenance 3 001 320 3 084 690 3 168 060 3 251 430 3 334 800 3 418 170 3 501 540 3 584 910 3 668 280 3 751 650 3 835 020 3 918 390 4 001 760 4 085 130 4 168 500 4 251 870 4 335 240 4 418 610 4 501 980 4 585 350
Residual value 556 612 895
Total 87 657 220 89 222 409 90 818 083 92 444 993 94 103 911 95 795 631 97 520 968 99 280 762 101 075 878 102 907 203 104 775 653 106 682 167 108 627 714 110 613 288 112 639 917 114 708 653 116 820 583 118 976 824 121 178 526 680 039 768
IRR 7,2%NPV (10 %) ‐230 783 891
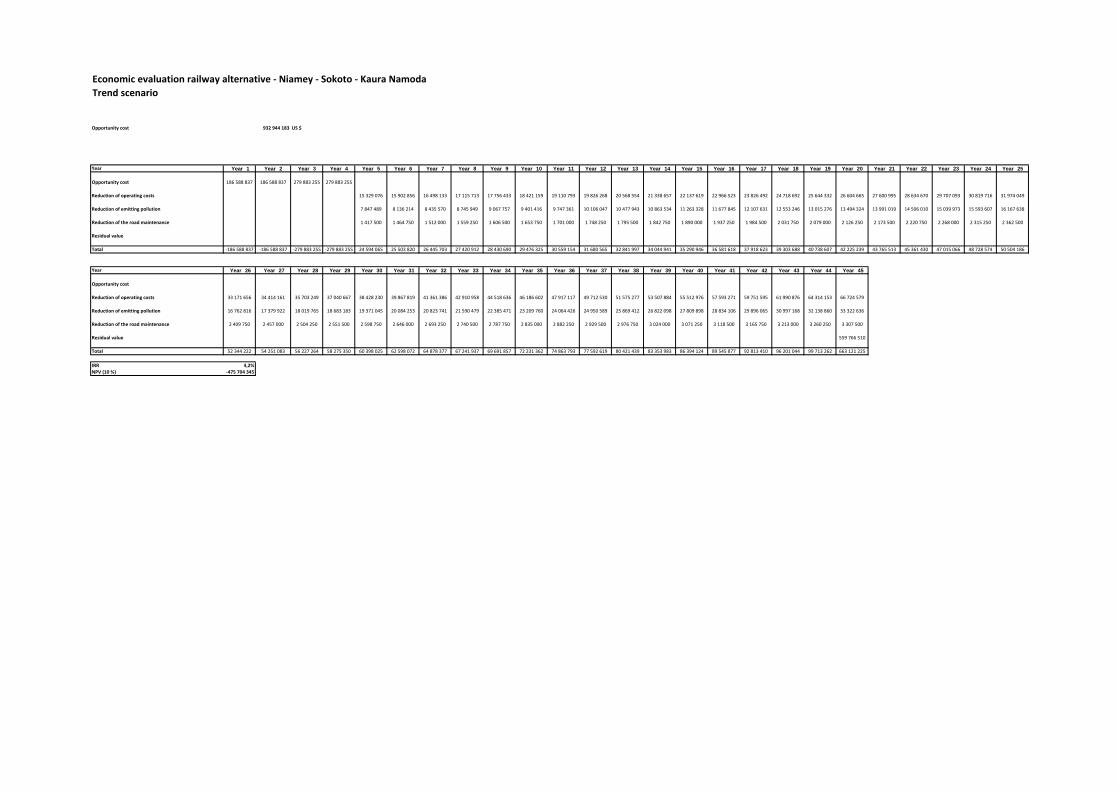
Economic evaluation railway alternative ‐ Niamey ‐ Sokoto ‐ Kaura NamodaTrend scenario
Opportunity cost 932 944 183 US $ 1 1
Year Year 1 Year 2 Year 3 Year 4 Year 5 Year 6 Year 7 Year 8 Year 9 Year 10 Year 11 Year 12 Year 13 Year 14 Year 15 Year 16 Year 17 Year 18 Year 19 Year 20 Year 21 Year 22 Year 23 Year 24 Year 25
Opportunity cost 186 588 837 186 588 837 279 883 255 279 883 255
Reduction of operating costs 15 329 076 15 902 856 16 498 133 17 115 713 17 756 433 18 421 159 19 110 793 19 826 268 20 568 554 21 338 657 22 137 619 22 966 523 23 826 492 24 718 692 25 644 332 26 604 665 27 600 995 28 634 670 29 707 093 30 819 716 31 974 049
Reduction of emitting pollution 7 847 489 8 136 214 8 435 570 8 745 949 9 067 757 9 401 416 9 747 361 10 106 047 10 477 943 10 863 534 11 263 328 11 677 845 12 107 631 12 553 246 13 015 276 13 494 324 13 991 019 14 506 010 15 039 973 15 593 607 16 167 638
Reduction of the road maintenance 1 417 500 1 464 750 1 512 000 1 559 250 1 606 500 1 653 750 1 701 000 1 748 250 1 795 500 1 842 750 1 890 000 1 937 250 1 984 500 2 031 750 2 079 000 2 126 250 2 173 500 2 220 750 2 268 000 2 315 250 2 362 500
Residual value
Total ‐186 588 837 ‐186 588 837 ‐279 883 255 ‐279 883 255 24 594 065 25 503 820 26 445 703 27 420 912 28 430 690 29 476 325 30 559 154 31 680 565 32 841 997 34 044 941 35 290 946 36 581 618 37 918 623 39 303 688 40 738 607 42 225 239 43 765 513 45 361 430 47 015 066 48 728 574 50 504 186
Year Year 26 Year 27 Year 28 Year 29 Year 30 Year 31 Year 32 Year 33 Year 34 Year 35 Year 36 Year 37 Year 38 Year 39 Year 40 Year 41 Year 42 Year 43 Year 44 Year 45
Opportunity cost
Reduction of operating costs 33 171 656 34 414 161 35 703 249 37 040 667 38 428 230 39 867 819 41 361 386 42 910 958 44 518 636 46 186 602 47 917 117 49 712 530 51 575 277 53 507 884 55 512 976 57 593 271 59 751 595 61 990 876 64 314 153 66 724 579
Reduction of emitting pollution 16 762 816 17 379 922 18 019 765 18 683 183 19 371 045 20 084 253 20 823 741 21 590 479 22 385 471 23 209 760 24 064 426 24 950 589 25 869 412 26 822 098 27 809 898 28 834 106 29 896 065 30 997 168 32 138 860 33 322 636
Reduction of the road maintenance 2 409 750 2 457 000 2 504 250 2 551 500 2 598 750 2 646 000 2 693 250 2 740 500 2 787 750 2 835 000 2 882 250 2 929 500 2 976 750 3 024 000 3 071 250 3 118 500 3 165 750 3 213 000 3 260 250 3 307 500
Residual value 559 766 510
Total 52 344 222 54 251 083 56 227 264 58 275 350 60 398 025 62 598 072 64 878 377 67 241 937 69 691 857 72 231 362 74 863 793 77 592 619 80 421 439 83 353 983 86 394 124 89 545 877 92 813 410 96 201 044 99 713 262 663 121 225
IRR 4,2%NPV (10 %) ‐475 704 345
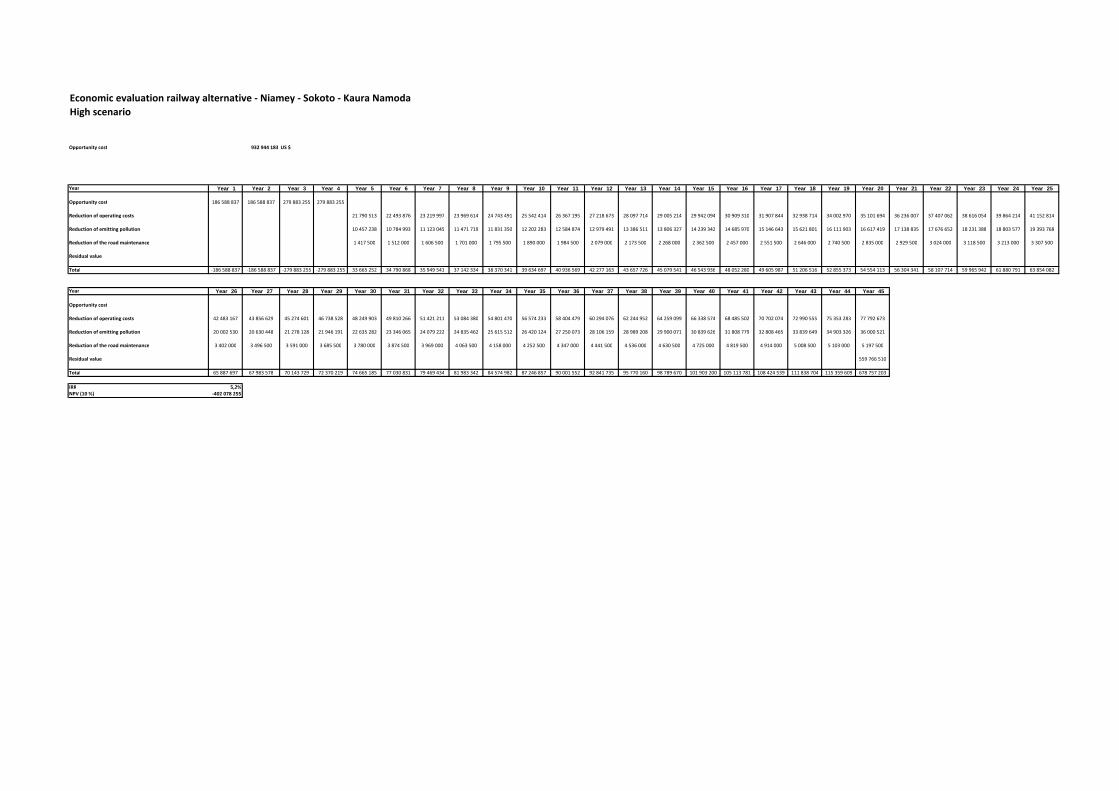
Economic evaluation railway alternative ‐ Niamey ‐ Sokoto ‐ Kaura NamodaHigh scenario
Opportunity cost 932 944 183 US $ 1 1
Year Year 1 Year 2 Year 3 Year 4 Year 5 Year 6 Year 7 Year 8 Year 9 Year 10 Year 11 Year 12 Year 13 Year 14 Year 15 Year 16 Year 17 Year 18 Year 19 Year 20 Year 21 Year 22 Year 23 Year 24 Year 25
Opportunity cost 186 588 837 186 588 837 279 883 255 279 883 255
Reduction of operating costs 21 790 513 22 493 876 23 219 997 23 969 614 24 743 491 25 542 414 26 367 195 27 218 673 28 097 714 29 005 214 29 942 094 30 909 310 31 907 844 32 938 714 34 002 970 35 101 694 36 236 007 37 407 062 38 616 054 39 864 214 41 152 814
Reduction of emitting pollution 10 457 238 10 784 993 11 123 045 11 471 719 11 831 350 12 202 283 12 584 874 12 979 491 13 386 511 13 806 327 14 239 342 14 685 970 15 146 643 15 621 801 16 111 903 16 617 419 17 138 835 17 676 652 18 231 388 18 803 577 19 393 768
Reduction of the road maintenance 1 417 500 1 512 000 1 606 500 1 701 000 1 795 500 1 890 000 1 984 500 2 079 000 2 173 500 2 268 000 2 362 500 2 457 000 2 551 500 2 646 000 2 740 500 2 835 000 2 929 500 3 024 000 3 118 500 3 213 000 3 307 500
Residual value
Total ‐186 588 837 ‐186 588 837 ‐279 883 255 ‐279 883 255 33 665 252 34 790 868 35 949 541 37 142 334 38 370 341 39 634 697 40 936 569 42 277 163 43 657 726 45 079 541 46 543 936 48 052 280 49 605 987 51 206 516 52 855 373 54 554 113 56 304 341 58 107 714 59 965 942 61 880 791 63 854 082
Year Year 26 Year 27 Year 28 Year 29 Year 30 Year 31 Year 32 Year 33 Year 34 Year 35 Year 36 Year 37 Year 38 Year 39 Year 40 Year 41 Year 42 Year 43 Year 44 Year 45
Opportunity cost
Reduction of operating costs 42 483 167 43 856 629 45 274 601 46 738 528 48 249 903 49 810 266 51 421 211 53 084 380 54 801 470 56 574 233 58 404 479 60 294 076 62 244 952 64 259 099 66 338 574 68 485 502 70 702 074 72 990 555 75 353 283 77 792 673
Reduction of emitting pollution 20 002 530 20 630 448 21 278 128 21 946 191 22 635 282 23 346 065 24 079 222 24 835 462 25 615 512 26 420 124 27 250 073 28 106 159 28 989 208 29 900 071 30 839 626 31 808 779 32 808 465 33 839 649 34 903 326 36 000 521
Reduction of the road maintenance 3 402 000 3 496 500 3 591 000 3 685 500 3 780 000 3 874 500 3 969 000 4 063 500 4 158 000 4 252 500 4 347 000 4 441 500 4 536 000 4 630 500 4 725 000 4 819 500 4 914 000 5 008 500 5 103 000 5 197 500
Residual value 559 766 510
Total 65 887 697 67 983 578 70 143 729 72 370 219 74 665 185 77 030 831 79 469 434 81 983 342 84 574 982 87 246 857 90 001 552 92 841 735 95 770 160 98 789 670 101 903 200 105 113 781 108 424 539 111 838 704 115 359 609 678 757 203
IRR 5,2%NPV (10 %) ‐402 078 255

Economic evaluation railway alternative ‐ Maiduguri NdjaménaTrend scenario
Opportunity cost 627 218 812 US $ 1 1
Year Year 1 Year 2 Year 3 Year 4 Year 5 Year 6 Year 7 Year 8 Year 9 Year 10 Year 11 Year 12 Year 13 Year 14 Year 15 Year 16 Year 17 Year 18 Year 19 Year 20 Year 21 Year 22 Year 23 Year 24 Year 25
Opportunity cost 125 443 762 125 443 762 188 165 644 188 165 644
Reduction of operating costs 472 872 488 710 505 078 521 995 539 478 557 547 576 221 595 520 615 465 636 078 657 381 679 398 702 152 725 668 749 971 775 089 801 047 827 874 855 600 884 254 913 868
Reduction of emitting pollution 15 558 643 16 062 571 16 582 822 17 119 923 17 674 421 18 246 880 18 837 881 19 448 025 20 077 931 20 728 241 21 399 615 22 092 735 22 808 305 23 547 054 24 309 731 25 097 111 25 909 996 26 749 211 27 615 609 28 510 070 29 433 504
Reduction of the road maintenance 486 000 502 200 518 400 534 600 550 800 567 000 583 200 599 400 615 600 631 800 648 000 664 200 680 400 696 600 712 800 729 000 745 200 761 400 777 600 793 800 810 000
Residual value
Total ‐125 443 762 ‐125 443 762 ‐188 165 644 ‐188 165 644 16 517 515 17 053 481 17 606 300 18 176 518 18 764 700 19 371 427 19 997 302 20 642 944 21 308 996 21 996 119 22 704 996 23 436 333 24 190 857 24 969 322 25 772 502 26 601 200 27 456 243 28 338 485 29 248 809 30 188 124 31 157 371
Year Year 26 Year 27 Year 28 Year 29 Year 30 Year 31 Year 32 Year 33 Year 34 Year 35 Year 36 Year 37 Year 38 Year 39 Year 40 Year 41 Year 42 Year 43 Year 44 Year 45
Opportunity cost
Reduction of operating costs 944 473 976 103 1 008 792 1 042 575 1 077 490 1 113 574 1 150 865 1 189 406 1 229 237 1 270 402 1 312 944 1 356 912 1 402 351 1 449 312 1 497 845 1 548 003 1 599 840 1 653 413 1 708 780 1 766 000
Reduction of emitting pollution 30 386 849 31 371 074 32 387 179 33 436 196 34 519 193 35 637 270 36 791 563 37 983 244 39 213 526 40 483 659 41 794 934 43 148 682 44 546 281 45 989 150 47 478 756 49 016 614 50 604 285 52 243 383 53 935 576 55 682 581
Reduction of the road maintenance 826 200 842 400 858 600 874 800 891 000 907 200 923 400 939 600 955 800 972 000 988 200 1 004 400 1 020 600 1 036 800 1 053 000 1 069 200 1 085 400 1 101 600 1 117 800 1 134 000
Residual value 376 331 287
Total 32 157 521 33 189 576 34 254 570 35 353 572 36 487 683 37 658 044 38 865 828 40 112 250 41 398 563 42 726 061 44 096 078 45 509 994 46 969 232 48 475 262 50 029 601 51 633 816 53 289 525 54 998 397 56 762 155 434 913 868
IRR 3,8%NPV (10 %) ‐328 203 785
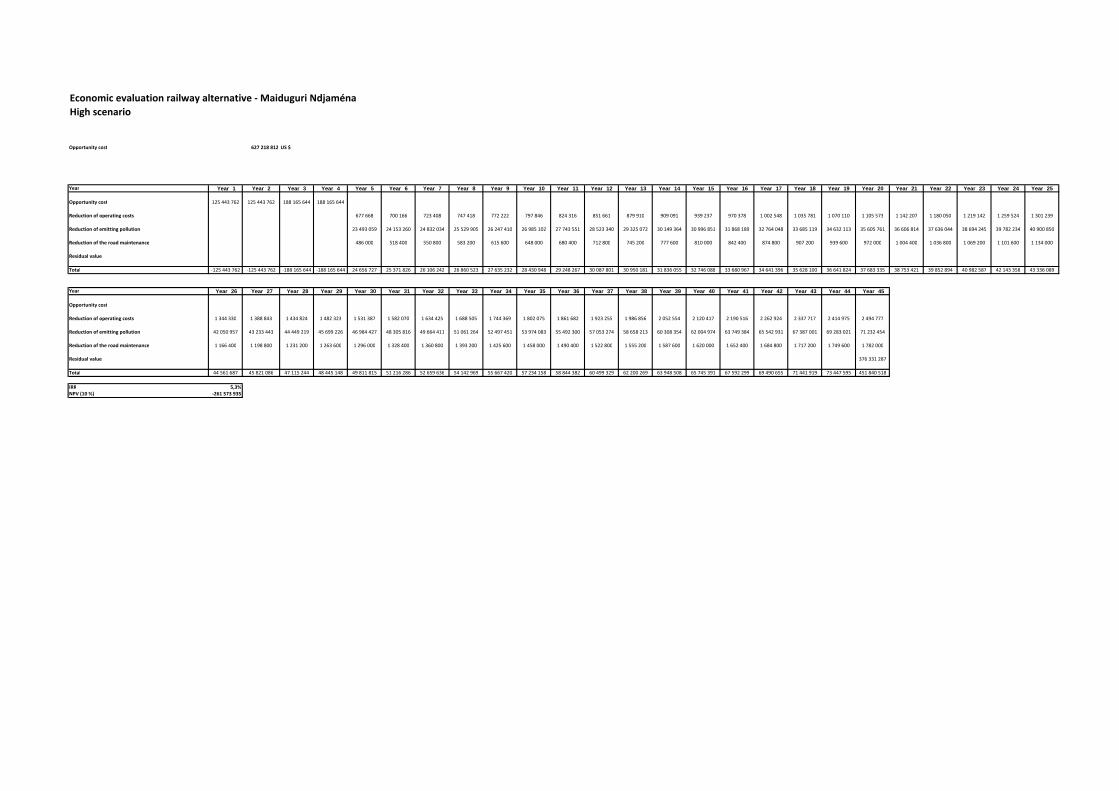
Economic evaluation railway alternative ‐ Maiduguri NdjaménaHigh scenario
Opportunity cost 627 218 812 US $ 1 1
Year Year 1 Year 2 Year 3 Year 4 Year 5 Year 6 Year 7 Year 8 Year 9 Year 10 Year 11 Year 12 Year 13 Year 14 Year 15 Year 16 Year 17 Year 18 Year 19 Year 20 Year 21 Year 22 Year 23 Year 24 Year 25
Opportunity cost 125 443 762 125 443 762 188 165 644 188 165 644
Reduction of operating costs 677 668 700 166 723 408 747 418 772 222 797 846 824 316 851 661 879 910 909 091 939 237 970 378 1 002 548 1 035 781 1 070 110 1 105 573 1 142 207 1 180 050 1 219 142 1 259 524 1 301 239
Reduction of emitting pollution 23 493 059 24 153 260 24 832 034 25 529 905 26 247 410 26 985 102 27 743 551 28 523 340 29 325 072 30 149 364 30 996 851 31 868 189 32 764 048 33 685 119 34 632 113 35 605 761 36 606 814 37 636 044 38 694 245 39 782 234 40 900 850
Reduction of the road maintenance 486 000 518 400 550 800 583 200 615 600 648 000 680 400 712 800 745 200 777 600 810 000 842 400 874 800 907 200 939 600 972 000 1 004 400 1 036 800 1 069 200 1 101 600 1 134 000
Residual value
Total ‐125 443 762 ‐125 443 762 ‐188 165 644 ‐188 165 644 24 656 727 25 371 826 26 106 242 26 860 523 27 635 232 28 430 948 29 248 267 30 087 801 30 950 181 31 836 055 32 746 088 33 680 967 34 641 396 35 628 100 36 641 824 37 683 335 38 753 421 39 852 894 40 982 587 42 143 358 43 336 089
Year Year 26 Year 27 Year 28 Year 29 Year 30 Year 31 Year 32 Year 33 Year 34 Year 35 Year 36 Year 37 Year 38 Year 39 Year 40 Year 41 Year 42 Year 43 Year 44 Year 45
Opportunity cost
Reduction of operating costs 1 344 330 1 388 843 1 434 824 1 482 323 1 531 387 1 582 070 1 634 425 1 688 505 1 744 369 1 802 075 1 861 682 1 923 255 1 986 856 2 052 554 2 120 417 2 190 516 2 262 924 2 337 717 2 414 975 2 494 777
Reduction of emitting pollution 42 050 957 43 233 443 44 449 219 45 699 226 46 984 427 48 305 816 49 664 411 51 061 264 52 497 451 53 974 083 55 492 300 57 053 274 58 658 213 60 308 354 62 004 974 63 749 384 65 542 931 67 387 001 69 283 021 71 232 454
Reduction of the road maintenance 1 166 400 1 198 800 1 231 200 1 263 600 1 296 000 1 328 400 1 360 800 1 393 200 1 425 600 1 458 000 1 490 400 1 522 800 1 555 200 1 587 600 1 620 000 1 652 400 1 684 800 1 717 200 1 749 600 1 782 000
Residual value 376 331 287
Total 44 561 687 45 821 086 47 115 244 48 445 148 49 811 815 51 216 286 52 659 636 54 142 969 55 667 420 57 234 158 58 844 382 60 499 329 62 200 269 63 948 508 65 745 391 67 592 299 69 490 655 71 441 919 73 447 595 451 840 518
IRR 5,3%NPV (10 %) ‐261 573 935
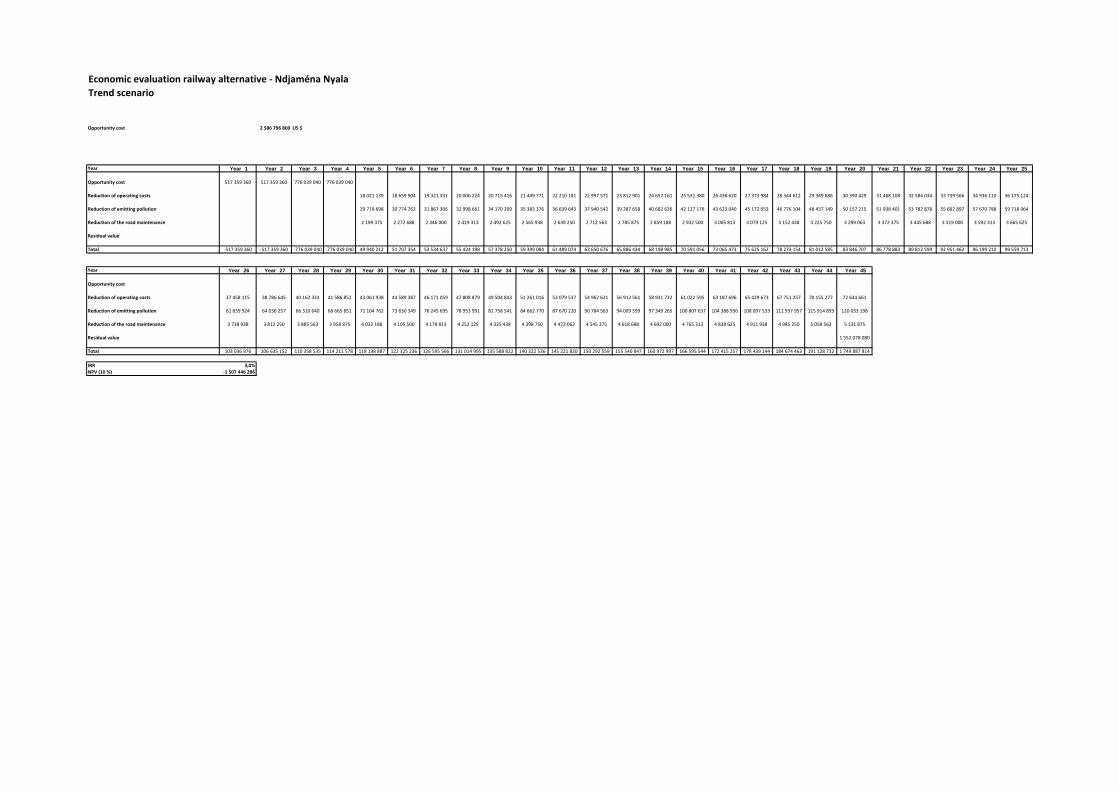
Economic evaluation railway alternative ‐ Ndjaména NyalaTrend scenario
Opportunity cost 2 586 796 800 US $ 1 1
Year Year 1 Year 2 Year 3 Year 4 Year 5 Year 6 Year 7 Year 8 Year 9 Year 10 Year 11 Year 12 Year 13 Year 14 Year 15 Year 16 Year 17 Year 18 Year 19 Year 20 Year 21 Year 22 Year 23 Year 24 Year 25
Opportunity cost 517 359 360 517 359 360 776 039 040 776 039 040
Reduction of operating costs 18 021 139 18 659 904 19 321 331 20 006 224 20 715 416 21 449 771 22 210 181 22 997 571 23 812 901 24 657 161 25 531 380 26 436 620 27 373 984 28 344 612 29 349 686 30 390 429 31 468 108 32 584 034 33 739 566 34 936 110 36 175 124
Reduction of emitting pollution 29 719 698 30 774 762 31 867 306 32 998 661 34 170 209 35 383 376 36 639 643 37 940 542 39 287 658 40 682 636 42 127 176 43 623 040 45 172 053 46 776 104 48 437 149 50 157 215 51 938 401 53 782 878 55 692 897 57 670 788 59 718 964
Reduction of the road maintenance 2 199 375 2 272 688 2 346 000 2 419 313 2 492 625 2 565 938 2 639 250 2 712 563 2 785 875 2 859 188 2 932 500 3 005 813 3 079 125 3 152 438 3 225 750 3 299 063 3 372 375 3 445 688 3 519 000 3 592 313 3 665 625
Residual value
Total ‐517 359 360 ‐517 359 360 ‐776 039 040 ‐776 039 040 49 940 212 51 707 354 53 534 637 55 424 198 57 378 250 59 399 084 61 489 074 63 650 676 65 886 434 68 198 985 70 591 056 73 065 473 75 625 162 78 273 154 81 012 585 83 846 707 86 778 883 89 812 599 92 951 462 96 199 210 99 559 713
Year Year 26 Year 27 Year 28 Year 29 Year 30 Year 31 Year 32 Year 33 Year 34 Year 35 Year 36 Year 37 Year 38 Year 39 Year 40 Year 41 Year 42 Year 43 Year 44 Year 45
Opportunity cost
Reduction of operating costs 37 458 115 38 786 645 40 162 333 41 586 852 43 061 938 44 589 387 46 171 059 47 808 879 49 504 843 51 261 016 53 079 537 54 962 621 56 912 561 58 931 732 61 022 595 63 187 696 65 429 673 67 751 257 70 155 277 72 644 661
Reduction of emitting pollution 61 839 924 64 036 257 66 310 640 68 665 851 71 104 762 73 630 349 76 245 695 78 953 991 81 758 541 84 662 770 87 670 220 90 784 563 94 009 599 97 349 265 100 807 637 104 388 936 108 097 533 111 937 957 115 914 893 120 033 198
Reduction of the road maintenance 3 738 938 3 812 250 3 885 563 3 958 875 4 032 188 4 105 500 4 178 813 4 252 125 4 325 438 4 398 750 4 472 063 4 545 375 4 618 688 4 692 000 4 765 313 4 838 625 4 911 938 4 985 250 5 058 563 5 131 875
Residual value 1 552 078 080
Total 103 036 976 106 635 152 110 358 535 114 211 578 118 198 887 122 325 236 126 595 566 131 014 995 135 588 822 140 322 536 145 221 820 150 292 559 155 540 847 160 972 997 166 595 544 172 415 257 178 439 144 184 674 463 191 128 732 1 749 887 814
IRR 3,0%NPV (10 %) ‐1 507 446 286
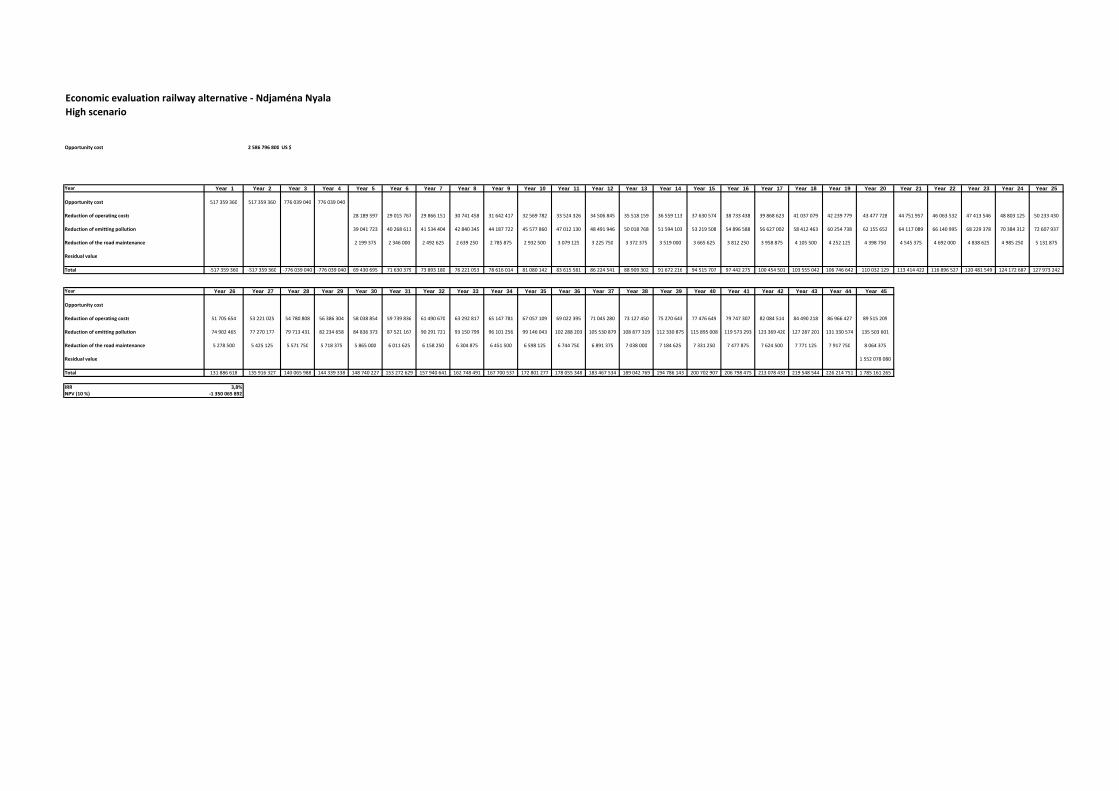
Economic evaluation railway alternative ‐ Ndjaména NyalaHigh scenario
Opportunity cost 2 586 796 800 US $ 1 1
Year Year 1 Year 2 Year 3 Year 4 Year 5 Year 6 Year 7 Year 8 Year 9 Year 10 Year 11 Year 12 Year 13 Year 14 Year 15 Year 16 Year 17 Year 18 Year 19 Year 20 Year 21 Year 22 Year 23 Year 24 Year 25
Opportunity cost 517 359 360 517 359 360 776 039 040 776 039 040
Reduction of operating costs 28 189 597 29 015 767 29 866 151 30 741 458 31 642 417 32 569 782 33 524 326 34 506 845 35 518 159 36 559 113 37 630 574 38 733 438 39 868 623 41 037 079 42 239 779 43 477 728 44 751 957 46 063 532 47 413 546 48 803 125 50 233 430
Reduction of emitting pollution 39 041 723 40 268 611 41 534 404 42 840 345 44 187 722 45 577 860 47 012 130 48 491 946 50 018 768 51 594 103 53 219 508 54 896 588 56 627 002 58 412 463 60 254 738 62 155 652 64 117 089 66 140 995 68 229 378 70 384 312 72 607 937
Reduction of the road maintenance 2 199 375 2 346 000 2 492 625 2 639 250 2 785 875 2 932 500 3 079 125 3 225 750 3 372 375 3 519 000 3 665 625 3 812 250 3 958 875 4 105 500 4 252 125 4 398 750 4 545 375 4 692 000 4 838 625 4 985 250 5 131 875
Residual value
Total ‐517 359 360 ‐517 359 360 ‐776 039 040 ‐776 039 040 69 430 695 71 630 379 73 893 180 76 221 053 78 616 014 81 080 142 83 615 581 86 224 541 88 909 302 91 672 216 94 515 707 97 442 275 100 454 501 103 555 042 106 746 642 110 032 129 113 414 422 116 896 527 120 481 549 124 172 687 127 973 242
Year Year 26 Year 27 Year 28 Year 29 Year 30 Year 31 Year 32 Year 33 Year 34 Year 35 Year 36 Year 37 Year 38 Year 39 Year 40 Year 41 Year 42 Year 43 Year 44 Year 45
Opportunity cost
Reduction of operating costs 51 705 654 53 221 025 54 780 808 56 386 304 58 038 854 59 739 836 61 490 670 63 292 817 65 147 781 67 057 109 69 022 395 71 045 280 73 127 450 75 270 643 77 476 649 79 747 307 82 084 514 84 490 218 86 966 427 89 515 209
Reduction of emitting pollution 74 902 465 77 270 177 79 713 431 82 234 658 84 836 373 87 521 167 90 291 721 93 150 799 96 101 256 99 146 043 102 288 203 105 530 879 108 877 319 112 330 875 115 895 008 119 573 293 123 369 420 127 287 201 131 330 574 135 503 601
Reduction of the road maintenance 5 278 500 5 425 125 5 571 750 5 718 375 5 865 000 6 011 625 6 158 250 6 304 875 6 451 500 6 598 125 6 744 750 6 891 375 7 038 000 7 184 625 7 331 250 7 477 875 7 624 500 7 771 125 7 917 750 8 064 375
Residual value 1 552 078 080
Total 131 886 618 135 916 327 140 065 988 144 339 338 148 740 227 153 272 629 157 940 641 162 748 491 167 700 537 172 801 277 178 055 348 183 467 534 189 042 769 194 786 143 200 702 907 206 798 475 213 078 433 219 548 544 226 214 751 1 785 161 265
IRR 3,8%NPV (10 %) ‐1 350 065 892

Economic evaluation railway alternative ‐ Damazin Addis AbebaTrend scenario
Opportunity cost 3 062 689 623 US $ 1 1
Year Year 1 Year 2 Year 3 Year 4 Year 5 Year 6 Year 7 Year 8 Year 9 Year 10 Year 11 Year 12 Year 13 Year 14 Year 15 Year 16 Year 17 Year 18 Year 19 Year 20 Year 21 Year 22 Year 23 Year 24 Year 25
Opportunity cost 612 537 925 612 537 925 918 806 887 918 806 887
Reduction of operating costs 43 680 345 44 915 204 46 188 668 47 502 021 48 856 595 50 253 763 51 694 948 53 181 622 54 715 308 56 297 582 57 930 072 59 614 465 61 352 506 63 145 999 64 996 811 66 906 876 68 878 192 70 912 827 73 012 922 75 180 692 77 418 427
Reduction of emitting pollution 25 288 942 25 920 569 26 570 178 27 238 334 27 925 619 28 632 637 29 360 012 30 108 388 30 878 430 31 670 826 32 486 289 33 325 552 34 189 376 35 078 547 35 993 876 36 936 204 37 906 396 38 905 352 39 933 998 40 993 293 42 084 228
Reduction of the road maintenance 3 251 250 3 359 625 3 468 000 3 576 375 3 684 750 3 793 125 3 901 500 4 009 875 4 118 250 4 226 625 4 335 000 4 443 375 4 551 750 4 660 125 4 768 500 4 876 875 4 985 250 5 093 625 5 202 000 5 310 375 5 418 750
Residual value
Total ‐612 537 925 ‐612 537 925 ‐918 806 887 ‐918 806 887 72 220 536 74 195 398 76 226 846 78 316 730 80 466 964 82 679 525 84 956 460 87 299 885 89 711 988 92 195 033 94 751 361 97 383 392 100 093 632 102 884 671 105 759 188 108 719 955 111 769 838 114 911 804 118 148 920 121 484 359 124 921 405
Year Year 26 Year 27 Year 28 Year 29 Year 30 Year 31 Year 32 Year 33 Year 34 Year 35 Year 36 Year 37 Year 38 Year 39 Year 40 Year 41 Year 42 Year 43 Year 44 Year 45
Opportunity cost
Reduction of operating costs 79 728 500 82 113 364 84 575 559 87 117 711 89 742 539 92 452 858 95 251 579 98 141 715 101 126 385 104 208 815 107 392 346 110 680 433 114 076 655 117 584 713 121 208 438 124 951 796 128 818 891 132 813 972 136 941 433 141 205 827
Reduction of emitting pollution 43 207 829 44 365 156 45 557 304 46 785 406 48 050 635 49 354 202 50 697 359 52 081 403 53 507 674 54 977 557 56 492 486 58 053 942 59 663 459 61 322 622 63 033 071 64 796 502 66 614 670 68 489 389 70 422 536 72 416 053
Reduction of the road maintenance 5 527 125 5 635 500 5 743 875 5 852 250 5 960 625 6 069 000 6 177 375 6 285 750 6 394 125 6 502 500 6 610 875 6 719 250 6 827 625 6 936 000 7 044 375 7 152 750 7 261 125 7 369 500 7 477 875 7 586 250
Residual value 1 837 613 774
Total 128 463 455 132 114 020 135 876 738 139 755 367 143 753 799 147 876 060 152 126 313 156 508 868 161 028 184 165 688 872 170 495 706 175 453 625 180 567 739 185 843 334 191 285 884 196 901 048 202 694 686 208 672 861 214 841 845 2 058 821 905
IRR 3,2%NPV (10 %) ‐1 714 774 399
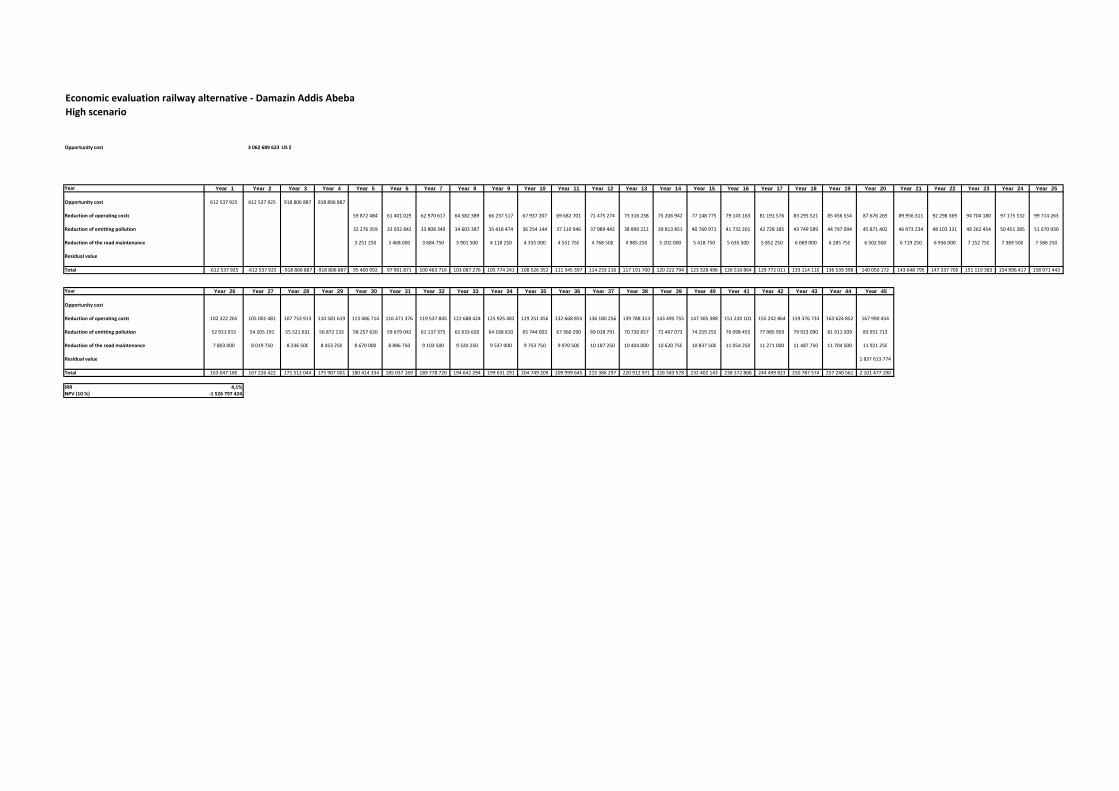
Economic evaluation railway alternative ‐ Damazin Addis AbebaHigh scenario
Opportunity cost 3 062 689 623 US $ 1 1
Year Year 1 Year 2 Year 3 Year 4 Year 5 Year 6 Year 7 Year 8 Year 9 Year 10 Year 11 Year 12 Year 13 Year 14 Year 15 Year 16 Year 17 Year 18 Year 19 Year 20 Year 21 Year 22 Year 23 Year 24 Year 25
Opportunity cost 612 537 925 612 537 925 918 806 887 918 806 887
Reduction of operating costs 59 872 484 61 401 029 62 970 617 64 582 389 66 237 517 67 937 207 69 682 701 71 475 274 73 316 238 75 206 942 77 148 775 79 143 163 81 191 576 83 295 521 85 456 554 87 676 269 89 956 311 92 298 369 94 704 180 97 175 532 99 714 263
Reduction of emitting pollution 32 276 359 33 032 842 33 808 349 34 603 387 35 418 474 36 254 144 37 110 946 37 989 442 38 890 212 39 813 851 40 760 971 41 732 201 42 728 185 43 749 589 44 797 094 45 871 402 46 973 234 48 103 331 49 262 454 50 451 385 51 670 930
Reduction of the road maintenance 3 251 250 3 468 000 3 684 750 3 901 500 4 118 250 4 335 000 4 551 750 4 768 500 4 985 250 5 202 000 5 418 750 5 635 500 5 852 250 6 069 000 6 285 750 6 502 500 6 719 250 6 936 000 7 152 750 7 369 500 7 586 250
Residual value
Total ‐612 537 925 ‐612 537 925 ‐918 806 887 ‐918 806 887 95 400 092 97 901 871 100 463 716 103 087 276 105 774 241 108 526 352 111 345 397 114 233 216 117 191 700 120 222 794 123 328 496 126 510 864 129 772 011 133 114 110 136 539 398 140 050 172 143 648 795 147 337 700 151 119 383 154 996 417 158 971 443
Year Year 26 Year 27 Year 28 Year 29 Year 30 Year 31 Year 32 Year 33 Year 34 Year 35 Year 36 Year 37 Year 38 Year 39 Year 40 Year 41 Year 42 Year 43 Year 44 Year 45
Opportunity cost
Reduction of operating costs 102 322 265 105 001 481 107 753 913 110 581 619 113 486 714 116 471 376 119 537 845 122 688 424 125 925 482 129 251 456 132 668 855 136 180 256 139 788 313 143 495 755 147 305 388 151 220 101 155 242 864 159 376 733 163 624 852 167 990 454
Reduction of emitting pollution 52 921 915 54 205 191 55 521 631 56 872 133 58 257 620 59 679 042 61 137 375 62 633 620 64 168 810 65 744 003 67 360 290 69 018 791 70 720 657 72 467 073 74 259 255 76 098 455 77 985 959 79 923 090 81 911 209 83 951 713
Reduction of the road maintenance 7 803 000 8 019 750 8 236 500 8 453 250 8 670 000 8 886 750 9 103 500 9 320 250 9 537 000 9 753 750 9 970 500 10 187 250 10 404 000 10 620 750 10 837 500 11 054 250 11 271 000 11 487 750 11 704 500 11 921 250
Residual value 1 837 613 774
Total 163 047 180 167 226 422 171 512 044 175 907 001 180 414 334 185 037 169 189 778 720 194 642 294 199 631 291 204 749 209 209 999 645 215 386 297 220 912 971 226 583 578 232 402 143 238 372 806 244 499 823 250 787 574 257 240 561 2 101 477 190
IRR 4,1%NPV (10 %) ‐1 526 797 424

Prefeasibility study of the missing links of Final report Dakar – N’djamena and N’djamena ‐ Djibouti links November 2011
STUDI INTERNATIONAL page 216
17.7 Map of constraints