Predictive sparse modeling of fMRI data for improved … · Konovae,f, Jean Honoriog, Nelly...
29
Predictive sparse modeling of fMRI data for improved classification, regression, and visualization using the k-support norm Eugene Belilovsky, Katerina Gkirtzou, Michail Misyrlis, Anna Konova, Jean Honorio, Nelly Alia-Klein, Rita Goldstein, Dimitris Samaras, Matthew Blaschko To cite this version: Eugene Belilovsky, Katerina Gkirtzou, Michail Misyrlis, Anna Konova, Jean Honorio, et al.. Predictive sparse modeling of fMRI data for improved classification, regression, and visualiza- tion using the k-support norm. Computerized Medical Imaging and Graphics, Elsevier, 2015, pp.1. <10.1016/j.compmedimag.2015.03.007>. <hal-01141082> HAL Id: hal-01141082 https://hal.inria.fr/hal-01141082 Submitted on 10 Apr 2015
Transcript of Predictive sparse modeling of fMRI data for improved … · Konovae,f, Jean Honoriog, Nelly...

Predictive sparse modeling of fMRI data for improved
classification, regression, and visualization using the
k-support norm
Eugene Belilovsky, Katerina Gkirtzou, Michail Misyrlis, Anna Konova, Jean
Honorio, Nelly Alia-Klein, Rita Goldstein, Dimitris Samaras, Matthew
Blaschko
To cite this version:
Eugene Belilovsky, Katerina Gkirtzou, Michail Misyrlis, Anna Konova, Jean Honorio, et al..Predictive sparse modeling of fMRI data for improved classification, regression, and visualiza-tion using the k-support norm. Computerized Medical Imaging and Graphics, Elsevier, 2015,pp.1. <10.1016/j.compmedimag.2015.03.007>. <hal-01141082>
HAL Id: hal-01141082
https://hal.inria.fr/hal-01141082
Submitted on 10 Apr 2015

HAL is a multi-disciplinary open accessarchive for the deposit and dissemination of sci-entific research documents, whether they are pub-lished or not. The documents may come fromteaching and research institutions in France orabroad, or from public or private research centers.
L’archive ouverte pluridisciplinaire HAL, estdestinee au depot et a la diffusion de documentsscientifiques de niveau recherche, publies ou non,emanant des etablissements d’enseignement et derecherche francais ou etrangers, des laboratoirespublics ou prives.

Predictive sparse modeling of fMRI data for improved
classification, regression, and visualization using the
k-support norm
Eugene Belilovsky1a,b, Katerina Gkirtzoua,c, Michail Misyrlisd, Anna B.Konovae,f, Jean Honoriog, Nelly Alia-Kleinf, Rita Z. Goldsteinf, Dimitris
Samarasd, Matthew B. Blaschkob,a
aCentraleSupelec, Grande Voie des Vignes, 92295 Chatenay-Malabry, FrancebInria Saclay, Campus de l’Ecole Polytechnique, 91120 Palaiseau, France
cResearch Center Athena, Artemidos 6 & Epidavrou, Marousi 15125, GreecedDepartment of Computer Science, Stony Brook University, Stony Brook, NY, USA
eDepartment of Psychology, Stony Brook University, Stony Brook, NY, USAfIcahn School of Medicine at Mount Sinai, New York, NY, USA
gCSAIL, MIT, Cambridge, MA, USA
Abstract
We explore various sparse regularization techniques for analyzing fMRI data,
such as the `1 norm (often called LASSO in the context of a squared loss
function), elastic net, and the recently introduced k-support norm. Employ-
ing sparsity regularization allows us to handle the curse of dimensionality, a
problem commonly found in fMRI analysis. In this work we consider sparse
regularization in both the regression and classification settings. We perform
experiments on fMRI scans from cocaine-addicted as well as healthy control
subjects. We show that in many cases, use of the k-support norm leads
to better predictive performance, solution stability, and interpretability as
1Corresponding author.E-mail address: [email protected]: +33 141131098Fax: +33 141131006
Preprint submitted to Computerized Medical Imaging and Graphics March 12, 2015

compared to other standard approaches. We additionally analyze the ad-
vantages of using the absolute loss function versus the standard squared loss
which leads to significantly better predictive performance for the regulariza-
tion methods tested in almost all cases. Our results support the use of the
k-support norm for fMRI analysis and on the clinical side, the generalizability
of the I-RISA model of cocaine addiction.
Keywords: fMRI, sparsity, regularization, k-support norm, cocaine
addiction
1. Introduction
Functional magnetic resonance imaging (fMRI) is a widely used modality,
within the field of neuroimaging, that measures brain activity by detecting
associated changes in blood oxygenation. One of the goals of fMRI data
analysis is to detect correlations between brain activation and a task the
subject performs during the scan.
The main challenges in statistical fMRI data analysis [1, 2, 3, 4] are (i)
the curse of dimensionality (ii) a small number of samples, due to the high
cost of fMRI acquisition, and (iii) high levels of noise, such as system noise
and random neural activity.
A general approach for analyzing functional magnetic resonance imaging
(fMRI) data is based on pattern recognition and statistical learning. By
predicting some cognitive variables related to brain activation maps, this ap-
proach aims at decoding brain activity. This approach takes into account the
multivariate information between voxels and is a way to assess how precisely
some cognitive information is encoded by the activity of neural populations
2

within the whole brain. However, this approach relies on a prediction func-
tion that is plagued by the curse of dimensionality, since there are generally
far more features (voxels) than samples. To address this problem, differ-
ent methods have been proposed, such as, among others, univariate feature
selection and regularization techniques [5].
Sparsity regularizers are key statistical methods for improving predictive
performance in the event that the number of observations is substantially
smaller than the dimensionality of the data while the underlying signal is
known to be sparse. This is the case in fMRI analysis where brain activity
is known to occur in only a subset of regions for a given task. In this paper
we compare the most frequently applied sparsity regularizer developed in the
statistics literature, LASSO [6] and it’s extension the elastic net [7], with
the k-support norm [8], a recently introduced method which tends to retain
correlated variables while simultaneously enforcing sparsity.
The k-support norm has an intrinsic parameter, k ∈ {1, . . . , d}, where d
is the dimensionality of the data, that controls the degree of sparsity. When
used with squared loss, k-support regularization specializes to the LASSO
when k = 1 and ridge regression when k = d. The k-support norm has
previously been used in [8] for classification. We first evaluate the k-support
norm in an fMRI volume classification setting in which we predict a binary
task, based on an fMRI volume. We then extend this analysis to a regression
problem, predicting a task-variable based on the fMRI volume.
We focus on comparing LASSO and elastic net with the k-support norm in
order to establish the latter regularizer’s superiority in analyzing fMRI data
in the context of a classification task. We then consider a regression setting
3

and use two loss functions, namely the squared error and the absolute error
functions. The advantage of the absolute error loss is that it is more robust,
in that it penalizes outliers less than the squared loss, while still retaining
convexity, which guarantees finding the global optimum. In this setting we
compare `1 regularization with the k-support norm and demonstrate marked
improvement. We compare the methods not only in their predictive accuracy
but also in the interpretability and stability of their results which is critical
in fMRI data analysis.
This article is based on [9, 10] and extends the presentation of k-support
norm regularization of fMRI data into a single unified framework. Although
we consider a specific neuroscience application of validating a model of human
drug addiction, this approach is more generally applicable and can be used
in many other neuroscience studies involving interpretation of fMRI data.
The primary neuroscientific motivation for most of our experiments in this
article is the exploration of human drug addiction. Basic studies have led
to a theoretical model of human drug addiction, characterized by Impaired
Response Inhibition (RI) and Salience Attribution (SA) (hence, I-RISA) [11].
According to the model, the skew in SA is predictive of impaired RI, together
contributing to excessive drug use and relapse, core clinical symptoms of
cocaine addiction. We use the fMRI data from a SA task (drug Stroop) in
order to predict behavioral data in a RI task (color-word Stroop) collected
at a different time, hence providing further evidence to support the I-RISA
model.
4

2. Methods
A basis of statistical inference is the application of regularized risk, in
which a loss function is evaluated over a sample of data and is linearly com-
bined with a regularizer that penalizes some norm of the prediction function
as in (Eq. (1)), where the first term is the loss function and the second is the
penalty term:
minwf(w,X, y) + λJ(w). (1)
Here we denote by X ∈ Rn×d the design matrix of n samples each with d
dimensions; we denote by y ∈ Rn the vector of targets. In the sequel, we as-
sume that we have a sample of labeled training data {(x1, y1), . . . , (xn, yn)} ∈(Rd × R
)nwhere xi is the output of a fMRI scan, and yi is a ground truth
label that we would like to be able to predict. The scalar parameter λ > 0
controls the degree of regularization and J is a scalar valued function mono-
tonic in a norm of w ∈ Rn. Sparsity regularization is a key family of priors
over linear functions that prevents overfitting and aids interpretability of the
resulting models [6, 8].
One of the most important sparsity regularizers is the LASSO [6], where
J(w) = ‖w‖1 and f corresponds to squared loss. In many learning problems
of interest, LASSO has been observed to shrink too many of the w variables
to zero. In the presence of a group of highly correlated variables, LASSO
may prefer a sparse solution. However including all correlated variables in the
model could potentially lead to higher predictive accuracy [8] and more stable
support recovery. The k-support norm address this problem by providing a
way of calibrating the cardinality of the regression vector w so as to include
5

Figure 1: The k-support unit ball with k = 2 and d = 3.
more variables.
In order to create a model which can make inferences about labels for
new fMRI samples and provide a map of the key voxels we must specify
an appropriate loss function. This specifies the prediction properties we
are interested in obtaining. We must then specify an appropriate sparse
regularizer which captures the a priori structure of the data. Finally, we
must optimize the objective specified in Equation (1) in order to obtain a
brain map which can predict labels for new samples and provide insights
on which brain regions are most associated with this prediction. Below we
discuss each of these steps in detail.
6

2.1. Sparse Regularizers
Key to the mathematical understanding of sparsity regularizers is their in-
terpretation as convex relaxations to quantities involving the `0 norm, which
simply counts the number of non-zero elements of a vector. The `1 norm,
which is the sum of the absolute values of the vector, is the convex relax-
ation of the `0 norm, meaning it is the tightest sparsity norm that retains
convexity, which is key for computational tractability. While the `1 norm can
therefore be interpreted as employing the convex hull of the `0 sparsity regu-
larizer, the elastic net is looser than the convex hull of a norm that combines
`2 regularization with sparsity [8]. However, one may employ the k-support
norm, which is exactly the convex hull of that hybrid norm. A visualization
of the k-support norm unit ball is given in Figure 1. We see that there is
a non-differentiability of the norm, which restricts the set of optimization
strategies that we may employ (cf. Section 2.3). The k-support norm can be
computed as
‖w‖spk =
k−r−1∑i=1
(|w|↓i )2 +1
r + 1
(d∑
i=k−r
|w|↓i
)2 1
2
(2)
where |w|↓i is the ith largest element of the vector and r is the unique integer
in {0, . . . , k − 1} satisfying
|w|↓k−r−1 >1
r + 1
d∑i=k−r
|w|↓i ≥ |w|↓k−r. (3)
We summarize the regularizers considered in this work in Table 1 below
The k-support norm is closely related to the elastic net, in that it can be
bounded to within a constant factor of the elastic net, but it leads to different
7

Table 1: A summary of the regularizers considered in this work.
Regularizer J(w)
LASSO [6] λ1‖w‖1Elastic net [7] λ1‖w‖1 + λ2‖w‖22k-support [8] λ‖w‖spk (see Equation (2))
sparsity patterns. One can see from Equation (2) that the norm trades off
a squared `2 penalty for the largest components with an `1 penalty for the
smallest components.
A difficulty in using sparse regularizers is that they tend to lead to non-
smooth functions which can cause difficulties when using gradient based con-
vex optimization procedures. For this class of functions proximal methods
are a very popular way to quickly find optimal solutions with the bottleneck
generally being the computation of the proximal mapping. Among many ad-
vantages of the k-support norm, it has an easy to compute proximal operator
given in [8].
While initial experiments have shown promising results with the k-support
norm for a range of machine learning problems [8], to the best of our knowl-
edge the studies discussed here are the first applications to fMRI.
2.2. Loss Functions
For classification we consider squared loss: f(w,X, y) = ‖y−Xw‖22. Here
we set the labels for the discriminative task to y ∈ {−1, 1} and predict new
examples, xn, as yn = sign(xnw). In the regression setting we consider
two loss functions: the squared error and the absolute error f(w,X, y) =
‖y −Xw‖1. Here y corresponds to the output task-variable. In practice, we
8
approximate the absolute error with a Huber type smoothing around zero to
ensure differentiability as described in [12]. The advantage of the absolute
error loss in regression is that it is more robust, in that it penalizes outliers
less than squared loss, while still retaining convexity which guarantees finding
the global optimum.
2.3. Optimization
Optimization of objectives containing sparse regularizers are not triv-
ial since they generally contain non-smooth terms which are not compatible
with classic optimization techniques such as stochastic gradient descent. Op-
timization of the LASSO and elastic net has been extensively studied in the
literature [13, 14]. The k-support norm is a relatively new approach and
does not have extensive analysis with regards to optimization. However a
proximal operator is provided in [8]. This is a fundamental building block of
many non-smooth optimization techniques a popular one being Fast Iterative
Threshold-Shrinkage Algorithm (FISTA) [15, 8, 16, 17]. The method is de-
signed for optimizing the sum of a smooth and non-smooth convex function.
It requires only the gradient of the smooth function, a proximal operator
for the non-smooth function, and an upper bound on the Lipschitz constant
of the gradient of the smooth function. For each of the loss functions con-
sidered here, these quantities are known, and source code is available for
download [12].
3. Experimental Results
Results are presented on three fMRI datasets. The first consists of fMRI
scans of a subject viewing a movie. The second and third dataset each consist
9

of fMRI scans from control and cocaine-addicted subjects [18, 1].
Free-Viewing Dataset. This dataset consists of a set of fMRI scans from a
healthy subject in a free-viewing setting. Data collection was previously de-
scribed in [19, 20], while the pre-processing followed [21]. The discriminative
task in the first data set is the prediction of a “Temporal Contrast” vari-
able computed from the content of a movie presented to the subject [22].
This dataset was employed for preliminary quantitative evaluation due to its
larger sample size.
Cocaine Classification Dataset. The overall neuropsychological experiment,
referred to as the fMRI drug-Stroop task [23], follows a block design with
each subject (either control or cocaine-addicted) performing the same task
repeatedly, during a total of six sessions where there are two varying condi-
tions: (i) the monetary reward, as well as (ii) the word that cues the task
(which can be a drug word or a neutral word). The sessions consist of an
initial screen displaying a monetary reward and then presenting a sequence of
forty words in four different colors (yellow, blue, red or green). The subject
was instructed to press one of four buttons matching the color of the word
they had just read. The subjects were rewarded for correct performance
depending on the monetary condition. In our experiments we use sessions
with the same monetary reward (50¢) and the only varying condition is the
type of cue words shown (drug words or neutral words) leading to a total
of 2 sessions per subject. The discriminative task is to determine whether a
subject is cocaine-addicted or a healthy control subject [18, 1].
10

Cocaine Regression Dataset. The overall neuropsychological experiment fol-
lows a block design with each subject (either control or cocaine-addicted)
performing the same task repeatedly, during a total of eight session where
there are two varying conditions: monetary reward and cue word (drug word
or neutral word). Individual sessions follow the same protocol as described in
the Cocaine Classification Dataset. In this experiment the monetary reward
varies (50¢, 25¢, 1¢ and 0¢) as well as the type of cue words shown (drug
words or neutral words) resulting in a total of 8 sessions per subject.
We use the behavioral responses of the same subjects in a color-word
task [24], a classic task of inhibitory control. In this task the subjects in-
dicated the ink-color of color-words printed in either their congruent or in-
congruent colors [24, Figure 1(a)]. Four colors and words (red, blue, yellow
and green) were used in all possible combinations. Both congruent and in-
congruent stimuli were presented randomly. The subjects performed four
consecutive runs of this task. As there were 12 incongruent events in each
run of 200 events, each subject’s data contained up to 48 incongruent events.
For 38 control subjects and 74 cocaine abusers, we use the fMRI data from
the drug-word task, to predict color-word behavioral variables such as the dif-
ference in subject performance accuracy between congruent and incongruent
events.
3.1. Classification
In our first experiment we use the free-viewing dataset in a classification
task [22]. The performance of the different sparse regularization techniques,
shown in Figure 2, is evaluated as the mean correlation over 100 trials of
random permutation of the data described in [21]. In each trial, 80% of
11

0 500 1000 15000
0.05
0.1
number of non zero variables
Mea
n Pe
arso
n Co
rrela
tion
LASSO vs Elastic Net
SEM Elastic netSEM LASSOMean Elastic netMean LASSOLaplacian regularization
(a) LASSO vs Elastic net
0 100 200 300 400 500 600 700 8000
0.05
0.1
k parameter
Mea
n Pe
arso
n Co
rrela
tion
K support norm
Ksupport normLaplacian regularization
(b) k-support norm
Figure 2: Mean Pearson correlations between the label and prediction on the hold-out data
over 100 trials for the dataset described in [21] (higher values indicate better performance).
Error bars show the standard deviation. The LASSO achieves its best performance with
a sparsity level substantially lower than the elastic net, as it suppresses correlated voxels
(Figure 2(a)). The k-support norm performs better than the LASSO, elastic net, or
Laplacian regularization reported in [22], and is a promising candidate for sparsity in
fMRI analysis (Figure 2(b)). (Figure best viewed in color.)
12

(a) LASSO (b) k-support norm
Figure 3: A visualization of the areas of the brain selected by the LASSO and by the
k-support norm applied to the data described in [18]. The LASSO leads to overly sparse
solutions that do not lend themselves to easy interpretation (Figure 3(a)), while the k-
support norm does not suppress correlated voxels, leading to interpretable and robust
solutions (Figure 3(b)). A medical interpretation of the result presented in Figure 3(b) is
given in Section 3.1. (Figure best viewed in color.)
the data are used to train the method, while the remaining 20% are used
to evaluate the performance. More specifically, Figure 2(a) shows the mean
correlation between LASSO and elastic net against the number of non-zero
variables (i.e voxels), while Figure 2(b) shows the mean correlation for the k-
support norm against different k values–which are correlated with the number
of non-zero coefficients. LASSO achieves a maximum mean correlation of
0.1198 for 44 non-zero variables, elastic net a maximum mean correlation of
0.1189 for 866 non-zero variables, while k-support norm a maximum of 0.129
for k = 800. This is substantially higher than was previously reported in [22].
13

Next we evaluate interpretability in the classification setting for the co-
caine classification dataset. We use 16 cocaine addicted individuals and 17
control subjects. These were the subjects that complied to the following
requirements: motion < 2mm translation, < 2◦ rotation and at least 50%
performance of the subject in an unrelated task [18]. We visualize the brain
regions predicted when applying the LASSO and the k-support norm to this
data. For each, we have selected slices through the brain that maximize
the sum of the absolute values of the weights predicted by the respective
methods. These results are presented in Figure 3 and discussed in the next
section.
The main area of activity shown in Figure 3(b) is the rostral anterior cin-
gulate cortex (rostral ACC). It has been shown to be deactivated during the
drug Stroop as compared to baseline in cocaine users vs. controls. This is even
when performance, task interest, and engagement are matched between the
groups [18] and its activity is normalized by oral methylphenidate [25]–which
similarly to cocaine blocks the dopamine transporters increasing extracellular
dopamine–an increase that was associated with lower task-related impulsiv-
ity (errors of commission). This region was responsive (showed reduction
in drug cue reactivity) to pharmacotherapeutic interventions in cigarette
smokers [26, 27], and may be a marker of treatment response in other psy-
chopathology (e.g., depression). The LASSO does not show a meaningful
sparsity pattern (Figure 3(a)).
To further understand the differences in brain activity of addicted and
not addicted patients we next extend our analysis to the cocaine regression
dataset.
14

3.2. Regression
In this section we present our regression experiments on the cocaine
dataset. Our experiments aim at providing empirical evidence for the support
of the I-RISA model.
We use the Cocaine Regression Dataset described in Sec 3 in two experi-
ments both predicting color-word behavioral variables.
In experiment 1 we use the fMRI contrast drug > neutral words, av-
eraged over monetary reward condition, to predict the conflict effect in the
subjects’ reaction time on the color-word task, defined as the difference in
time between correctly performing the task for congruent and incongruent
events. We use the Insula, Hippocampus Complex, Amygdala and ACC,
part of the brain’s limbic (emotion) circuit, as regions of interest (ROIs) for
this experiment. These regions are chosen on the basis of previous studies on
independent datasets that showed limbic system modulation by drug-related
cues, e.g. drug words [28].
In experiment 2 we use the fMRI contrast 50¢ > 0¢, averaged over
word type condition (drug or neutral), in order to predict the subjects’ re-
sponses on the color-word task, defined as the difference in percent accuracy
between performing the task for congruent and incongruent events. We use
the Basal Ganglia and Thalamus, part of the brain’s reward circuit, as ROIs
for this experiment. We chose these ROIs on the basis of previous studies
on independent datasets that showed reward system modulation by primary
and secondary reinforcers, including money [29].
For each experiment we perform 500 trial with an 85% / 15% random
split between training and test sets. For each trial we perform model se-
15
lection on the training set. That is, for each combination of parameters
(λ ∈ {10i : i = −2, . . . , 8} for LASSO, λ ∈ {10i : i = −2, . . . , 8}, k ∈
{1, 2, 3, 6, 12, 100, 200, 300, 600} for k-support norm), we do a leave-one-subject-
out cross validation on the samples that constitute the training set. We mea-
sure the correlation between the predicted and the true response variables
on the training set. The parameter setting that leads to the highest correla-
tion is used on the whole training set in order to learn a set of weights for
each method, which are then applied on the test set. Finally, we measure
the correlation between the predicted and the true response variables on the
test set. We report the mean correlation on the holdout test samples and its
standard error across the 500 random permutations. We note that the same
sample randomization is used for both LASSO and k-support norm.
We compare the performance of the two methods in Table 2 for the first
experiment and Table 3 for the second experiment.
With the squared loss function, the k-support norm outperforms LASSO
for almost all cases, while when combined with the absolute loss function,
the regularizers do not significantly differ in their predictive performance.
The absolute loss function, for both regularizers, leads to correlations that
are significantly higher than those with the squared loss function in almost
all cases.
We report the fraction of non-zero weights that were selected by each
method for over 50% of the 500 trials in Tables 4 and 5 for the first and the
second experiment respectively.
We average the weights assigned to the voxels over the 500 permuta-
tions and then compute the cumulative distribution function (CDF) for those
16

Mean Correlation, D>N, Conflict effect on Reaction Time
Control Subjects
Norm / Loss Squared Absolute p
LASSO 0.16 (0.02) 0.27 (0.02) <0.01
k-support 0.22 (0.02) 0.24 (0.02) <0.05
p <0.001 0.21
Cocaine-Addicted Subjects
Norm / Loss Squared Absolute p
LASSO 0.27 (0.01) 0.37 (0.01) <0.001
k-support 0.33 (0.01) 0.36 (0.02) <0.001
p <0.001 0.96
Table 2: Mean (SE) correlation over 500 random permutations of the samples
between the predicted and the actual conflict effect on the reaction times for drug >
neutral using the limbic ROI, for all combinations of regularizers and loss functions.
The p-values were computed with a Wilcoxon signed rank test between the 500
correlation values for the two combinations of regularizer and loss function in
the preceding rows or columns. Based on the p-values, there is a statistically
significant difference between absolute loss predictions and squared loss predictions
and between LASSO and k-support norm with the squared loss function in both
cocaine and control subjects.
17

Mean Correlation, 50¢>0¢, Conflict effect on Accuracy
Control Subjects
Norm / Loss Squared Absolute p
LASSO 0.25 (0.02) 0.09 (0.02) <0.001
k-support 0.26 (0.02) 0.09 (0.02) <0.001
p 0.42 0.78
Cocaine-Addicted Subjects
Norm / Loss Squared Absolute p
LASSO 0.22 (0.02) 0.42 (0.02) <0.001
k-support 0.27 (0.01) 0.41 (0.02) <0.001
p <0.001 0.78
Table 3: Mean (SE) correlation over 500 random permutations of the samples
between the predicted and the actual response variables for 50¢> 0¢ using the Basal
Ganglia, Thalamus ROI, for all combinations of regularizers and loss functions.
The p-values were computed with a Wilcoxon signed rank test between the 500
correlation values for the two combinations of regularizer and loss function in
the preceding rows or columns. Based on the p-values there is a statistically
significant difference between absolute loss predictions and squared loss predictions
and between k-support and LASSO with the squared loss in cocaine-addicted
subjects only.
18
Voxel Selection Stability, D>N, Conflict effect on Reaction Time
Control Cocaine-Addicted
Norm / Loss Squared Absolute Squared Absolute
LASSO 0.0004 0.0007 0 0.0023
k-support 0.0029 0.0018 0.0058 0.0734
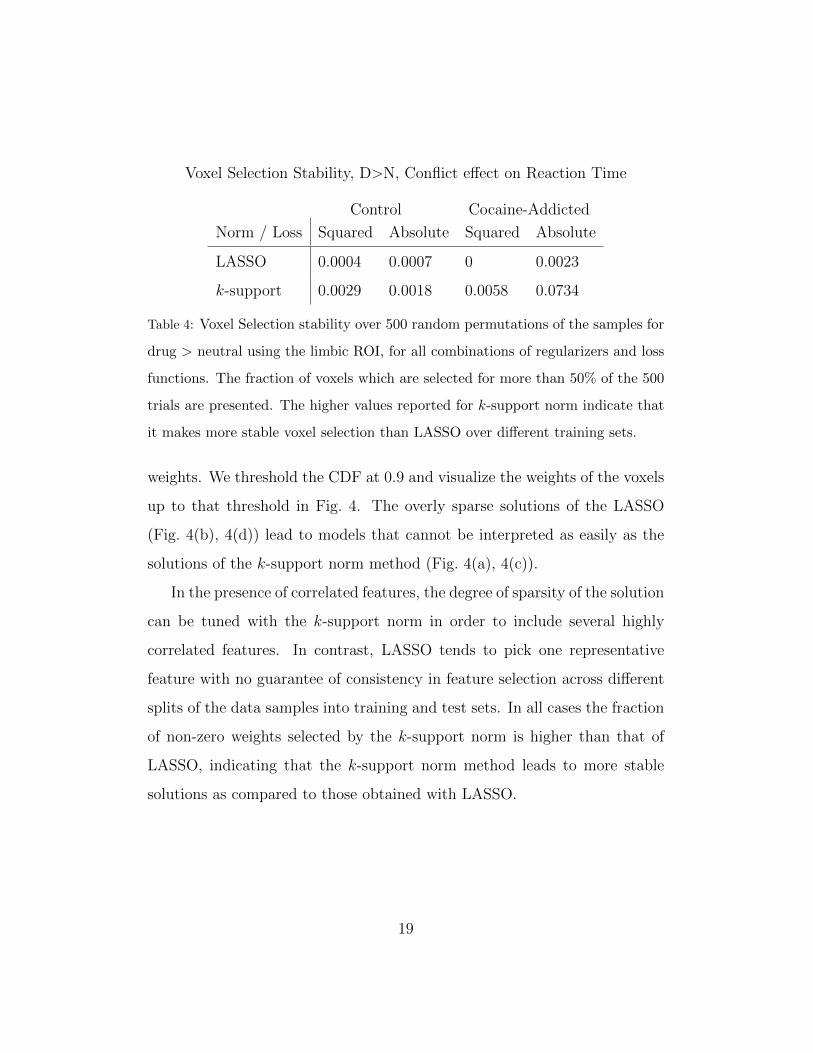
Table 4: Voxel Selection stability over 500 random permutations of the samples for
drug > neutral using the limbic ROI, for all combinations of regularizers and loss
functions. The fraction of voxels which are selected for more than 50% of the 500
trials are presented. The higher values reported for k-support norm indicate that
it makes more stable voxel selection than LASSO over different training sets.
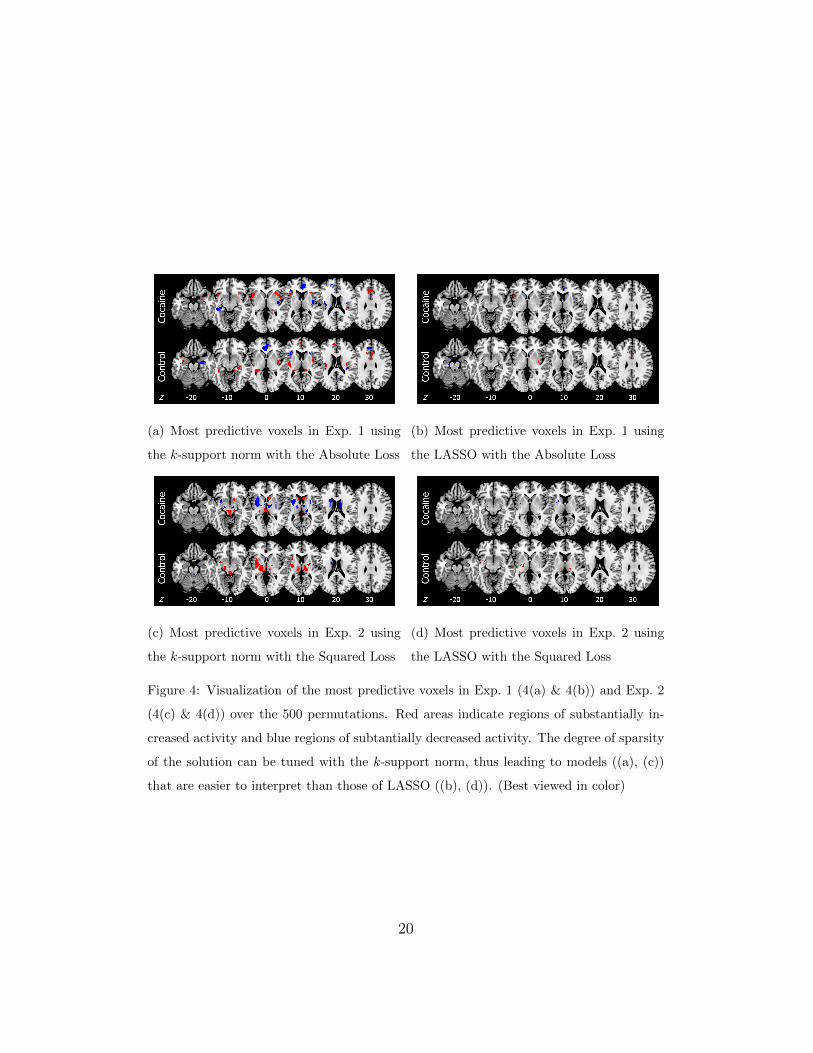
weights. We threshold the CDF at 0.9 and visualize the weights of the voxels
up to that threshold in Fig. 4. The overly sparse solutions of the LASSO
(Fig. 4(b), 4(d)) lead to models that cannot be interpreted as easily as the
solutions of the k-support norm method (Fig. 4(a), 4(c)).
In the presence of correlated features, the degree of sparsity of the solution
can be tuned with the k-support norm in order to include several highly
correlated features. In contrast, LASSO tends to pick one representative
feature with no guarantee of consistency in feature selection across different
splits of the data samples into training and test sets. In all cases the fraction
of non-zero weights selected by the k-support norm is higher than that of
LASSO, indicating that the k-support norm method leads to more stable
solutions as compared to those obtained with LASSO.
19
(a) Most predictive voxels in Exp. 1 using
the k-support norm with the Absolute Loss
(b) Most predictive voxels in Exp. 1 using
the LASSO with the Absolute Loss
(c) Most predictive voxels in Exp. 2 using
the k-support norm with the Squared Loss
(d) Most predictive voxels in Exp. 2 using
the LASSO with the Squared Loss
Figure 4: Visualization of the most predictive voxels in Exp. 1 (4(a) & 4(b)) and Exp. 2
(4(c) & 4(d)) over the 500 permutations. Red areas indicate regions of substantially in-
creased activity and blue regions of subtantially decreased activity. The degree of sparsity
of the solution can be tuned with the k-support norm, thus leading to models ((a), (c))
that are easier to interpret than those of LASSO ((b), (d)). (Best viewed in color)
20

Voxel Selection Stability, 50¢>0¢, Conflict effect on Accuracy
Control Cocaine-Addicted
Norm / Loss Squared Absolute Squared Absolute
LASSO 0.0004 0.0050 0.0008 0.0013
k-support 0.0037 0.0083 0.0223 0.0122
Table 5: Voxel Selection stability over 500 random permutations of the samples
for 50¢> 0¢ using the Basal Ganglia, Thalamus ROI, for all combinations of reg-
ularizers and loss functions. The fraction of voxels which are selected for more
than 50% of the 500 trials are presented. The higher values reported for k-support
norm indicate that it makes more stable voxel selection than LASSO over different
training sets.
4. Discussion
In our classification experiments we have shown that the k-support norm
can give better predictive performance than the LASSO and elastic net, while
having favorable mathematical and computational properties. Furthermore,
the brain regions implicated in addiction by the k-support norm coincide
with previous results on addiction indicating that the k-support norm is
additionally useful for generating sparse, but correlated, regions suitable for
interpretation in a medical-research setting
In our regression experiments, in almost all cases, the k-support norm
outperforms LASSO in predicting the behavioral measures given fMRI data
when combined with squared loss, while when combined with the absolute
loss, the predictive accuracy of the two regularizers does not differ signif-
icantly. The absolute loss led to higher predictions than squared loss for
both regularizers for almost all cases. The LASSO leads to sparse solutions,
21

since it tends to pick one feature per group of correlated features. On the
other hand, the k-support norm allows calibrating the cardinality of the solu-
tions and thus can select more interpretable groupings of correlated features
and also leads to more stable results across different training sets. Thus,
our results support the further exploration of the k-support norm for fMRI
analysis. Furthermore, we demonstrate that we can predict real valued be-
havioral variables measured in an inhibitory control task given fMRI data
from a different task, designed to capture emotionally-salient reward.
On the medical side, we also provide further evidence to support the I-
RISA model of drug addiction, whereby the skew in SA in cocaine abusers,
as indexed by fMRI response to drug words and monetary rewards, two
motivationally salient stimuli, is predictive of RI, as indexed by response
slowing and accuracy on a task requiring inhibitory control (the color-word
Stroop). Specifically, we show that in cocaine users, response to drug words
in voxels located in limbic brain regions, such as the anterior insula and ACC
implicated in emotion processing and emotion regulation, was predictive of
slower responses on the RI task (Exp. 1), while response to money in voxels
located in reward-related brain regions, such as the putamen implicated in
habits, was predictive of lower accuracy on the RI task (Exp. 2).
5. Conclusions
In this work, we have investigated the applicability of sparsity regularizers
in fMRI analyses. We have shown that the k-support norm can give better
predictive performance than the LASSO and elastic net, while having fa-
vorable mathematical and computational properties. Furthermore, the brain
22

regions implicated in addiction by the k-support norm coincide with previous
results on addiction, indicating that the k-support norm is additionally use-
ful for generating sparse, but correlated, regions suitable for interpretation
in a medical-research setting.
Acknowledgements
This work was supported in part by NIA 1R21DA034954-01, DIGITEO
2013-0788D - SOPRANO, and the European Commission through ERC Grant
259112, and FP7-MC-CIG 334380.
[1] J. Honorio, D. Tomasi, R. Z. Goldstein, H.-C. Leung, D. Samaras, Can
a single brain region predict a disorder?, IEEE Transactions on Medical
Imaging 31 (2012) 2062–2072.
[2] S. Song, Z. Zhan, Z. Long, J. Zhang, L. Yao, Comparative study of SVM
methods combined with voxel selection for object category classification
on fMRI data, PLoS One 6 (2011) e17191.
[3] A. Bartels, S. Zeki, Brain dynamics during natural viewing conditions–
a new guide for mapping connectivity in vivo, NeuroImage 24 (2005)
339–349.
[4] D. R. Hardoon, J. Mourao Miranda, M. Brammer, J. Shawe-Taylor,
Unsupervised analysis of fMRI data using kernel canonical correlation,
NeuroImage 37 (2007) 1250–1259.
[5] R. Jenatton, A. Gramfort, V. Michel, G. Obozinski, E. Eger, F. Bach,
B. Thirion, Multiscale mining of fmri data with hierarchical structured
sparsity, SIAM Journal on Imaging Sciences 5 (2012) 835–856.
23

[6] R. Tibshirani, Regression shrinkage and selection via the lasso, Journal
of the Royal Statistical Society Series B 58 (1996) 267–288.
[7] H. Zou, T. Hastie, Regularization and variable selection via the elastic
net, Journal of the Royal Statistical Society Series B 67 (2005) 301–320.
[8] A. Argyriou, R. Foygel, N. Srebro, Sparse prediction with the k-support
norm, in: F. Pereira, C. Burges, L. Bottou, K. Weinberger (Eds.), Ad-
vances in Neural Information Processing Systems 25, Curran Associates,
Inc., 2012, pp. 1457–1465.
[9] K. Gkirtzou, J. Honorio, D. Samaras, R. Goldstein, M. B. Blaschko,
fMRI analysis of cocaine addiction using k-support sparsity, in: Biomed-
ical Imaging (ISBI), 2013 IEEE 10th International Symposium on, pp.
1078–1081.
[10] M. Misyrlis, A. B. Konova, M. B. Blaschko, J. Honorio, N. Alia-Klein,
R. Z. Goldstein, D. Samaras, Predicting cross-task behavioral variables
from fMRI data using the k-support norm, in: Sparsity Techniques in
Medical Imaging, 2014.
[11] R. Goldstein, N. Volkow, Drug addiction and its underlying neurobio-
logical basis: Neuroimaging evidence for the involvement of the frontal
cortex, The American Journal of Psychiatry 159 (2002) 1642.
[12] M. B. Blaschko, A Note on k-support Norm Regularized Risk Minimiza-
tion, Technical Report, 2013. arXiv:1303.6390.
[13] B. Efron, T. Hastie, I. Johnstone, R. Tibshirani, Least angle regression,
The Annals of statistics 32 (2004) 407–499.
24

[14] J. Friedman, T. Hastie, R. Tibshirani, Regularization paths for general-
ized linear models via coordinate descent, Journal of statistical software
33 (2010) 1.
[15] A. Beck, M. Teboulle, A fast iterative shrinkage-thresholding algorithm
for linear inverse problems, SIAM Journal on Imaging Sciences 2 (2009)
183–202.
[16] J. Huang, S. Zhang, H. Li, D. Metaxas, Composite splitting algorithms
for convex optimization, Computer Vision and Image Understanding
115 (2011) 1610–1622.
[17] J. Huang, S. Zhang, D. Metaxas, Efficient mr image reconstruction for
compressed mr imaging, Medical Image Analysis 15 (2011) 670–679.
[18] R. Goldstein, N. Alia-Klein, D. Tomasi, J. Carrillo, T. Maloney,
P. Woicik, R. Wang, F. Telang, N. Volkow, Anterior cingulate cor-
tex hypoactivations to an emotionally salient task in cocaine addiction,
PNAS 106 (2009) 9453.
[19] A. Bartels, S. Zeki, The chronoarchitecture of the human brain–natural
viewing conditions reveal a time-based anatomy of the brain, NeuroIm-
age 22 (2004) 419–433.
[20] A. Bartels, S. Zeki, N. Logothetis, Natural vision reveals regional spe-
cialization to local motion and to contrast-invariant, global flow in the
human brain, Cerebral Cortex 18 (2008) 705–717.
[21] M. B. Blaschko, J. A. Shelton, A. Bartels, Augmenting feature-driven
fMRI analyses: Semi-supervised learning and resting state activity, in:
25

Y. Bengio, D. Schuurmans, J. Lafferty, C. Williams, A. Culotta (Eds.),
Advances in Neural Information Processing Systems 22, Curran Asso-
ciates, Inc., 2009, pp. 126–134.
[22] M. Blaschko, J. Shelton, A. Bartels, C. Lampert, A. Gretton, Semi-
supervised kernel canonical correlation analysis with application to hu-
man fMRI, Pattern Recognition Letters 32 (2011) 1572–1583.
[23] R. Goldstein, D. Tomasi, S. Rajaram, L. Cottone, L. Zhang, T. Maloney,
F. Telang, N. Alia-Klein, N. Volkow, Role of the anterior cingulate and
medial orbitofrontal cortex in processing drug cues in cocaine addiction,
Neuroscience 144 (2007) 1153–1159.
[24] S. J. Moeller, D. Tomasi, J. Honorio, N. D. Volkow, R. Z. Goldstein,
Dopaminergic involvement during mental fatigue in health and cocaine
addiction, Translational Psychiatry 2 (2012) e176.
[25] R. Z. Goldstein, P. A. Woicik, T. Maloney, D. Tomasi, N. Alia-Klein,
J. Shan, J. Honorio, D. Samaras, R. Wang, F. Telang, G.-J. Wang, N. D.
Volkow, Oral methylphenidate normalizes cingulate activity in cocaine
addiction during a salient cognitive task, Proceedings of the National
Academy of Sciences 107 (2010) 16667–16672.
[26] C. S. Culbertson, J. Bramen, M. S. Cohen, E. D. London, R. E. Olm-
stead, J. J. Gan, M. R. Costello, S. Shulenberger, M. A. Mandelkern,
A. L. Brody, Effect of bupropion treatment on brain activation induced
by cigarette-related cues in smokers, Archives of General Psychiatry 68
(2011) 505–515.
26

[27] T. R. Franklin, Z. Wang, Y. Li, J. J. Suh, M. Goldman, F. W. Lohoff,
J. Cruz, R. Hazan, W. Jens, J. A. Detre, W. Berrettini, C. P. O’Brien,
A. R. Childress, Dopamine transporter genotype modulation of neural
responses to smoking cues: Confirmation in a new cohort, Addiction
Biology 16 (2011) 308–322.
[28] H. W. Chase, S. B. Eickhoff, A. R. Laird, L. Hogarth, The neural
basis of drug stimulus processing and craving: An activation likelihood
estimation meta-analysis, Biological Psychiatry 70 (2011) 785–793.
[29] X. Liu, J. Hairston, M. Schrier, J. Fan, Common and distinct networks
underlying reward valence and processing stages: A meta-analysis of
functional neuroimaging studies, Neuroscience & Biobehavioral Reviews
35 (2011) 1219–1236.
27