Predictive Powertrain Management through Driver Behaviour ...
96
Predictive Powertrain Management through Driver Behaviour Recognition by, Patrick DiGioacchino A Thesis presented to the University of Waterloo in fulfillment of the thesis requirement for the degree of Master of Applied Science In Mechanical and Mechatronics Engineering Waterloo, Ontario, Canada, 2018 ©Patrick DiGioacchino 2018
Transcript of Predictive Powertrain Management through Driver Behaviour ...
Predictive Powertrain Management through
Driver Behaviour Recognition
by,
Patrick DiGioacchino
A Thesis
presented to the University of Waterloo
in fulfillment of the
thesis requirement for the degree of
Master of Applied Science
In
Mechanical and Mechatronics Engineering
Waterloo, Ontario, Canada, 2018
©Patrick DiGioacchino 2018

ii
Author’s Declaration
I hereby declare that I am the sole author of this thesis. This is a true copy of the thesis, including
any required final revisions, as accepted by my examiners.
I understand that my thesis may become electronically available to the public.
iii
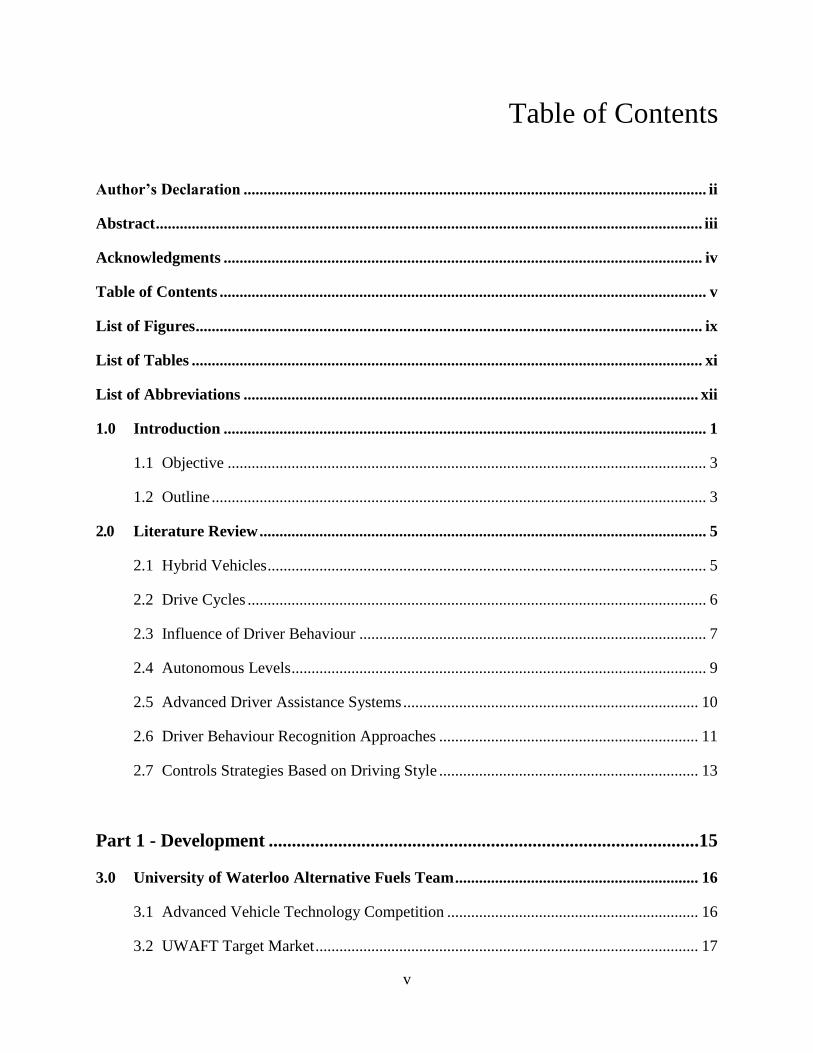
Abstract
With automotive trends leading towards electrification and inclusion of intelligent technology for
advanced driver assistance systems (ADAS), there is a need to research the use of advanced control
strategies. This report touches on the development of a powertrain model built in Simulink used
for simulation testing and vehicle development. While addressing the needs of incorporating state-
of-the-art technology, this report shows how a LiDAR and camera system can function together
as ADAS sensors for vehicle detection and range estimation. Lastly, the main purpose of this report
is to show how the UWAFT powertrain model and ADAS sensors, along with behaviour
recognition software, can be used to reduce emissions and energy consumption while also
increasing driveability.
Machine learning techniques are used to classify a driver’s behaviour on a spectrum from
aggressive to eco-cautious. 288 hours of driver behaviour data is simulated using the UWAFT’s
vehicle model built in Simulink. The data is labelled as aggressive, normal, or eco-cautious
depending on the scaling factor applied to the drive cycle inputted. Linear discriminant analysis is
performed to maximize the separation between classes and reduce the dimensionality. Support
vector machines are used to classify the driver’s behaviour. Lastly, fuzzy logic is used to assign a
driver an aggressiveness value between 0 and 100. The classifier implemented achieved 81.53%
accuracy; however, the aggression value assigned to the data via fuzzy logic is a more accurate
representation. Vehicle testing is performed with the use of a closed-loop testing track and a chassis
dynamometer. An acceleration test is conducted by applying a wide-open throttle in various
operating modes. This identified drive traces that are only achievable in certain modes, thus
concluding that if the driver’s behaviour is predicted prior to an acceleration event, the correct
operating mode could be selected ahead of time, increasing the driveability. Additionally, a
regenerative braking test is conducted on a chassis dynamometer to determine the optimal regen
torque parameters for a given braking rate. It is concluded that using the best parameters for a
stopping distance of 2 mph/s would result in a 0.003% state of charge gain per second. Therefore,
by knowing a driver’s braking behaviour the UWAFT PHEV could select the best parameters for
the current drive to decrease energy consumption.

iv
Acknowledgments
I would like to thank a family for their support through my entire education. I would also like to
thank Dr. Fraser and Dr. Fowler for their guidance in all past AVTC series pushing the entire team
to do their best. Lastly, I would like to thank the all the UWAFT team members who committed
time and resources to the EcoCAR 3 Camaro making all of this possible and developing lots of
good memories.
v
Table of Contents
Author’s Declaration .................................................................................................................... ii
Abstract ......................................................................................................................................... iii
Acknowledgments ........................................................................................................................ iv
Table of Contents .......................................................................................................................... v
List of Figures ............................................................................................................................... ix
List of Tables ................................................................................................................................ xi
List of Abbreviations .................................................................................................................. xii
1.0 Introduction ......................................................................................................................... 1
1.1 Objective ........................................................................................................................ 3
1.2 Outline ............................................................................................................................ 3
2.0 Literature Review ................................................................................................................ 5
2.1 Hybrid Vehicles .............................................................................................................. 5
2.2 Drive Cycles ................................................................................................................... 6
2.3 Influence of Driver Behaviour ....................................................................................... 7
2.4 Autonomous Levels ........................................................................................................ 9
2.5 Advanced Driver Assistance Systems .......................................................................... 10
2.6 Driver Behaviour Recognition Approaches ................................................................. 11
2.7 Controls Strategies Based on Driving Style ................................................................. 13
Part 1 - Development .............................................................................................15
3.0 University of Waterloo Alternative Fuels Team ............................................................. 16
3.1 Advanced Vehicle Technology Competition ............................................................... 16
3.2 UWAFT Target Market ................................................................................................ 17
vi
3.3 Vehicle Architecture..................................................................................................... 18
3.4 Non-Predictive Controls Strategy ................................................................................ 22
4.0 Powertrain Modeling......................................................................................................... 24
4.1 Engine ........................................................................................................................... 25
4.2 Transmission ................................................................................................................ 28
4.3 Electric Motor............................................................................................................... 29
4.4 Model Limitations ........................................................................................................ 30
5.0 Advanced Driver Assistance Systems .............................................................................. 32
5.1 Sensors.......................................................................................................................... 33
Forward Facing Camera ............................................................................................... 33
Light Detection and Ranging ....................................................................................... 34
Sensor Fusion ............................................................................................................... 35
5.2 Object Detection ........................................................................................................... 35
5.3 Range Estimation ......................................................................................................... 36
5.4 Object Tracking ............................................................................................................ 36
6.0 Predictive Controls Strategy Based on Driver Behaviour ............................................. 37
6.1 Overview ...................................................................................................................... 37
6.2 Technical Goals for Innovation Project ........................................................................ 38
6.3 Impact Metrics .............................................................................................................. 40
6.4 Machine Learning Methodology .................................................................................. 40
Feature Extraction ........................................................................................................ 41
Dimensionality Reduction ............................................................................................ 42
Classification ................................................................................................................ 43
vii
Part II - Applications .............................................................................................45
7.0 Vehicle and Environment Simulation .............................................................................. 46
8.0 Experimental Results ........................................................................................................ 48
8.1 Driver Behaviour Recognition ..................................................................................... 48
Driver Behaviour Classification ................................................................................... 48
Driver Behaviour Validation ........................................................................................ 50
Real World Results ....................................................................................................... 51
8.2 Chassis Dynamometer Regenerative Braking .............................................................. 53
Regenerative Braking Test Setup ................................................................................. 53
Regenerative Braking Results ...................................................................................... 55
8.3 Acceleration Testing..................................................................................................... 57
Acceleration Test Setup................................................................................................ 57
Acceleration Test Results ............................................................................................. 57
8.4 ADAS Algorithm Performance .................................................................................... 59
Object Detection Performance ..................................................................................... 60
Range Measurement Performance ................................................................................ 61
Part III - Conclusions ............................................................................................63
9.0 Conclusions ........................................................................................................................ 64
9.1 Driver Behaviour Recognition Experiment .................................................................. 64
9.2 Predictive Controls Strategy Experiments ................................................................... 65
9.3 ADAS Performance Experiment .................................................................................. 66
9.4 Innovation Project ........................................................................................................ 66
10.0 Discussions and Future Work .......................................................................................... 68
10.1 Recommendations for Future Work ............................................................................. 68
viii
Continued Vehicle Testing ........................................................................................... 68
Behaviour Recognition Refinement ............................................................................. 69
Additional Input Signals ............................................................................................... 69
Bayesian Network Development .................................................................................. 70
Gamification ................................................................................................................. 70
ADAS Potential Issues ................................................................................................. 71
References .................................................................................................................................... 72
Part IV - Appendices ............................................................................................77
A Vehicle Technical Specifications ...................................................................................... 78
B Regenerative Braking Test Results .................................................................................. 80
C Driver Behaviour Classification Example ....................................................................... 82
ix
List of Figures
Figure 1: Year Over Year Electric Vehicle Sales by Month in Canada [2] .................................... 5
Figure 2: NHTSA United State Motor Vehicle Fatalities [14] ..................................................... 10
Figure 3: UWAFT Target Market ................................................................................................. 18
Figure 4: UWAFT PHEV Architecture ........................................................................................ 19
Figure 5: UWAFT PHEV Parallel Configuration ......................................................................... 20
Figure 6: UWAFT PHEV Series Configuration ........................................................................... 20
Figure 7: UWAFT PHEV Electric Configuration ........................................................................ 20
Figure 8: High Level Non-Predictive Controls Operating Mode Strategy ................................... 23
Figure 9: UWAFT PHEV Autonomie Model ............................................................................... 24
Figure 10: Weber 850cc Manufacturer Performance Curve (Gasoline) ....................................... 25
Figure 11: Autonomie Honda Insight Engine Efficiency Map [39] ............................................. 26
Figure 12: Weber 850cc Brake Specific Fuel Consumption ........................................................ 27
Figure 13: Weber 850cc Dynamometer Performance Curve (E85) .............................................. 28
Figure 14: GKN AF130-4 Power/Torque Curve .......................................................................... 29
Figure 16: UWAFT ADAS Architecture ...................................................................................... 33
Figure 17: UWAFT PHEV OmniVision Camera Integration...................................................... 33
Figure 18: UWAFT PHEV Velodyne LiDAR Integration ........................................................... 34
Figure 19: Aggression Membership Function .............................................................................. 43
Figure 20: Distance from Support Vector Membership Function ................................................ 44
Figure 21: HWFET Drive Cycle [45] ........................................................................................... 46
Figure 22: Data Projected onto Feature 6 (A) and Feature 12 (B) ................................................ 48
Figure 23: Data Projected onto the First Two Linear Discriminants ............................................ 49
Figure 24: Support Vectors Graphed Over Data ........................................................................... 50
Figure 25: Aggression Level Projected onto City Map ................................................................ 52
Figure 26: Aggression Level Projected onto GPS Data................................................................ 52
Figure 27: Drive Cycle Used for Regenerative Braking Test ....................................................... 54
Figure 28: Regenerative Braking Profile Curves .......................................................................... 56
Figure 29: Vehicle Speed Trace during Wide Open Throttle Acceleration Test .......................... 58
x
Figure 30: Vehicle Speed Trace during Wide Open Throttle Acceleration Test .......................... 58
Figure 31: Vehicle Speed Trace during Wide Open Throttle Acceleration Test .......................... 59
Figure 32: ADAS Vehicle Approach Test .................................................................................... 60
Figure 33: ADAS Range Detection Performance Error ............................................................... 61
Figure 34: ADAS Range Rate Performance Error ........................................................................ 62
Figure 36: P3 Motor Temperature during Nine Regenerative Braking Tests ............................... 80
Figure 37: P3 Motor Current during Nine Regenerative Braking Tests ....................................... 81
Figure 38: Classification of One Driver Using Aggression Membership Function ..................... 82
Figure 39: Misclassification of One Driver Using Aggression Membership Function ................ 83
xi
List of Tables
Table 1: SAE (J3016) Autonomy Levels [13] ................................................................................ 9
Table 2: Transmissions Gear Ratio Efficiencies [39] ................................................................... 29
Table 3: LDA Variance for Each Eigenvalue ............................................................................... 49
Table 4: K-Fold Validation Accuracy........................................................................................... 51
Table 5: Calculated Results from Nine Regenerative Braking Events ......................................... 55
Table 6: ADAS Object Detection Accuracy Statistics ................................................................. 60
Table 7: UWAFT Vehicle Technical Specifications .................................................................... 78
xii
List of Abbreviations
ADAS Advanced Driver Assistance System
APP Accelerator Pedal Position
AV Autonomous Vehicles
AVTC Advanced Vehcile Technology Competition
BEV Battery Electric Vehicles
BPP Brake Pedal Position
CAD Computer Aided Design
CAN Controller Area Network
CD Charge Depleating
CIL Component-in-the-loop
CS Charge Sustaining
ECU Engine Control Unit
EPA Environmental Protection Agency
ESS Energy Storage System
GPS Global Positioning System
HEV Hybrid Electric Vehicles
HIL Hardware-in-the-loop
HUD Heads-up Display
HV High Voltage
HWFET Highway Fuel Economy Test
LDA Linear Discriminant Analysis
LV Low Voltage
MIL Model-in-the-loop
NHTSA National Highway Traffic Safety Administration
OBD On Board Diagnostic
xiii
P2 Pre-Transmission
P3 Post-Transmission
PCA Principal Component Analysis
PHEV Plug-in Hybird Electric Vehicles
R-CNN Regions with Convolutional Neural Nets
SAE Society of Automotive Engineers
SIL Softare-in-the-loop
SOC State of Charge
SVM Support Vector Machines
UWAFT University of Waterloo Alternative Fuels Team
VMT Vehicle Miles Travelled
YOLO You Only Look Once
1
CHAPTER 1
1.0 Introduction
In the following thesis, a predictive powertrain management strategy based on driver behaviour
recognition is explored. The topics discussed in this thesis were initiated by the EcoCAR 3
Advanced Vehicle Technical Competition (AVTC) run by the U.S. Department of Energy and
General Motors. The AVTC series provided students from across 16 North American universities
(14 American, 2 Canadian) with the opportunity to gain hands on automotive experience. From
modelling and architecture selection, to vehicle integration and road testing, students followed
automotive industry standards and best practices to design innovative vehicles of the future [1].
The EcoCAR 3 competition challenged students over the course of four years to reduce the
emissions of a 2016 Chevrolet Camaro while maintaining its legendary performance. Motivated
by the competition to explore leading-edge technologies, the University of Waterloo Alternative
Fuels Team (UWAFT) chose to look for areas in which machine intelligence could be incorporated
in the supervisory control of the vehicle. The particular area UWAFT chose to explore was the use
of machine intelligence to recognize a driver’s behaviour and predict their next move. Learning a
driver’s behaviour can be beneficial for a wide range of applications, which can be directly applied
to a vehicle’s supervisory controller. These include the following: assisting the powertrain energy
management leading to reduced emissions, improved fuel economy, improved drivability,
providing feedback to the driver to suggest driving habit improvements, and changing vehicle
parameters to suit a specific driver’s needs [2].
The need for more complex and integrated control strategies stems from the rise of more complex
vehicle architectures. The future of vehicle powertrains no longer consists of only an engine and
transmission. As the industry pushes to adopt green, environmentally friendly vehicles, the
vehicles are becoming more complex, incorporating components like electric motors, battery
packs, and fuel cells [3]. Thus, there is a need for more complex power management control
systems to maximize the range and use of each power source (fuel, electricity, hydrogen, etc.). The
1 Introduction
2
UWAFT-designed Camaro, a plug-in hybrid electric vehicle (PHEV), was used for experimental
data collection supporting the proof of concept and development of the driver behaviour
recognition algorithm.
The UWAFT PHEV has a series-parallel split architecture that is comprised of a 2-cylinder 850cc
engine, two electric motors, 8-speed transmission, a friction disk clutch and a 16.2kWh battery
pack. With such a multifaceted powertrain, it is difficult to determine which operating mode is the
best to be in at any given time. By predicting the driver’s behaviour, UWAFT’s power
management strategy can be greatly improved. A simple example of this is, if the vehicle knows
the driver behaves aggressively it may leave the engine on longer with the anticipation that the
driver may request torque shortly after braking. Two different experiments were conducted using
the UWAFT PHEV to show areas in which the behaviour recognition software could be used as a
solution to impact emissions and energy consumption.
This thesis uses the comprehensive powertrain model created for the controls development of the
UWAFT PHEV to assist in the training and validation of the recognition algorithm. The model
was first developed to validate the vehicle’s architecture design and determine the technical
specifications of the proposed architecture [4]. Over the course of the competition, the model
achieved higher fidelity through the incorporation of experimental data. This thesis discusses some
of the ways in which the model’s fidelity was improved, as well as how the model was used to
collect driver behaviour data.
Along with conventional vehicle data to determine a driver’s behaviour, advanced driver assistance
system (ADAS) sensors were investigated. With the future of the automotive industry pushing
toward autonomous vehicles, there is now an abundance of sensors all over vehicles collecting a
plethora of situational and environmental data [5]. This thesis explores the integration of ADAS
sensors onto the UWAFT PHEV and the possibilities of using them for driver behaviour
recognition. The ADAS sensors on the UWAFT PHEV focus on detecting vehicles in the front, in
the same lane, as well as in neighbouring lanes. Object detection, tracking, and range are all taken
into consideration. Lastly, this thesis outlines how the following machine learning techniques
were used to classify driver behaviour and assign them an aggression value: linear discriminant
analysis (LDA) for dimensionality reduction, support vector machines (SVM) for classification,
and fuzzy logic to assign an aggression value.
1 Introduction
3
1.1 Objective
The objective of this thesis is to provide the initial resources required to develop and apply a
predictive powertrain management strategy based on driver behaviour recognition, while also
highlighting the potential incorporation and use of a powertrain model and multiple advance driver
assistance system (ADAS) sensors. Additionally, provide a feasibility study for a unique approach
to driver behaviour recognition utilizing machine learning techniques that have yet to be applied
to this application.
1.2 Outline
The development of the tools and algorithms used for the predictive powertrain management
strategy are discussed in Part I of this report. The components that are discussed in this section of
the report are:
Chapter 3. University of Waterloo Alternative Fuels Team – Highlights how the advanced
vehicle technical competition and the target market influenced the innovation
project. As well, discuss the unique vehicle architecture chosen and current controls
strategy used with non-predictive aspects, which will later develop into a predictive
powertrain management controls strategy.
Chapter 4. Powertrain Modelling – Provides a brief overview of the powertrain model
developed for the UWAFT PHEV showing how comprehensive it is.
Chapter 5. Advanced Driver Assistance System – Discusses the integration and algorithms
used for the UWAFT PHEV ADAS sensors relating to object detection and range
estimations of vehicles in front of the driver.
Chapter 6. Predictive Controls Strategy Based on Driver Behaviour – Outlines the
technical goals and impact metrics for the innovation project, as well as provides
details of the machine learning algorithm used for driver behaviour recognition.
1 Introduction
4
Part II of this thesis focuses on the applications of the discussed tools and algorithms from Part I.
Through basic testing the feasibility of a predictive powertrain management strategy based on
driver behaviour is evaluated.
Chapter 7. Vehicle and Environment Simulation – Shows how the powertrain model is used
to create labelled data for the machine-learning algorithm.
Chapter 8. Experimental Results – Four different experiments are conducted to show the
effectiveness of each tool developed in Part 1. The first experiment applies the
labelled data collected in Chapter 7 to the driver behaviour recognition algorithm
developed in Chapter 6 to show the effectiveness of driver behaviour recognition.
Acceleration and regenerative braking experiments are conducted to show the
feasibility of a predictive powertrain management strategy. Lastly, the ADAS
sensors are tested to evaluate their accuracy.
Part III of this thesis concludes the results found in Part II and discusses recommendations and
future work.
5
CHAPTER 2
2.0 Literature Review
2.1 Hybrid Vehicles
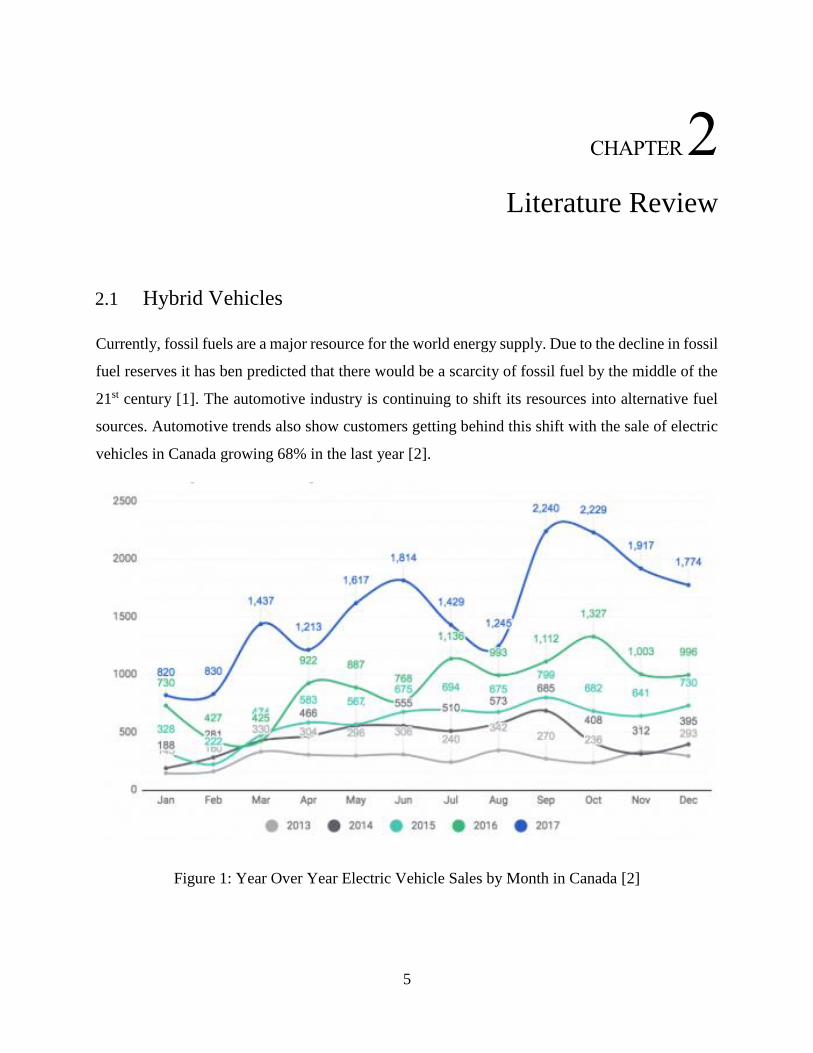
Currently, fossil fuels are a major resource for the world energy supply. Due to the decline in fossil
fuel reserves it has ben predicted that there would be a scarcity of fossil fuel by the middle of the
21st century [1]. The automotive industry is continuing to shift its resources into alternative fuel
sources. Automotive trends also show customers getting behind this shift with the sale of electric
vehicles in Canada growing 68% in the last year [2].
Figure 1: Year Over Year Electric Vehicle Sales by Month in Canada [2]
2 Literature Review
6
One of the most popular alternative fuels is electricity with the inclusion of a high voltage battery.
Battery electric vehicles (BEV) have only the battery as an energy source. BEVs are currently
trying to overcome the issue of range anxiety in customers. Essentially, customers do not want to
have to worry about whether or not their vehicle will make a longer trip. Neubauer [3] finds that
the effects of range anxiety can be significant, but are being reduced with access to additional
charging infrastructure.
Another way to alleviate range anxiety is with hybrid vehicles. Hybrid vehicles have two energy
sources, the most common being electric and gasoline. Having a small engine coupled with electric
motors reduces emissions as well as eliminates range anxiety as customer can fill up their car at
any gas station. A plug-in hybrid electric vehicle (PHEV) allows the vehicle to regain charge by
plugging into an external energy source.
UWAFT’s approach to designing a hybrid architecture was to minimize emissions and appeal to
customers with a PHEV that would primarily run on the electric power source over the average
commuting distance of 40.55 kilometers [4]. This approach results in significantly reduced tail
pipe emissions as the majority of the driving would be done in a full electric mode. At the same
time, having an engine still helps to remove the range anxiety that might be present in customers.
By shifting towards electric power and investing in clean energy sources the automotive industry
can reduce its environmental impact significantly.
2.2 Drive Cycles
Drive cycles are a velocity time graph used to represent the speed a vehicle is expected to match
during a testing procedure. In order to follow a drive trace properly, a large open track or a chassis
dynamometer is often required. Drive cycles are designed to test city driving, highway driving, or
a combination of both. The Environmental Protection Agency (EPA) has developed numerous
drive cycles for emissions and fuel economy testing for numerous scenarios [5]. They also provide
detailed information on drive cycles used by California, Europe and Japan. UWAFT has used a
variety of these drive cycles for vehicle testing and simulation as it provides a good tool to compare
UWAFT’s performance against other vehicles in the market.
2 Literature Review
7
2.3 Influence of Driver Behaviour
The major motivation behind the behind the predictive powertrain management strategy based on
driver behaviour recognition stems from the fuel saving opportunities related to a driver’s
behaviour. More so in hybrid vehicles, where range anxiety is a common concern, energy
consumption is a major focus for car manufacturers. Jimenez [6] incorporates a driver’s style to
predict their energy consumption over a given route. The results showed an increased reliability in
predicting energy consumption as well as enhanced customer confidence in the capabilities of
electric vehicles. These findings help to support the fact that a particular driving style has a
significant effect on an electric vehicle’s energy consumption as well as a conventional vehicle’s
fuel economy.
Not only do companies want to improve the range of their vehicles, they are also interested in
creating more environmentally friendly ones. Through reviewing a number of studies involving
fuel economy and driver behaviour there is a general agreement that 10% fuel savings can be
achieved by modifying the driver’s behavior. “Considering the effects of real-world driving
conditions, efficient driving behaviors could reduce fuel use by 20% on aggressively driven cycles
and by 5-10% on more moderately driven trips” [7].
Various papers discuss the cause of increased fuel economy; however, what it comes down to is
aggressive drivers requesting more power, thus needing more fuel to produce that power, as well
as the torque producing components not being able to operate in their most efficient speed.
Through large amounts of data collection, conclusions are drawn between the cause and effect of
a vehicle’s fuel economy. Ericsson [8] uses a large amount of driving cycle tests to determine the
impact of 62 driving pattern parameters on fuel economy and emissions. The study showed that
power demand, gear changing behavior, and speed level have an important effect on fuel
consumption and emissions. Lee and Son [9] found a relationship between fuel consumption,
vehicle speed, gear selection, steering angle, as well as acceleration/brake pedal position. They
concluded that fuel efficiency was significantly affected by average accelerator pedal position on
the highway.
Along with these findings come countless attempts to mitigate a driver’s aggressive behaviours
through a feedback system in the vehicle. The aim is to improve the customer’s driving behaviour
2 Literature Review
8
without affecting their expectations and requirements. Driver feedback systems can be integrated
into a vehicle in a number of ways, the most popular are described briefly below.
1. Heads-Up Display (HUD) – An LED screen projected onto the glass windshield.
Example: Used by General Motors to display vehicle speed.
2. Flashing Lights – LED lights incorporated into the interior or a part of the HUD to convey
warning signs. Example: General Motors flashes a red light on the HUD when it predicts
a head-on collision is near.
3. Haptic Seat – Vibration motors placed inside the driver’s seat. Example: General Motors
uses haptic seats to warn the driver they are exiting the right side of a lane unintentionally
by vibrating the right side of the seat.
4. Haptic Steering Wheel – Vibration motors placed inside the driver’s steering wheel.
Example: General Motors vibrates the steering wheel to warn the driver it is leaving super
cruise and the driver must take over vehicle operations.
Conveying to the driver better habits is proving a difficult task, partly due to the delay in a driver’s
response to a feedback system. If the driver has already accelerated aggressively, alerting him to
slow down can be annoying as well as too late. Therefore, for a feedback system to be non-
intrusive, it will be unable to recover all the fuel saving associated with a driver’s behaviour;
however, it can still do a good job. Syed et al. [10] statistically quantified fuel economy
improvements using haptic and visual feedback mechanisms. The study results demonstrated that
a driver feedback system could achieve up to 6% fuel economy improvements without
significantly affecting the drivability of the vehicle.
2 Literature Review
9
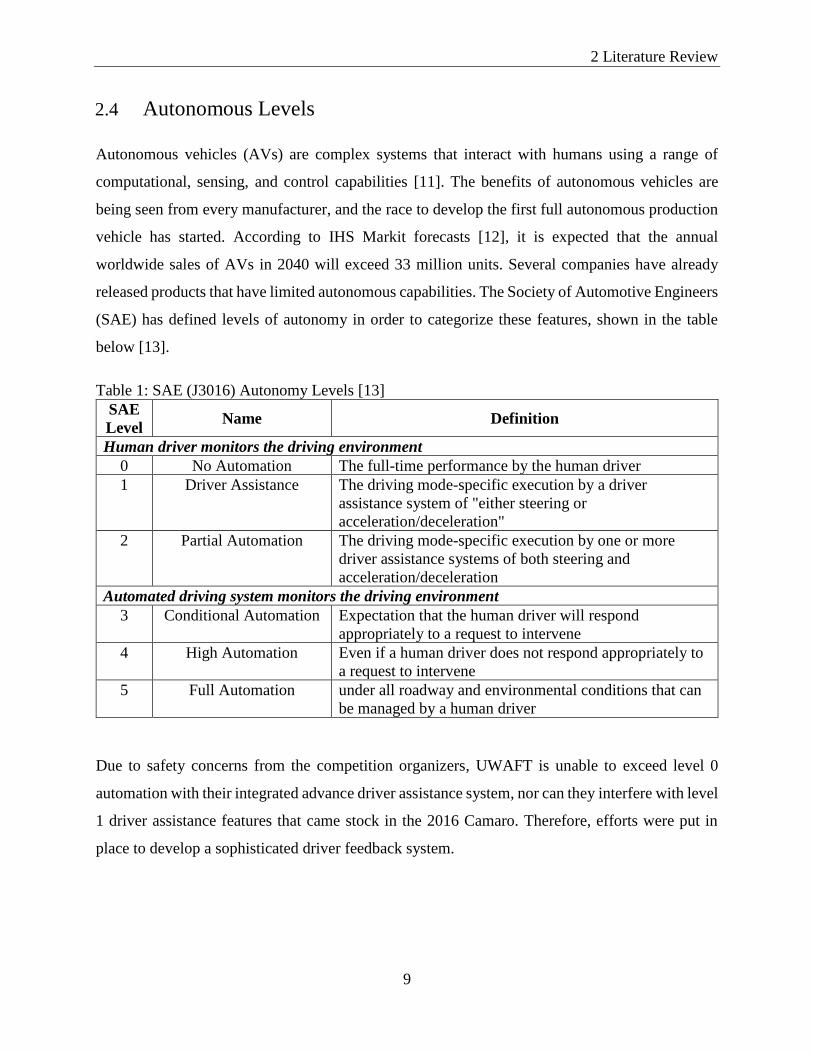
2.4 Autonomous Levels
Autonomous vehicles (AVs) are complex systems that interact with humans using a range of
computational, sensing, and control capabilities [11]. The benefits of autonomous vehicles are
being seen from every manufacturer, and the race to develop the first full autonomous production
vehicle has started. According to IHS Markit forecasts [12], it is expected that the annual
worldwide sales of AVs in 2040 will exceed 33 million units. Several companies have already
released products that have limited autonomous capabilities. The Society of Automotive Engineers
(SAE) has defined levels of autonomy in order to categorize these features, shown in the table
below [13].
Table 1: SAE (J3016) Autonomy Levels [13]
SAE
Level Name Definition
Human driver monitors the driving environment
0 No Automation The full-time performance by the human driver
1 Driver Assistance The driving mode-specific execution by a driver
assistance system of "either steering or
acceleration/deceleration"
2 Partial Automation The driving mode-specific execution by one or more
driver assistance systems of both steering and
acceleration/deceleration
Automated driving system monitors the driving environment
3 Conditional Automation Expectation that the human driver will respond
appropriately to a request to intervene
4 High Automation Even if a human driver does not respond appropriately to
a request to intervene
5 Full Automation under all roadway and environmental conditions that can
be managed by a human driver
Due to safety concerns from the competition organizers, UWAFT is unable to exceed level 0
automation with their integrated advance driver assistance system, nor can they interfere with level
1 driver assistance features that came stock in the 2016 Camaro. Therefore, efforts were put in
place to develop a sophisticated driver feedback system.
2 Literature Review
10
2.5 Advanced Driver Assistance Systems
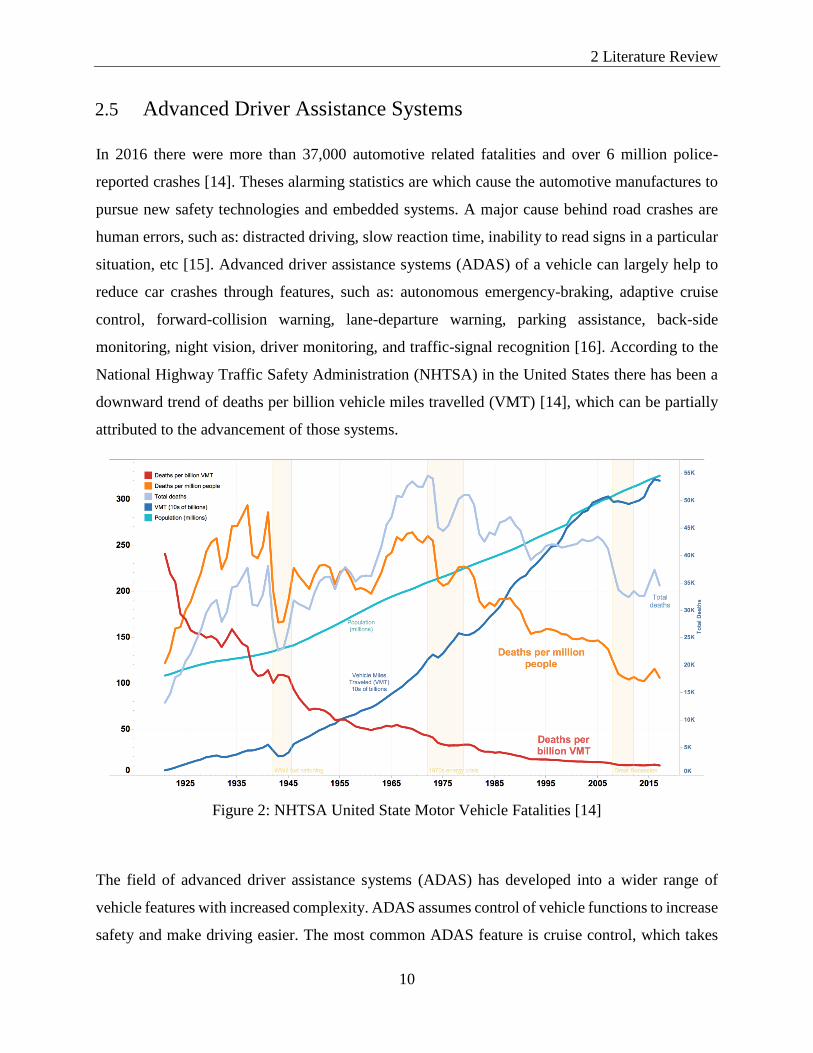
In 2016 there were more than 37,000 automotive related fatalities and over 6 million police-
reported crashes [14]. Theses alarming statistics are which cause the automotive manufactures to
pursue new safety technologies and embedded systems. A major cause behind road crashes are
human errors, such as: distracted driving, slow reaction time, inability to read signs in a particular
situation, etc [15]. Advanced driver assistance systems (ADAS) of a vehicle can largely help to
reduce car crashes through features, such as: autonomous emergency-braking, adaptive cruise
control, forward-collision warning, lane-departure warning, parking assistance, back-side
monitoring, night vision, driver monitoring, and traffic-signal recognition [16]. According to the
National Highway Traffic Safety Administration (NHTSA) in the United States there has been a
downward trend of deaths per billion vehicle miles travelled (VMT) [14], which can be partially
attributed to the advancement of those systems.
Figure 2: NHTSA United State Motor Vehicle Fatalities [14]
The field of advanced driver assistance systems (ADAS) has developed into a wider range of
vehicle features with increased complexity. ADAS assumes control of vehicle functions to increase
safety and make driving easier. The most common ADAS feature is cruise control, which takes
2 Literature Review
11
over the accelerator pedal to maintain a constant speed set by the driver. Over the years, this and
many other ADAS features have developed towards more autonomy. ADAS sensors are used to
detect environmental factors such as other motor vehicles, pedestrians, or obstacles in the way.
Todays vehicles are equipped with LiDAR, RADAR, and numerous camera has to capture as much
information as possible.
2.6 Driver Behaviour Recognition Approaches
One of the main functions of a predictive powertrain management strategy based on driver
behaviour is being able to accurately learn and classify a driver’s behaviour. Fortunately, many
different researchers have already explored driver behaviour recognition due to the increase in
autonomous driving needs. Machine intelligence is a relatively large field of study and growing in
interest; therefore, there are lots of different techniques and algorithms available. Often times there
are multiple approaches to solve a problem and finding the best one can be difficult. Thus, it is
important to investigate the approaches already taken and their individual successes. This
ultimately helped UWAFT to determine their own approach for learning driver behaviour.
Investigating different machine learning projects can be broken down into three main parts: the
characteristic chosen to classify, the data used to train the algorithms, and the algorithms or
techniques used for classification. Some of the approaches found are highlighted below.
Lui [17] was able to successfully characterize and detect driving maneuvers related to different
types of lane changes.
1. Characteristic – Classify driver behaviour during lane changes into three categories,
emergency lane change, ordinary lane change, and lane keeping
2. Data – Collected vehicle data with the use of a driver simulator
3. Techniques – Hidden Markov Models
Clustering is a machine learning technique in which the specific classes or the number of classes
is unknown. Clustering will determine the right number of groups and cluster the data in each
group. Si [18] demonstrated the possibility of recognizing different patterns in various driving
circumstances.
2 Literature Review
12
1. Characteristic – Driving pattern clusters (i.e. a specific type of driver will belong to cluster
of data with similar driving style)
2. Data – Vehicle-related parameters (e.g. acceleration and jerk), in combination with
additional environmental and road characteristics (e.g. road style, and inclination)
3. Techniques – K-Means Clustering
Apart from using vehicle data, there have also been attempts to use external sensors to collect data
for classification. Brombacher [19] mounted a Raspberry Pi with inertial and GPS modules on the
dashboard creating a low-cost measurement device.
1. Characteristic – Classify driving events into different longitudinal and lateral event class,
such as defensive acceleration, sporty acceleration, defensive light turn, and sporty light
turn.
2. Data – Longitudinal acceleration, lateral acceleration, yaw rate, and velocity.
3. Techniques – Artificial Neural Networks
Similarly, Trividi [20] and Minh [21] uses lateral and longitudinal acceleration values as indicators
to determine aggressive drivers. Trividi concluded that 97% of aggressive events were correctly
identified.
Supervised machine learning methods are widely used; however, they require a large amount of
labelled training data. Wang [22] avoided this need by implementing a semi-supervised approach
to classify drivers into aggressive and normal styles.
1. Characteristic – Two classes: aggressive and normal driving behaviour.
2. Data – Throttle, braking force, steering wheel angle, longitudinal and lateral speed.
3. Techniques – Semi-supervised Support Vector Machines
One of the simpler techniques uses the readings of a two-axis accelerometer and speed to feed into
a fuzzy logic system to classify a driver [23]. After reading numerous techniques to recognize a
driver’s behaviour, the most common data used is vehicle velocity, acceleration, and jerk. An
investigation reveals that the acceleration and jerk-based driving style classifications are only
applicable to certain driving conditions, prompting the need for a more comprehensive
2 Literature Review
13
classification of driving style [24]. Along with the need to require large amounts of labelled
training data for supervised learning [22], UWAFT aimed to develop a comprehensive
classification of driver behaviour via supervised learning techniques. To overcome the hurdle of
obtaining large amounts of labelled training data, UWAFT used a vehicle model to simulate the
data.
2.7 Controls Strategies Based on Driving Style
Very few have attempted to incorporate driver behaviour recognition into a controls system.
However, there have been several successful implementations of adaptive changes to vehicle
parameters and supervisory controllers, based on driving behaviour. Malikopoilos [25],
demonstrated the feasibility of a self-learning controller for optimal injection timing in a diesel
engine based on individual driving styles. “That is, while the driver drives the vehicle, the
controller identifies engine realization as designated by the driver’s driving style. At the same time,
the controller utilizes a lookahead algorithm to derive the values of the controllable variable for
this realization” [25]. Ultimately, Malikopoilos achieved 8.4% fuel consumption improvements.
This is very successful given that they were focusing their efforts for only one parameter change
and still achieved meaningful results.
Lee et al. [26] investigates the application for hybrid electric vehicles (HEVs). “The consideration
of different driving patterns in supervisory control design improves the fuel economy further and
makes the HEV performance less sensitive to variations of driving conditions. Thus, Adaptive
strategies with respect to driving patterns in HEVs can lead to further fuel economy improvement
under real-world driving conditions” [26]. Lee goes on to discuss how the operating mode of HEV
and various propulsion and braking parameters can be optimized based on a driving pattern.
The UWAFT PHEV’s unique architecture posses as an excellent test subject to learn how such
driver behaviour recognition algorithms can be incorporated into the supervisory controllers. The
UWAFT hybrid supervisory controller’s most important job is to handle torque requests and
determine how to split the torque between the electric motors and engine. UWAFT has decided to
develop experiments to show how the use of driver behaviour recognition can help determine the
optimal mode of the vehicle as well as help tune regenerative braking parameters. It was decided

2 Literature Review
14
not to experiment with engine tuning based on driving style, as there was a lot of mechanical
downtime related to getting the engine to run. On the other hand, the post-transmission electric
motor that handles all of the regenerative braking torque requests was very reliable for testing.

15
PART I - Development
16
CHAPTER 3
3.0 University of Waterloo Alternative Fuels Team
3.1 Advanced Vehicle Technology Competition
The University of Waterloo Alternative Fuels Team (UWAFT) is a student design team established
in 1995 with a rich history in Advanced Vehicle Technology Competitions (AVTC). EcoCAR 3
is the latest AVTC run by the U.S. Department of Energy, which challenged teams to convert a
2016 Chevrolet Camaro into a Plug-in Hybrid Electric Vehicle (PHEV) by demonstrating
emerging automotive technologies, while still maintaining the expected performance associated
with the Camaro. One of the main goals of the EcoCAR 3 competition was to reduce emissions
and create the ultimate energy-efficient, high performance vehicle [27].
EcoCAR 3 was a four-year competition (2014-2018) with different goals and milestones set out
each year. Year 1 focused on vehicle architecture selection and target market research. Year 2 was
the integration year where a ‘mule’ vehicle (60% ready) was developed. Finally, years 3 and 4
were refinement years to get the designed vehicles roadworthy. One of the major goals for teams
in year 4 is reaching the 99% milestone, which is a “showroom ready” vehicle [1].
The competition was split into multiple swim-lanes as established by the competition organizers
(U.S. Department of Energy). Each swim-lane had its own defined set of goals and tasks within a
specific disciplinary focus. The swim-lanes were as follows:
1. Project Management – provide management and planning for the overall project so that
the team can operate more efficiently and better align with business and automotive
industry practices [28].
2. Mechanical – develop a comprehensive computer-aided design (CAD) model of the
vehicle, reach 100% integration of system for full functionality, optimize mechanical
systems (safety, weight, serviceability, consumer appeal), and tune vehicle dynamics [29].
3 University of Waterloo Alternative Fuels Team
17
3. Controls and Modelling – refine hybrid strategies to improve reliability, energy
consumption, emissions, drivability and performance in all modes. Utilise a combination
of software-in-the-loop (SIL), hardware-in-the-loop (HIL), and vehicle testing
environments to accomplish these activities [30].
4. Electrical and Advance Driver Assistance Systems (ADAS) – obtain 100% integration
of low voltage (LV) and high voltage (HV) systems, develop and deploy ADAS and driver
feedback systems [31].
5. Innovation – develop a selected topic and obtain actual data and functionality by the end
of the year [32].
UWAFT’s team structure also followed the swim-lanes defined by the competition, creating four
sub-teams: mechanical, controls, ADAS, and innovation.
3.2 UWAFT Target Market
The target market is the customers that, through research, UWAFT believes would be interested
in purchasing the UWAFT PHEV. It is important to reflect back on the target market decided upon
in year 1. Given the limited time and resources UWAFT has at its disposal, projects are often
scrapped due to lack of one or the other. Therefore, determining a project’s impact on the target
market can help determine its importance.
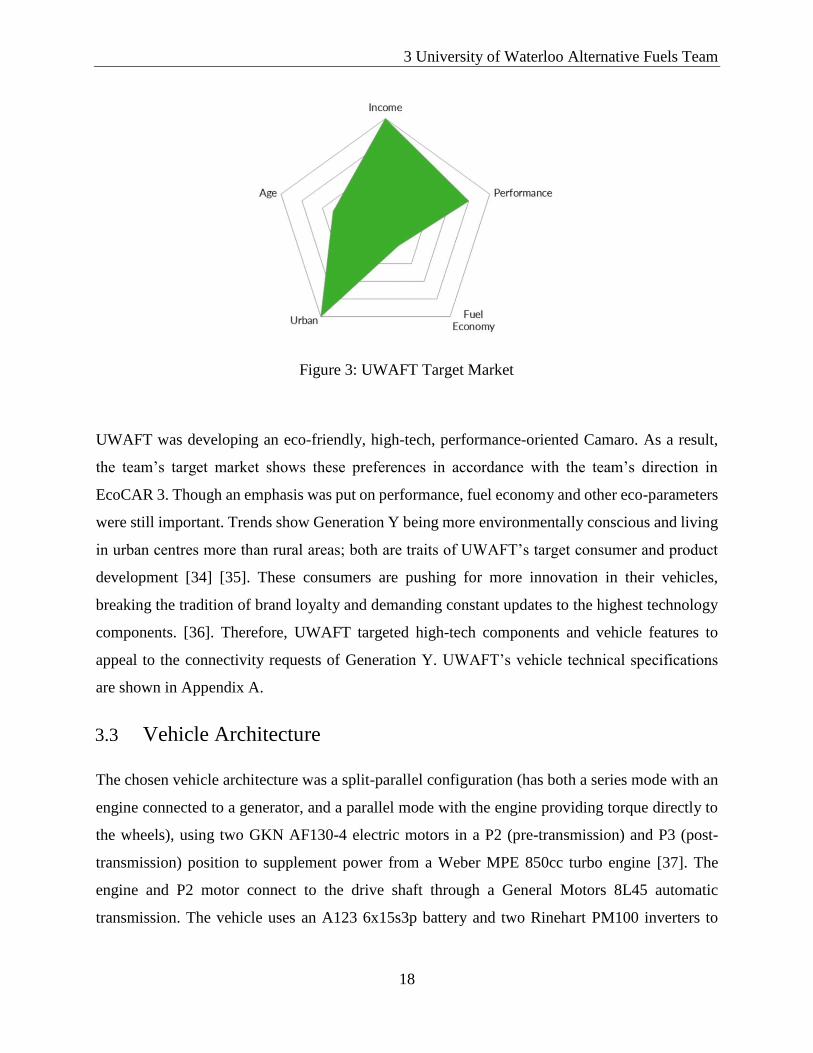
In order to identify the target market for UWAFT’s Camaro, segments based on income,
performance expectations, environmental considerations, population density, and age were created
[33]. UWAFT decided to focus on people in their late 20s and 30s who are high-income earners,
performance oriented, and live in urban areas. This will be herein referred to as UWAFT’s target
market, and is graphically shown in the spider diagram below. The spider diagram is created using
a scaled qualitative (fuel economy and performance) and quantitative (age, income, and
rural/urban) analysis between zero and one.
3 University of Waterloo Alternative Fuels Team
18
Figure 3: UWAFT Target Market
UWAFT was developing an eco-friendly, high-tech, performance-oriented Camaro. As a result,
the team’s target market shows these preferences in accordance with the team’s direction in
EcoCAR 3. Though an emphasis was put on performance, fuel economy and other eco-parameters
were still important. Trends show Generation Y being more environmentally conscious and living
in urban centres more than rural areas; both are traits of UWAFT’s target consumer and product
development [34] [35]. These consumers are pushing for more innovation in their vehicles,
breaking the tradition of brand loyalty and demanding constant updates to the highest technology
components. [36]. Therefore, UWAFT targeted high-tech components and vehicle features to
appeal to the connectivity requests of Generation Y. UWAFT’s vehicle technical specifications
are shown in Appendix A.
3.3 Vehicle Architecture
The chosen vehicle architecture was a split-parallel configuration (has both a series mode with an
engine connected to a generator, and a parallel mode with the engine providing torque directly to
the wheels), using two GKN AF130-4 electric motors in a P2 (pre-transmission) and P3 (post-
transmission) position to supplement power from a Weber MPE 850cc turbo engine [37]. The
engine and P2 motor connect to the drive shaft through a General Motors 8L45 automatic
transmission. The vehicle uses an A123 6x15s3p battery and two Rinehart PM100 inverters to
3 University of Waterloo Alternative Fuels Team
19
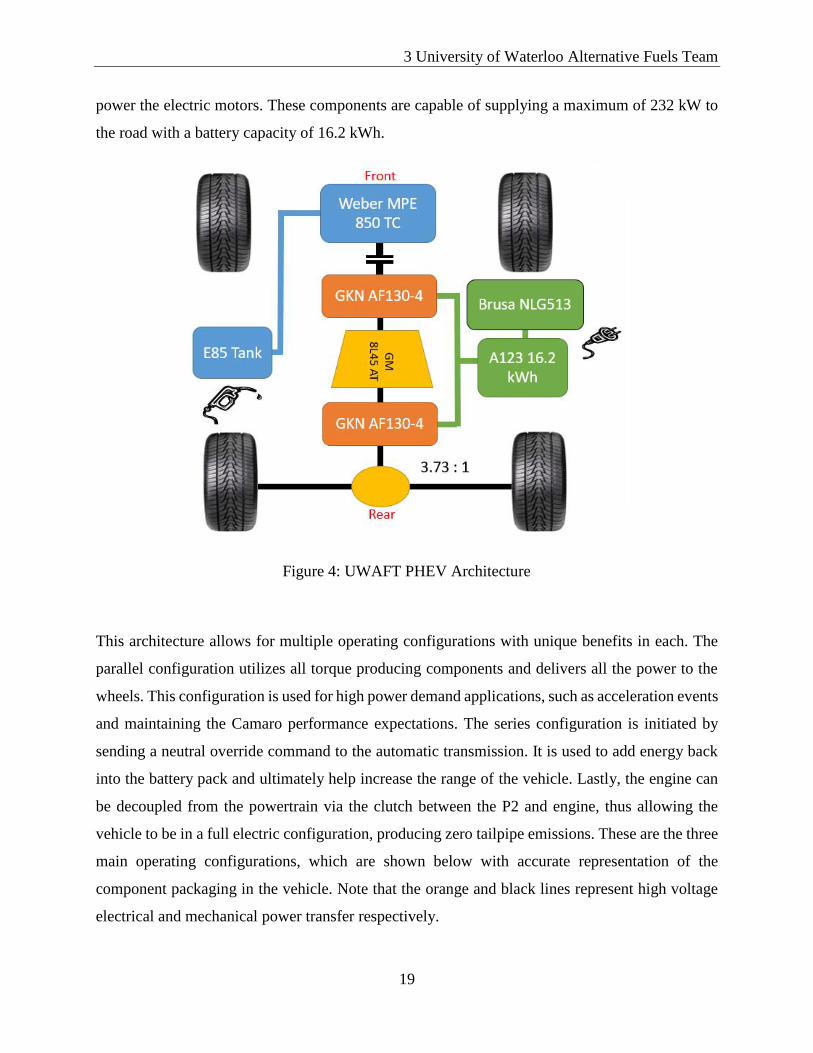
power the electric motors. These components are capable of supplying a maximum of 232 kW to
the road with a battery capacity of 16.2 kWh.
Figure 4: UWAFT PHEV Architecture
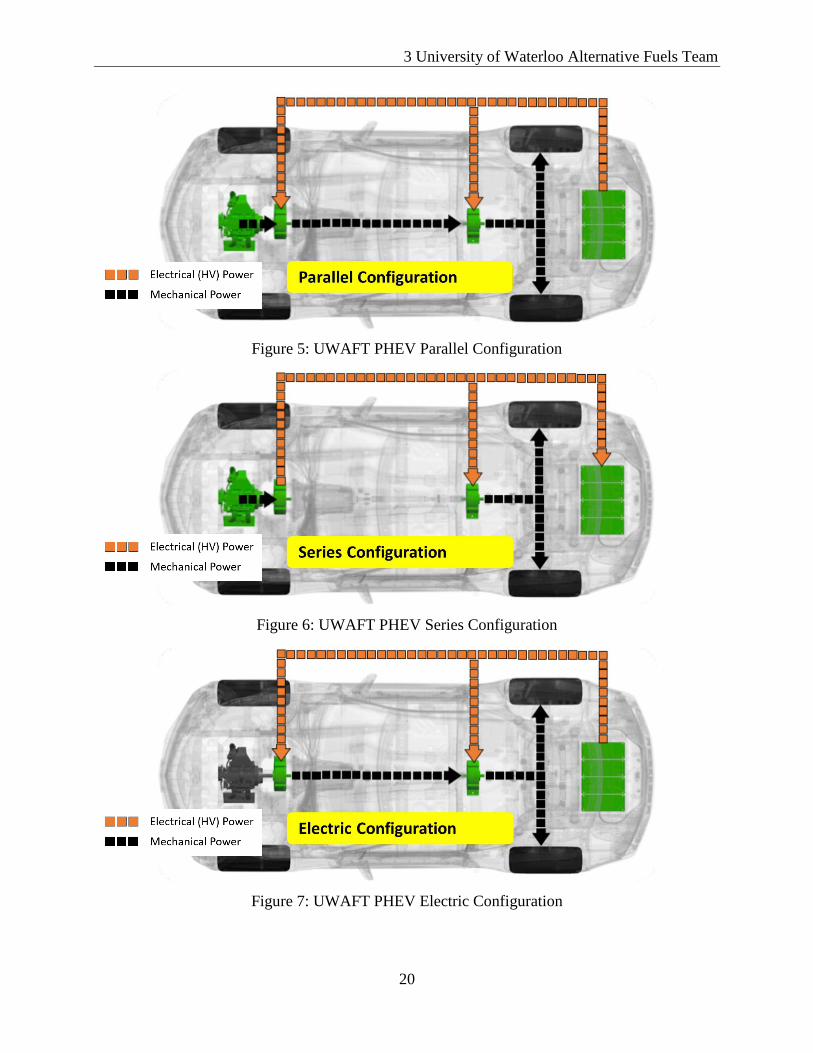
This architecture allows for multiple operating configurations with unique benefits in each. The
parallel configuration utilizes all torque producing components and delivers all the power to the
wheels. This configuration is used for high power demand applications, such as acceleration events
and maintaining the Camaro performance expectations. The series configuration is initiated by
sending a neutral override command to the automatic transmission. It is used to add energy back
into the battery pack and ultimately help increase the range of the vehicle. Lastly, the engine can
be decoupled from the powertrain via the clutch between the P2 and engine, thus allowing the
vehicle to be in a full electric configuration, producing zero tailpipe emissions. These are the three
main operating configurations, which are shown below with accurate representation of the
component packaging in the vehicle. Note that the orange and black lines represent high voltage
electrical and mechanical power transfer respectively.
3 University of Waterloo Alternative Fuels Team
20
Figure 5: UWAFT PHEV Parallel Configuration
Figure 6: UWAFT PHEV Series Configuration
Figure 7: UWAFT PHEV Electric Configuration
3 University of Waterloo Alternative Fuels Team
21
Along with these operating configurations come many variations depending on the state of the
vehicle. For the ease of controls organization, the different vehicle configurations are split into six
different operating modes depending on the state of the powertrain components. There are various
charge-depleting (CD) modes and charge-sustaining (CS) modes that the vehicle can operate. The
selected drive mode and drive mode transitions are determined by factors such as energy storage
system (ESS), state of charge (SOC), and torque demanded. When the net charge of the battery
pack is decreasing, the vehicle is in a charge depleting mode.
The UWAFT PHEV can operate in three different CD modes.
1. CD P3 Only mode
2. CD Full Electric mode
3. CD Performance mode
The UWAFT PHEV is capable of two all-electric CD modes: one utilizing just the P3 motor and
the other utilizing both electric motors. The P3 only mode is beneficial for applications where the
SOC is high and the torque demand is below the specification of the P3 motor. When an increase
in torque is requested beyond the limits of the P3 motor alone, the P2 electric motor will engage
through the transmission providing additional power. Additionally, the P3 only mode is used when
the vehicle is in reverse.
If the torque demanded exceeds the limits of the combined P2 and P3 motors, the clutch will
engage the engine that will work with the motors to provide additional power. This is called
performance mode since it offers the most power to the wheels.
A vehicle is in charge sustaining mode when the charge of the battery remains level or rises. The
UWAFT PHEV switches to charge sustaining mode when the SOC of the battery pack falls below
a certain threshold. Similarly, the UWAFT PHEV is capable of three different CS modes.
1. CS Series
2. CS Parallel
3. CS Engine Only
In CS series, a neutral override is sent to the transmission allowing the P3 motor to drive the wheels
while the engine and P2 motor act as a generation set providing power to the battery pack. Having
3 University of Waterloo Alternative Fuels Team
22
the generation set disconnected from the wheels allows it to operate at the highest efficiency point.
If the torque demands exceed the limits of the P3 motor, the vehicle will enter CS parallel mode
where all torque-producing components connect to the wheels. When all of the torque produced
by the engine is not required at the wheels, the P2 motor acts as a generator (applies braking torque)
to sustain the charge of the battery pack. Lastly, in engine only CS mode the vehicle behaves as a
conventional vehicle. This drive mode is beneficial when the electric powertrain is no longer useful
(zero charge/failure).
3.4 Non-Predictive Controls Strategy
UWAFT follows a model-based design approach for controls development. By following the
stages of Model-in-the-Loop (MIL), Software-in-the-Loop (SIL), Hardware-in-the-Loop (HIL),
and Component-in-the-Loop (CIL) before integrating hardware into the vehicle, the team was able
to change modeling information and control algorithms quickly. As the fidelity of the results
increase so does the complexity of the model. Validation can be performed at each stage of
development, and the team can go back in the process should any new developments occur. The
hybrid supervisory controller is modelled by the SIL. Although the supervisory control takes care
of an abundance of controls in the vehicle, for the purpose of this report it is only important to
discuss the torque control strategy in a bit more detail as it pertains directly to the systems
discussed in the following chapters.
The torque control strategy of the UWAFT PHEV is complex in nature due to the complexity of
the chosen architecture (having multiple torque producing components and multiple drive modes).
The torque control strategy determines the appropriate vehicle drive mode and values (set-points,
minimums/maximums) to effectively control the different torque-producing components
depending on which drive mode the vehicle is in. The subsection called Drive Mode Aim calculates
the desired drive mode given the information of the faults, current drive mode, computed torque
splitting between components and other input signals. Kartha’s thesis is a source for a more in
depth look at UWAFT’s non-predictive controls strategy [38].
The transitions are determined primarily based on requested torque from the driver and state of
charge (SOC) of the battery pack. At a high level, the vehicle will transition into charge sustaining
modes when the SOC falls below a certain threshold, and will transition into higher performance
3 University of Waterloo Alternative Fuels Team
23
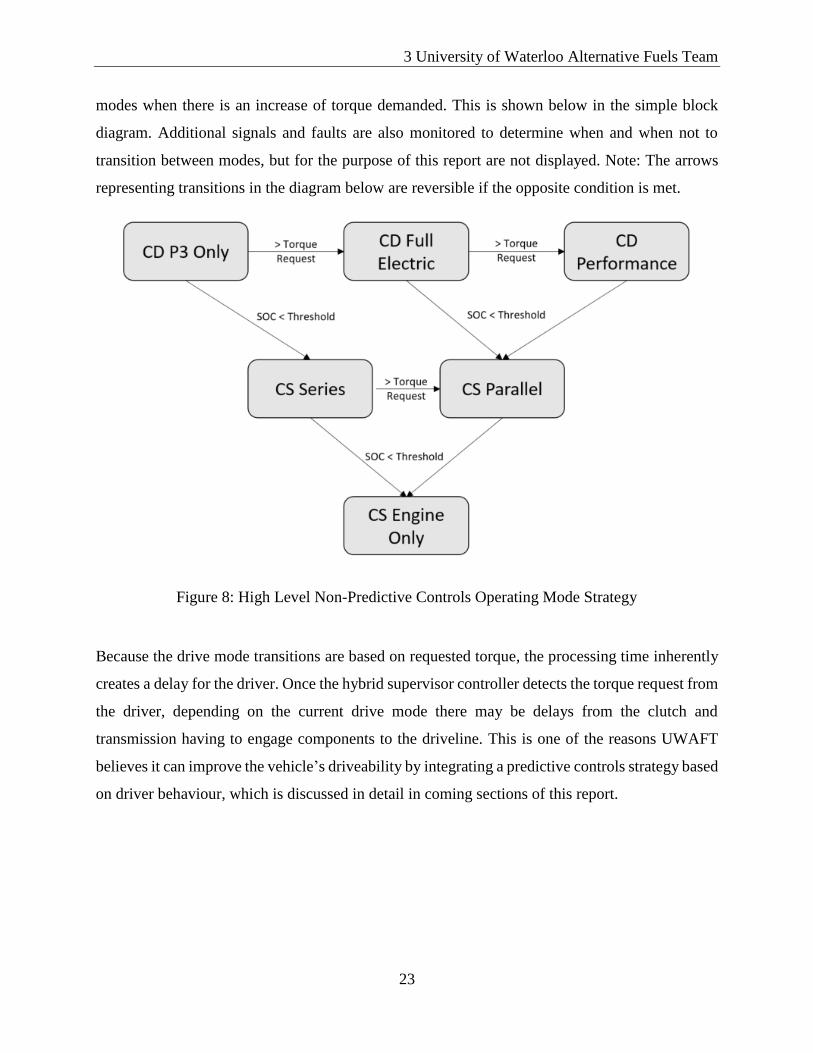
modes when there is an increase of torque demanded. This is shown below in the simple block
diagram. Additional signals and faults are also monitored to determine when and when not to
transition between modes, but for the purpose of this report are not displayed. Note: The arrows
representing transitions in the diagram below are reversible if the opposite condition is met.
Figure 8: High Level Non-Predictive Controls Operating Mode Strategy
Because the drive mode transitions are based on requested torque, the processing time inherently
creates a delay for the driver. Once the hybrid supervisor controller detects the torque request from
the driver, depending on the current drive mode there may be delays from the clutch and
transmission having to engage components to the driveline. This is one of the reasons UWAFT
believes it can improve the vehicle’s driveability by integrating a predictive controls strategy based
on driver behaviour, which is discussed in detail in coming sections of this report.
24
CHAPTER 4
4.0 Powertrain Modeling
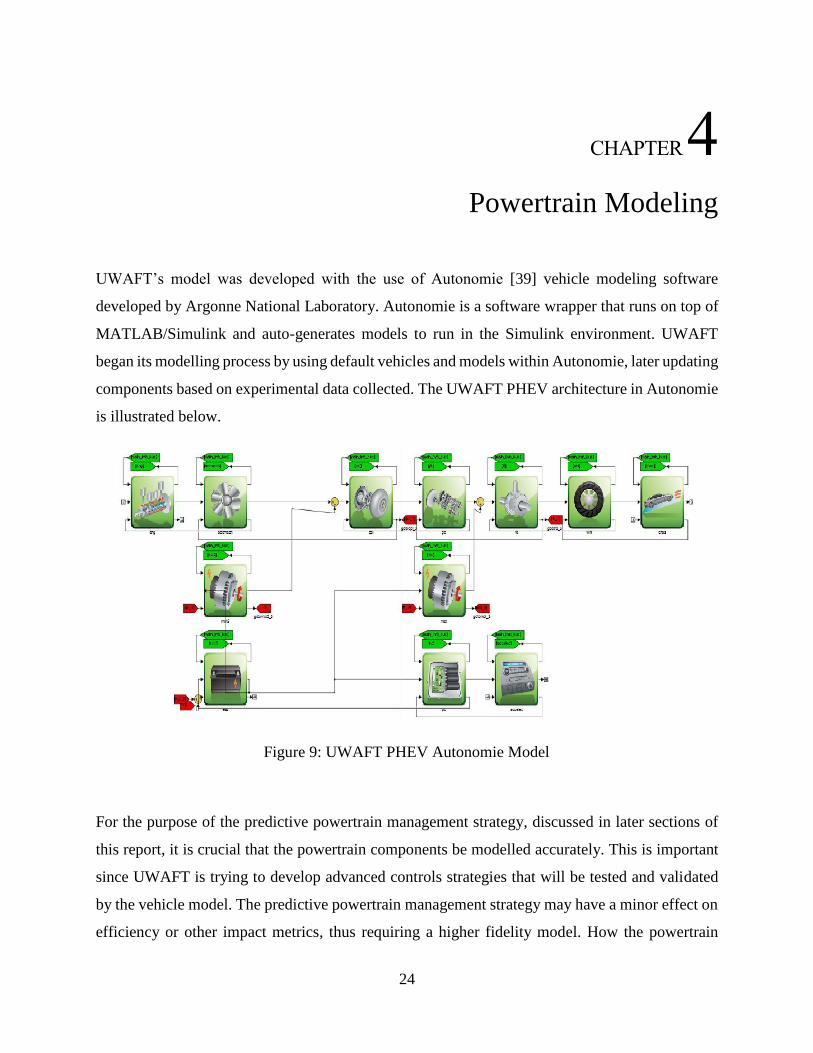
UWAFT’s model was developed with the use of Autonomie [39] vehicle modeling software
developed by Argonne National Laboratory. Autonomie is a software wrapper that runs on top of
MATLAB/Simulink and auto-generates models to run in the Simulink environment. UWAFT
began its modelling process by using default vehicles and models within Autonomie, later updating
components based on experimental data collected. The UWAFT PHEV architecture in Autonomie
is illustrated below.
Figure 9: UWAFT PHEV Autonomie Model
For the purpose of the predictive powertrain management strategy, discussed in later sections of
this report, it is crucial that the powertrain components be modelled accurately. This is important
since UWAFT is trying to develop advanced controls strategies that will be tested and validated
by the vehicle model. The predictive powertrain management strategy may have a minor effect on
efficiency or other impact metrics, thus requiring a higher fidelity model. How the powertrain
4 Powertrain Modelling
25
components were modelled along with some of the actions taken to achieve high fidelity is
discussed in subsequent sections.
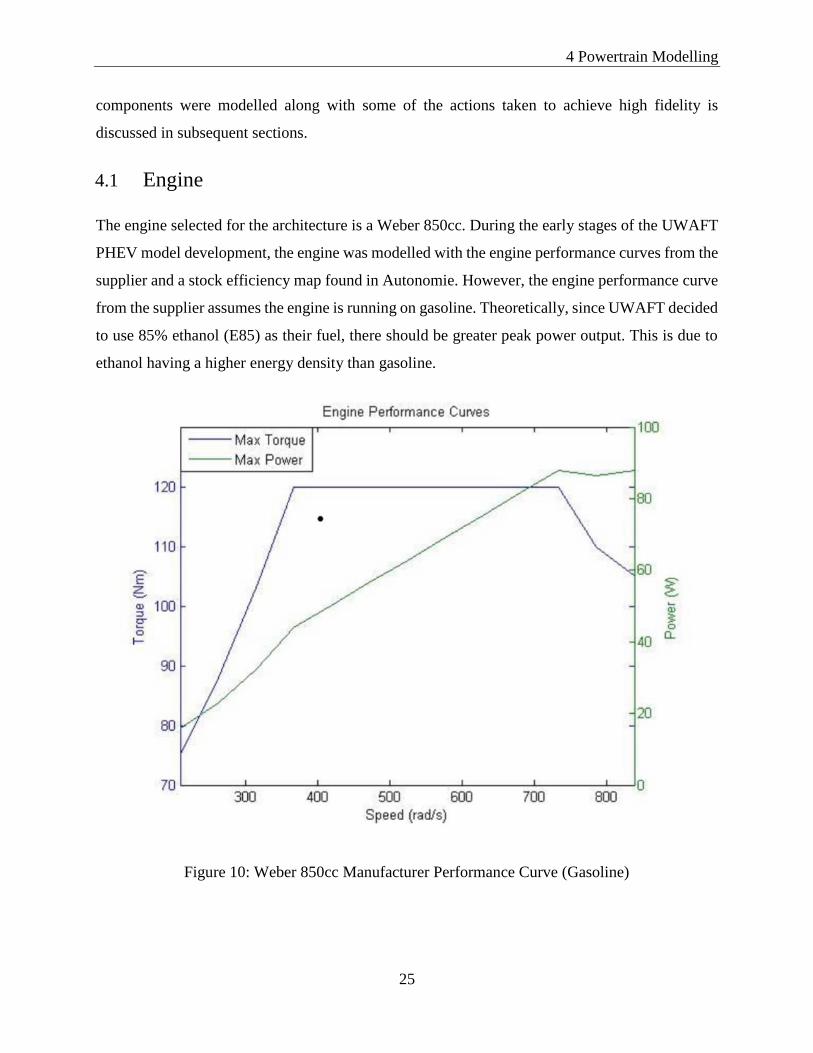
4.1 Engine
The engine selected for the architecture is a Weber 850cc. During the early stages of the UWAFT
PHEV model development, the engine was modelled with the engine performance curves from the
supplier and a stock efficiency map found in Autonomie. However, the engine performance curve
from the supplier assumes the engine is running on gasoline. Theoretically, since UWAFT decided
to use 85% ethanol (E85) as their fuel, there should be greater peak power output. This is due to
ethanol having a higher energy density than gasoline.
Figure 10: Weber 850cc Manufacturer Performance Curve (Gasoline)
4 Powertrain Modelling
26
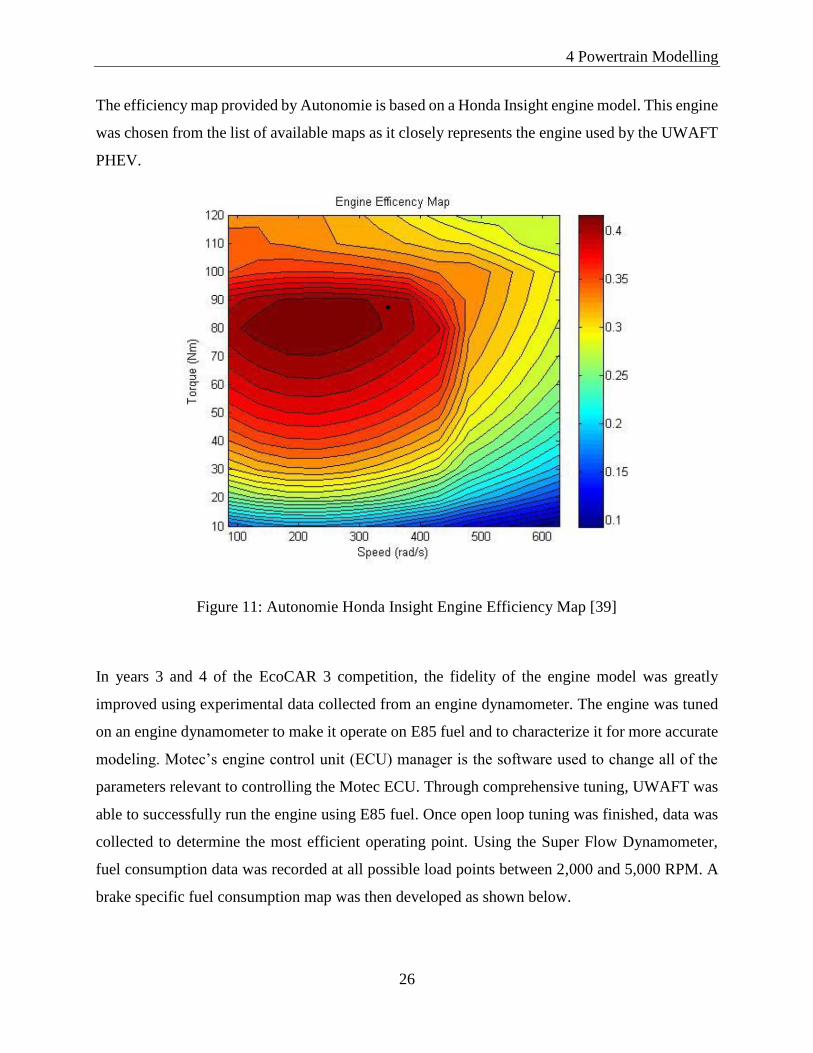
The efficiency map provided by Autonomie is based on a Honda Insight engine model. This engine
was chosen from the list of available maps as it closely represents the engine used by the UWAFT
PHEV.
Figure 11: Autonomie Honda Insight Engine Efficiency Map [39]
In years 3 and 4 of the EcoCAR 3 competition, the fidelity of the engine model was greatly
improved using experimental data collected from an engine dynamometer. The engine was tuned
on an engine dynamometer to make it operate on E85 fuel and to characterize it for more accurate
modeling. Motec’s engine control unit (ECU) manager is the software used to change all of the
parameters relevant to controlling the Motec ECU. Through comprehensive tuning, UWAFT was
able to successfully run the engine using E85 fuel. Once open loop tuning was finished, data was
collected to determine the most efficient operating point. Using the Super Flow Dynamometer,
fuel consumption data was recorded at all possible load points between 2,000 and 5,000 RPM. A
brake specific fuel consumption map was then developed as shown below.
4 Powertrain Modelling
27
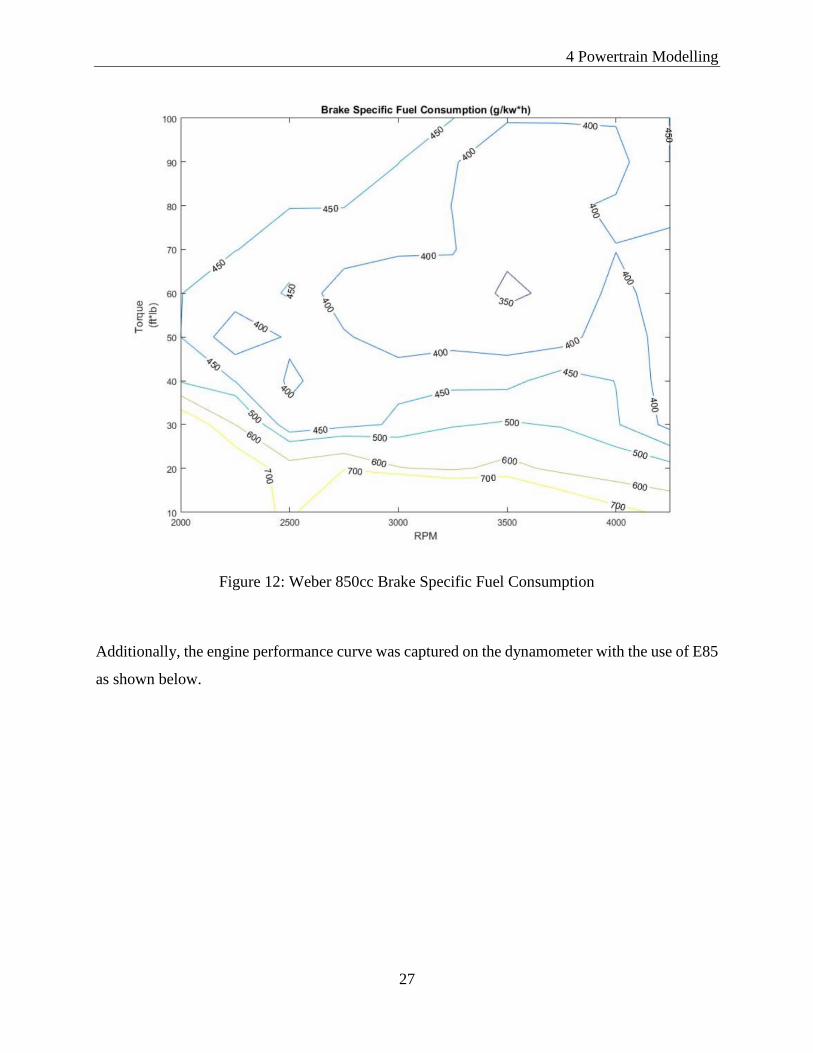
Figure 12: Weber 850cc Brake Specific Fuel Consumption
Additionally, the engine performance curve was captured on the dynamometer with the use of E85
as shown below.
4 Powertrain Modelling
28
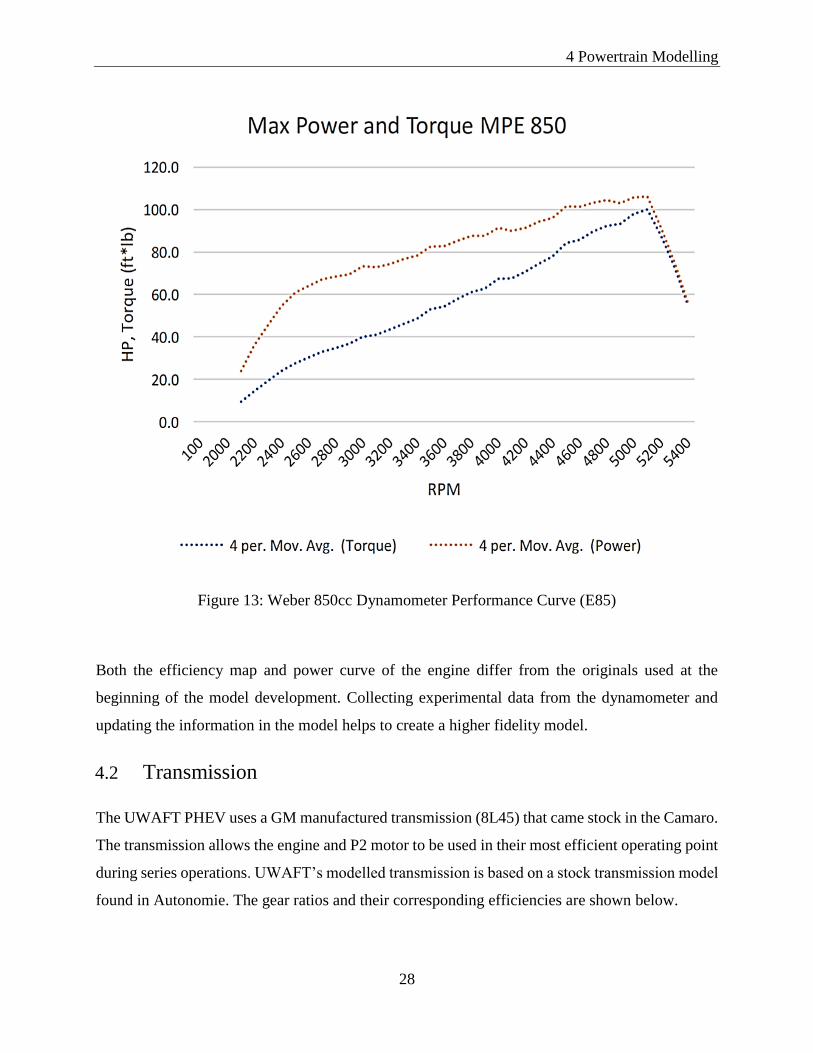
Figure 13: Weber 850cc Dynamometer Performance Curve (E85)
Both the efficiency map and power curve of the engine differ from the originals used at the
beginning of the model development. Collecting experimental data from the dynamometer and
updating the information in the model helps to create a higher fidelity model.
4.2 Transmission
The UWAFT PHEV uses a GM manufactured transmission (8L45) that came stock in the Camaro.
The transmission allows the engine and P2 motor to be used in their most efficient operating point
during series operations. UWAFT’s modelled transmission is based on a stock transmission model
found in Autonomie. The gear ratios and their corresponding efficiencies are shown below.
4 Powertrain Modelling
29
Table 2: Transmissions Gear Ratio Efficiencies [39]
Efficiency 0.96 0.95 0.95 0.95 0.95 0.98 0.93 0.93
Ratio 4.62 3.04 2.07 1.66 1.26 1.00 0.85 0.66
Gear 1 2 3 4 5 6 7 8
4.3 Electric Motor
UWAFT’s PHEV utilizes two electric motors in the pre-transmission (P2) and post-transmission
(P3) locations. They are both the same GKN manufactured AF130-4 motors. These motors are
axial flux permanent magnet motors, packaged in an extremely compact enclosure.
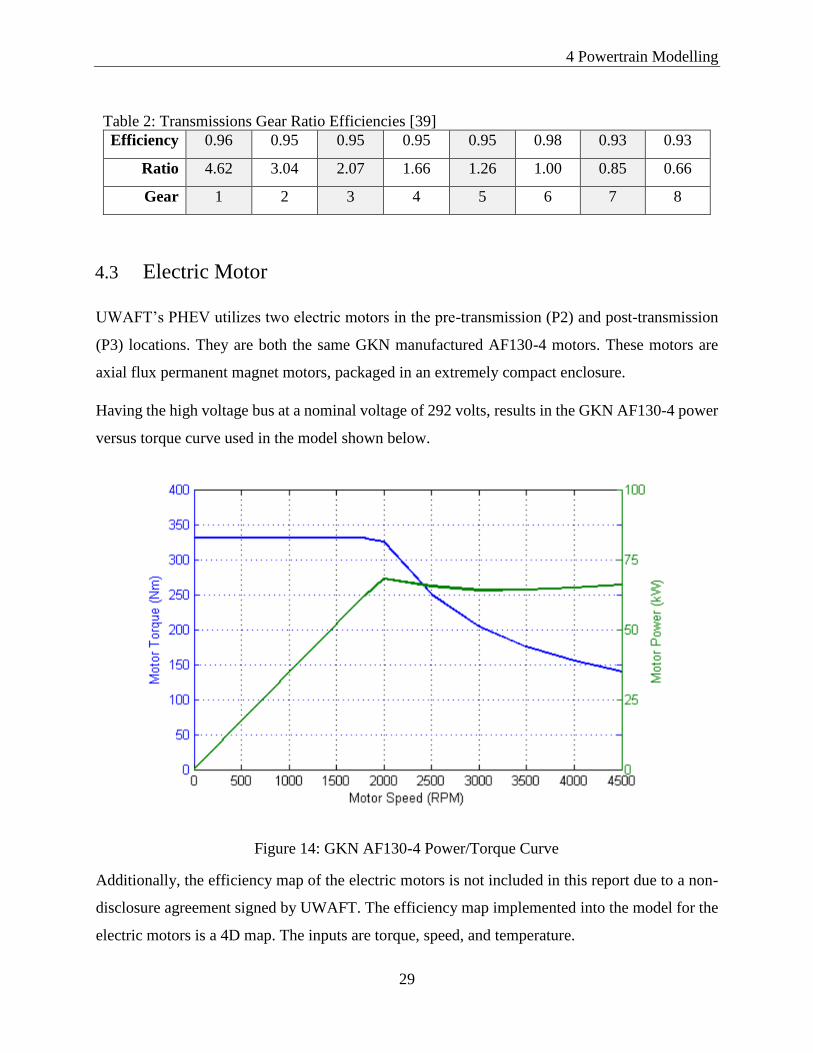
Having the high voltage bus at a nominal voltage of 292 volts, results in the GKN AF130-4 power
versus torque curve used in the model shown below.
Figure 14: GKN AF130-4 Power/Torque Curve
Additionally, the efficiency map of the electric motors is not included in this report due to a non-
disclosure agreement signed by UWAFT. The efficiency map implemented into the model for the
electric motors is a 4D map. The inputs are torque, speed, and temperature.
4 Powertrain Modelling
30
4.4 Model Limitations
Modelling is a very important engineering tool as it provides insight and validation to new ideas.
Although accurate, it is often difficult to achieve a model that takes into consideration every input
possible. To reduce the processing power required to run simulations, models are often simplified
to only include the most significant information. It is crucial to understand a model’s limitations
and what assumptions were made when the model was developed. The UWAFT PHEV powertrain
model has two major aspects that limit the fidelity of the results obtained.
1. Look-Up Tables – The UWAFT PHEV uses look-up tables (maps) to determine values
such as component efficiency. This is a useful tool in modelling as it avoids the use of
complex computations. Instead of using an equation to calculate the engine’s efficiency
continuously, the UWAFT PHEV model looks up a value based on engine speed and
torque. The limitation exists due to the coarseness of a look-up table. A look-up table will
only have exact values for a given set of inputs; therefore, if the inputs fall between two
cells of the look-up table, the output needs to be interpolated. A well constructed look-up
table will have enough cells such that linear interpolation between two cells will meet the
accuracy requirements of the model. One of the UWAFT PHEV’s powertrain model’s
biggest limitations is the engine efficiency map. The Super Flow Dynamometer that was
used to tune the engine and create the efficiency map is designed for larger engines. The
biggest drawback this created was the resolution of the fuel flow meter. Naturally, larger
engines consume larger amounts a fuel and thus higher resolution flow measurements are
not required. This resulted in a coarser engine efficiency map as shown previously.
2. Inputs – As previously mentioned it is difficult to develop a model that includes all inputs.
Thus, inputs that have minimal effects on the results are left out as long as their effect is
below the accuracy requirements of the model. For example, the vibrations from the road
could effect the power output of the engine; however, since the effect so miniscule it does
not make sense to waste computational power to include it. Thus, the number of inputs
omitted can limit the model’s fidelity. The UWAFT PHEV is limited by excluding various

4 Powertrain Modelling
31
inputs. The engine’s efficiency map is not a function of temperature like the electric
motor’s map. This is acceptable, as the operating temperature of the engine does not vary
as much as the electric motor’s. However, it does limit the model in accurately calculating
start-up efficiency as the engine warms up.
32
CHAPTER 5
5.0 Advanced Driver Assistance Systems
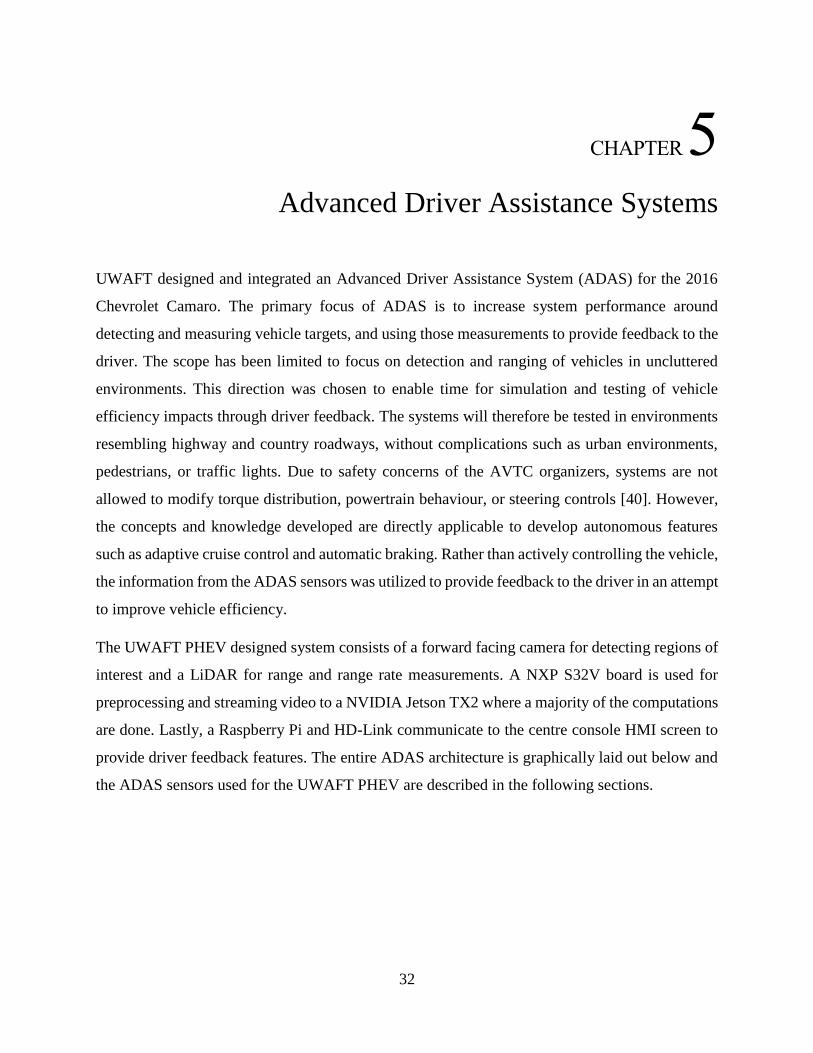
UWAFT designed and integrated an Advanced Driver Assistance System (ADAS) for the 2016
Chevrolet Camaro. The primary focus of ADAS is to increase system performance around
detecting and measuring vehicle targets, and using those measurements to provide feedback to the
driver. The scope has been limited to focus on detection and ranging of vehicles in uncluttered
environments. This direction was chosen to enable time for simulation and testing of vehicle
efficiency impacts through driver feedback. The systems will therefore be tested in environments
resembling highway and country roadways, without complications such as urban environments,
pedestrians, or traffic lights. Due to safety concerns of the AVTC organizers, systems are not
allowed to modify torque distribution, powertrain behaviour, or steering controls [40]. However,
the concepts and knowledge developed are directly applicable to develop autonomous features
such as adaptive cruise control and automatic braking. Rather than actively controlling the vehicle,
the information from the ADAS sensors was utilized to provide feedback to the driver in an attempt
to improve vehicle efficiency.
The UWAFT PHEV designed system consists of a forward facing camera for detecting regions of
interest and a LiDAR for range and range rate measurements. A NXP S32V board is used for
preprocessing and streaming video to a NVIDIA Jetson TX2 where a majority of the computations
are done. Lastly, a Raspberry Pi and HD-Link communicate to the centre console HMI screen to
provide driver feedback features. The entire ADAS architecture is graphically laid out below and
the ADAS sensors used for the UWAFT PHEV are described in the following sections.
5 Advanced Driver Assistance System
33
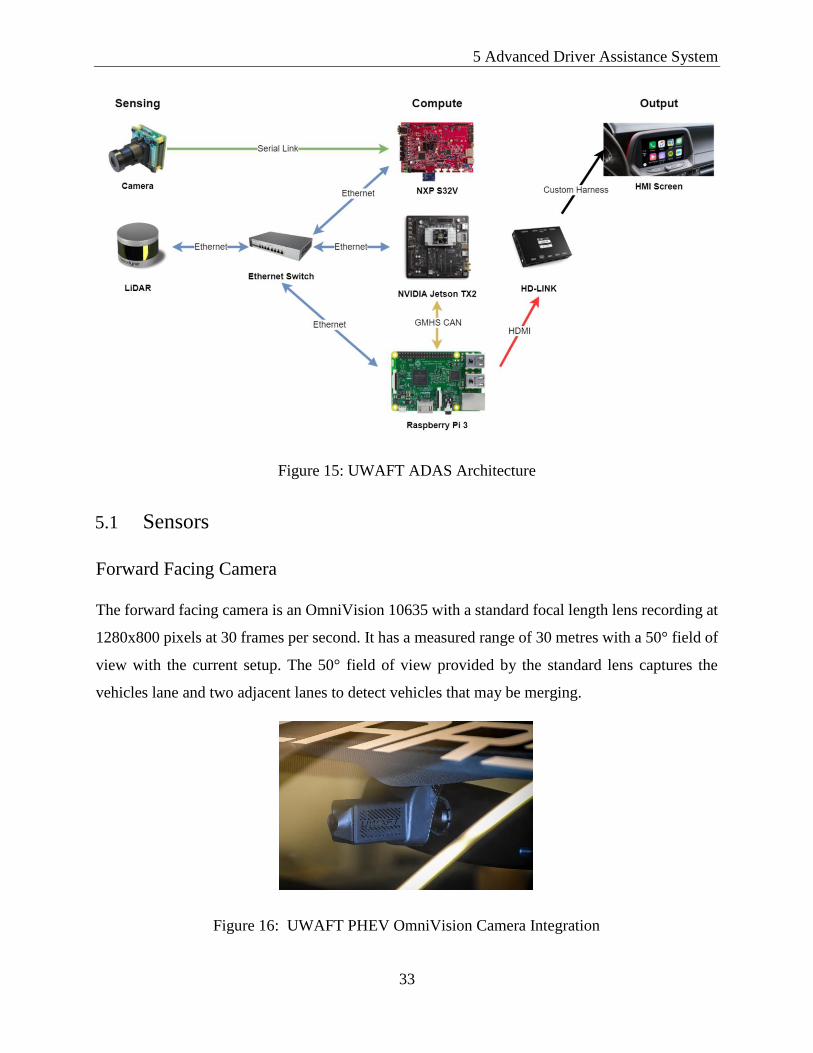
Figure 15: UWAFT ADAS Architecture
5.1 Sensors
Forward Facing Camera
The forward facing camera is an OmniVision 10635 with a standard focal length lens recording at
1280x800 pixels at 30 frames per second. It has a measured range of 30 metres with a 50° field of
view with the current setup. The 50° field of view provided by the standard lens captures the
vehicles lane and two adjacent lanes to detect vehicles that may be merging.
Figure 16: UWAFT PHEV OmniVision Camera Integration

5 Advanced Driver Assistance System
34
Light Detection and Ranging
The chosen LiDAR is a Velodyne VLP-16, which has a 360° field of view and scans the
environment using 16 independent lasers. The LiDAR is able to retrieve reflectivity and distance
data for each point in its point cloud. It has a range of 100 metres for distance measurement on
retro-reflective surfaces such as road signs, licence plates, and vehicle lights and is able to measure
as close as 50 centimeters accurately.
Figure 17: UWAFT PHEV Velodyne LiDAR Integration
The range rate accuracy of the LiDAR system is a function of the ranging accuracy of the LiDAR
and the time accuracy of the computing system. The computing system (NVIDIA Jetson TX2) is
accurate down to the microsecond level, therefore the range rate will be limited by the ranging
accuracy (+/- 3cm) of the Velodyne. The error under good conditions with a sample rate of 15
samples per second is calculated below resulting in a range rate accuracy of +/- 0.45 m/s. This
error would increase in adverse conditions such as precipitation or non-retroreflective surfaces.
𝑅𝑎𝑛𝑔𝑖𝑛𝑔 𝐴𝑐𝑐𝑢𝑟𝑎𝑐𝑦
𝑆𝑎𝑚𝑝𝑙𝑒 𝑅𝑎𝑡𝑒= 𝑅𝑎𝑛𝑔𝑒 𝑅𝑎𝑡𝑒 𝐴𝑐𝑐𝑢𝑟𝑎𝑐𝑦
±0.03𝑚
115
𝑠= ±0.45 𝑚/𝑠
(1)
5 Advanced Driver Assistance System
35
Sensor Fusion
There are two data sources in this system, a 3D point cloud from the LiDAR, and 2D image frames
from the camera. The camera feed is processed using a neural network to identify bounding boxes
around vehicles in the camera frame. These bounding boxes are then passed to the LiDAR
processing code, which identifies corresponding 3D points in the point cloud to estimate the
distance of the vehicles. 3D points are first mapped to the camera’s 3D reference frame, then the
distances of points in the bounding boxes are estimated by using a pinhole camera model, and
determining the 3D rays for given pixel coordinates.
5.2 Object Detection
Multiple object detection algorithms were developed and tested on UWAFT’s ADAS equipment.
However, due to the complexity and time needed to train algorithms, all the methods that were
developed by the team for object detection lagged behind industry standards. Ultimately, it was
decided to go with an existing method for object detection developed by You Only Look Once
(YOLO) [40]. YOLO takes each frame from the camera and a single convolution network on the
image, and then creates a bounding box around the detected object if the confidence score is above
a certain threshold.
YOLO operates similarly to a Fast Regions with Convolutional Neural Nets (R-CNN) method.
However, R-CNNs require some very powerful computers to run and a very long time to train.
This would not work well on the embedded system inside UWAFT’s vehicle. YOLO addresses
this issue by approximating the weights in the R-CNN to binary values that are much smaller. The
nature of these values allows for the convolution operations to require much less computing power.
The binary input is passed to the XNOR-network with the binary weights. The binary XNOR
operations are very fast since both the inputs and weights are binary valued approximations. This
brings R-CNN levels of accuracy into the realms of possibility in the embedded space. UWAFT
was able to run YOLO at real-time speeds at around 20 frames per second on the NVIDIA Jetson
TX2.
5 Advanced Driver Assistance System
36
5.3 Range Estimation
The distance a vehicle is ahead of UWAFT’s vehicle is determined with the use of the LiDAR.
First the LiDAR outputs a 3D point cloud which is cropped to only use the field of view
overlapping with the camera. Next the data is down-sampled, using a voxel grid. After down-
sampling, the 3D points are mapped to the camera’s reference frame. Using a pinhole model of the
camera, a 3D vector is obtained for given pixel coordinates. Points in the point cloud that lie along
the direction of this vector are selected as distance candidates and averaged. This averaged distance
is then returned and stored so that range rate and the time step can be calculated.
5.4 Object Tracking
To track vehicles, a bounding box overlap method was used. The overlapping area between a
previous bounding box and all new bounding boxes in the frame was calculated. If any box
overlaps with at least 50% of a previous box (if the overlap area is greater than half of the area of
the old box) it is determined to be the same vehicle. If multiple boxes meet this criterion, the box
with the highest percentage of overlap will be chosen. It is identified that this is not the most robust
method of doing object tracking but was implemented for simplicity.
37
CHAPTER 6
6.0 Predictive Controls Strategy Based on Driver
Behaviour
6.1 Overview
A major part of the AVTC series is to challenge students to develop industry-leading ideas and
take them from proof of concept to vehicle insertion. This is the primary focus for the innovation
stream each year. The major milestone for the innovation stream is to develop a selected topic and
obtain actual data and functionality by the end of the year. It was chosen to address a continuous
need in the automotive industry, which is to reduce energy consumption and emissions of vehicles.
With the increase in alternative fuels energy sources, vehicle architectures are becoming more
complex. Rather than having just an internal combustion engine connected to the wheels, there are
now multiple torque producing components in numerous different configurations. This ultimately
leads to a more complex controls strategy to control vehicle operations.
It is decided to investigate how advance controls techniques (particularly machine learning) can
be incorporated into the hybrid supervisory controller to improve energy consumption and
emissions of a PHEV. While reflecting on the target market defined by UWAFT in year one, it
was important that the innovation project bring state-of-the-art technology to consumers and create
a unique experience while reducing the environmental impact of the vehicle. A predictive controls
strategy based on driver behaviour recognition was selected as the year 4 innovation project.
It is believed by recognizing the driver’s behaviour and ultimately learning who they are as a driver
it would help give UWAFT’s PHEV a personalized feel while reducing the energy consumption
of the vehicle. Utilizing facial recognition to identify who is driving, and a database of the driver’s
behaviour history (recognized via machine learning); the UWAFT PHEV could change its control
strategy and specific control parameters to adapt to each driver. This can influence various driving
scenarios, with situational and environmental factors all coming into effect. It was decided to
6 Predictive Controls Strategy Based on Driver Behaviour
38
narrow the scope to investigate the effect during simple braking and accelerating events, with no
external factors taken into effect. For example, given an aggressive accelerator the UWAFT PHEV
will pre-emptively be in a configuration to provide maximum torque, eliminating the engagement
time of certain powertrain components. Alternatively, given an eco-cautious accelerator (easy on
the pedal) UWAFT PHEV will pre-emptively be in a configuration to optimize for energy
consumption and emissions. Experiments conducted with the predictive controls strategy include:
1. Energy consumption during acceleration events in different configurations
2. Regenerative energy captured during braking events
6.2 Technical Goals for Innovation Project
At the start of the EcoCAR 3, year 4 innovation project, multiple technical goals to achieve over
the course of one year were identified. The innovation project aimed to add value for the target
market, as well as value to EcoCAR 3 AVTC and UWAFT directly. The goals developed by
UWAFT are described in the list below.
1. Driver Identification – It needs to be able to identify who is driving the vehicle to
activate a predictive powertrain management strategy that is specific to the driver. This
is to be accomplished via a driver-facing camera utilizing facial recognition algorithms.
Additionally, once the driver is recognized, the vehicle settings such as seat, mirror
position, and HMI settings will automatically be adjusted resulting in a refined driver
experience. The facial detection system may also double as a security feature, disabling
the vehicle for unknown drivers.
2. 300+ Hours of Driver Data – In order to train and validate driver behaviour algorithms
driver data will need to be collected. Driver data can be collected via the onboard
diagnostic (OBD) port on all types of vehicle via OBD loggers. Depending on the
machine learning technique chosen, labelled or unlabelled data may be necessary.
Labelled data refers to data that has already been identified or given a ground truth. In
the described scenario, it refers to driver data logged from the OBD port of a driver
who has already been labelled as aggressive, normal, or eco-cautious. Conversely,
unlabelled data is essentially unknown.
6 Predictive Controls Strategy Based on Driver Behaviour
39
3. Driver Behaviour Recognition – 80% reliability in identifying driver behaviour as
characterized in Section 8.1. Algorithms that are available for use include but are not
limited to; fast Fourier transform, finite/hybrid state machines, graphical methods,
hidden Markov models, Bayesian networks, k-nearest neighbour classifiers, decision
tress, fuzzy logic, clustering, Kalman filtering, and support vector machines. Based on
literature review, drivers can be profiled based on their acceleration/braking and vehicle
speed; however, as the innovation project develops it may prove beneficial to include
data from GPS, ADAS, situational factors, and environmental factors as well.
4. Powertrain Management Strategy – Once the driver has been classified, the optimal
powertrain management strategy needs to be determined for that specific driver. This
includes determining which mode the vehicle should be in, parameter optimizations,
and regen braking calibrations. This thesis aims to do as much in vehicle testing as
possible to optimize the controls strategy, but ultimately will be limited by any
mechanical failures experienced by the team.
5. Effect on Competition – The innovation project must facilitate the accomplishment of
the team’s competition goals. Two of UWAFT’s major goals for the competition are to
reduce emissions and have a vehicle range of 300 kilometres. By completing this
innovation project, it will have investigated numerous ways to reduce vehicle emissions
and power consumption thus developing a thorough understanding of the vehicle’s
powertrain management. This will ultimately allow UWAFT to select the best
powertrain management strategy to achieve the highest scores at competition events.
(Such as the emissions and energy consumption event)
6 Predictive Controls Strategy Based on Driver Behaviour
40
6.3 Impact Metrics
Four metrics were determined to use in order to gauge the success of the predictive controls
strategy and driver behaviour recognition.
1. Energy Consumption – The more energy saved by the predictive controls strategy the
more successful it will be. By analyzing the energy saved during one driving event, the
data can be extrapolated over the course of an entire trip to determine the cost savings
associated with the implementation of a driver behaviour recognition algorithm.
2. Emissions – Similar to energy consumption, by comparing the emissions of the predictive
controls strategy to that of the stock, “one size fits all”, controls strategy, there should be a
noticeable reduction difference.
3. Driveability – A successful implementation of a predictive powertrain management
strategy should go unnoticed by the user, as changes would be incremental at first as the
driver’s behaviour is being learnt. Vehicle test laps on a closed course and survey can be
used to receive feedback from various types of drivers.
4. Recognition Accuracy – By validating the algorithm for driver behaviour recognition, an
reliability value can be obtained to represent how well the algorithm preforms. Using cross
validation a group of labeled data (aggressive, eco-cautious, and normal drive cycles) can
be inputted into the algorithm, and then the predicted label can be compared to the actual
label.
6.4 Machine Learning Methodology
An algorithm designed to recognize and classify driver behaviour based on features extracted from
CAN data was developed. The algorithm was developed in a Python environment due to its
dominant use in machine learning and various open source machine intelligence libraries available.
The algorithm architecture follows a standard set sequence described below:
6 Predictive Controls Strategy Based on Driver Behaviour
41
1. Feature Extraction – Extracts unique characteristics from the raw data.
2. Feature Normalization – Normalizes the features so each feature has equal effect on the
outcome.
3. Dimensionality Reduction – Determines the most important features and reduces the
complexity of the problem.
4. Classification – Classifies the features into distinct categories.
This methodology was applied to a supervised and unsupervised learning approach to determine
which would perform better. The feature extraction and normalization were the same for both the
supervised and unsupervised approach. However, different dimensionality reductions and
classifications were used for each. The supervised approached used linear discriminant analysis
(LDA) [41] and support vector machines (SVM) [42] for dimensionality reduction and
classification, respectively. Whereas the unsupervised approach used principal component
analysis (PCA) [41] and k-means [43] for dimensionality reduction and classification, respectively.
The unsupervised learning approach initially seemed to be an appropriate solution; however, the
team ultimately chose to pursue a supervised learning method due to the various drawbacks
encountered, namely, the larger amount of data required. The supervised approach and techniques
chosen are discussed in more detail in the following sections.
Feature Extraction
A feature is a quantitatively measurable property that serves as a unique characteristic of the data
being studied. The driver specific signals used for classification in this paper are accelerator pedal
position (APP), brake pedal position (BPP), and vehicle speed. A total of five features were
extracted for each input signal recorded from a specific driver (APP, BPP, and vehicle speed). The
features explored were the raw signal value, discrete first derivative, moving mean, moving
median, and moving standard deviation. An individual data point was created by averaging all of
the features over the time driven. Thus, for an individual driver the data set would be a 1x15 array.
[𝐴𝑃𝑃 𝐴𝑃𝑃𝑟𝑎𝑡𝑒 … 𝐵𝑃𝑃]1𝑥15
Once all of the labelled data points were created, representing individual drivers, the features were
normalized to produce a standardized set of data which the classifier can operate on. This is a
6 Predictive Controls Strategy Based on Driver Behaviour
42
necessary step as normalization ensures that all features have a proportional contribution to the
classification. Additionally, during dimensionality reduction the linear discriminant analysis
results improve when using normalized data.
Dimensionality Reduction
Linear discriminant analysis (LDA) was used as the dimensionality reduction technique during the
pre-processing step. LDA projects the dataset onto a lower-dimensional space that has high class-
separability as well as low interclass-separability, both of which are desired, reducing
computational costs.
LDA begins by calculating the mean of each feature separately for each class (eco-cautious,
normal, aggressive). Two scatter matrices are then calculated, one to represent inter-class scatter
and one that represents class separation. The goal of LDA is to find dimensions that minimize
inter-class scatter while maximizing class separation. The inter-class scatter is computed by the
following equation using the variance of the data.
𝑆𝑊 = ∑ 𝑆𝑖
𝑐
𝑖=1
(2)
𝑤ℎ𝑒𝑟𝑒, 𝑆𝑖 = ∑ (𝑥 − 𝑚𝑖)(𝑥 − 𝑚𝑖)𝑇
𝑛
𝑥∈𝐷𝑖
(3)
The class separation can be calculated using the following equation.
𝑆𝐵 = ∑ 𝑁𝑖(𝑚𝑖 − 𝑚)(𝑚𝑖 − 𝑚)𝑇
𝑐
𝑖=1
(4)
𝑤ℎ𝑒𝑟𝑒, 𝑚 = 𝑜𝑣𝑒𝑟𝑎𝑙𝑙 𝑚𝑒𝑎𝑛,
𝑁𝑖 = 𝑠𝑎𝑚𝑝𝑙𝑒 𝑠𝑖𝑧𝑒
Lastly, to minimize 𝑆𝑊 and maximize 𝑆𝐵, the generalized eigenvalue problem for the matrix 𝑆𝑊−1𝑆𝐵
needs to be solved. Sorting the eigenvectors by decreasing eigenvalues allow the most important
dimensions to be determined. The eigenvectors with the highest eigenvalues bear the most
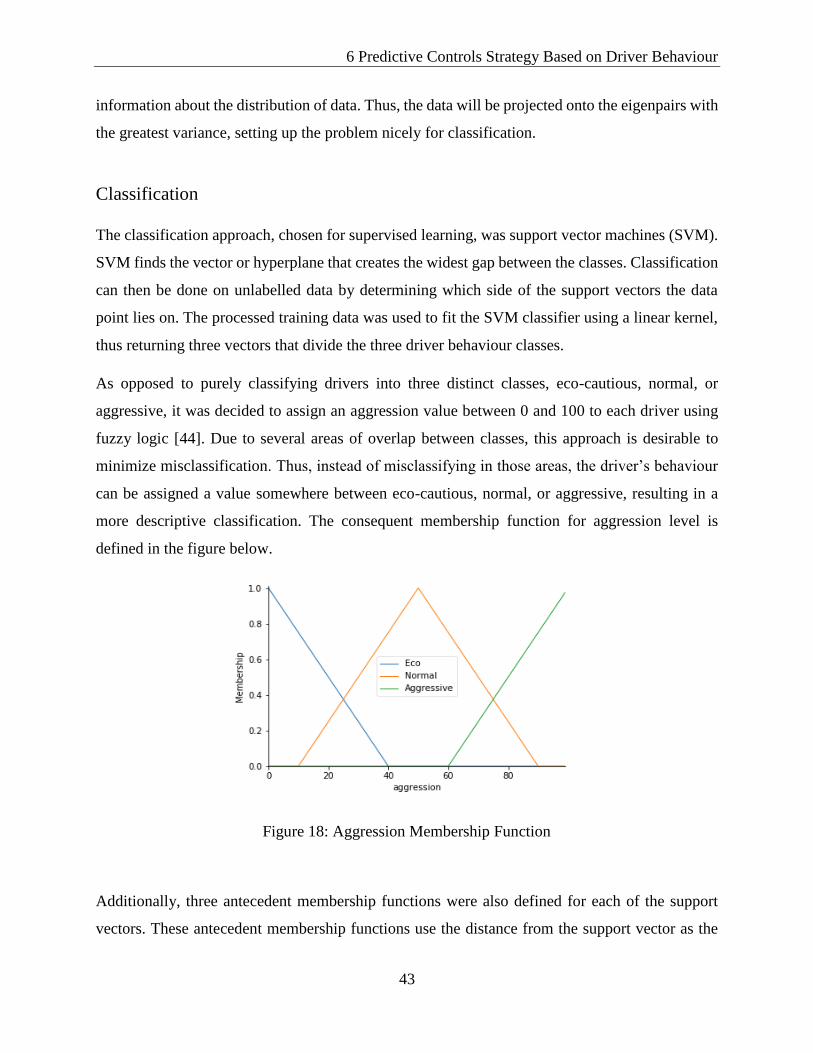
6 Predictive Controls Strategy Based on Driver Behaviour
43
information about the distribution of data. Thus, the data will be projected onto the eigenpairs with
the greatest variance, setting up the problem nicely for classification.
Classification
The classification approach, chosen for supervised learning, was support vector machines (SVM).
SVM finds the vector or hyperplane that creates the widest gap between the classes. Classification
can then be done on unlabelled data by determining which side of the support vectors the data
point lies on. The processed training data was used to fit the SVM classifier using a linear kernel,
thus returning three vectors that divide the three driver behaviour classes.
As opposed to purely classifying drivers into three distinct classes, eco-cautious, normal, or
aggressive, it was decided to assign an aggression value between 0 and 100 to each driver using
fuzzy logic [44]. Due to several areas of overlap between classes, this approach is desirable to
minimize misclassification. Thus, instead of misclassifying in those areas, the driver’s behaviour
can be assigned a value somewhere between eco-cautious, normal, or aggressive, resulting in a
more descriptive classification. The consequent membership function for aggression level is
defined in the figure below.
Figure 18: Aggression Membership Function
Additionally, three antecedent membership functions were also defined for each of the support
vectors. These antecedent membership functions use the distance from the support vector as the
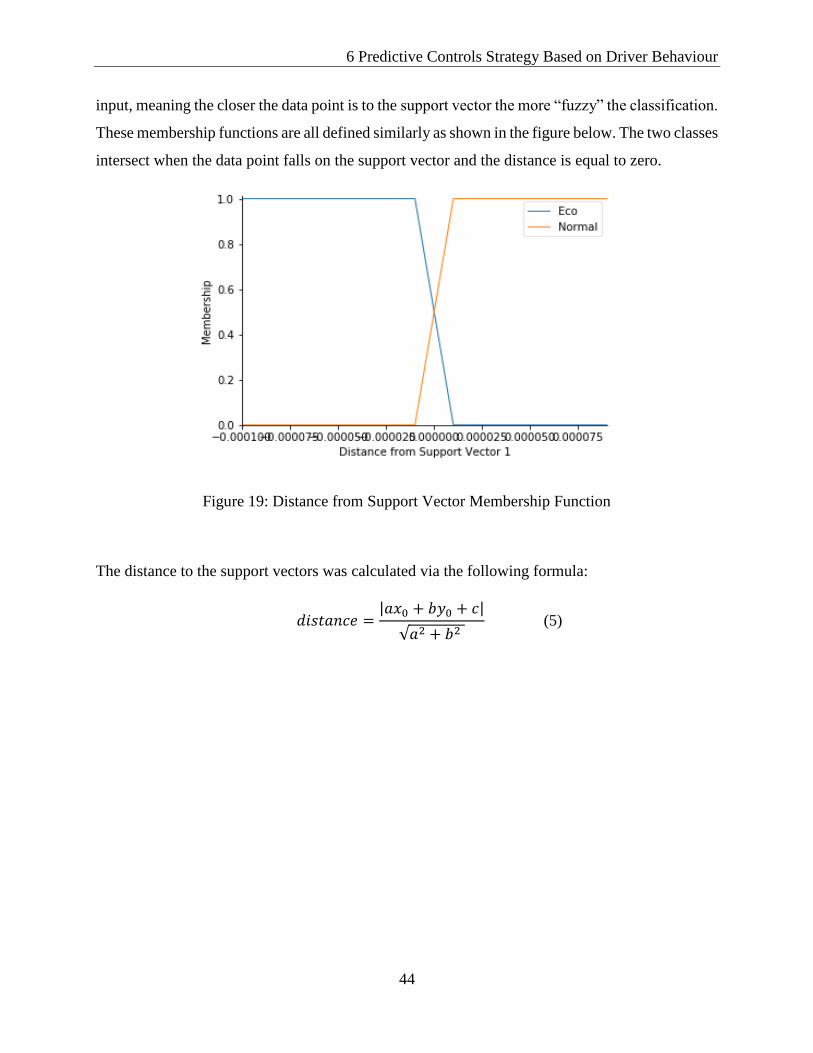
6 Predictive Controls Strategy Based on Driver Behaviour
44
input, meaning the closer the data point is to the support vector the more “fuzzy” the classification.
These membership functions are all defined similarly as shown in the figure below. The two classes
intersect when the data point falls on the support vector and the distance is equal to zero.
Figure 19: Distance from Support Vector Membership Function
The distance to the support vectors was calculated via the following formula:
𝑑𝑖𝑠𝑡𝑎𝑛𝑐𝑒 =|𝑎𝑥0 + 𝑏𝑦0 + 𝑐|
√𝑎2 + 𝑏2 (5)

45
Part II - Applications
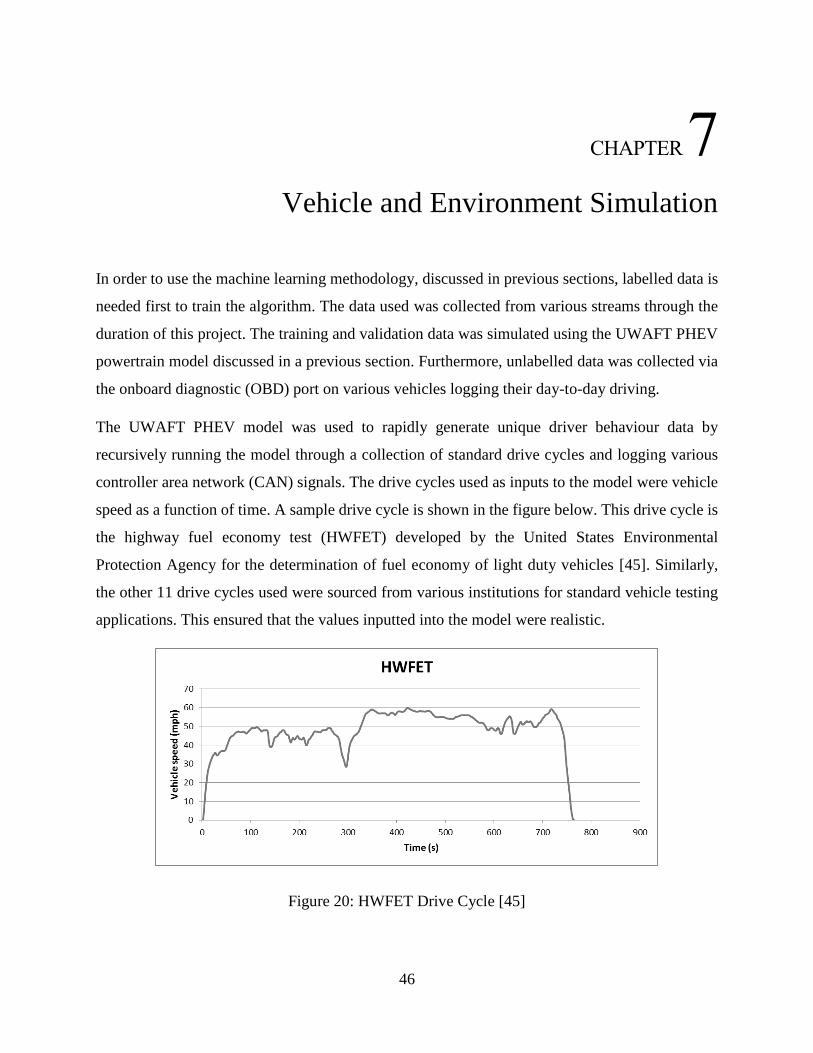
46
CHAPTER 7
7.0 Vehicle and Environment Simulation
In order to use the machine learning methodology, discussed in previous sections, labelled data is
needed first to train the algorithm. The data used was collected from various streams through the
duration of this project. The training and validation data was simulated using the UWAFT PHEV
powertrain model discussed in a previous section. Furthermore, unlabelled data was collected via
the onboard diagnostic (OBD) port on various vehicles logging their day-to-day driving.
The UWAFT PHEV model was used to rapidly generate unique driver behaviour data by
recursively running the model through a collection of standard drive cycles and logging various
controller area network (CAN) signals. The drive cycles used as inputs to the model were vehicle
speed as a function of time. A sample drive cycle is shown in the figure below. This drive cycle is
the highway fuel economy test (HWFET) developed by the United States Environmental
Protection Agency for the determination of fuel economy of light duty vehicles [45]. Similarly,
the other 11 drive cycles used were sourced from various institutions for standard vehicle testing
applications. This ensured that the values inputted into the model were realistic.
Figure 20: HWFET Drive Cycle [45]
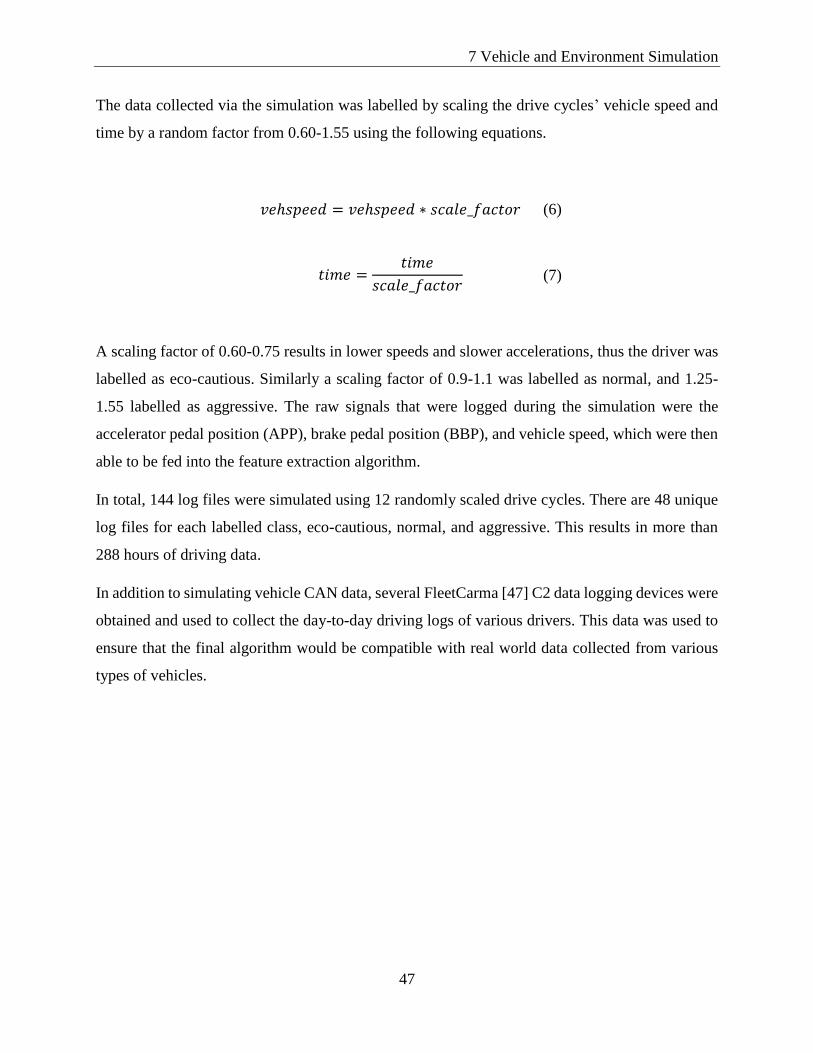
7 Vehicle and Environment Simulation
47
The data collected via the simulation was labelled by scaling the drive cycles’ vehicle speed and
time by a random factor from 0.60-1.55 using the following equations.
𝑣𝑒ℎ𝑠𝑝𝑒𝑒𝑑 = 𝑣𝑒ℎ𝑠𝑝𝑒𝑒𝑑 ∗ 𝑠𝑐𝑎𝑙𝑒_𝑓𝑎𝑐𝑡𝑜𝑟 (6)
𝑡𝑖𝑚𝑒 =𝑡𝑖𝑚𝑒
𝑠𝑐𝑎𝑙𝑒_𝑓𝑎𝑐𝑡𝑜𝑟 (7)
A scaling factor of 0.60-0.75 results in lower speeds and slower accelerations, thus the driver was
labelled as eco-cautious. Similarly a scaling factor of 0.9-1.1 was labelled as normal, and 1.25-
1.55 labelled as aggressive. The raw signals that were logged during the simulation were the
accelerator pedal position (APP), brake pedal position (BBP), and vehicle speed, which were then
able to be fed into the feature extraction algorithm.
In total, 144 log files were simulated using 12 randomly scaled drive cycles. There are 48 unique
log files for each labelled class, eco-cautious, normal, and aggressive. This results in more than
288 hours of driving data.
In addition to simulating vehicle CAN data, several FleetCarma [47] C2 data logging devices were
obtained and used to collect the day-to-day driving logs of various drivers. This data was used to
ensure that the final algorithm would be compatible with real world data collected from various
types of vehicles.
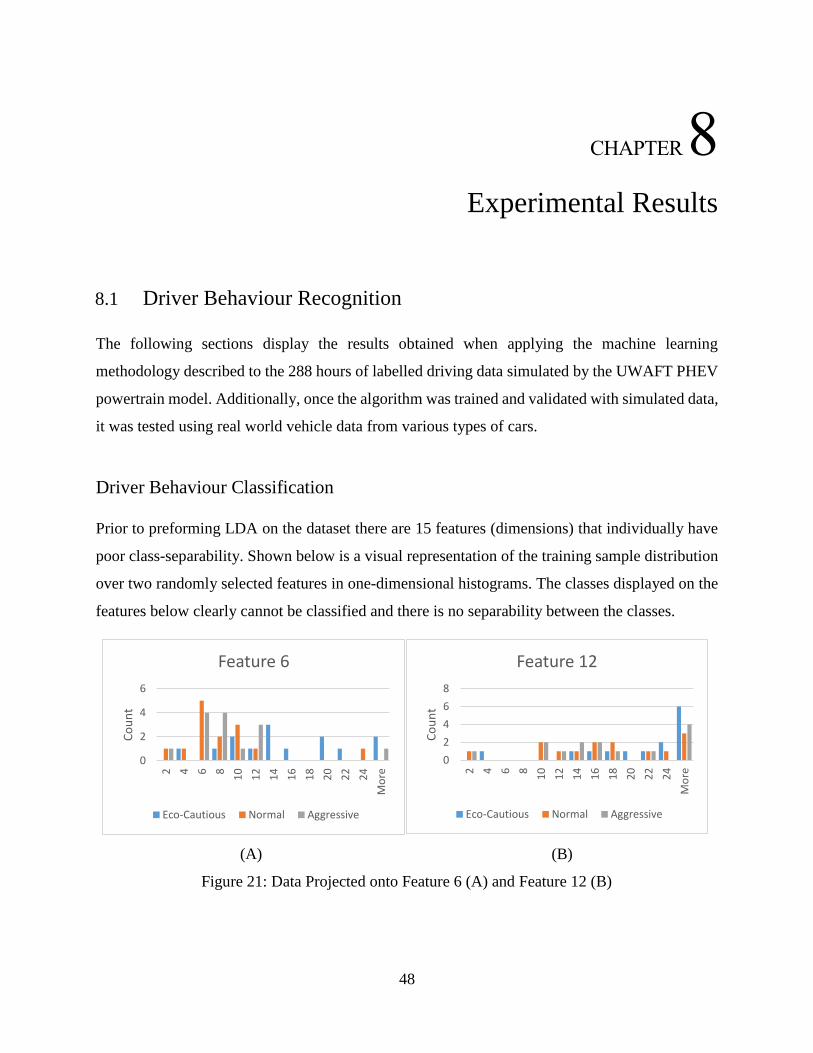
48
CHAPTER 8
8.0 Experimental Results
8.1 Driver Behaviour Recognition
The following sections display the results obtained when applying the machine learning
methodology described to the 288 hours of labelled driving data simulated by the UWAFT PHEV
powertrain model. Additionally, once the algorithm was trained and validated with simulated data,
it was tested using real world vehicle data from various types of cars.
Driver Behaviour Classification
Prior to preforming LDA on the dataset there are 15 features (dimensions) that individually have
poor class-separability. Shown below is a visual representation of the training sample distribution
over two randomly selected features in one-dimensional histograms. The classes displayed on the
features below clearly cannot be classified and there is no separability between the classes.
(A) (B)
Figure 21: Data Projected onto Feature 6 (A) and Feature 12 (B)
0
2
4
6
2 4 6 8
10
12
14
16
18
20
22
24
Mo
re
Co
un
t
Feature 6
Eco-Cautious Normal Aggressive
0
2
4
6
8
2 4 6 8
10
12
14
16
18
20
22
24
Mo
re
Co
un
t
Feature 12
Eco-Cautious Normal Aggressive
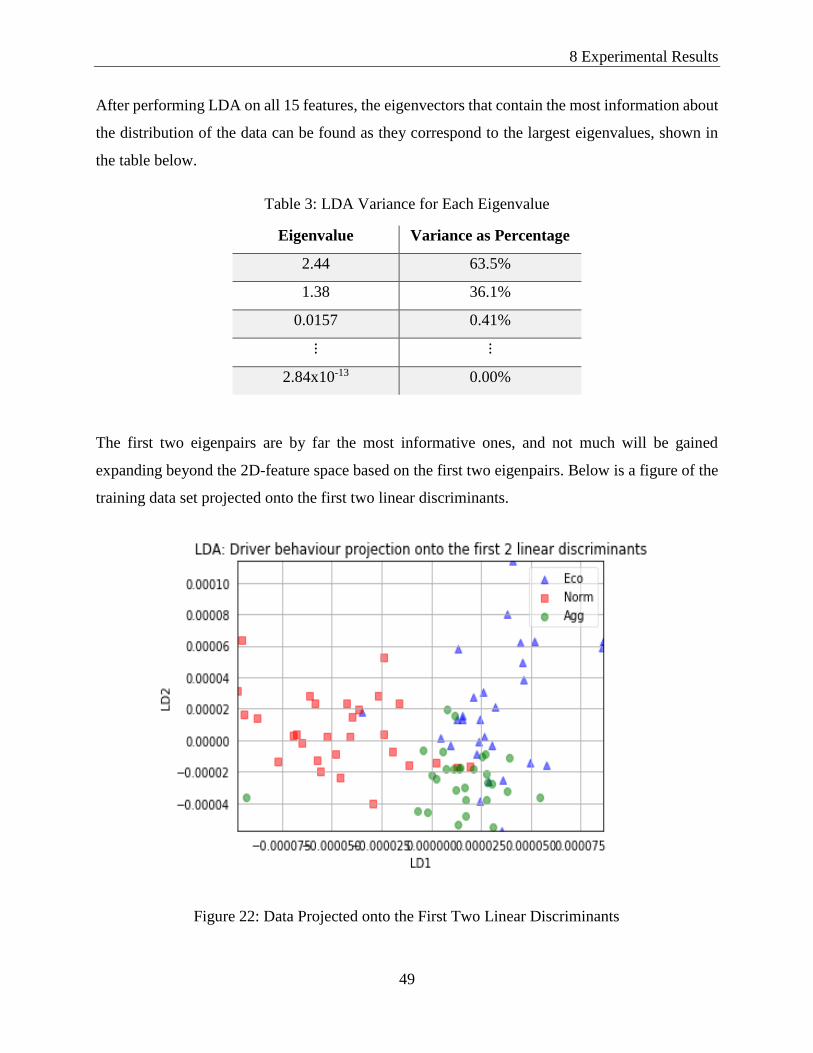
8 Experimental Results
49
After performing LDA on all 15 features, the eigenvectors that contain the most information about
the distribution of the data can be found as they correspond to the largest eigenvalues, shown in
the table below.
Table 3: LDA Variance for Each Eigenvalue
Eigenvalue Variance as Percentage
2.44 63.5%
1.38 36.1%
0.0157 0.41%
⋮ ⋮
2.84x10⁻¹³ 0.00%
The first two eigenpairs are by far the most informative ones, and not much will be gained
expanding beyond the 2D-feature space based on the first two eigenpairs. Below is a figure of the
training data set projected onto the first two linear discriminants.
Figure 22: Data Projected onto the First Two Linear Discriminants
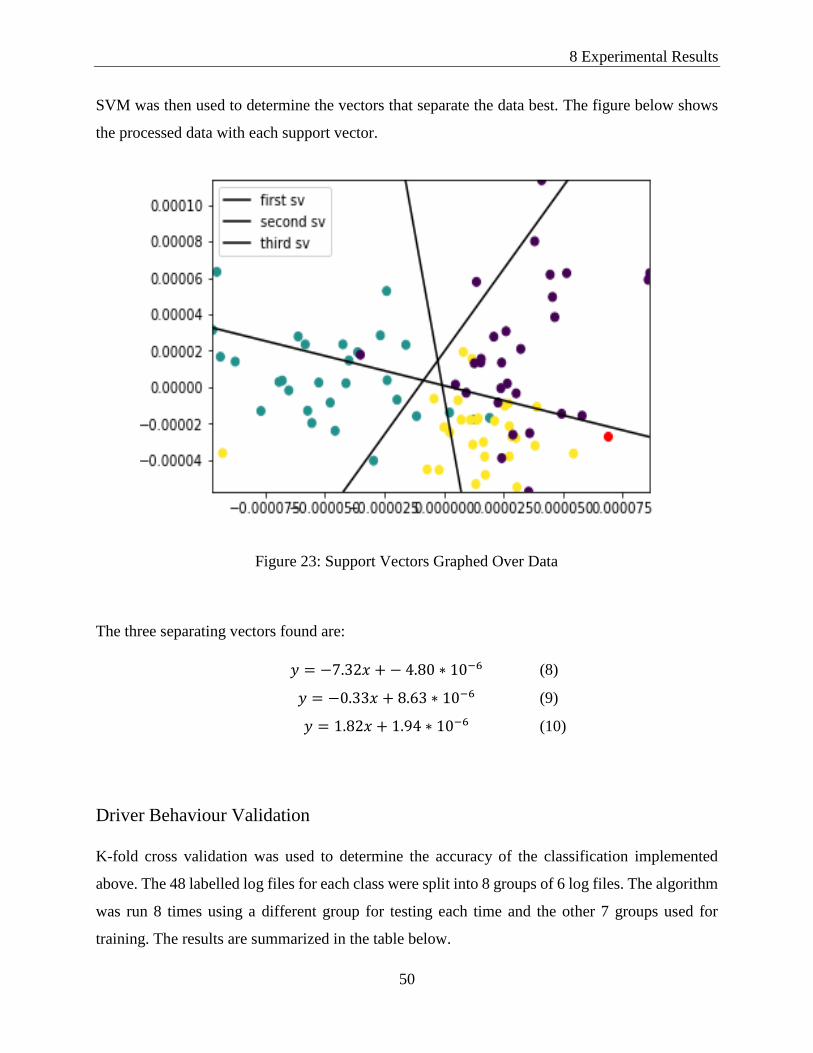
8 Experimental Results
50
SVM was then used to determine the vectors that separate the data best. The figure below shows
the processed data with each support vector.
Figure 23: Support Vectors Graphed Over Data
The three separating vectors found are:
𝑦 = −7.32𝑥 + − 4.80 ∗ 10−6 (8)
𝑦 = −0.33𝑥 + 8.63 ∗ 10−6 (9)
𝑦 = 1.82𝑥 + 1.94 ∗ 10−6 (10)
Driver Behaviour Validation
K-fold cross validation was used to determine the accuracy of the classification implemented
above. The 48 labelled log files for each class were split into 8 groups of 6 log files. The algorithm
was run 8 times using a different group for testing each time and the other 7 groups used for
training. The results are summarized in the table below.
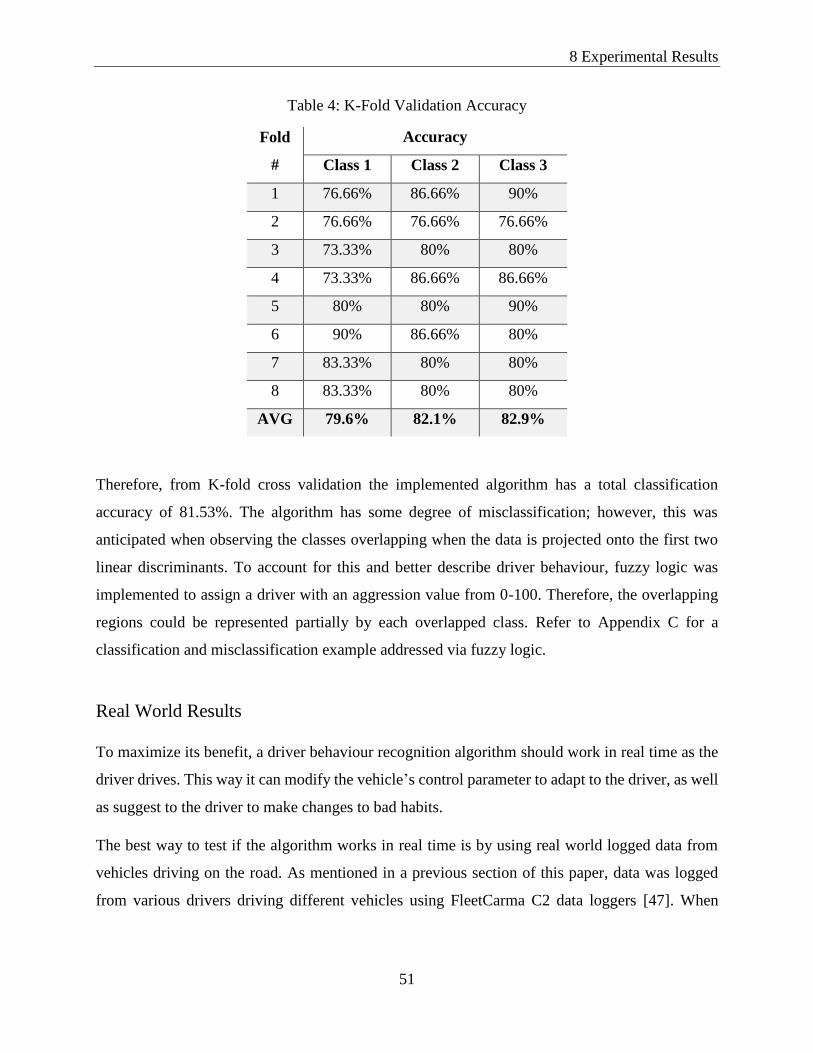
8 Experimental Results
51
Table 4: K-Fold Validation Accuracy
Fold
#
Accuracy
Class 1 Class 2 Class 3
1 76.66% 86.66% 90%
2 76.66% 76.66% 76.66%
3 73.33% 80% 80%
4 73.33% 86.66% 86.66%
5 80% 80% 90%
6 90% 86.66% 80%
7 83.33% 80% 80%
8 83.33% 80% 80%
AVG 79.6% 82.1% 82.9%
Therefore, from K-fold cross validation the implemented algorithm has a total classification
accuracy of 81.53%. The algorithm has some degree of misclassification; however, this was
anticipated when observing the classes overlapping when the data is projected onto the first two
linear discriminants. To account for this and better describe driver behaviour, fuzzy logic was
implemented to assign a driver with an aggression value from 0-100. Therefore, the overlapping
regions could be represented partially by each overlapped class. Refer to Appendix C for a
classification and misclassification example addressed via fuzzy logic.
Real World Results
To maximize its benefit, a driver behaviour recognition algorithm should work in real time as the
driver drives. This way it can modify the vehicle’s control parameter to adapt to the driver, as well
as suggest to the driver to make changes to bad habits.
The best way to test if the algorithm works in real time is by using real world logged data from
vehicles driving on the road. As mentioned in a previous section of this paper, data was logged
from various drivers driving different vehicles using FleetCarma C2 data loggers [47]. When
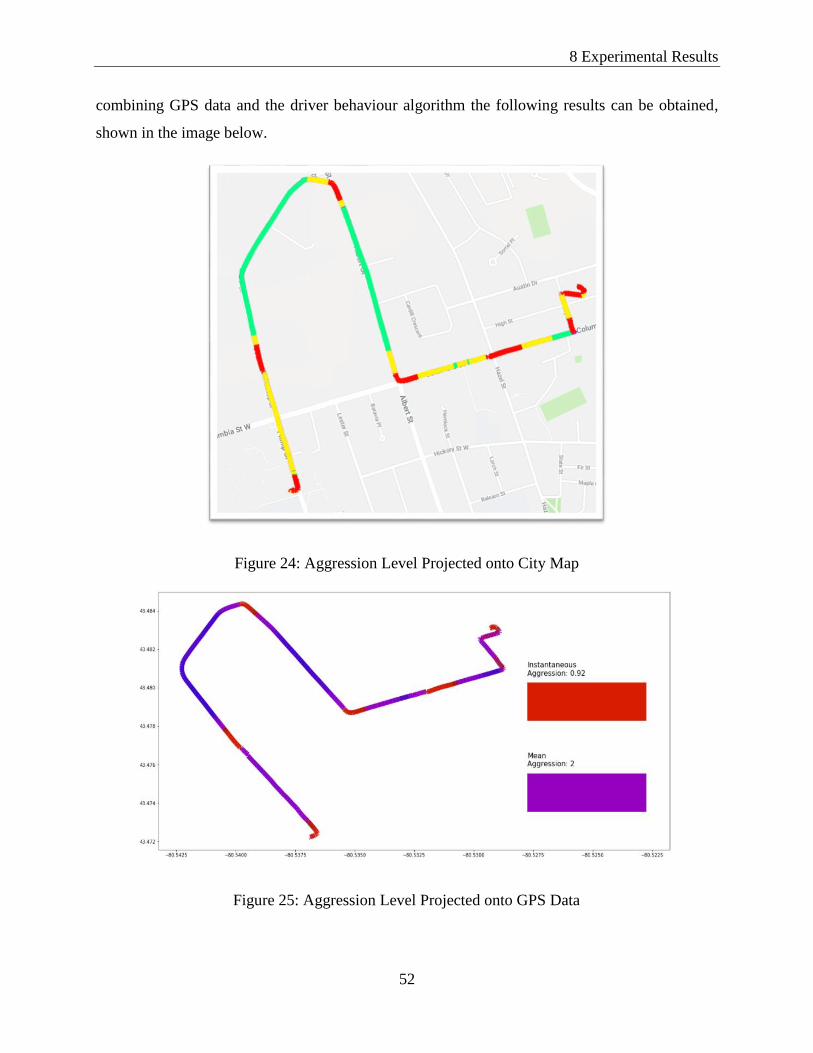
8 Experimental Results
52
combining GPS data and the driver behaviour algorithm the following results can be obtained,
shown in the image below.
Figure 24: Aggression Level Projected onto City Map
Figure 25: Aggression Level Projected onto GPS Data
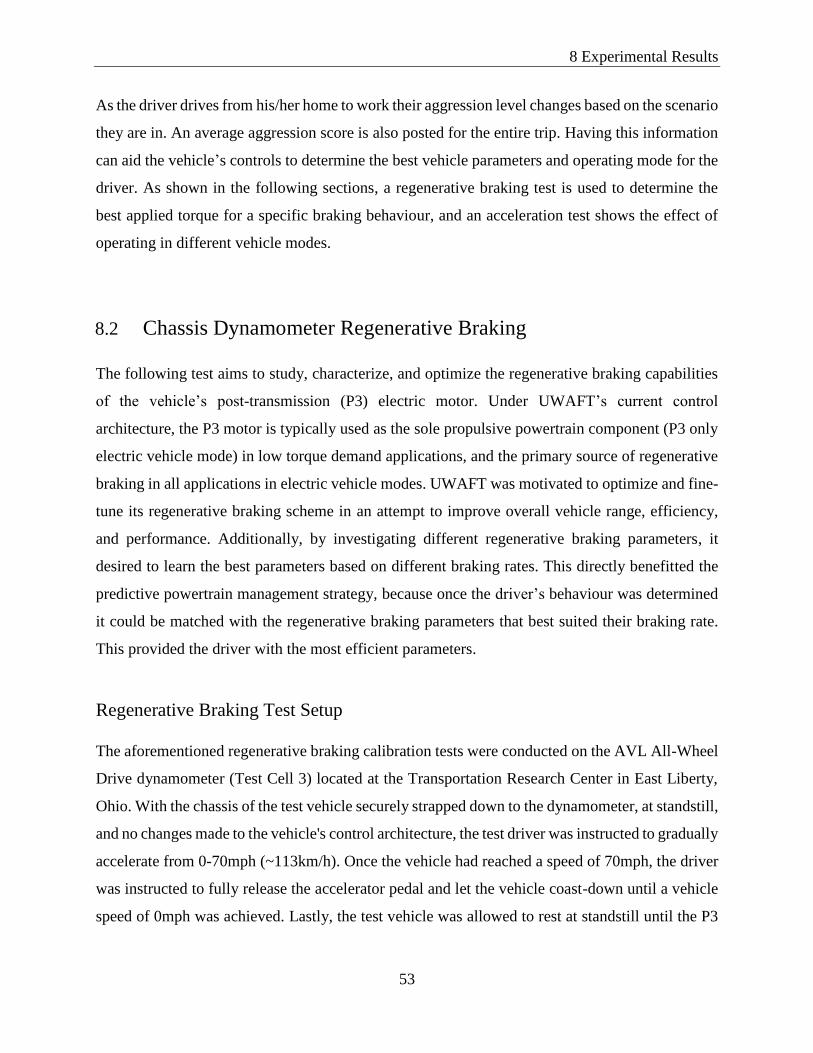
8 Experimental Results
53
As the driver drives from his/her home to work their aggression level changes based on the scenario
they are in. An average aggression score is also posted for the entire trip. Having this information
can aid the vehicle’s controls to determine the best vehicle parameters and operating mode for the
driver. As shown in the following sections, a regenerative braking test is used to determine the
best applied torque for a specific braking behaviour, and an acceleration test shows the effect of
operating in different vehicle modes.
8.2 Chassis Dynamometer Regenerative Braking
The following test aims to study, characterize, and optimize the regenerative braking capabilities
of the vehicle’s post-transmission (P3) electric motor. Under UWAFT’s current control
architecture, the P3 motor is typically used as the sole propulsive powertrain component (P3 only
electric vehicle mode) in low torque demand applications, and the primary source of regenerative
braking in all applications in electric vehicle modes. UWAFT was motivated to optimize and fine-
tune its regenerative braking scheme in an attempt to improve overall vehicle range, efficiency,
and performance. Additionally, by investigating different regenerative braking parameters, it
desired to learn the best parameters based on different braking rates. This directly benefitted the
predictive powertrain management strategy, because once the driver’s behaviour was determined
it could be matched with the regenerative braking parameters that best suited their braking rate.
This provided the driver with the most efficient parameters.
Regenerative Braking Test Setup
The aforementioned regenerative braking calibration tests were conducted on the AVL All-Wheel
Drive dynamometer (Test Cell 3) located at the Transportation Research Center in East Liberty,
Ohio. With the chassis of the test vehicle securely strapped down to the dynamometer, at standstill,
and no changes made to the vehicle's control architecture, the test driver was instructed to gradually
accelerate from 0-70mph (~113km/h). Once the vehicle had reached a speed of 70mph, the driver
was instructed to fully release the accelerator pedal and let the vehicle coast-down until a vehicle
speed of 0mph was achieved. Lastly, the test vehicle was allowed to rest at standstill until the P3
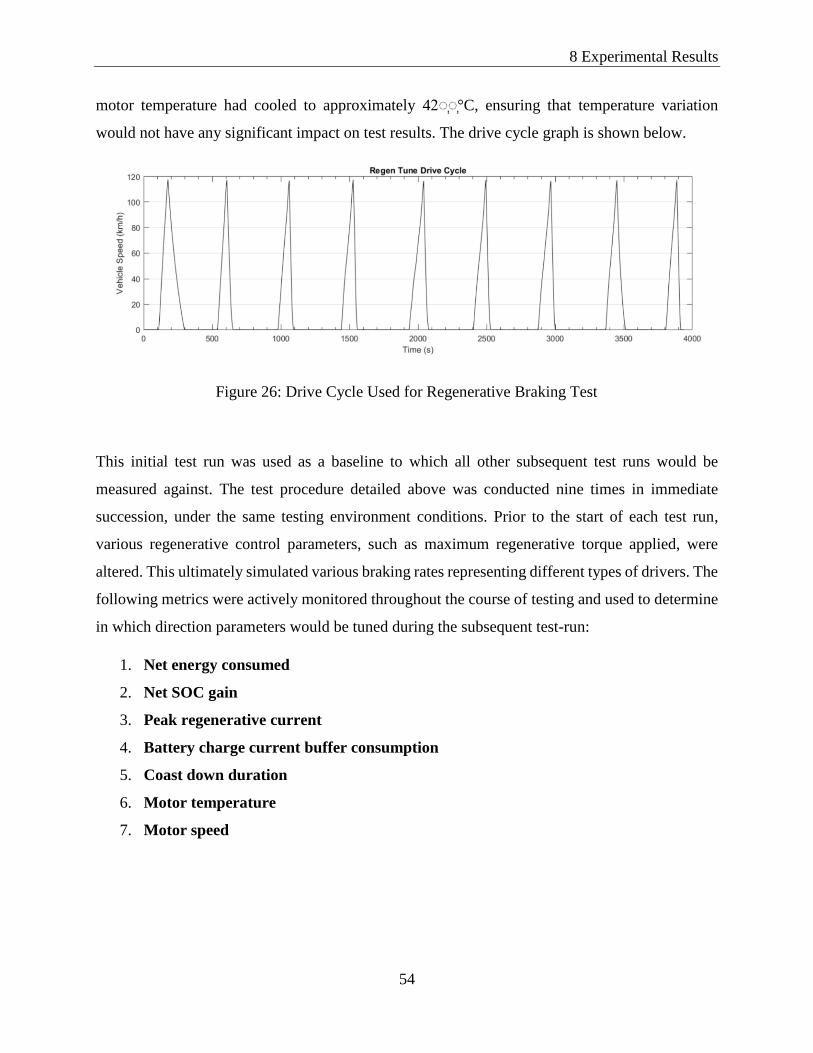
8 Experimental Results
54
motor temperature had cooled to approximately 42 ְ ְ °C, ensuring that temperature variation
would not have any significant impact on test results. The drive cycle graph is shown below.
Figure 26: Drive Cycle Used for Regenerative Braking Test
This initial test run was used as a baseline to which all other subsequent test runs would be
measured against. The test procedure detailed above was conducted nine times in immediate
succession, under the same testing environment conditions. Prior to the start of each test run,
various regenerative control parameters, such as maximum regenerative torque applied, were
altered. This ultimately simulated various braking rates representing different types of drivers. The
following metrics were actively monitored throughout the course of testing and used to determine
in which direction parameters would be tuned during the subsequent test-run:
1. Net energy consumed
2. Net SOC gain
3. Peak regenerative current
4. Battery charge current buffer consumption
5. Coast down duration
6. Motor temperature
7. Motor speed
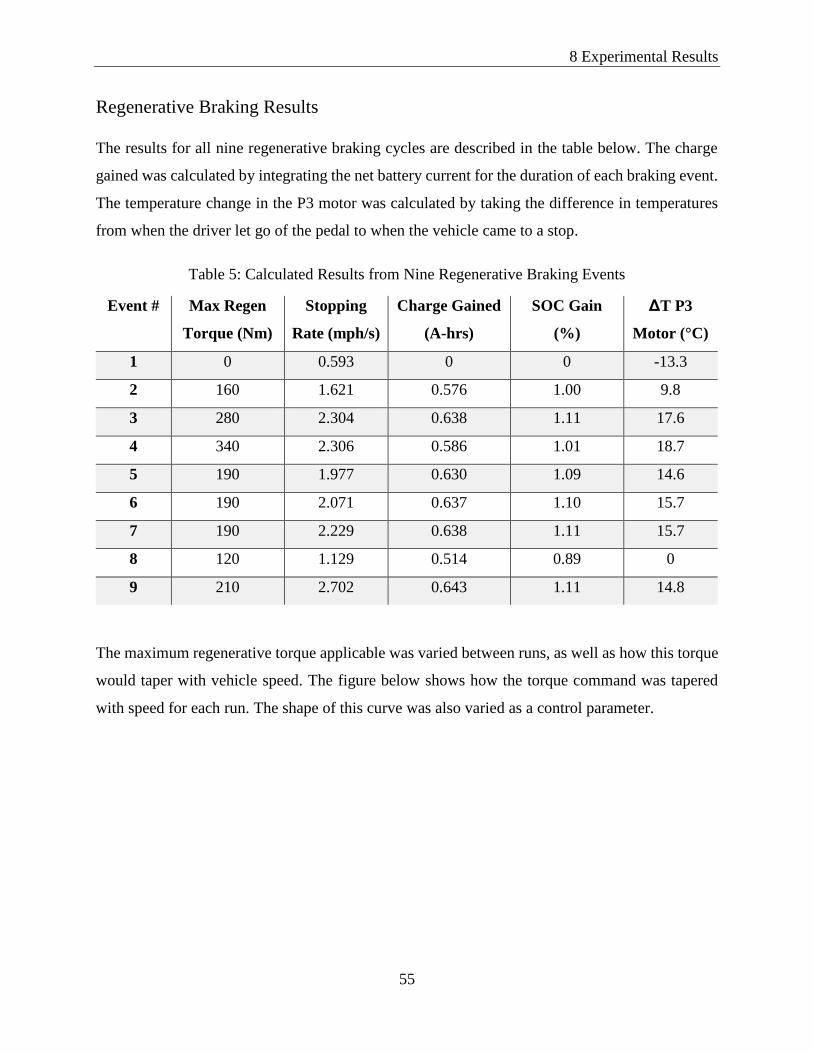
8 Experimental Results
55
Regenerative Braking Results
The results for all nine regenerative braking cycles are described in the table below. The charge
gained was calculated by integrating the net battery current for the duration of each braking event.
The temperature change in the P3 motor was calculated by taking the difference in temperatures
from when the driver let go of the pedal to when the vehicle came to a stop.
Table 5: Calculated Results from Nine Regenerative Braking Events
Event # Max Regen
Torque (Nm)
Stopping
Rate (mph/s)
Charge Gained
(A-hrs)
SOC Gain
(%)
ΔT P3
Motor (°C)
1 0 0.593 0 0 -13.3
2 160 1.621 0.576 1.00 9.8
3 280 2.304 0.638 1.11 17.6
4 340 2.306 0.586 1.01 18.7
5 190 1.977 0.630 1.09 14.6
6 190 2.071 0.637 1.10 15.7
7 190 2.229 0.638 1.11 15.7
8 120 1.129 0.514 0.89 0
9 210 2.702 0.643 1.11 14.8
The maximum regenerative torque applicable was varied between runs, as well as how this torque
would taper with vehicle speed. The figure below shows how the torque command was tapered
with speed for each run. The shape of this curve was also varied as a control parameter.
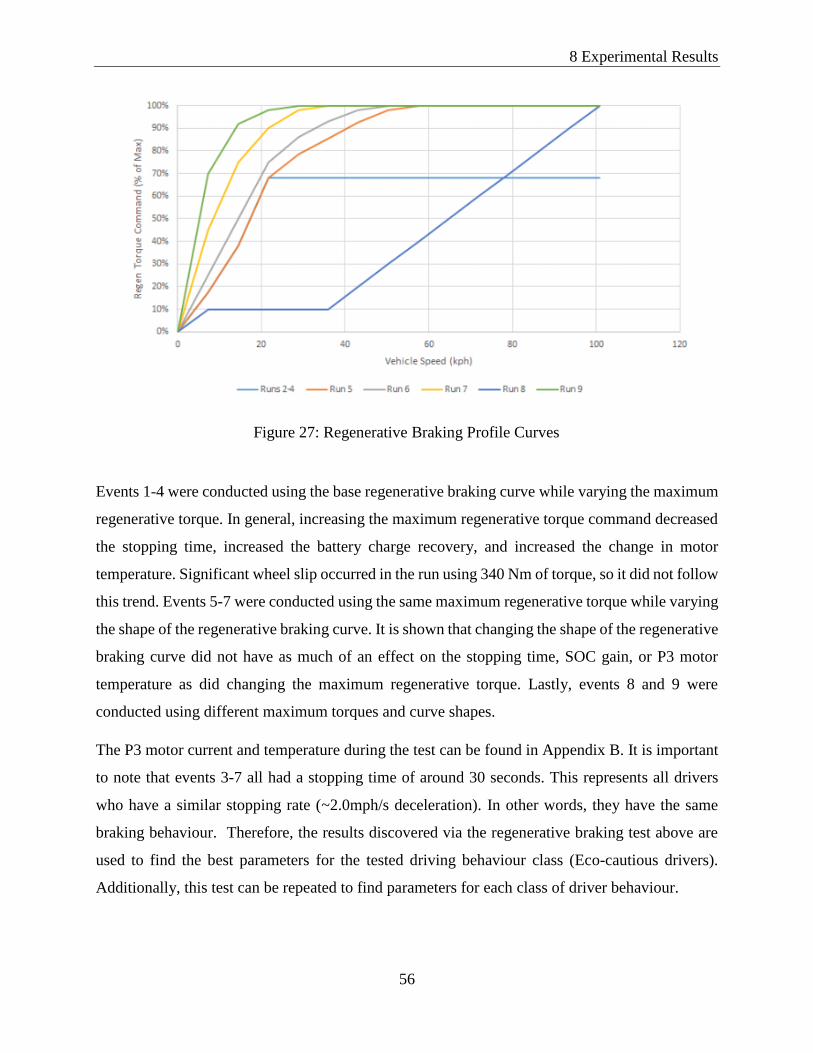
8 Experimental Results
56
Figure 27: Regenerative Braking Profile Curves
Events 1-4 were conducted using the base regenerative braking curve while varying the maximum
regenerative torque. In general, increasing the maximum regenerative torque command decreased
the stopping time, increased the battery charge recovery, and increased the change in motor
temperature. Significant wheel slip occurred in the run using 340 Nm of torque, so it did not follow
this trend. Events 5-7 were conducted using the same maximum regenerative torque while varying
the shape of the regenerative braking curve. It is shown that changing the shape of the regenerative
braking curve did not have as much of an effect on the stopping time, SOC gain, or P3 motor
temperature as did changing the maximum regenerative torque. Lastly, events 8 and 9 were
conducted using different maximum torques and curve shapes.
The P3 motor current and temperature during the test can be found in Appendix B. It is important
to note that events 3-7 all had a stopping time of around 30 seconds. This represents all drivers
who have a similar stopping rate (~2.0mph/s deceleration). In other words, they have the same
braking behaviour. Therefore, the results discovered via the regenerative braking test above are
used to find the best parameters for the tested driving behaviour class (Eco-cautious drivers).
Additionally, this test can be repeated to find parameters for each class of driver behaviour.
8 Experimental Results
57
8.3 Acceleration Testing
Similar to the regenerative braking test described above, acceleration is a characteristic directly
related to a driver’s behaviour. Aggressive drivers who push on the pedal harder will accelerate
faster, whereas eco-cautious drivers will take longer to reach their desired traveling speed. Due to
the complex architecture of the vehicle, the rate at which it accelerates may differ greatly
depending on which mode the vehicle is operating in. If they know the rate of acceleration and
how the driver behaves during an acceleration event, the controls can predict the best mode for the
vehicle.
The following test aims to compare acceleration performance between two different situations:
one where the vehicle begins in P3 only electric mode and transitions into performance mode (full
drive) due to requested torque and another where the vehicle is already in full drive.
Acceleration Test Setup
The following test was taken on a closed course test track operated by the city of Waterloo. This
was to ensure a controlled environment with similar conditions for both accelerations events. Each
event consisted of the driver reaching 20 km/h and then applying wide-open throttle (accelerator
pedal 100% pressed) for 5 seconds.
Acceleration Test Results
The following graph shows the vehicle speed versus time. The dotted line is the acceleration event
when the vehicle is already in full drive and the solid black line is the vehicle starting in P3 only
electric mode and eventually transitioning into full drive. The transition occurs around the four-
second mark when the graph changes from green to red.
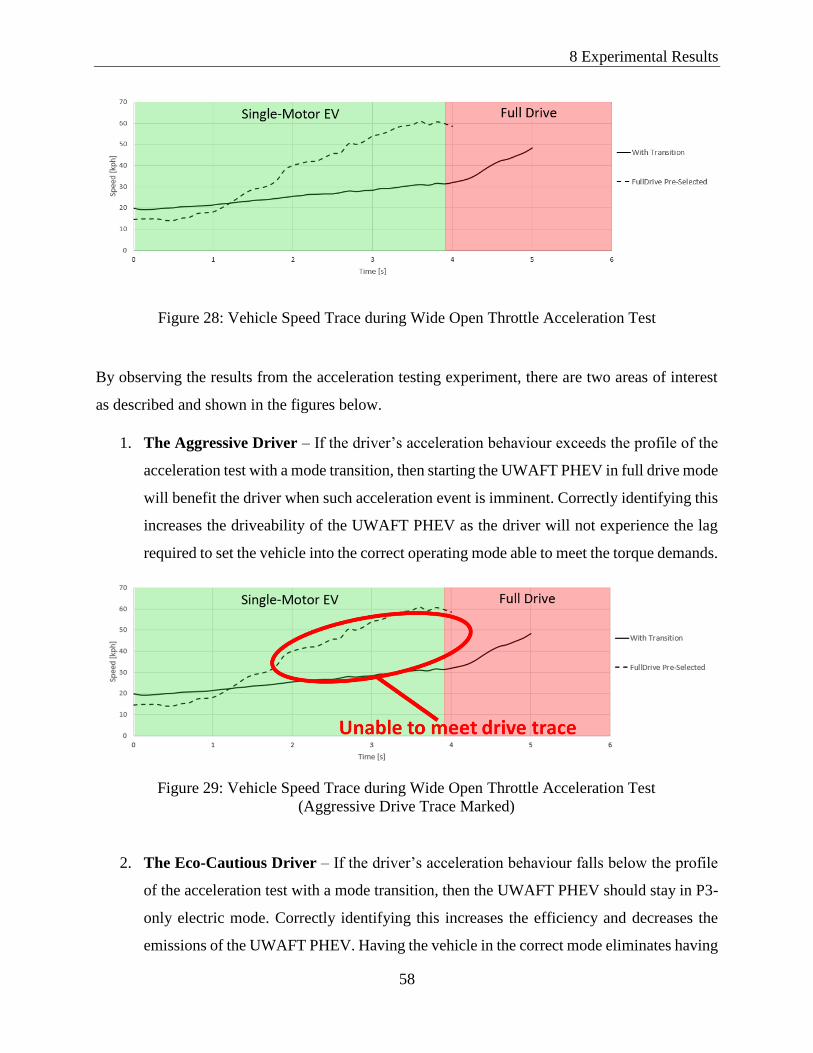
8 Experimental Results
58
Figure 28: Vehicle Speed Trace during Wide Open Throttle Acceleration Test
By observing the results from the acceleration testing experiment, there are two areas of interest
as described and shown in the figures below.
1. The Aggressive Driver – If the driver’s acceleration behaviour exceeds the profile of the
acceleration test with a mode transition, then starting the UWAFT PHEV in full drive mode
will benefit the driver when such acceleration event is imminent. Correctly identifying this
increases the driveability of the UWAFT PHEV as the driver will not experience the lag
required to set the vehicle into the correct operating mode able to meet the torque demands.
Figure 29: Vehicle Speed Trace during Wide Open Throttle Acceleration Test
(Aggressive Drive Trace Marked)
2. The Eco-Cautious Driver – If the driver’s acceleration behaviour falls below the profile
of the acceleration test with a mode transition, then the UWAFT PHEV should stay in P3-
only electric mode. Correctly identifying this increases the efficiency and decreases the
emissions of the UWAFT PHEV. Having the vehicle in the correct mode eliminates having

8 Experimental Results
59
the engine on unnecessarily and allows the UWAFT PHEV to operate in the most efficient
mode.
Figure 30: Vehicle Speed Trace during Wide Open Throttle Acceleration Test
(Eco-Cautious Drive Trace Marker)
8.4 ADAS Algorithm Performance
The predictive powertrain management strategy based on driver behaviour recognition discussed
throughout this report has many areas in which it may be enhanced. One of those areas, for
example, is the integration of situational information. Depending on the situation the driver is in,
it may cause them to behave differently then normal. An example of this is when a driver gets cut
off by another vehicle, causing them to brake aggressively, although this doesn’t necessarily mean
they always brake aggressively. Therefore, including additional pieces of information from ADAS
or GPS can help to improve the driver behaviour recognition. The following section discusses the
performance of the UWAFT integrated ADAS sensors.
The test connected was a vehicle approach test from 100 meters away. A stationary vehicle was
placed in front of the UWAFT PHEV, which had all of the ADAS sensors integrated, and the
driver slowly approached the rear of the stopped vehicle. Pylons were set up every 5 metres to act
as the ground truth, allowing the range measurement error to be calculated. It should be noted that
the vehicle approach test was conducted during the presence of rain, which affected the
performance of the sensors.
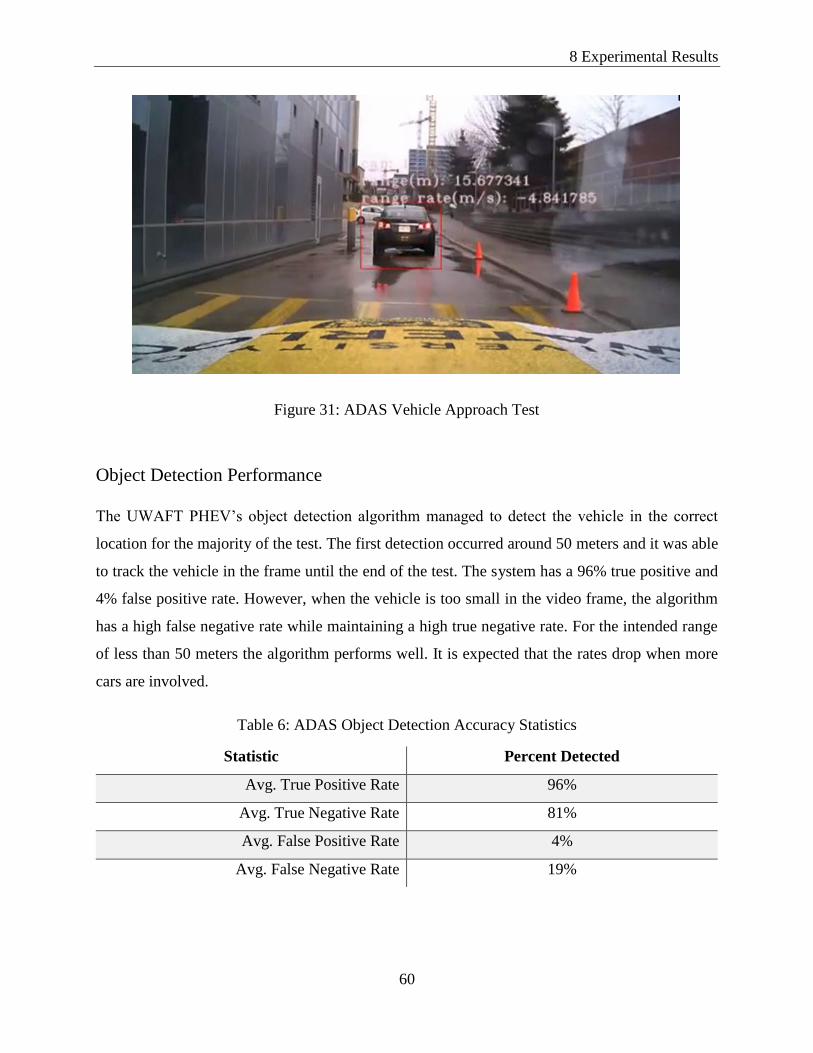
8 Experimental Results
60
Figure 31: ADAS Vehicle Approach Test
Object Detection Performance
The UWAFT PHEV’s object detection algorithm managed to detect the vehicle in the correct
location for the majority of the test. The first detection occurred around 50 meters and it was able
to track the vehicle in the frame until the end of the test. The system has a 96% true positive and
4% false positive rate. However, when the vehicle is too small in the video frame, the algorithm
has a high false negative rate while maintaining a high true negative rate. For the intended range
of less than 50 meters the algorithm performs well. It is expected that the rates drop when more
cars are involved.
Table 6: ADAS Object Detection Accuracy Statistics
Statistic Percent Detected
Avg. True Positive Rate 96%
Avg. True Negative Rate 81%
Avg. False Positive Rate 4%
Avg. False Negative Rate 19%
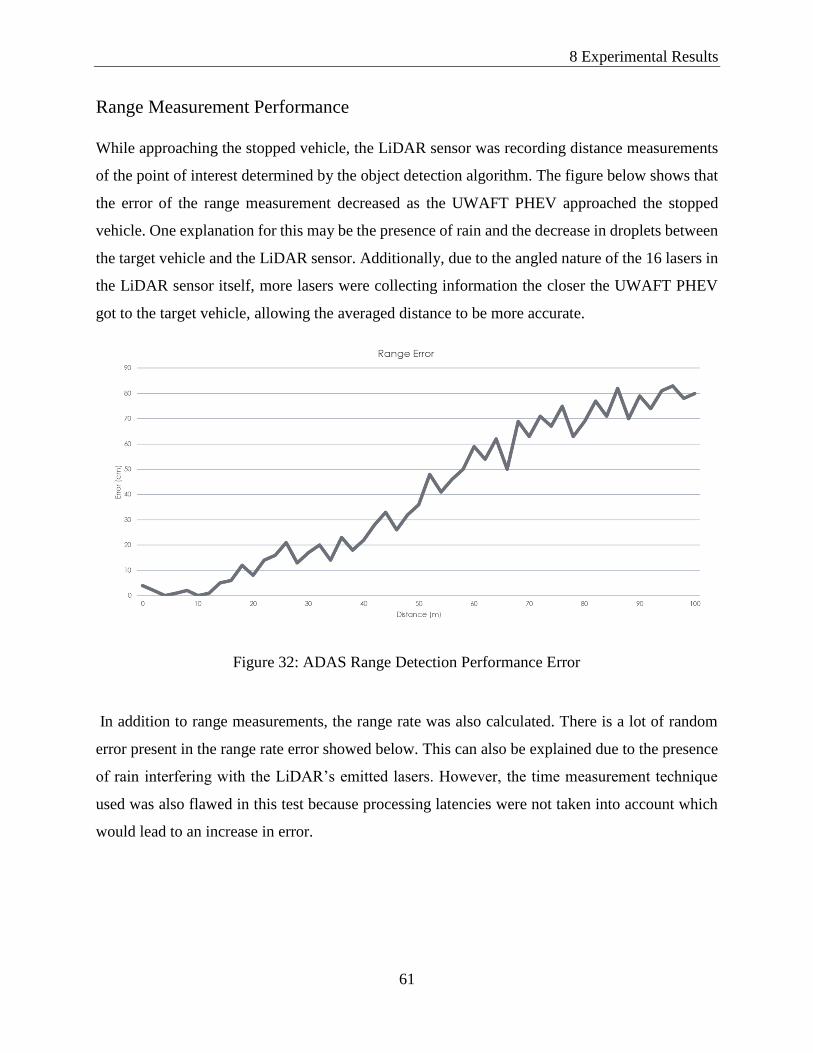
8 Experimental Results
61
Range Measurement Performance
While approaching the stopped vehicle, the LiDAR sensor was recording distance measurements
of the point of interest determined by the object detection algorithm. The figure below shows that
the error of the range measurement decreased as the UWAFT PHEV approached the stopped
vehicle. One explanation for this may be the presence of rain and the decrease in droplets between
the target vehicle and the LiDAR sensor. Additionally, due to the angled nature of the 16 lasers in
the LiDAR sensor itself, more lasers were collecting information the closer the UWAFT PHEV
got to the target vehicle, allowing the averaged distance to be more accurate.
Figure 32: ADAS Range Detection Performance Error
In addition to range measurements, the range rate was also calculated. There is a lot of random
error present in the range rate error showed below. This can also be explained due to the presence
of rain interfering with the LiDAR’s emitted lasers. However, the time measurement technique
used was also flawed in this test because processing latencies were not taken into account which
would lead to an increase in error.
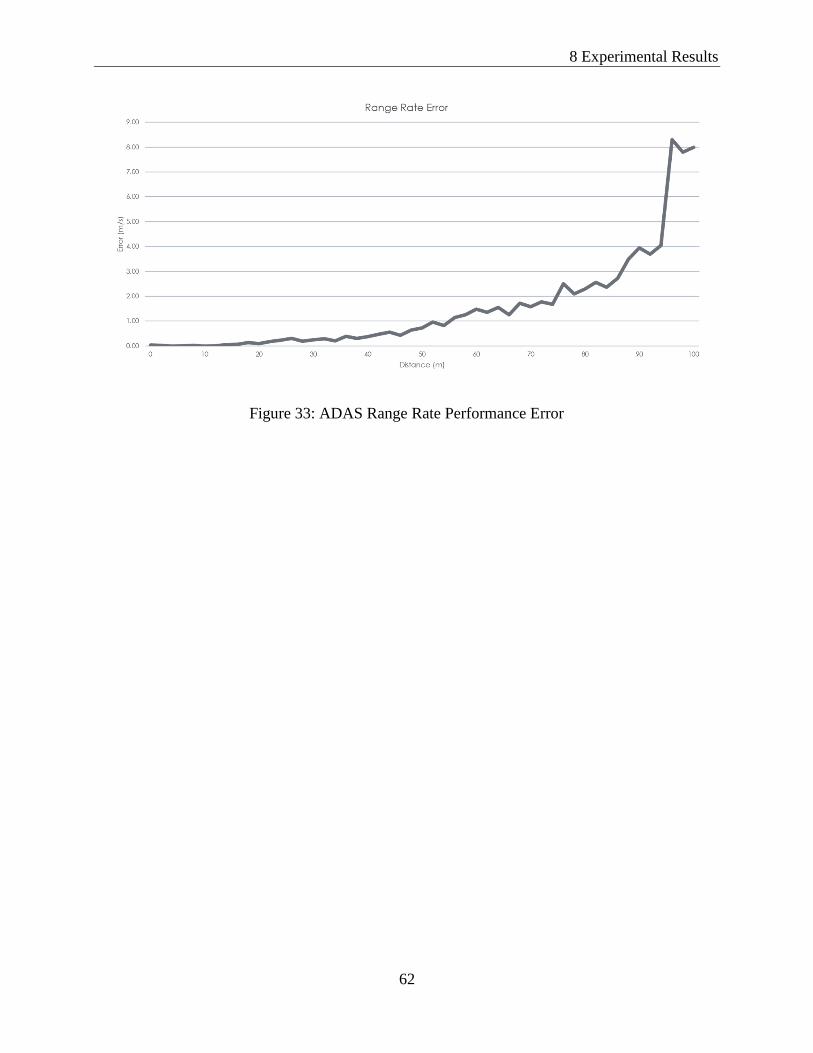
8 Experimental Results
62
Figure 33: ADAS Range Rate Performance Error

63
Part III - Conclusions
64
CHAPTER 9
9.0 Conclusions
9.1 Driver Behaviour Recognition Experiment
With the use of the UWAFT PHEV vehicle model developed in Simulink, 288 hours of labelled
driving data was simulated. This data represented three different classes of drivers, eco-cautious,
normal, and aggressive. The CAN signals that were recorded from the model and used for driver
behaviour recognition were accelerator pedal position, brake pedal position, and vehicle speed.
Through the process of feature extraction on the logged CAN data, 15 unique features were
processed to represent a single driver. Each feature alone was unable to classify an unknown driver
behaviour. However, after preforming linear discriminant analysis class separation was more
noticeable when projecting the data onto the first two linear discriminants.
Support vector machines were able to take the processed data and classify them into three classes,
eco-cautious, normal, or aggressive, with an average accuracy of 81.53%. Some degree of
misclassification was expected, as there was crossover between classes; for example, lower-end
aggressive drivers and high-end normal drivers. Better representing the classification, fuzzy logic
was successfully integrated to assign drivers an aggression value between 0 and 100. Instead of a
point near the support vector being classified as either one class or the other, it was given an
aggression value through fuzzy logic. The membership functions used for the fuzzy logic were
based on the distance the point was to each support vector. This proved beneficial as it helped
distinguish between data near the support vector and data further away, also reducing the error of
misclassified data near a support vector.
Ultimately, the driver behaviour recognition implemented was successful. As shown, when applied
to real world driving data it correctly provided feedback to identify the driver’s aggression level.
9 Conclusion
65
9.2 Predictive Controls Strategy Experiments
Two scenarios were explored to investigate how a predictive controls strategy could be
implemented if the vehicle knew the driver’s behaviour. One was an acceleration event where the
UWAFT PHEV was in different operating modes, and the other was a braking event using different
regenerative braking parameters.
By observing the results from the acceleration testing experiment, two conclusions can be drawn
as described below:
1. If the driver’s acceleration behaviour exceeds the profile of the acceleration test with a
mode transition, then starting the UWAFT PHEV in full drive mode will benefit the driver
when such acceleration event is imminent. Correctly identifying this increases the
driveability of the UWAFT PHEV as the driver won’t experience the lag required to set
the vehicle into the correct operating mode able to meet the torque demands.
2. If the driver’s acceleration behaviour falls below the profile of the acceleration test with a
mode transition, then the UWAFT PHEV should stay in P3-only electric mode. Correctly
identifying this increases the efficiency and decreases the emissions of the UWAFT PHEV.
Having the vehicle in the correct mode eliminates having the engine on unnecessarily and
allows the UWAFT PHEV to operate in the most efficient mode.
By observing the results from the regenerative braking test it can be seen that properly tuning the
regenerative braking parameters to match a driver’s braking style results in a gain of as much as
0.1% SOC. Although relatively small, the gain in SOC is per braking event, which can add up over
the course of an entire trip. This can also be represented as 0.003% SOC gain per second of
braking.
9 Conclusion
66
9.3 ADAS Performance Experiment
The integrated LiDAR and camera sensors performed successfully in meeting the competition
requirements for the ADAS swim-lane. The camera was able to correctly and accurately detect
vehicles in the driver’s lane and neighbouring lanes, while the LiDAR determined the distance.
The effectiveness of the system will depend on the effective range of the sensors. The system can
only react to what it is able to detect and within the stopping distance of the Camaro. The range of
the ADAS sensors is susceptible to environmental and operating conditions of the vehicle. Due to
the use of lasers in the LiDAR system, environmental conditions such as rain and snow will reduce
the range of the system as it adds noise. In turn, this limits the maximum effective speed that the
UWAFT PHEV’s ADAS sensors can operate at because, the faster the vehicle is moving, the
longer the required stopping distance is.
Similarly, the forward-facing camera is susceptible to low light conditions. Nighttime driving will
experience reduced range because of the darkening of the image that is used to detect vehicles.
This is partially mitigated by the vehicle’s headlights, but the system will still have increased
difficulty and reduced confidence in detecting vehicles in the adjacent lanes.
Ultimately, UWAFT PHEV made good progress towards a viable ADAS solution. The algorithms
proved successful for their intended purpose and with additional refinement, they can be depended
upon for detecting dangerous situations.
9.4 Innovation Project
The innovation project proposed and investigated throughout this thesis has a lot of potential to
change the way the hybrid supervisory controller makes decisions. By utilizing machine
intelligence techniques over time, the UWAFT PHEV has proven it can learn how the driver
behaves. With these additional pieces of information the controls system becomes more advanced.
By knowing the driver will accelerate aggressively, the UWAFT PHEV can primitively enter a
vehicle mode that will be able to provide the torque requested. This reduces the lag the driver
would normally experience, increasing the driveability of the vehicle. A few of these scenarios are
explored in the predictive controls strategy experiments section above.
9 Conclusion
67
Ultimately, this brought a unique feature to the UWAFT PHEV that is desired by the target market.
The aim to reach tech savvy individuals pushed UWAFT to implement state-of-the-art technology
allowing these features to be first to the market for their customers. Additionally, the benefits of
the hybrid supervisory controller knowing the driver’s behaviour creates a more environmentally
friendly vehicle. This supports the subconscious environmentalist who is drawn to a hybrid vehicle
in the first place. Lastly, the increase in driveability helps the Camaro to maintain its iconic role
as a high performance car.
68
CHAPTER 10
10.0 Discussions and Future Work
The predictive powertrain management controls strategy based on driver behaviour explored
throughout this paper is still very much in the early stages of development. There are several
features that still need refinement to advance this project to a point where it can be deployed into
a vehicle. Along with need for refinement, there are some areas in which expanding this project
could improve its overall impact. Those areas include, incorporating the ADAS data, GPS data,
and developing a Bayesian network.
10.1 Recommendations for Future Work
Due to the strict timeline of the competition, only 6 months of development was progressed;
however, a strong foundation was built on which this project could continue for the next AVTC
series UWAFT participates in. The recommendations for future work are discussed in the
following section.
Continued Vehicle Testing
Although only one acceleration event and one regenerative braking calibration were tested in this
report it is believed that it can be easily expanded to a wide range of scenarios. Continuing to do
vehicle testing of the aforementioned experiments with different goals should be a priority. The
following experiments should be repeated with the described goals in mind:
1. Acceleration Testing – Repeat the experiment conducted in this report for multiple runs
at various starting speeds and acceleration rates in different vehicle modes. This will
ultimately create a 3D map of acceleration profiles in different modes, just as the
experiment in this report showed the best mode for a wide open throttle event given the
predicted drive profile (driver’s behaviour). The 3D map would be an extension of this
10 Discussions and Future Work
69
capturing not only wide open throttle events but as many different acceleration types as
possible. This would increase the effectiveness of the predictive powertrain management
controls strategy as each scenario tested would result in a scenario where the driver’s
behaviour could factor into the operating mode decision.
2. Regenerative Braking – Similarly, repeating the regenerative braking test conducted in
the report to encompass additional driving styles would result in improved effectiveness of
the predictive powertrain management. Due to time restrictions on the chassis
dynamometer, optimized regenerative braking parameters were determined for only one
driving style. To see the benefits of utilizing a driver’s behaviour to change parameters,
optimal parameters need to be found for multiple driving styles. This way, once the driver’s
behaviour is detected correctly, the vehicle can change to the parameters that best suit them.
Behaviour Recognition Refinement
The methodology described in the report to classify drivers based on their driving behaviour is
sound and should be continued to be used in further development. However, the training process
needs to be refined. While creating labelled data with the help of the UWAFT PHEV powertrain
model proved viable, it is not the most representative of a true driver. Incorporating more data
collected via the OBD port data loggers from vehicles driving around roads in real traffic is a more
realistic approach. As opposed to following a drive cycle, drivers are more susceptible to sudden
stops, aggressive passing, and lateral acceleration in the presence of traffic. These are all actions
that help define a driver’s behaviour. Thus, refining the training algorithm to use data that is more
realistic may improve the results found.
Additional Input Signals
As discussed previously, using data that is more realistic can improve the results and classification
accuracy for a driver’s behaviour. In addition to this, using more input signals for the algorithm
will increase the effectiveness of the overall project. As discussed, sudden stops, aggressive
passing and later accelerations all help to define a driver’s behaviour, but this depends on the
scenario of the driver. Depending on situational or environmental impacts, a driver may need to
10 Discussions and Future Work
70
come to a sudden stop without displaying habits of aggressive driving. An example of this may be
an unforeseen object entering the path of the vehicle. Many scenarios like this can introduce errors
into the recognition algorithm. Taking the average over the course of a certain timeframe will help
to dilute any of the bias data. However, the inclusion of ADAS and GPS data would help to
determine environmental and situational impacts to a driver’s behaviour. This adds the benefit of
predicting a driver’s behaviour given a certain repeated scenario.
Bayesian Network Development
One missing factor required for the implementation of the predictive powertrain management
strategy that would greatly increase its effectiveness is the development of a Bayesian network. A
Bayesian network is a probabilistic graphical model that can be used as the final piece to determine
the actions taken by the controls. In other words, given the following inputs – situational data (ex.
ADAS), environmental data (ex. GPS), vehicle data (ex. CAN), and driver behaviour data – what
is the probability that the driver will accelerate? Once this probability is determined, if it exceeds
a defined threshold then the controls can select an operating mode in which the UWAFT PHEV is
ready to accommodate the coming requested torque needs.
Gamification
Ultimately, the best way to reduce emissions and energy consumption is to change a driver’s
behaviour. One potential way to do this is through the gamification of the recognition software.
Having a leaderboard and reward system showing the top eco-drivers in your area can unleash
people’s competitive sides and push them to drive more eco-cautiously. Knowing the way you’re
driving affects your fuel economy and seeing the comparison to others also brings light to the
situation allowing you to make improvements. This may also result in a less complex need to have
a predictive powertrain management strategy if the recognition software is focused on changing
the way people drive rather than adapting to it.
10 Discussions and Future Work
71
ADAS Potential Issues
Although the implemented ADAS was successful, it is important to keep in mind potential issues
identified by the team. Minimal in-vehicle testing was completed due to lack of dedicated ADAS
work time, thus there is a possibility of these issues arising.
1. Transmitting data over CAN – Ensure that data being sent from the Jetson TX2 is without
errors and has the correct identifications number. Sending the data to the wrong receiver
could be catastrophic. There is also a need to make sure the Jetson TX2 receives the correct
data to perform relative speed calculations. At the same time, UWAFT must be cautious
not to overload the CAN bus. Otherwise, the car will not be able to function.
2. Latency – Ensure latency of the system is kept to a minimum to maintain real-time
reliability. Evaluate performance by benchmarking the ADAS system’s time from
detection to alerting. Additionally, for the system to be reliable, the system needs to notify
the driver when it is not functional. When the system is not confident in performing in
adverse conditions such as low light or heavy precipitation, the driver feedback system
needs to alert the driver for attention. Detecting these conditions can be challenging but
can be accomplished by analyzing noise in LiDAR signals and the overall light levels in
the forward-facing camera.
72
11.0 References
[1] "Advanced Vehicle Techonolgy Competition Series," Argonne National Laboratory,
[Online]. Available: avtcseries.org. [Accessed 06 06 2018].
[2] Lulu Si, Mario Hirz, and Helmut Brunner, "Big Data-Based Driving Pattern Clustering and
Evaluation in Combination with Driving Circumstances," SAE International, 2018.
[3] E. Schmidt, "Electric Vehicle Sales In Canada, 2017," Fleet Carma, 8 February 2018.
[Online]. Available: https://www.fleetcarma.com/electric-vehicle-sales-canada-2017/.
[Accessed 8 6 2018].
[4] UWAFT, "Architecture Selection Proposal," University of Waterloo, Waterloo, 2015.
[5] Raed Kadri, Sam Saad, "Connected and Autonomous Vehicles in Ontario: Technology
Highlights," 28 March 2018. [Online]. Available: http://www.oce-ontario.org/docs/default-
source/default-document-library/avin-report-(28-03-2018).pdf. [Accessed 8 June 2018].
[6] E. T. Shahriar Shafiee, "When Will Fossil Fuel Reserves be Diminshed," Energy Policy ,
vol. 37, no. 1, pp. 181-189, 2009.
[7] E. W. Jeremy Neubauer, "The Impact of Range Anxiety and Home, Workplace, and Public
Charging Infrastructure on Simulated Battery Electric Vehicle Lifetime Utility," Journal of
Power Sources, vol. 257, no. 1, pp. 12-20, 2015.
[8] S. Davis, "Transportation Energy Data Book," U.S. Department of Energy, Tech. , 2000.
[9] "Vehicle and Fuel Emissions Testing," United States Environmental Protection Agency, 31
January 2017. [Online]. Available: https://www.epa.gov/vehicle-and-fuel-emissions-
testing/dynamometer-drive-schedules#main-content. [Accessed 8 6 2018].
11 References
73
[10] Felipe Jiménez, Juan Carlos Amarillo, José Eugenio Naranjo, Francisco Serradilla, Alberto
Díaz, "Energy consumption estimation in electric vehicles," University Institute for
Automobile Research (INSIA), Madrid, Spain, 2015.
[11] Jeffrey Gonder, Matthew Earleywine and Witt Sparks, "Analyzing Vehicle Fuel Saving
Opportunities through," SAE International, 2012.
[12] E. Ericsson, "Independent driving pattern factors and their influence on fuel-use and exhaust
emission factors," Transportation Research Part D: Transport and Environment, vol. 6, no.
5, pp. 325-345, 2001.
[13] Taeyoung Lee and Joonwoo Son, "Relationships between Driving Style and," SAE
International, South Korea, 2011.
[14] Fazal Syed, Swathi Nallapa, Allen Dobryden, Carrie Grand. et al. , "Design and Analysis of
an Adaptive Real-Time Advisory System for Improving Real World Fuel Economy in a
Hybrid Electric Vehicle," SAE International, 2010.
[15] "IHS Markit," 2 January 2018. [Online]. Available: http://news.ihsmarkit.com/press-
release/automotive/autonomous-vehicle-sales-surpass-33-million-annually-2040-enabling-
new-auto. [Accessed 8 June 2018].
[16] "SAE International," 3 September 2017. [Online]. Available:
/https://www.sae.org/misc/pdfs/automated_driving.pdf. [Accessed 8 June 2018].
[17] N. H. T. S. Administration, "Crash Stats," February 2018. [Online]. Available:
https://crashstats.nhtsa.dot.gov/Api/Public/ViewPublication/812451. [Accessed 8 June
2018].
[18] "Top 25 Causes of Car Accidents," Pines Salomon Injury Lawyers, [Online]. Available:
https://seriousaccidents.com/legal-advice/top-causes-of-car-accidents/. [Accessed 8 June
2018].
[19] F. T. D. W. a. F. W. Seunghyuk Choi, "Advanced driver-assistance systems: Challenges and
opportunities ahead," McKinsey & Company, February 2016. [Online]. Available:
11 References
74
https://www.mckinsey.com/industries/semiconductors/our-insights/advanced-driver-
assistance-systems-challenges-and-opportunities-ahead. [Accessed 8 June 2018].
[20] Andrew Liu, Nobuyuki Kuge, Tomohiro Yamamura and Osamu Shimoyama, "A Driver
Behavior Recognition Method Based on a Driver Model Framework," SAE International,
Detriot, Michigan, 2000.
[21] Patrick Brombacher, Johannes Masino, Michael Frey, Frank Gauterin, "Driving Event
Detection and Driving Style Classification using Artificial Neural Networks," IEEE,
Karlsruhe, Germany , 2017.
[22] D. A. Johnson and M. M. Trivedi, "Driving style recognition using a smartphone as a sensor
platform," IEEE, Washington, DC, 2011.
[23] Minh Van Ly ; Sujitha Martin ; Mohan M. Trivedi , "Driver classification and driving style
recognition using inertial sensors," IEEE, Gold Coast, QLD, Australia, 2013.
[24] Wenshuo Wang, Student Member, IEEE, Junqiang Xi, Alexandre Chong, and Lin Li,
"Driving Style Classification Using a Semisupervised Support Vector Machine," IEEE, 2017.
[25] Ahmad Aljaafreh, Nabeel Alshabatat, Munaf S. Najim Al-Din , "Driving style recognition
using fuzzy logic," IEEE, Istanbul, Turkey, 2012.
[26] Oussama Derbel, ReneJr Landry , "Driving Style Assessment Based On the GPS Data and
Fuzzy Inference Systems," Département de génie électrique, Montreal, Canada , 2015.
[27] Andreas A. Malikopoulos, Dennis N. Assanis, Panos Y. Papalambros , "Optimal Engine
Calibration for Individual Driving Styles," SAE International, Detroit, Michigan, 2008.
[28] Tae-Kyung Lee and Zoran Filipi , "Real-World Driving Pattern Recognition for Adaptive
HEV Supervisory Control: Based on Representative Driving Cycles in Midwestern US,"
SAE International, Michigan , 2012.
[29] Project Management Swimlane: Year 3 Roadmap, Argonne National Laboratory, 2017.
11 References
75
[30] Mechanical Swimlane Year 4 Roadmap, Argonne National Laboratory, 2017.
[31] Controls Systems Modeling & Simulation Swimlane: Year 4 Roadmap, Argonne National
Laboratory , 2017.
[32] Electrical and Computer Engineering Swimlane: Year 3 Roadmap, Argonne National
Laboratory , 2017.
[33] Innovation Swimlane Year 4 Roadmap, Argonne National Laboratory, 2017.
[34] UWAFT, "Consumer Market Research Report," University of Waterloo, Waterloo, 2014.
[35] K. Foster, "What's Good about Generation Y?," Greater Good, 24 January 2013. [Online].
Available: https://greatergood.berkeley.edu/article/item/whats_good_about_generation_y.
[Accessed 10 December 2014].
[36] C. D. a. R. Whelan, "Cities Outpace Suburbs in Growth," The Wall Street Journal, 28 June
2012. [Online]. Available:
https://www.wsj.com/articles/SB10001424052702304830704577493032619987956.
[Accessed 10 December 2014].
[37] Deloitte, "Gen Y Takes the Road Less Traveled," The Wall Street Journal, 2 December
2014. [Online]. Available: https://deloitte.wsj.com/cio/2014/12/02/gen-y-takes-the-road-
less-traveled/. [Accessed 11 December 2014].
[38] R. Kartha, "The Evolution of a Supervisory Controller for a Split Parallel Plug-in Hybrid
Electric Vehicle," University of Waterloo, Waterloo, 2017.
[39] "Autonomie," Argonne National Laboratory, Argonne.
[40] A. V. T. Competition, "Non-Year-Specific Rules," EcoCAR3, Argonne, 2018.
[41] Redmon, J., Divvala, S., Girshick, R., Farhadi, A., "You Only Look Once: Unified, Real-
Time Object Detection," CVPR, 2016.
11 References
76
[42] A. M. Martinez, "PCA versus LDA," IEEE Transactions on Pattern Analysis and Machine
Intelligence, vol. 23, no. 2, pp. 228-233, 2001.
[43] Corinna Cortes, Vladimir Vapnik, "Support-vector networks," Machine Learning, vol. 20,
no. 3, pp. 273-297, 1995.
[44] J. B. MacQueen, "Some Methods for classification and Analysis of Multivariate
Observations.," Proceedings of 5th Berkeley Symposium on Mathematical Statistics and
Probability., vol. 1, pp. 281-297, 2009.
[45] V. P. I. a. M. J. Novák, "Mathematical principles of fuzzy logic," Dodrecht: Kluwer
Academic., 1999.
[46] "Dynamometer Drive Schedules," United States Environmental Protection Agency,
[Online]. Available: https://www.epa.gov/vehicle-and-fuel-emissions-
testing/dynamometer-drive-schedules. [Accessed 06 06 2018].
[47] FleetCarma, Waterloo, Ontario: FleetCarma, A GEOTAB Company.

77
Part IV - Appendices
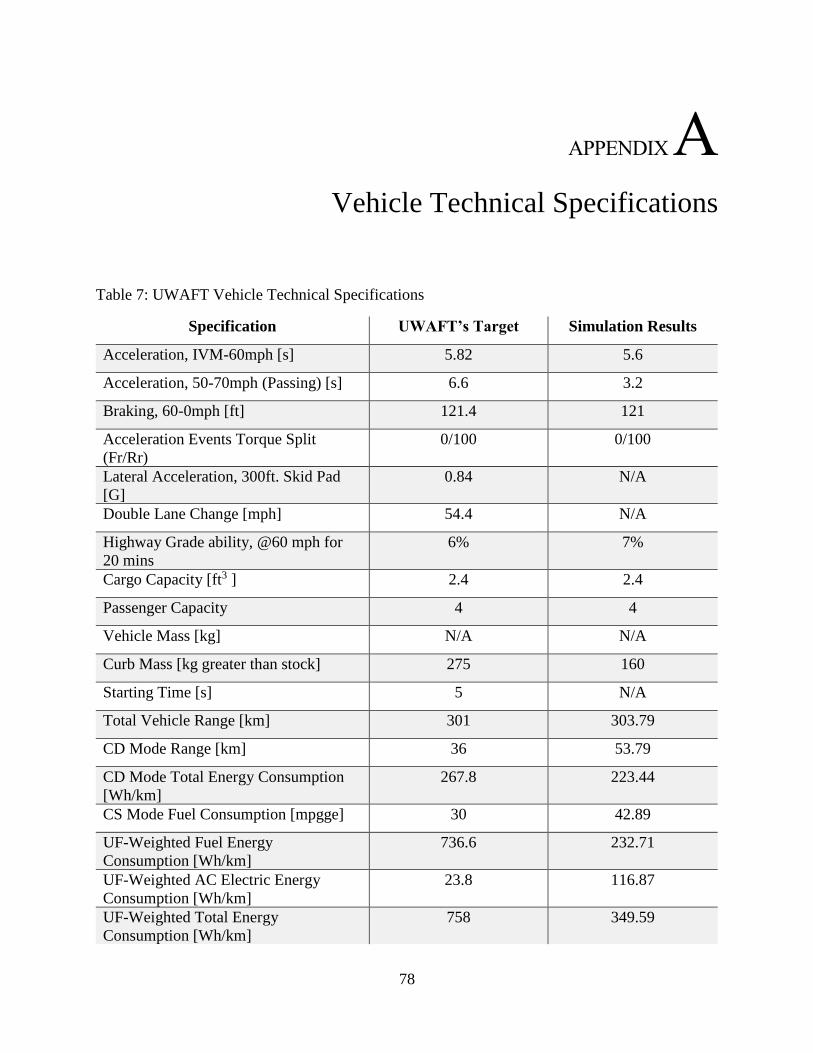
78
APPENDIX A
12.0 Vehicle Technical Specifications
Table 7: UWAFT Vehicle Technical Specifications
Specification UWAFT’s Target Simulation Results
Acceleration, IVM-60mph [s] 5.82 5.6
Acceleration, 50-70mph (Passing) [s] 6.6 3.2
Braking, 60-0mph [ft] 121.4 121
Acceleration Events Torque Split
(Fr/Rr)
0/100 0/100
Lateral Acceleration, 300ft. Skid Pad
[G]
0.84 N/A
Double Lane Change [mph] 54.4 N/A
Highway Grade ability, @60 mph for
20 mins
6% 7%
Cargo Capacity [ft3 ] 2.4 2.4
Passenger Capacity 4 4
Vehicle Mass [kg] N/A N/A
Curb Mass [kg greater than stock] 275 160
Starting Time [s] 5 N/A
Total Vehicle Range [km] 301 303.79
CD Mode Range [km] 36 53.79
CD Mode Total Energy Consumption
[Wh/km]
267.8 223.44
CS Mode Fuel Consumption [mpgge] 30 42.89
UF-Weighted Fuel Energy
Consumption [Wh/km]
736.6 232.71
UF-Weighted AC Electric Energy
Consumption [Wh/km]
23.8 116.87
UF-Weighted Total Energy
Consumption [Wh/km]
758 349.59

A Vehicle Technical Specifications
79
UF-Weighted WTW Petroleum Energy
Use [Wh PE/km]
621 67.92
UF-Weighted WTW Greenhouse Gas
Emissions [g GHG/km]
222.6 113.93
UF-Weighted Criteria Emissions [g/km] 2.64 0.402
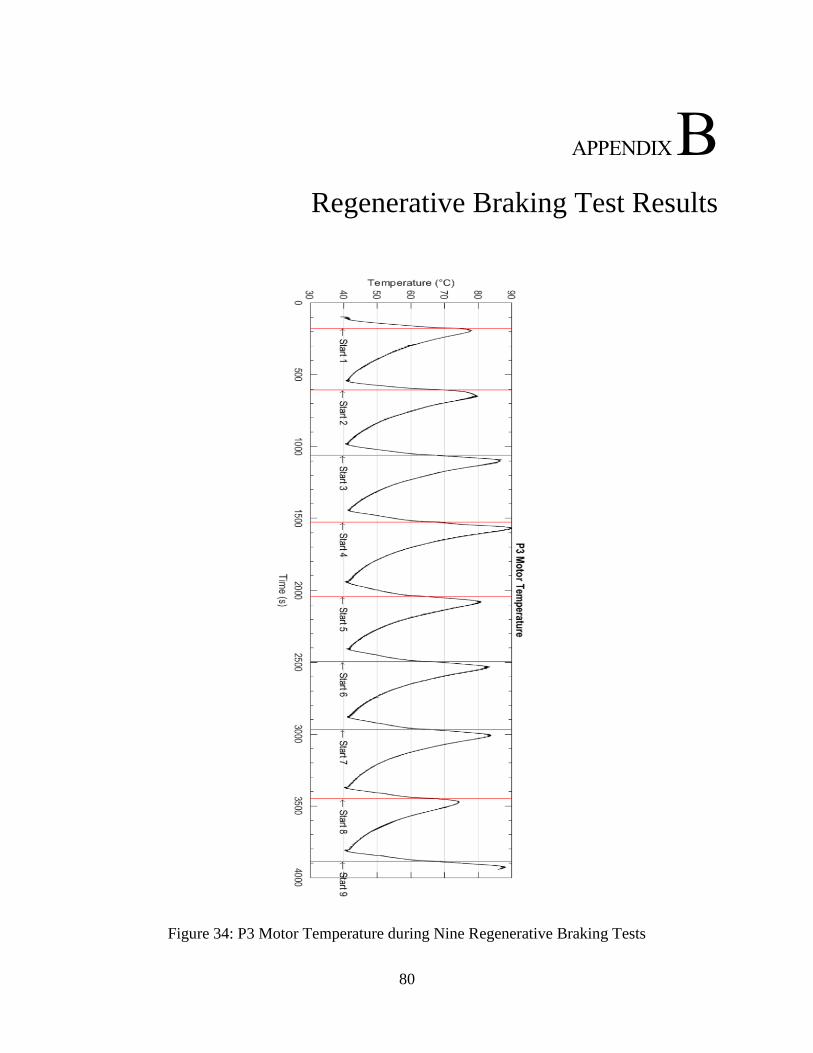
80
APPENDIX B
13.0 Regenerative Braking Test Results
Figure 34: P3 Motor Temperature during Nine Regenerative Braking Tests
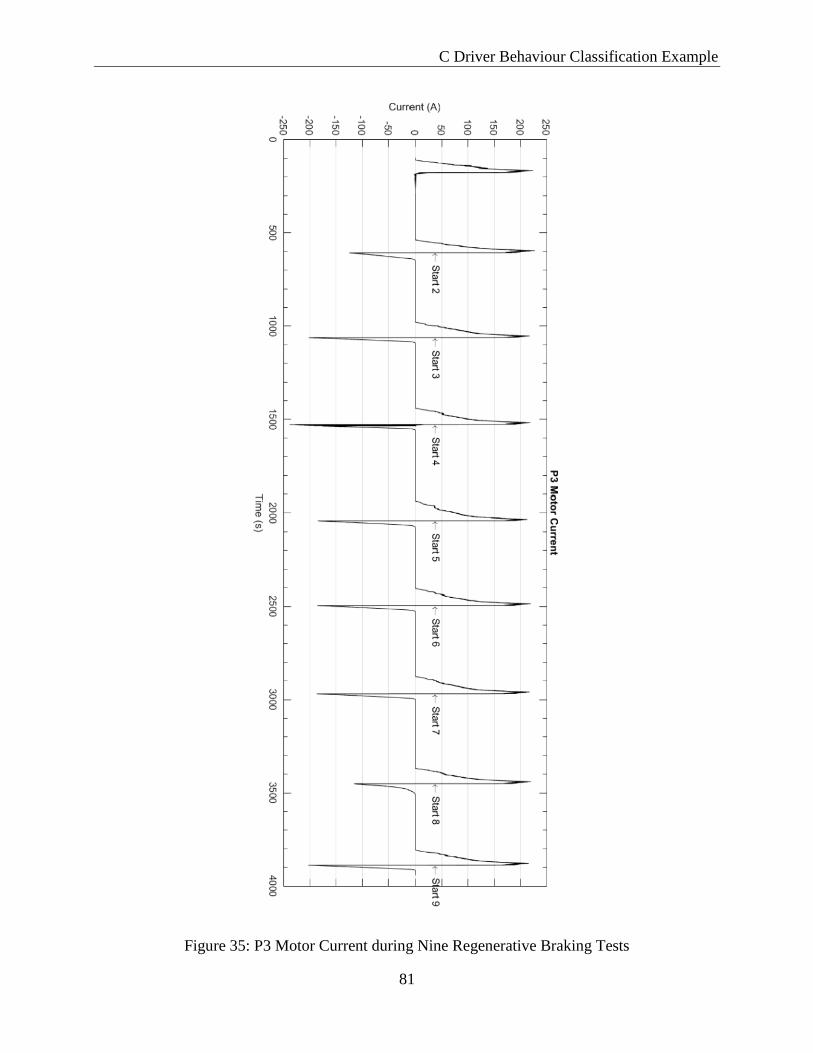
C Driver Behaviour Classification Example
81
Figure 35: P3 Motor Current during Nine Regenerative Braking Tests
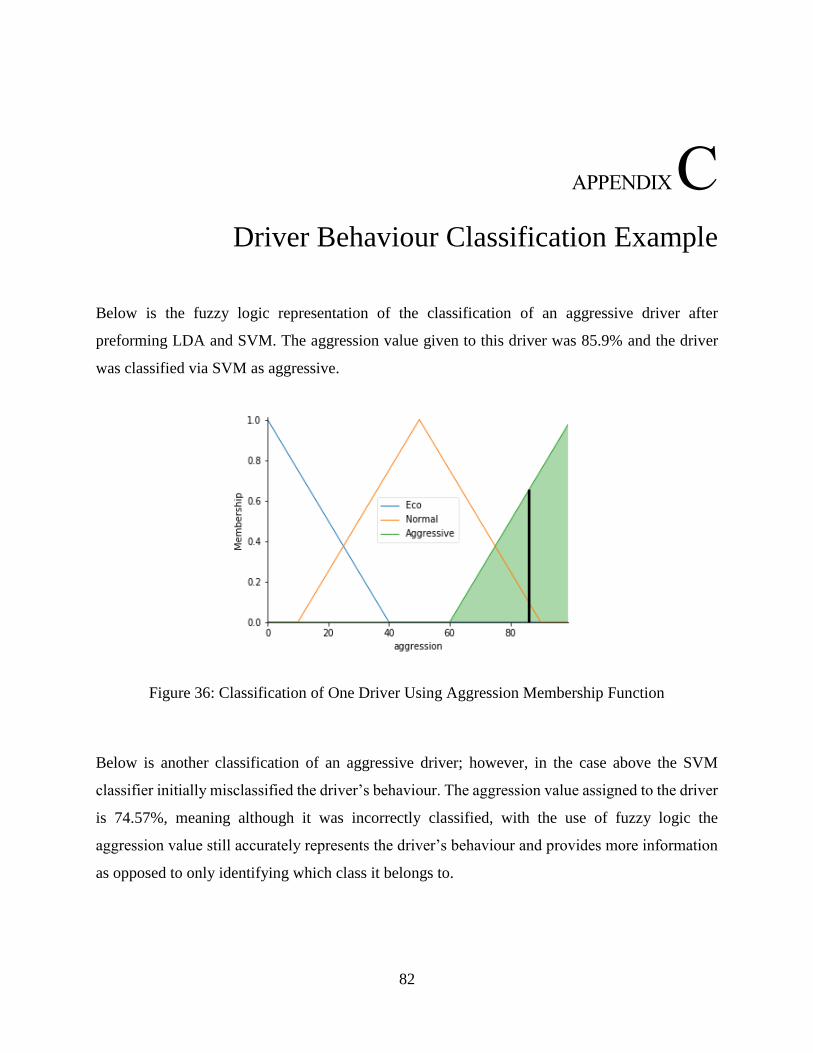
82
APPENDIX C
14.0 Driver Behaviour Classification Example
Below is the fuzzy logic representation of the classification of an aggressive driver after
preforming LDA and SVM. The aggression value given to this driver was 85.9% and the driver
was classified via SVM as aggressive.
Figure 36: Classification of One Driver Using Aggression Membership Function
Below is another classification of an aggressive driver; however, in the case above the SVM
classifier initially misclassified the driver’s behaviour. The aggression value assigned to the driver
is 74.57%, meaning although it was incorrectly classified, with the use of fuzzy logic the
aggression value still accurately represents the driver’s behaviour and provides more information
as opposed to only identifying which class it belongs to.
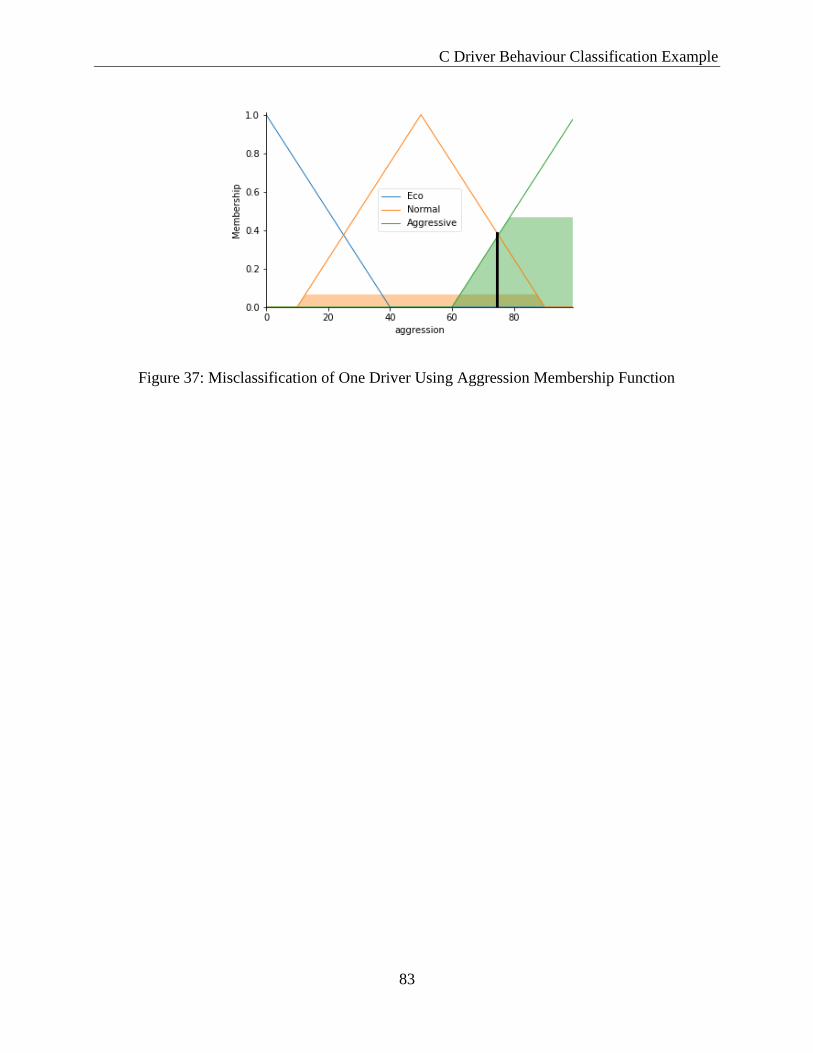
C Driver Behaviour Classification Example
83
Figure 37: Misclassification of One Driver Using Aggression Membership Function