
Automated decision making using Predictive Applications – Big Data Paris
Predictive Modeling of Hypoglycemia for Clinical Decision Support in Evaluating Outpatients with Diabetes Mellitus
Xiaochun Li, PhD,1 Shengsheng Yu, PhD,2 Zuoyi Zhang, PhD,3 Larry Radican, PhD, MPH,2
Jonathan Cummins, MS,3 Samuel S. Engel, MD,2 Kristy Iglay, PhD,2 Jon Duke, MD, MS,1,3
Jarod Baker, MS,3 Kimberly G. Brodovicz, DrPH,2
Ramachandra G. Naik, MD, DM,2 Jeremy Leventhal, MS,3 Arnaub K. Chatterjee, MHA, MPA,2
Swapnil Rajpathak, MBBS, DrPH,2 Michael Weiner, MD, MPH,1,3,4
1Indiana University, Indianapolis, IN
2Merck & Co., Inc., Kenilworth, NJ
3Regenstrief Institute, Inc., Indianapolis, IN
4Center for Health Information and Communication, Department of Veterans Affairs, Veterans Health Administration, Health Services Research and Development Service CIN 13-416, Richard L. Roudebush VA Medical Center, Indianapolis, IN
Corresponding author:
Xiaochun Li, Ph.D. <mailto:[email protected]> Department of Biostatistics 410 West Tenth Street, suite 3000 Indianapolis, Indiana 46202 U.S.A. Ph +1 317-274-2661
Key words: Hypoglycemia; Diabetes Mellitus; Predictive Value of Tests
_______________________________________________
This is the author's manuscript of the article published in final edited form as:
Li, X., Yu, S., Zhang, Z., Radican, L., Cummins, J., Engel, S. S., Iglay, K., Duke, J., Baker, J., Brodovicz, K. G., Naik, R. G., Leventhal, J., Chatterjee, A. K., Rajpathak, S., & Weiner, M. (2019). Predictive modeling of hypoglycemia for clinical decision support in evaluating outpatients with diabetes mellitus. Current Medical Research and Opinion, 35(11), 1885–1891. https://doi.org/10.1080/03007995.2019.1636016

ABSTRACT
Objective. Hypoglycemia occurs in 20% to 60% of patients with diabetes mellitus. Identifying
at-risk patients can facilitate interventions to lower risk. We sought to develop a hypoglycemia
prediction model.
Methods. In this retrospective cohort study, urban adults prescribed a diabetes drug between
2004 and 2013 were identified. Demographic and clinical data were extracted from an electronic
medical record (EMR). Laboratory tests, diagnostic codes, and natural language processing
(NLP) identified hypoglycemia. We compared multiple logistic regression, classification and
regression trees (CART), and Random Forest. Models were evaluated on an independent test set
or through cross-validation.
Results. 38,780 patients had mean age 57 years; 56% were female, 40% African-American, and
39% uninsured. Hypoglycemia occurred in 8,128 (539 identified only by NLP). In logistic
regression, factors positively associated with hypoglycemia included infection, non-long-acting
insulin, dementia, and recent hypoglycemia. Negatively associated factors included long-acting
insulin plus sulfonylurea, and age 75 or older. Models' area under curve was similar (logistic
regression, 89%; CART, 88%; Random Forest, 90%, with 10-fold cross-validation).
Conclusions. NLP improved identification of hypoglycemia. Non-long-acting insulin was an
important risk factor. Decreased risk with age may reflect treatment or diminished awareness of
HG. More complex models did not improve prediction.

1. INTRODUCTION Diabetes mellitus is one of the most common non-communicable diseases worldwide and a
major cause of morbidity and mortality [1]. An estimated 422 million people had diabetes in
2014, and diabetes is predicted to become the seventh leading cause of death in the world by the
year 2030 [2]. The number of people with type 2 diabetes mellitus (T2DM), the most common
form of diabetes, is increasing in every country [1]. In the United States, the incidence of
diabetes nearly tripled between 1990 and 2010 [3], and 1.7 million new cases were diagnosed in
adults in 2012 [4]. Among Americans 65 or more years of age, the prevalence is 26% [4].
Hypoglycemia (HG) is recognized as the major limiting factor in optimal glycemic management
for patients with diabetes [5 6]. Substantial negative effects on cardiovascular safety and quality
of life have been noted [7-12]. It also increases economic costs, which result from healthcare
resource utilization to manage HG and its consequences, as well as from patient absenteeism and
lost productivity [13]. Many patients with diabetes, especially those with recurring episodes of
HG, are unaware when HG occurs, despite the risk of serious adverse events including coma and
death. Identifying patients at especially high risk of HG may provide an opportunity to intervene
and reduce the incidence of events. Using electronic medical records and computer-based
algorithms to identify HG is challenging, because diagnostic codes for HG are not consistently
used, and are subject to underreporting. Signs or symptoms of specific episodes of HG,
especially if not severe, might be recorded only in an unstructured, narrative (text-based) format.
In this study, based on existing literature about HG risk, we developed a multivariable HG risk
model for use in clinical practice by physicians and other health care professionals. Our goal in
this analysis was to compare three popular models of prediction, applying them to HG using data

routinely collected in an electronic health record system, and decide on one for implementation
of clinical decision support. This would be the first HG model that combines nearly all known
risk factors among U.S. outpatients.

2. METHODS
This retrospective study was approved, with a waiver of informed consent, by the Indiana
University Institutional Review Board, protocol number 1402826879.
2.1 design
In this retrospective cohort study, the study period was defined to be 01 January 2004 to 31
December 2013. Eskenazi Health is an urban safety-net medical institution [14] in Indianapolis,
Indiana, U.S.A. In 2012, Eskenazi had 1,081 physicians on staff and serviced 950,592 outpatient
visits, including 234,637 community health center visits. The payer mix was 38% uninsured,
32% Medicaid, 19% Medicare, 8% commercial, and 3% other. The Indiana Network for Patient
Care is a statewide network of electronic medical data, representing 25,000 physicians, 106
hospitals, and 110 clinics, surgery centers, and other healthcare organizations, including
Eskenazi Health. The network includes information "from encounters covering over 90% of care
provided at hospitals in the Indianapolis area", including abstracts, text reports, discharge
summaries, operative notes, pathology reports, electrocardiogram readings, radiology images,
and medication records [15 16] The study cohort consisted of patients who received outpatient
care at Eskenazi during the study period, as identified through computer-based query of the
network. The study targeted electronic medical data in retrospective analysis; patients were not
contacted. Clinical data about the cohort were extracted from the Regenstrief Medical Record
System, an electronic health record system used by Eskenazi Health [17].
HG events were identified among the cohort. The index date was defined as the first date of HG
during the study period that occurred at least two years after the patient's first encounter between
January 2002 and December 2011. For patients in this cohort who did not experience a HG event
during the study period, the index date was a randomly selected date of an actual visit during the
study period. The baseline period was defined as the two-year period prior to the index date.
Eligible patients were selected from the cohort if they met the following inclusion criteria: at
least 21 years of age at the index date, prescribed or dispensed a drug for diabetes mellitus during
the study period, and had at least two clinical encounters on separate dates during the baseline
period. Drugs for diabetes were acarbose, acetohexamide, alogliptin, canagliflozin,
chlorpropamide, colesevelam, dapagliflozin, exenatide, glibenclamide, glimepiride, glipizide,
glyburide, insulin, linagliptin, liraglutide, meglitol, metformin, nateglinide, pioglitazone,
pramlintide, repaglinide, rosiglitazone, saxagliptin, sitagliptin, tolazamide, and voglibose. We
did not attempt to identify a subgroup of patients with type 1 diabetes since administrative data
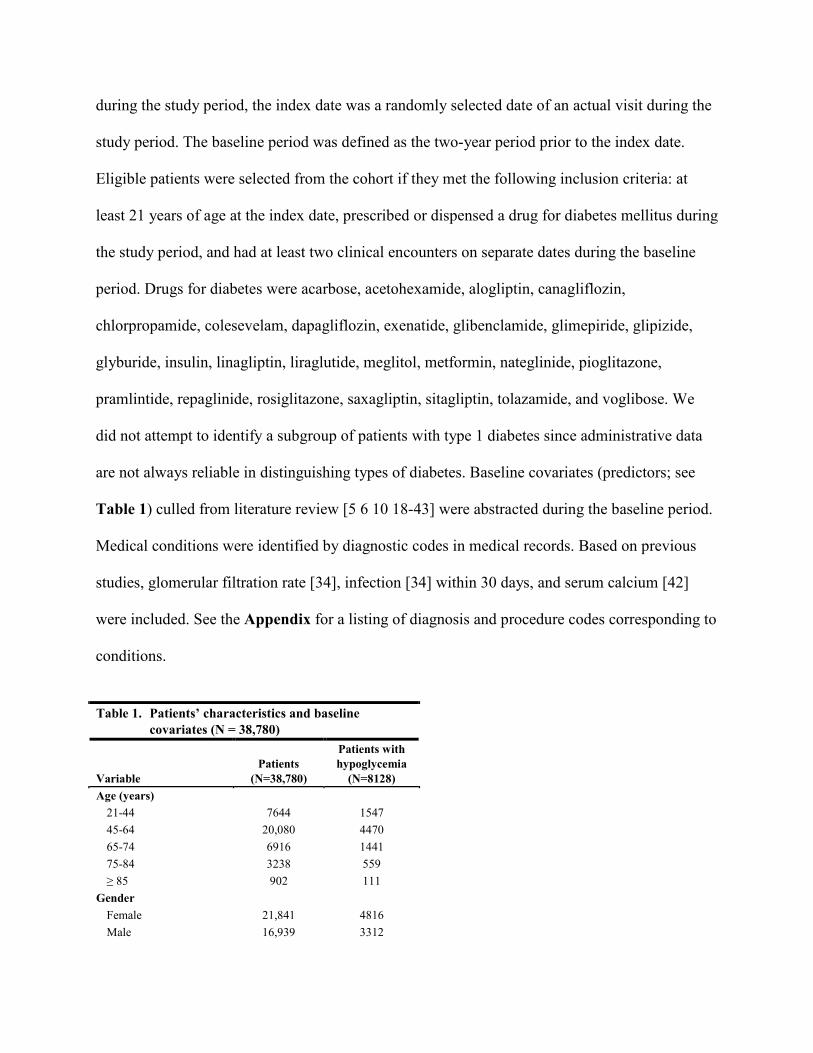
are not always reliable in distinguishing types of diabetes. Baseline covariates (predictors; see
Table 1) culled from literature review [5 6 10 18-43] were abstracted during the baseline period.
Medical conditions were identified by diagnostic codes in medical records. Based on previous
studies, glomerular filtration rate [34], infection [34] within 30 days, and serum calcium [42]
were included. See the Appendix for a listing of diagnosis and procedure codes corresponding to
conditions.
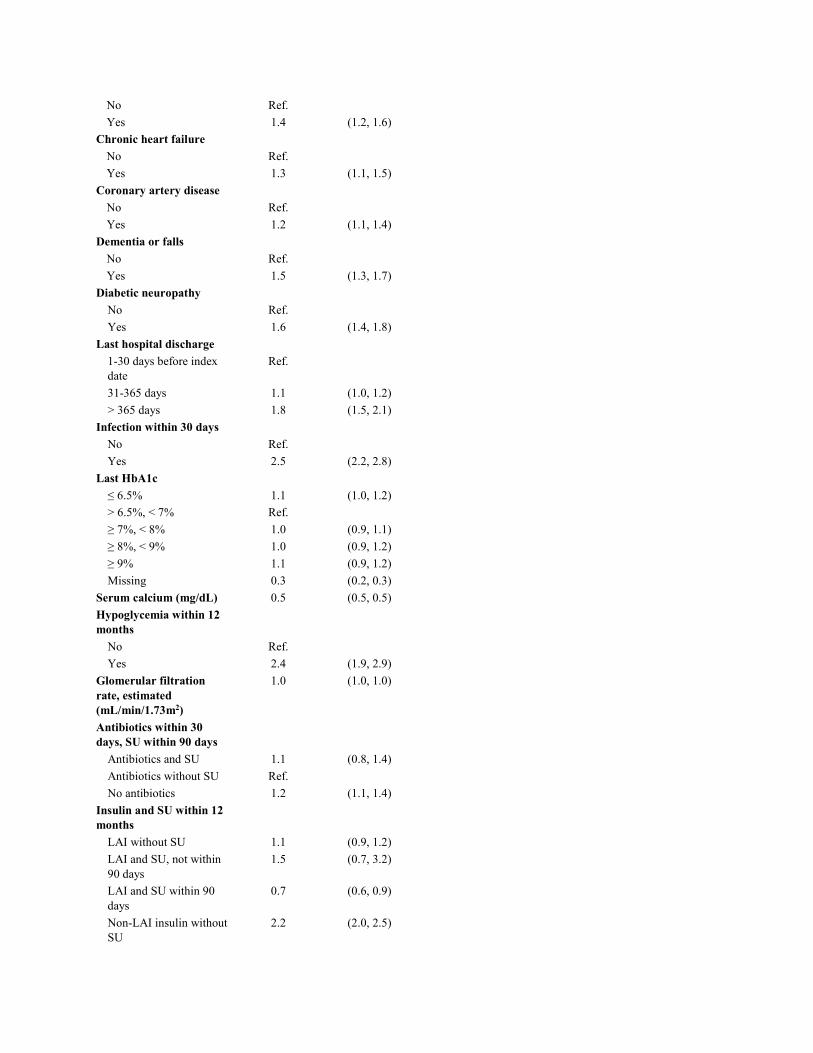
Table 1. Patients’ characteristics and baseline
covariates (N = 38,780)
Variable Patients
(N=38,780)
Patients with hypoglycemia
(N=8128) Age (years)
21-44 7644 1547 45-64 20,080 4470 65-74 6916 1441 75-84 3238 559 ≥ 85 902 111
Gender Female 21,841 4816 Male 16,939 3312
Race White 18,355 2991 Black 15,510 4439 Spanish 1031 162 Native American 934 218 Unknown 2950 318
Insurance Medicaid 7196 3437 Insured without Medicaid
16,571 2865
Uninsured 15,013 1826 BMI (kg/m2) 35.7 (9.8) 35.1 (10.0) Alcohol
No 37,919 7703 Yes 861 425
Autonomic failure No 38,743 8114 Yes 37 14
Cancer No 37,729 7587 Yes 1051 541
Chronic heart failure No 37,198 7088 Yes 1582 1040
Coronary artery disease No 36,759 6999 Yes 2021 1129
Dementia or falls No 37,527 7438 Yes 1253 690
Diabetic neuropathy No 37,366 7291 Yes 1414 837
Last hospital discharge 1-30 days before index date
35,092 6133
31-365 days 2858 1470 > 365 days 830 525
Infection within 30 days No 37,395 7284 Yes 1385 844
Last HbA1c ≤ 6.5% 5321 2354 > 6.5%, < 7% 1840 793 ≥ 7%, < 8% 3155 1369 ≥ 8%, < 9% 1773 793 ≥ 9% 3977 1789 Missing 22,714 1030
Serum calcium (mg/dL) 9.4 (0.7) 9.2 (0.8)

Hypoglycemia within 12 months
No 38,121 7632 Yes 659 496
Glomerular filtration rate, estimated (mL/min/1.73m2)
84.7(31.7) 79.2(35.9)
Antibiotics within 30 days, SU within 90 days
Antibiotics and SU 765 163 Antibiotics without SU 2602 366 No antibiotics 35,413 7599
Insulin and SU within 12 months
LAI without SU 4720 726 LAI and SU, not within 90 days
66 11
LAI and SU within 90 days
1248 144
Non-LAI insulin without SU
3055 1260
Non-LAI insulin and SU, not within 90 days
47 20
Non-LAI insulin and SU within 90 days
615 264
SU without insulin 8727 2079 No insulin, no SU 20,302 3624
LAI = long-acting insulin, SU = sulfonylurea Note: a two-year baseline window prior to the index date is used for most risk factors; a one-year window for prior episodes of hypoglycemia was used, and a 30-day window for infections and antibiotic use.
2.2 HG definition
HG was defined by any of the following criteria.
• Plasma or point-of-care glucose value of at least 5 mg/dL, and less than 70 mg/dL,
documented in the medical record. A minimum, positive glucose value was included to
avoid spurious values of zero.
• International Classification of Diseases-9-Clinical Modification (ICD) code 251.1 or
251.2.

• ICD code 250.8 without any of the following codes [44]: 259.8, 272.7, 681.xx, 682.x,
686.9, 707.1x, 707.2x, 707.8, 707.9, 709.3, 730.0x, 730.1x, 730.2x, 731.8.
• Text note indicating HG, including a glucose value.
To use NLP to evaluate text notes, we used a combination of Unstructured Information
Management Architecture [45], a sentence tokenizer from the Open NLP project [46], and a
regular expression system. This identified clinical reports mentioning a "blood sugar word"
followed within five words by what could be a low blood-sugar value represented by a number in
the range 10 to 69. We filtered (dropped) text representing dates and times, units of weight,
strings with leading "if", and strings referencing proteins, in case protein numbers were
documented instead of glucose values. The regular expression for a "blood sugar word" was
"(?i)(^|\\b)(glucose|glu(?!cotrol)|gluc(?!otrol)|sugars|sugar|bs|bg|accucheck|accuchek|glucometer)
.*(,|\\.|;|$)".
2.3 predictive modeling approaches
We considered three predictive modeling approaches: conventional multiple logistic regression
(LR), classification and regression trees (CART) [47], and Random Forest (RF) [48].
Logistic Regression
In LR, the presence or absence of HG (dependent variable) was modelled with all baseline
covariates in the model as main effects (independent variables). Missing values of continuous
variables were handled by imputing the mean of observed data. Missing values of categorical
variables except demographics were set to zero/unknown or without having the condition.
Forward stepwise variable selection was used for including predictors in the model, using an
entry criterion of alpha at 0.10 and a stay criterion of alpha at 0.05. Since the goal was prediction
rather than explanation of the HG mechanism, we used a data-driven approach and did not force

specific variables into the model. LR is commonly used in medical research. It requires the
assumption that the relationship between the outcome and the predicting covariates is linear.
Classification and Regression Trees
Tree-based methods offer many appealing advantages over LR, a parametric modeling approach.
They require no specification of the relationship of the covariates with the outcome, and
approximate the relationship adaptively, driven by data. Trees can capture complex interactions
among covariates, and can handle highly correlated covariates. The rank-based nature of binary
splits in covariates also makes trees robust to outliers and invariant to monotonic transformations
of the covariates. For example, the same predictions can be obtained whether age, log(age), or
age2 is used. Trees also handle irrelevant covariates well; if a covariate does not predict the
response, a tree will not include it.
From the practical perspective, a single tree enables a visual inspection of the risk of an outcome
based on patients’ characteristics and baseline variables, such as medication use, diagnoses, and
laboratory results. Hence, it provides clinical interpretability and, if parsimonious, may be ideal
for a clinical decision support tool. Trees, however, require large sample sizes for stability. The
‘right-sized tree’ was selected by ten-fold cross-validation.
Random Forests
The method of Random Forests generates an ensemble of trees. Tree-based ensembles combine
the predictions of many different trees to give an aggregated prediction, a procedure of model
averaging. The advantage of a tree ensemble over a single tree is that it maintains the low bias of
a single tree but with a much lower variance, achieved through averaging. For classification
trees, using such an average amounts to using the most frequently predicted class, known as the
‘majority vote’. Ensembles can give improved prediction accuracy over individual trees. An
intuitive idea behind the improved accuracy of ensemble classifiers is that if the individual
classifiers tend to make prediction errors in different regions of predictor space, then the
incorrect predictions may be overwhelmed by the correct ones.
One disadvantage of tree ensembles compared to a single tree is that ensembles can be difficult
to interpret, because the average of trees is not a tree. Due to the intended use of our model in
clinical practice, we placed significant value on accuracy of prediction.
Evaluation of the Three Approaches
The data set was randomly split into a training data set and a test data set in the ratio of 2:1. All
three modeling approaches were applied to the training data set and tested on the test data set.
Each model was fitted on the training set, and then was applied to the test set to predict HG
events. The area under the receiver operating characteristic (ROC) curve, i.e., AUC or c-statistic,
is a measure of the overall performance of a model, regardless of cutoffs. We calculated the
AUC on the test set. We also estimated AUC through ten-fold cross-validation using the entire
data set for the three approaches, as a consistency assurance in model selection.
2.4 analysis
Baseline covariates were summarized using percentages if categorical, or means with standard
deviations if continuous. Multiple LR modeling was performed using SAS, version 9.4 (SAS
Institute; Cary, NC); classification trees and random forests were built using R, version 3.2.0
<http://www.R-project.org/>.

3. RESULTS
The cohort had 38,780 patients with the following characteristics: mean age of 57 years, 56%
female, 47% white, 40% African-American, 19% with Medicaid, and 39% uninsured (see Table
1). HG was identified in 8,128 (21%) of them; a glucose value of less than 54 mg/dL was found
in ________. Of the 8,128 with HG, NLP identified HG in 3,751, with 539 identified only by
NLP. The median, mean, and standard deviation for number of outpatient visits in the previous
year were 8, 10, and 9, respectively.
Table 2. Logistic regression of hypoglycemia
(N = 38,780)
Variable Odds ratio
(OR) Confidence
interval of OR Age (years)
21-44 1.4 (1.3, 1.5) 45-64 Ref. 65-74 0.9 (0.9, 1.0) 75-84 0.8 (0.7, 0.9) ≥ 85 0.6 (0.5, 0.8)
Gender Female 1.1 (1.0, 1.2) Male Ref.
Race White Ref. Black 1.8 (1.7, 2.0) Spanish 0.7 (0.5, 0.8) Native American 0.9 (0.8, 1.1) Unknown 0.8 (0.7, 0.9)
Insurance Medicaid 1.5 (1.4, 1.6) Insured without Medicaid
Ref.
Uninsured 1.0 (0.9, 1.1) BMI (kg/m2) 1.0 (1.0, 1.0) Alcohol
No Ref. Yes 1.6 (1.4, 1.9)
Autonomic failure No 4.1 (1.8, 9.4) Yes Ref.
Cancer
No Ref. Yes 1.4 (1.2, 1.6)
Chronic heart failure No Ref. Yes 1.3 (1.1, 1.5)
Coronary artery disease No Ref. Yes 1.2 (1.1, 1.4)
Dementia or falls No Ref. Yes 1.5 (1.3, 1.7)
Diabetic neuropathy No Ref. Yes 1.6 (1.4, 1.8)
Last hospital discharge 1-30 days before index date
Ref.
31-365 days 1.1 (1.0, 1.2) > 365 days 1.8 (1.5, 2.1)
Infection within 30 days No Ref. Yes 2.5 (2.2, 2.8)
Last HbA1c ≤ 6.5% 1.1 (1.0, 1.2) > 6.5%, < 7% Ref. ≥ 7%, < 8% 1.0 (0.9, 1.1) ≥ 8%, < 9% 1.0 (0.9, 1.2) ≥ 9% 1.1 (0.9, 1.2) Missing 0.3 (0.2, 0.3)
Serum calcium (mg/dL) 0.5 (0.5, 0.5) Hypoglycemia within 12 months
No Ref. Yes 2.4 (1.9, 2.9)
Glomerular filtration rate, estimated (mL/min/1.73m2)
1.0 (1.0, 1.0)
Antibiotics within 30 days, SU within 90 days
Antibiotics and SU 1.1 (0.8, 1.4) Antibiotics without SU Ref. No antibiotics 1.2 (1.1, 1.4)
Insulin and SU within 12 months
LAI without SU 1.1 (0.9, 1.2) LAI and SU, not within 90 days
1.5 (0.7, 3.2)
LAI and SU within 90 days
0.7 (0.6, 0.9)
Non-LAI insulin without SU
2.2 (2.0, 2.5)

Non-LAI insulin and SU, not within 90 days
1.3 (0.6, 2.7)
Non-LAI insulin and SU within 90 days
1.8 (1.5, 2.2)
SU without insulin 1.0 (1.0, 1.1) No insulin, no SU Ref.
LAI = long-acting insulin, SU = sulfonylurea Note: logistic regression was run on the entire cohort with missing data imputed by mean of observed data.
In LR, factors positively associated with HG included the following (Table 2): infection within
30 days prior to event (OR 2.5; 95% CI 2.2, 2.8), insulin other than long-acting insulin (without
SU drug, 2.2; 2.0, 2.5; with SU within 90 days, 1.8; 1.5, 2.2; vs. non-insulin and non-SU),
previous hypoglycemia within 12 months (2.4; 1.9, 2.9), African-American (1.8; 1.7, 2.0; vs.
white), diabetic neuropathy (1.6; 1.4, 1.8), Medicaid (1.5; 1.4, 1.6), alcohol consumption (1.6;
1.4, 1.9), chronic heart failure (1.3; 1.1, 1.5), no antibiotics within 30 days (1.2; 1.1, 1.4), age 21
to 44 (1.4; 1.3, 1.5; vs. age 45 to 64), and dementia or falls (1.5; 1.3, 1.7). Factors negatively
associated with HG included serum calcium mg/dL (OR 0.5; 95% CI 0.5, 0.5), age 85 years or
more (0.6; 0.5, 0.8; vs. age 45 to 64), long-acting insulin plus an SU within 90 days (0.7; 0.6,
0.9), Hispanic (0.7; 0.5, 0.8), and age 75 to 84 years (0.8; 0.7, 0.9). The addition of NLP changed
the statistical significance of coronary artery disease in the LR: the confidence interval was 1.0 to
1.3 without NLP, and 1.1 to 1.4 with NLP.
Performance was similar across the three models: using the ten-fold cross validation, Random
Forest has a mean AUC 90%, LR has a mean AUC 89%, and CART a mean AUC 88%. The
AUCs of the three models when applied to the held-out independent test set, in the 2:1 random
split of training and test sets, are 90%, 89% and 87%, almost identical to the above from the ten-
fold cross validation.

4. DISCUSSION
We developed a new predictive model of HG risk among outpatients with diabetes, comparing
three statistical methods. We observed that LR, CART, and Random Forest have similar
performance in our data set. The lack of advantage of tree-based methods such as CART and
Random Forest over LR could be due to the following: all of our covariates are binary or
categorical, except glomerular filtration rate, body mass index, and serum calcium; or possible
lack of interaction between covariates. Adaptive modeling of non-linear relationships between
continuous predictors and an outcome, and adaptive modeling of the interactions among
predictors, are the two primary advantages of tree-based methods in comparison with
conventional LR and, in general, all parametric regressions. If the linearity assumption is met
and there are no interactions between covariates, tree-based methods are at a disadvantage
compared to LR because they afford flexibility at the price of efficiency (i.e., having higher
variance), especially when flexibility may not be needed.
From the standpoint of clinical care, the implications of this study are important. In developing a
HG predictive risk model for clinical decision support, a complex predictive model does not
need to be built for electronic health record data where most variables are binary or categorical.
Instead, a conventional multiple LR model can be successfully employed. The LR model is
commonly used in medical research and its coefficients are interpretable as odds ratios when
exponentiated—a useful feature for clinicians and patients who seek to understand the relevance
and magnitude of each factor. Furthermore, a LR model has the additional benefit of being
straightforward to program into a risk calculator, without needing specialized software.

Despite the advancement in pharmaceutical therapy, HG remains one of the biggest complicating
factors in diabetes management. Although previous work over decades has identified many risk
factors for HG, this is the first model that combines nearly all known risk factors among U.S.
outpatients in a primary-care setting, which may afford opportunities to change long-term
practice and introduce educational or self-management strategies for patients, to lower the risk of
HG. Several other studies that identified risk factors for HG have not used statistical models
[49], or focused primarily on subgroups of patients with diabetes, such patients with Medicaid
[50], hospitalization [34 38], additional cardiovascular risk factors [51], self-reported HG [35],
severe HG [40], symptomatic HG [25], and use of only injectable drugs for diabetes [20]. One of
our own previous studies examined the association between HG, inpatient death, and inpatient
length of stay among patients treated with insulin [52]. Our present study is designed to use
electronic health record data in a way that targets all adults with diabetes and HG—except
perhaps the mildest cases of HG, when glucose levels might not have been measured—because
electronic health record systems create the capacity for decision support, and intervention is
warranted in all instances of HG in any patient with diabetes, regardless of type, severity, and
symptoms.
NLP usefully complemented diagnostic codes and laboratory data in identifying HG, uniquely
identifying 6.6% (539/8128) of cases of HG. Although the percentage is modest, each case of
prevented HG can improve quality of life, morbidity, and costs. Our study did not examine
multiplicity of HG events per patient, but this, too, would be important. The importance of NLP
in this outpatient context is not surprising, because many cases of HG occur when patients are at
home or otherwise away from the medical institution, without a laboratory test to confirm the
condition. We are aware of no previous work that incorporates NLP into a statistical model of

HG. We did not have direct access to glucometer data in this study, but some glucometers have
capabilities to transfer their stored data electronically, paving the way for improved
communication with healthcare providers, and control of diabetes.
Our study confirmed many risk factors for HG while elucidating more detail about their
magnitude in a multivariate model. Insulin other than long-acting insulin was an important risk
factor without a sulfonylurea drug, or with a sulfonylurea drug within 90 days. Although some
newer oral drugs for diabetes lead to HG less frequently, therapeutic inertia and other factors
have led to a slow transition to newer drugs for many patients. In light of newer and possibly
safer drugs, weighing the potential benefits and harms of sulfonylurea drugs is increasingly
important.
We were surprised to find that the oldest ages (age ≥ 75 years) were at a decreased risk for HG
events, though Duran-Nah et al. reported this, too [25]. The finding may reflect diminished
awareness of HG, greater attention to medical management (i.e., less aggressive management as
a result of attention to clinical guidelines for older patients), or other unmeasured factors in this
population.
Since we targeted patients in a safety-net institution, the results might not be generalizable to
other populations. We used diagnostic (ICD) codes to identify many of the covariate conditions,
but these codes have imperfect sensitivity and specificity. Nonetheless, their usage reflects real-
world application that may transfer to other settings. We would not have captured the mildest
cases of HG, since they might not be documented anywhere in the medical record. In this study,
any HG, rather than severity of HG, was the outcome of interest due to the need for clinical

intervention for HG. We did not examine C-peptide levels, duration of diabetes, use of home or
continuous glucometry, or frequency of glucose measurement, any of which may be associated
with outcomes.
In summary, starting from a large set of known HG risk factors, we created a predictive risk
model for HG using conventional LR and found that more complex models did not improve
prediction appreciably. Given its frequent use in the medical field and its interpretability, LR is a
feasible and potentially useful method for developing a clinical decision support tool for
identifying HG risk in patients with type 2 diabetes. Clinicians could use these findings to
identify and address important modifiable risk factors. Such a tool could be used by electronic
health record systems, to automate the retrieval and presentation of risk factors for clinicians
during medical encounters with patients with diabetes. This may lead to immediate counseling of
patients or changes to medical practices in pursuit of addressing the risk factors.
TRANSPARENCY
Funding. Funding for this research was provided by Merck & Co., Inc., Kenilworth, NJ
USA. Authors affiliated with Merck assisted in designing the study, interpreting findings, and
reviewing and editing the manuscript.
Relationships. Shengsheng Yu, Larry Radican, Samuel S. Engel, Kristy Iglay, Kimberly G.
Brodovicz, Ramachandra G. Naik, Arnaub K. Chatterjee, and Swapnil Rajpathak are or were
full-time employees of Merck & Co. Inc., Kenilworth, NJ, USA at the time of the analysis and
may own stock or hold stock options in the company. The following co-authors subsequently
moved to other institutions: Larry Radican (Peloton Advantage, Parsippany, NJ), Ramachandra
G. Naik (SUNY Upstate Medical University, Syracuse, NY), Kimberly G. Brodovicz
(Boehringer Ingelheim Pharmaceuticals, Inc., Ridgefield, CT), and Shengsheng Yu (Abbott
Diabetes Care, Alameda, CA). Xiaochun Li, Zuoyi Zhang, Jonathan Cummins, Jon Duke, Jarod
Baker, Jeremy Leventhal, and Michael Weiner received research support from Merck & Co. Inc.,
Kenilworth, NJ, USA for the conduct of this study.
Authors’ contributions. XL, SY, LR, SE, JD, KB, RN, JL, AC, SR, and MW designed the
study. JC provided computer programming related to the predictive modeling. XL and ZZ
conducted the analysis. All authors interpreted the findings. XL drafted the manuscript. All
authors reviewed or revised the manuscript, approved the manuscript, and accepted
accountability for the work.
Acknowledgements. We thank Rachel Gruber for assistance in formatting and meeting
publication requirements. We thank Annaswamy Raji, MD, MMSc for feedback. Dr. Weiner is
Chief of Health Services Research and Development at the Richard L. Roudebush Veterans

Affairs Medical Center in Indianapolis, Indiana. The views expressed in this article are those of
the authors and do not necessarily represent the views of Merck & Co., Inc. or the U.S.
Department of Veterans Affairs.

REFERENCES
1. International Diabetes Federation. IDF Diabetes Atlas, 6th edn. Brussels, Belgium: International Diabetes Federation, 2013.
2. World Health Organization. Diabetes fact sheet, March 2016. Web. Accessed May 08. http://www.who.int/mediacentre/factsheets/fs312/en/.
3. Centers for Disease Control and Prevention. National diabetes fact sheet: national estimates and general information on diabetes and prediabetes in the United States, 2011. Atlanta, GA: U.S. Department of Health and Human Services, Centers for Disease Control and Prevention, 2011.
4. Centers for Disease Control and Prevention. National Diabetes Statistics Report, 2014. Atlanta, GA: U.S. Department of Health and Human Services, Centers for Disease Control and Prevention, 2014.
5. Briscoe VJ, Davis SN. Hypoglycemia in type 1 and type 2 diabetes: physiology, pathophysiology, and management. Clinical Diabetes 2006;24(3):115-24
6. Zammitt NN, Frier BM. Hypoglycemia in Type 2 Diabetes Pathophysiology, frequency, and effects of different treatment modalities. Diabetes Care 2005;28(12):2948-61
7. Vexiau P, Mavros P, Krishnarajah G, Lyu R, Yin D. Hypoglycaemia in patients with type 2 diabetes treated with a combination of metformin and sulphonylurea therapy in France. Diabetes, obesity and metabolism 2008;10(s1):16-24
8. Shiu AT, Thompson DR, Wong RY. Quality of life and its predictors among Hong Kong Chinese patients with diabetes. Journal of clinical nursing 2008;17(5a):125-32
9. Goto A, Arah OA, Goto M, Terauchi Y, Noda M. Severe hypoglycaemia and cardiovascular disease: systematic review and meta-analysis with bias analysis. BMJ: British Medical Journal 2013;347
10. Hsu P-F, Sung S-H, Cheng H-M, et al. Association of Clinical Symptomatic Hypoglycemia With Cardiovascular Events and Total Mortality in Type 2 Diabetes A nationwide population-based study. Diabetes care 2013;36(4):894-900
11. Lundkvist J, Berne C, Bolinder B, Jönsson L. The economic and quality of life impact of hypoglycemia. The European Journal of Health Economics 2005;6(3):197-202
12. Davis RE, Morrissey M, Peters JR, Wittrup-Jensen K, Kennedy-Martin T, Currie CJ. Impact of hypoglycaemia on quality of life and productivity in type 1 and type 2 diabetes. Current Medical Research and Opinion® 2005;21(9):1477-83
13. Jönsson L, Bolinder B, Lundkvist J. Cost of hypoglycemia in patients with Type 2 diabetes in Sweden. Value in health 2006;9(3):193-98
14. Institute of Medicine Committee on the Changing Market, Managed Care, and the Future Viability of Safety Net Providers. America's health care safety net: intact but endangered. Washington, DC: National Academy Press, 2000.
15. Indiana Health Information Exchange. Indiana Network For Patient Care. Web. Accessed 08 May 2016. http://www.ihie.org/indiana-network-for-patient-care.
16. McDonald CJ, Overhage JM, Barnes M, et al. The Indiana network for patient care: a working local health information infrastructure. An example of a working infrastructure collaboration that links data from five health systems and hundreds of millions of entries. Health Aff (Millwood) 2005;24(5):1214-20 doi: 10.1377/hlthaff.24.5.1214[published Online First: Epub Date]|.

17. Duke JD, Morea J, Mamlin B, et al. Regenstrief Institute's Medical Gopher: a next-generation homegrown electronic medical record system. Int J Med Inform 2014;83(3):170-9 doi: 10.1016/j.ijmedinf.2013.11.004[published Online First: Epub Date]|.
18. Amiel SA, Dixon T, Mann R, Jameson K. Hypoglycaemia in Type 2 diabetes. Diabetic medicine : a journal of the British Diabetic Association 2008;25(3):245-54 doi: 10.1111/j.1464-5491.2007.02341.x[published Online First: Epub Date]|.
19. Banarer S, Cryer PE. Hypoglycemia in type 2 diabetes. The Medical clinics of North America 2004;88(4):1107-16, xii-xiii doi: 10.1016/j.mcna.2004.04.003[published Online First: Epub Date]|.
20. Bramlage P, Gitt AK, Binz C, Krekler M, Deeg E, Tschope D. Oral antidiabetic treatment in type-2 diabetes in the elderly: balancing the need for glucose control and the risk of hypoglycemia. Cardiovascular diabetology 2012;11:122 doi: 10.1186/1475-2840-11-122[published Online First: Epub Date]|.
21. Burge MR, Zeise TM, Sobhy TA, Rassam AG, Schade DS. Low-dose ethanol predisposes elderly fasted patients with type 2 diabetes to sulfonylurea-induced low blood glucose. Diabetes Care 1999;22(12):2037-43
22. Cryer PE, Childs BP. Negotiating the barrier of hypoglycemia in diabetes. Diabetes Spectrum 2002;15(1):20-27
23. Davis S, Alonso MD. Hypoglycemia as a barrier to glycemic control. Journal of Diabetes and its Complications 2004;18(1):60-68
24. Duckworth W, Abraira C, Moritz T, et al. Glucose control and vascular complications in veterans with type 2 diabetes. The New England journal of medicine 2009;360(2):129-39 doi: 10.1056/NEJMoa0808431[published Online First: Epub Date]|.
25. Duran-Nah JJ, Rodriguez-Morales A, Smitheram J, Correa-Medina C. Risk factors associated with symptomatic hypoglycemia in type 2 diabetes mellitus patients. Revista de investigacion clinica; organo del Hospital de Enfermedades de la Nutricion 2008;60(6):451-8
26. Group AS, Gerstein HC, Miller ME, et al. Long-term effects of intensive glucose lowering on cardiovascular outcomes. The New England journal of medicine 2011;364(9):818-28 doi: 10.1056/NEJMoa1006524[published Online First: Epub Date]|.
27. Advance Collaborative Group, Patel A, MacMahon S, et al. Intensive blood glucose control and vascular outcomes in patients with type 2 diabetes. The New England journal of medicine 2008;358(24):2560-72 doi: 10.1056/NEJMoa0802987[published Online First: Epub Date]|.
28. Action to Control Cardiovascular Risk in Diabetes Study Group, Gerstein HC, Miller ME, et al. Effects of intensive glucose lowering in type 2 diabetes. The New England journal of medicine 2008;358(24):2545-59 doi: 10.1056/NEJMoa0802743[published Online First: Epub Date]|.
29. Guisasola FA, Povedano ST, Krishnarajah G, Lyu R, Mavros P, Yin D. Hypoglycaemic symptoms, treatment satisfaction, adherence and their associations with glycaemic goal in patients with type 2 diabetes mellitus: findings from the Real-Life Effectiveness and Care Patterns of Diabetes Management (RECAP-DM) Study. Diabetes, Obesity and Metabolism 2008;10(s1):25-32
30. The Diabetes Control and Complications Trial Research Group. The effect of intensive treatment of diabetes on the development and progression of long-term complications in

insulin-dependent diabetes mellitus. The New England journal of medicine 1993;329(14):977-86 doi: 10.1056/NEJM199309303291401[published Online First: Epub Date]|.
31. Gibson EM, Tingen MS. Nursing care for diabetic patients with alcohol-induced hypoglycemia. Journal of emergency nursing: JEN : official publication of the Emergency Department Nurses Association 1998;24(2):165-8
32. Holman RR, Thorne KI, Farmer AJ, et al. Addition of biphasic, prandial, or basal insulin to oral therapy in type 2 diabetes. New England Journal of Medicine 2007;357(17):1716-30
33. Kirkman MS, Briscoe VJ, Clark N, et al. Diabetes in older adults: a consensus report. Journal of the American Geriatrics Society 2012;60(12):2342-56 doi: 10.1111/jgs.12035[published Online First: Epub Date]|.
34. Lin YY, Hsu CW, Sheu WH, Chu SJ, Wu CP, Tsai SH. Risk factors for recurrent hypoglycemia in hospitalized diabetic patients admitted for severe hypoglycemia. Yonsei medical journal 2010;51(3):367-74 doi: 10.3349/ymj.2010.51.3.367[published Online First: Epub Date]|.
35. Lipska KJ, Warton EM, Huang ES, et al. HbA1c and risk of severe hypoglycemia in type 2 diabetes: the Diabetes and Aging Study. Diabetes Care 2013;36(11):3535-42 doi: 10.2337/dc13-0610[published Online First: Epub Date]|.
36. Mohamed Z, Arya VB, Hussain K. Hyperinsulinaemic hypoglycaemia:genetic mechanisms, diagnosis and management. Journal of clinical research in pediatric endocrinology 2012;4(4):169-81 doi: 10.4274/jcrpe.821[published Online First: Epub Date]|.
37. Montori VM, Fernandez-Balsells M. Glycemic control in type 2 diabetes: time for an evidence-based about-face? Annals of internal medicine 2009;150(11):803-8
38. Quilliam BJ, Simeone JC, Ozbay AB. Risk factors for hypoglycemia-related hospitalization in patients with type 2 diabetes: a nested case-control study. Clinical therapeutics 2011;33(11):1781-91 doi: 10.1016/j.clinthera.2011.09.020[published Online First: Epub Date]|.
39. Rodbard HW, Gough S, Lane W, Korsholm L, Bretler DM, Handelsman Y. Reduced Risk of Hypoglycemia with Insulin Degludec Versus Insulin Glargine in Patients with Type 2 Diabetes Requiring High Doses of Basal Insulin: Meta-Analysis of Five Randomized Begin Trials. Endocrine practice : official journal of the American College of Endocrinology and the American Association of Clinical Endocrinologists 2013:1-23 doi: 10.4158/ep13287.or[published Online First: Epub Date]|.
40. Samann A, Lehmann T, Heller T, et al. A retrospective study on the incidence and risk factors of severe hypoglycemia in primary care. Family practice 2013;30(3):290-3 doi: 10.1093/fampra/cms071[published Online First: Epub Date]|.
41. Schelleman H, Bilker WB, Brensinger CM, Wan F, Hennessy S. Anti-infectives and the risk of severe hypoglycemia in users of glipizide or glyburide. Clinical pharmacology and therapeutics 2010;88(2):214-22 doi: 10.1038/clpt.2010.74[published Online First: Epub Date]|.
42. Williams ME, Garg R, Wang W, Lacson R, Maddux F, Lacson E, Jr. High Hemoglobin A1c levels and glycemic variability increase risk of severe hypoglycemia in diabetic hemodialysis patients. Hemodialysis international. International Symposium on Home Hemodialysis 2013(Nov 26):1-10 doi: 10.1111/hdi.12110[published Online First: Epub Date]|.

43. Turner R, Holman R, Cull C, et al. Intensive blood-glucose control with sulphonylureas or insulin compared with conventional treatment and risk of complications in patients with type 2 diabetes (UKPDS 33). Lancet 1998;352(9131):837-53
44. Ginde AA, Blanc PG, Lieberman RM, Camargo CA, Jr. Validation of ICD-9-CM coding algorithm for improved identification of hypoglycemia visits. BMC endocrine disorders 2008;8:4 doi: 10.1186/1472-6823-8-4[published Online First: Epub Date]|.
45. Organization for the Advancement of Structured Information Standards (OASIS). Unstructured Information Management Architecture (UIMA) Version 1.0, 02 March 2009. Web. Accessed 08 May 2016. http://docs.oasis-open.org/uima/v1.0/uima-v1.0.html.
46. The Apache Software Foundation. Apache OpenNLP Developer Documentation, 2014. Web. Accessed 08 May 2016. https://opennlp.apache.org/documentation/1.6.0/manual/opennlp.html.
47. Breiman L, Freidman JH, Olshen RA, Stone DJ. Classification and Regression Trees. New York: Chapman & Hall/CRC Press, 1984.
48. Breiman L. Random forests. Web. Accessed 18 June 2018. https://www.stat.berkeley.edu/users/breiman/randomforest2001.pdf.
49. Ben-Ami H, Nagachandran P, Mendelson A, Edoute Y. Drug-induced hypoglycemic coma in 102 diabetic patients. Archives of internal medicine 1999;159(3):281-4
50. Shorr RI, Ray WA, Daugherty JR, Griffin MR. Antihypertensives and the risk of serious hypoglycemia in older persons using insulin or sulfonylureas. JAMA : the journal of the American Medical Association 1997;278(1):40-3
51. Punthakee Z, Miller ME, Launer LJ, et al. Poor cognitive function and risk of severe hypoglycemia in type 2 diabetes: post hoc epidemiologic analysis of the ACCORD trial. Diabetes Care 2012;35(4):787-93 doi: 10.2337/dc11-1855[published Online First: Epub Date]|.
52. Brodovicz KG, Mehta V, Zhang Q, et al. Association between hypoglycemia and inpatient mortality and length of hospital stay in hospitalized, insulin-treated patients. Current medical research and opinion 2013;29(2):101-7 doi: 10.1185/03007995.2012.754744[published Online First: Epub Date]|.
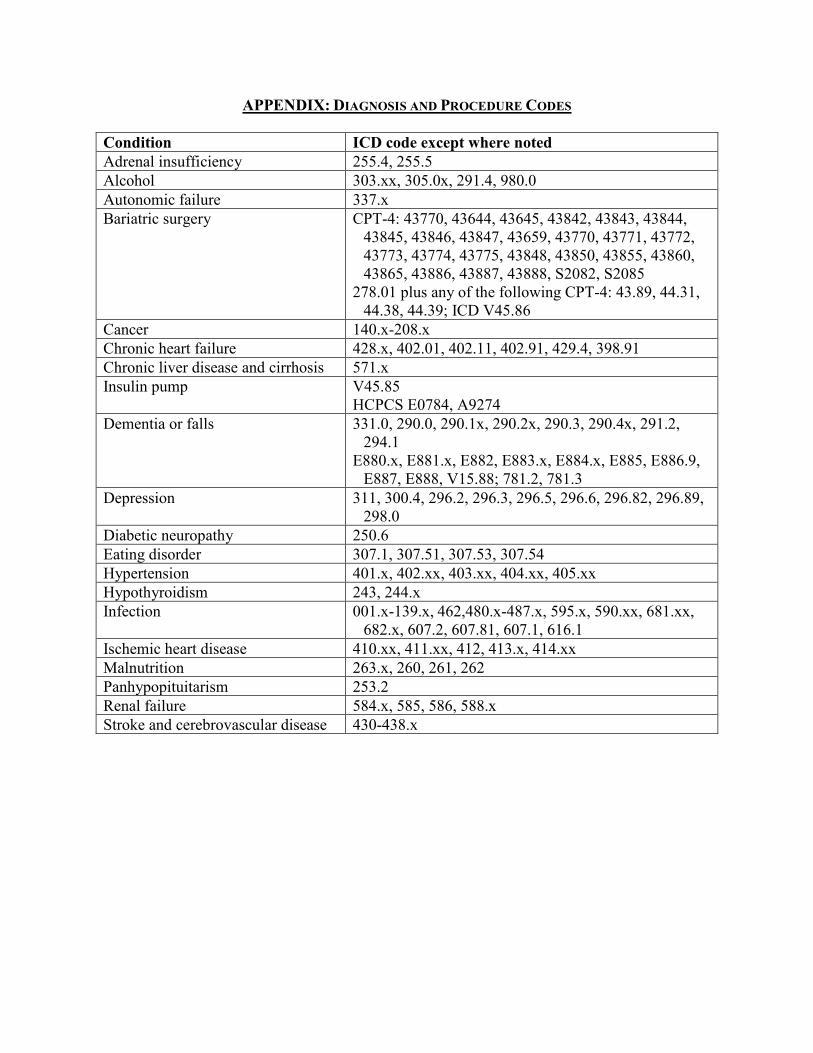
APPENDIX: DIAGNOSIS AND PROCEDURE CODES Condition ICD code except where noted Adrenal insufficiency 255.4, 255.5 Alcohol 303.xx, 305.0x, 291.4, 980.0 Autonomic failure 337.x Bariatric surgery CPT-4: 43770, 43644, 43645, 43842, 43843, 43844,
43845, 43846, 43847, 43659, 43770, 43771, 43772, 43773, 43774, 43775, 43848, 43850, 43855, 43860, 43865, 43886, 43887, 43888, S2082, S2085
278.01 plus any of the following CPT-4: 43.89, 44.31, 44.38, 44.39; ICD V45.86
Cancer 140.x-208.x Chronic heart failure 428.x, 402.01, 402.11, 402.91, 429.4, 398.91 Chronic liver disease and cirrhosis 571.x Insulin pump V45.85
HCPCS E0784, A9274 Dementia or falls 331.0, 290.0, 290.1x, 290.2x, 290.3, 290.4x, 291.2,
294.1 E880.x, E881.x, E882, E883.x, E884.x, E885, E886.9,
E887, E888, V15.88; 781.2, 781.3 Depression 311, 300.4, 296.2, 296.3, 296.5, 296.6, 296.82, 296.89,
298.0 Diabetic neuropathy 250.6 Eating disorder 307.1, 307.51, 307.53, 307.54 Hypertension 401.x, 402.xx, 403.xx, 404.xx, 405.xx Hypothyroidism 243, 244.x Infection 001.x-139.x, 462,480.x-487.x, 595.x, 590.xx, 681.xx,
682.x, 607.2, 607.81, 607.1, 616.1 Ischemic heart disease 410.xx, 411.xx, 412, 413.x, 414.xx Malnutrition 263.x, 260, 261, 262 Panhypopituitarism 253.2 Renal failure 584.x, 585, 586, 588.x Stroke and cerebrovascular disease 430-438.x


![Hypoglycemia and Diabetes · hypoglycemia, including severe hypoglycemia, occur in people with type 2 diabetes.[25] There is no doubt that hypoglycemia can be fatal.[26] In addition](https://static.fdocuments.us/doc/165x107/5f0518c07e708231d4113f09/hypoglycemia-and-hypoglycemia-including-severe-hypoglycemia-occur-in-people-with.jpg)


