Predictive analytics as a tool of ... - hrcak.srce.hr
9
100 Scientific Journal of Maritime Research 35 (2021) 100-108 © Faculty of Maritime Studies Rijeka, 2021 Multidisciplinarni znanstveni časopis POMORSTVO Multidisciplinary SCIENTIFIC JOURNAL OF MARITIME RESEARCH https://doi.org/10.31217/p.35.1.11 Predictive analytics as a tool of controlling in decision making process in the marina industry Uwe Lebefromm University of Rijeka, Faculty of Economics and Business, Ivana Filipovića 4, 51000 Rijeka, Croatia, e-mail: [email protected] ARTICLE INFO Review article Received 12 April 2021 Accepted 13 May 2021 Key words: Business decision Predictive analytics Decision making Controlling Marina industry ABSTRACT This paper is dealing with predictive modeling based on predictive analytics using computer application system and the usage of the prediction results for decision-making processes. Usually the prediction is based on the experience of decision makers, but the aim of this study is to explain and proof higher predictive efficiency when using predictive analytics based on machine learning as well as more accurate future-oriented business decisions. The marina industry in Croatia is used for this research because of its complexity and necessity to predict future events that influence company success with reliable accuracy. The information for decision-making were obtained from the customer database recorded manually over the past 30 years and according to data from December 2020. The optimized prediction by the vector machine and statistical theory based on the Bayes theorem is used to support more accurate prediction. The quantitative research was carried out using the SAP Predictive Analytics (SAP PA) computer application. The results of prediction models are a perfect basis for making future-oriented strategic and tactical decisions. This research proves that, with knowledge obtained from the results of prediction models it is possible to improve the identification of the target group among applicants and customers that contribute to company success. The research provides a theoretical and an empirical contribution in the usage of predictive analytics in the marina industry in Croatia. 1 Introduction The development of information technology leads to the extensive digitalization of data and the use of digital data technologies in administration, management and con- trolling of the enterprises all over the world. This does not apply to routine work, but also tactical and strategic plan- ning and the resulting management decisions supported by controlling. The tasks of controlling have changed sig- nificantly from the historical collection and evaluation of data to a decision support system. The possibility to use big data, the Internet of things, machine learning and other potential tools of the data science gives controllers a role of predictors. [37], [54, 27-48], [19]. However, this also requires controllers to ensure the consistency and comparability of diverse data and analysis models within the company [48, 8-19], [49, 160], [50]. Artificial intel- ligence systems and experts who supply these systems with decision-relevant data, parameterize them correctly based on their own experience. The interpretation of pre- dicted results by specialists using their knowledge leads to the development of effective and efficient tactical and strategic plans and decision proposals [15, 59], [22, 94- 95]. Modern controlling must therefore break new ground. Experience and expertise must be supplemented by the usage of expert systems [23, 362-366], [44, 43]. This study follows this path. Pattern recognition in the data and the related development of forecast models are the basis for a system of quick and sustainable decisions. The figure above gives an overview of the progress of reporting in controlling. Traditionally, controlling manage- ment received standard reports. This flood of numbers in the reports was outlined using graphics to visualize the core of the statements. With further development of the reporting system the possibility was created to select ad
Transcript of Predictive analytics as a tool of ... - hrcak.srce.hr
100 Scientific Journal of Maritime Research 35 (2021) 100-108 © Faculty of Maritime Studies Rijeka, 2021
Multidisciplinarni znanstveni časopis
POMORSTVO
Multidisciplinary SCIENTIFIC JOURNAL
OF MARITIME RESEARCH
https://doi.org/10.31217/p.35.1.11
Predictive analytics as a tool of controlling in decision making process in the marina industryUwe LebefrommUniversity of Rijeka, Faculty of Economics and Business, Ivana Filipovića 4, 51000 Rijeka, Croatia, e-mail: [email protected]
ARTICLE INFO
Review articleReceived 12 April 2021Accepted 13 May 2021
Key words:Business decision Predictive analytics Decision making Controlling Marina industry
ABSTRACT
This paper is dealing with predictive modeling based on predictive analytics using computer application system and the usage of the prediction results for decision-making processes. Usually the prediction is based on the experience of decision makers, but the aim of this study is to explain and proof higher predictive efficiency when using predictive analytics based on machine learning as well as more accurate future-oriented business decisions. The marina industry in Croatia is used for this research because of its complexity and necessity to predict future events that influence company success with reliable accuracy. The information for decision-making were obtained from the customer database recorded manually over the past 30 years and according to data from December 2020. The optimized prediction by the vector machine and statistical theory based on the Bayes theorem is used to support more accurate prediction. The quantitative research was carried out using the SAP Predictive Analytics (SAP PA) computer application. The results of prediction models are a perfect basis for making future-oriented strategic and tactical decisions. This research proves that, with knowledge obtained from the results of prediction models it is possible to improve the identification of the target group among applicants and customers that contribute to company success. The research provides a theoretical and an empirical contribution in the usage of predictive analytics in the marina industry in Croatia.
1 Introduction
The development of information technology leads to the extensive digitalization of data and the use of digital data technologies in administration, management and con-trolling of the enterprises all over the world. This does not apply to routine work, but also tactical and strategic plan-ning and the resulting management decisions supported by controlling. The tasks of controlling have changed sig-nificantly from the historical collection and evaluation of data to a decision support system. The possibility to use big data, the Internet of things, machine learning and other potential tools of the data science gives controllers a role of predictors. [37], [54, 27-48], [19]. However, this also requires controllers to ensure the consistency and comparability of diverse data and analysis models within the company [48, 8-19], [49, 160], [50]. Artificial intel-ligence systems and experts who supply these systems
with decision-relevant data, parameterize them correctly based on their own experience. The interpretation of pre-dicted results by specialists using their knowledge leads to the development of effective and efficient tactical and strategic plans and decision proposals [15, 59], [22, 94-95]. Modern controlling must therefore break new ground. Experience and expertise must be supplemented by the usage of expert systems [23, 362-366], [44, 43]. This study follows this path. Pattern recognition in the data and the related development of forecast models are the basis for a system of quick and sustainable decisions.
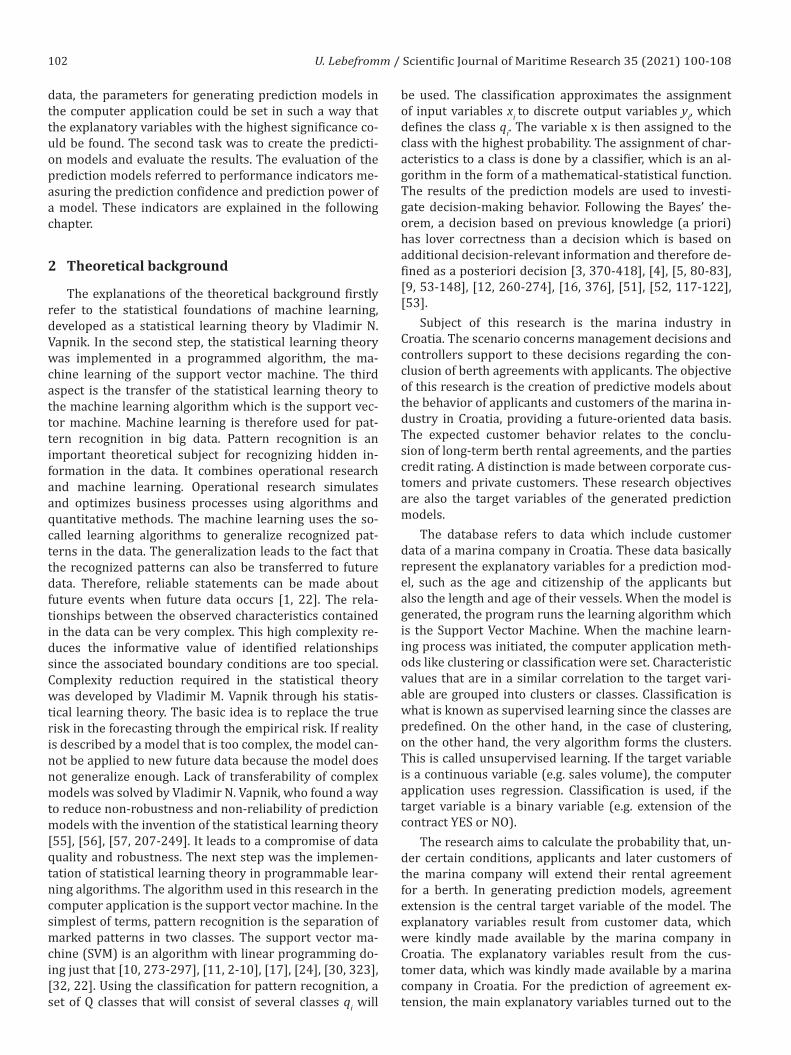
The figure above gives an overview of the progress of reporting in controlling. Traditionally, controlling manage-ment received standard reports. This flood of numbers in the reports was outlined using graphics to visualize the core of the statements. With further development of the reporting system the possibility was created to select ad

101U. Lebefromm / Scientific Journal of Maritime Research 35 (2021) 100-108
hoc figures and calculate key figures. Additional informa-tion systems have been created for better visualization and faster recording of key figures relevant to decision-making. This area also includes the Balanced Scorecard developed by Norton and Kaplan [29]. With the devel-opment of the systems based on a business warehouse system, a data pool was available in which data can be extracted from different systems. This enables interdisci-plinary reporting. The entire know-how of a company was incorporated in a single reporting system, called Business Intelligence (BI). Given that, only the characteristics and key figures are extracted from the source systems, the name Online Analytical Processing (OLAP) was defined. The usability of the reporting systems was developed to such an extent that experts were no longer necessary for reporting. Management could serve itself. User-friendly data exploration and agile visualization with dynamic dashboards support the fast and up-to-date evaluation of business developments [25, 83]. However, in all cases, it is a question of reporting on historical data. A look into the future is essential if a company wants to remain competi-tive. This brings up the question of why predictive analyt-ics is better. The availability of big data makes it possible to discover relationships between the data and be prove them [31], [46], [47, 863]. Another aspect is the availabil-ity of data from social media. With these data-as-a-service offers, companies can make their marketing campaigns more intelligent. Interrelationships between the compa-ny and market processes can be made visible and useful for business decisions. In this way, suitable target groups for the company can be better identified and marketing budgets can be used in a target group-oriented manner.
A company that does not use the new technology of data science and the associated possibilities for making future-oriented decisions will be overtaken by competition. This research has proven that predictive analytics does signifi-proven that predictive analytics does signifi-cantly improve the level of information of controlling and management [7, 35-37], [19], [20], [40, 63]. This lead to a changed decision-making behavior [2, 136], [6, 432-459], [9, 53-148], [13, 43-47], [43]. It would also has an impact to the processes in controlling and controlling decisions [18, 21], [36], [42], [51], [52], [27, 57], [42], [50], [38], [39].
The subject of this research is the marina industry in Croatia. Marina industry is a dynamic and complex indus-try, a very important competitive product of Croatia which tend to be sustainable [21], [26]. Considering the length of the coast nautical tourism is very competitive branch in Croatia with high turnover in the past few years [21], [26, 59-66], [28, 175-186], [33], [41], [45]. However, it is nec-essary to improve management of marinas in the direc-tion of more affordable pricing of berths, raising the level of service in the marinas and making other improvements necessary for a better positioning in the Mediterranean. Several marina companies are competing. Therefore, of-fers must be made available to the interested parties in a short time. Long-term decision-making processes about the allocation of berths lead to applicants turning to com-petitors. The decision as to which prospective customer should be offered a berth depends on how reliable the prospective customer is and what agreement duration and agreement volume can be expected. Two tasks had to be mastered to achieve this goal. The first task was to un-. The first task was to un-derstand the data available. With an understanding of the
Clean Data
Standard Reports
Ad-hoc Reports
Predictive Analysis & Modeling
Operational Optimization
What happened?
Why did it happen?
MATURITY OF ANALYTICS CAPABILITIES
Self Service BI & OLAP
Data Exploration & Agile Visualization
Dashboards & Scorecards
Descriptive Analytics
Self Service Agile Visualization
What will happen?
Research: Prediction Models
ORGANIZATIONAL & COMPETITIVE IMPACT
Figure 1 The progress of analytics
Source: Bakhshaliyeva [1], 2017, pp. 64. Modified by the author.
102 U. Lebefromm / Scientific Journal of Maritime Research 35 (2021) 100-108
data, the parameters for generating prediction models in the computer application could be set in such a way that the explanatory variables with the highest significance co-uld be found. The second task was to create the predicti-on models and evaluate the results. The evaluation of the prediction models referred to performance indicators me-asuring the prediction confidence and prediction power of a model. These indicators are explained in the following chapter.
2 Theoretical background
The explanations of the theoretical background firstly refer to the statistical foundations of machine learning, developed as a statistical learning theory by Vladimir N. Vapnik. In the second step, the statistical learning theory was implemented in a programmed algorithm, the ma-chine learning of the support vector machine. The third aspect is the transfer of the statistical learning theory to the machine learning algorithm which is the support vec-tor machine. Machine learning is therefore used for pat-tern recognition in big data. Pattern recognition is an important theoretical subject for recognizing hidden in-formation in the data. It combines operational research and machine learning. Operational research simulates and optimizes business processes using algorithms and quantitative methods. The machine learning uses the so-called learning algorithms to generalize recognized pat-terns in the data. The generalization leads to the fact that the recognized patterns can also be transferred to future data. Therefore, reliable statements can be made about future events when future data occurs [1, 22]. The rela-tionships between the observed characteristics contained in the data can be very complex. This high complexity re-duces the informative value of identified relationships since the associated boundary conditions are too special. Complexity reduction required in the statistical theory was developed by Vladimir M. Vapnik through his statis-tical learning theory. The basic idea is to replace the true risk in the forecasting through the empirical risk. If reality is described by a model that is too complex, the model can-not be applied to new future data because the model does not generalize enough. Lack of transferability of complex models was solved by Vladimir N. Vapnik, who found a way to reduce non-robustness and non-reliability of prediction models with the invention of the statistical learning theory [55], [56], [57, 207-249]. It leads to a compromise of data quality and robustness. The next step was the implemen-tation of statistical learning theory in programmable lear-ning algorithms. The algorithm used in this research in the computer application is the support vector machine. In the simplest of terms, pattern recognition is the separation of marked patterns in two classes. The support vector ma-chine (SVM) is an algorithm with linear programming do-ing just that [10, 273-297], [11, 2-10], [17], [24], [30, 323], [32, 22]. Using the classification for pattern recognition, a set of Q classes that will consist of several classes qi will
be used. The classification approximates the assignment of input variables xi to discrete output variables yi, which defines the class qi. The variable x is then assigned to the class with the highest probability. The assignment of char-acteristics to a class is done by a classifier, which is an al-gorithm in the form of a mathematical-statistical function. The results of the prediction models are used to investi-gate decision-making behavior. Following the Bayes’ the-orem, a decision based on previous knowledge (a priori) has lover correctness than a decision which is based on additional decision-relevant information and therefore de-fined as a posteriori decision [3, 370-418], [4], [5, 80-83], [9, 53-148], [12, 260-274], [16, 376], [51], [52, 117-122], [53].
Subject of this research is the marina industry in Croatia. The scenario concerns management decisions and controllers support to these decisions regarding the con-clusion of berth agreements with applicants. The objective of this research is the creation of predictive models about the behavior of applicants and customers of the marina in-dustry in Croatia, providing a future-oriented data basis. The expected customer behavior relates to the conclu-sion of long-term berth rental agreements, and the parties credit rating. A distinction is made between corporate cus-tomers and private customers. These research objectives are also the target variables of the generated prediction models.
The database refers to data which include customer data of a marina company in Croatia. These data basically represent the explanatory variables for a prediction mod-el, such as the age and citizenship of the applicants but also the length and age of their vessels. When the model is generated, the program runs the learning algorithm which is the Support Vector Machine. When the machine learn-ing process was initiated, the computer application meth-ods like clustering or classification were set. Characteristic values that are in a similar correlation to the target vari-able are grouped into clusters or classes. Classification is what is known as supervised learning since the classes are predefined. On the other hand, in the case of clustering, on the other hand, the very algorithm forms the clusters. This is called unsupervised learning. If the target variable is a continuous variable (e.g. sales volume), the computer application uses regression. Classification is used, if the target variable is a binary variable (e.g. extension of the contract YES or NO).
The research aims to calculate the probability that, un-der certain conditions, applicants and later customers of the marina company will extend their rental agreement for a berth. In generating prediction models, agreement extension is the central target variable of the model. The explanatory variables result from customer data, which were kindly made available by the marina company in Croatia. The explanatory variables result from the cus-tomer data, which was kindly made available by a marina company in Croatia. For the prediction of agreement ex-tension, the main explanatory variables turned out to the
103U. Lebefromm / Scientific Journal of Maritime Research 35 (2021) 100-108
vessel length, vessel age, vessel type and certain marinas preferred by the customers.
The applied quantitative research was performed using the computer application called SAP Predictive Analytics (SAP PA). The support vector machine algorithm was pro-grammed by the company KXEN into the KXEN algorithm. Using SAP PA, the prediction models were created with setting the parameters in such a way that best quality pre-diction results could be generated. The parameterization consisted of setting the target variable, excluding irrele-vant variables that could contaminate the result. This was done through the successive evaluation of the key per-formance indicators KI and KR, which calculate the quality of the prediction model. The accuracy of the model indi-cates the influence of explanatory variables on the target variable. The performance of the predictive models can be measured by two key performance indicators [6], [7], [8].1. Predictive power (KI) or predictive capability, which
indicates the accuracy of the model. KI has a range of 0.0 to almost 1.0, usually 0.998. The higher the value of KI, the more significant the explanatory variables are. However, not all available explanatory variables of the database should be used. Only the essential variables that contribute to the target variable should be consid-ered. This are the variables with the highest correla-tion to the target variable.
2. Prediction confidence (KR) or reliability of the prog-nosis characterizes the statistical robustness of the model. KR has a range of 0.0 to 1.0. Only a value above 0.95 shows that it is a robust model [8, 124]. A model is robust, when the same quality of prediction can be ex-pected using new data with an unknown result [1, 31]. The abbreviations KI and KR come from the American
company KXEN INC., which was founded in 1998. Therefore,
KI stands for “KXEN Information Contribution”. KR stands for “KXEN Robustness”. The results of the forecasts are visu-alized by graphics to the model.
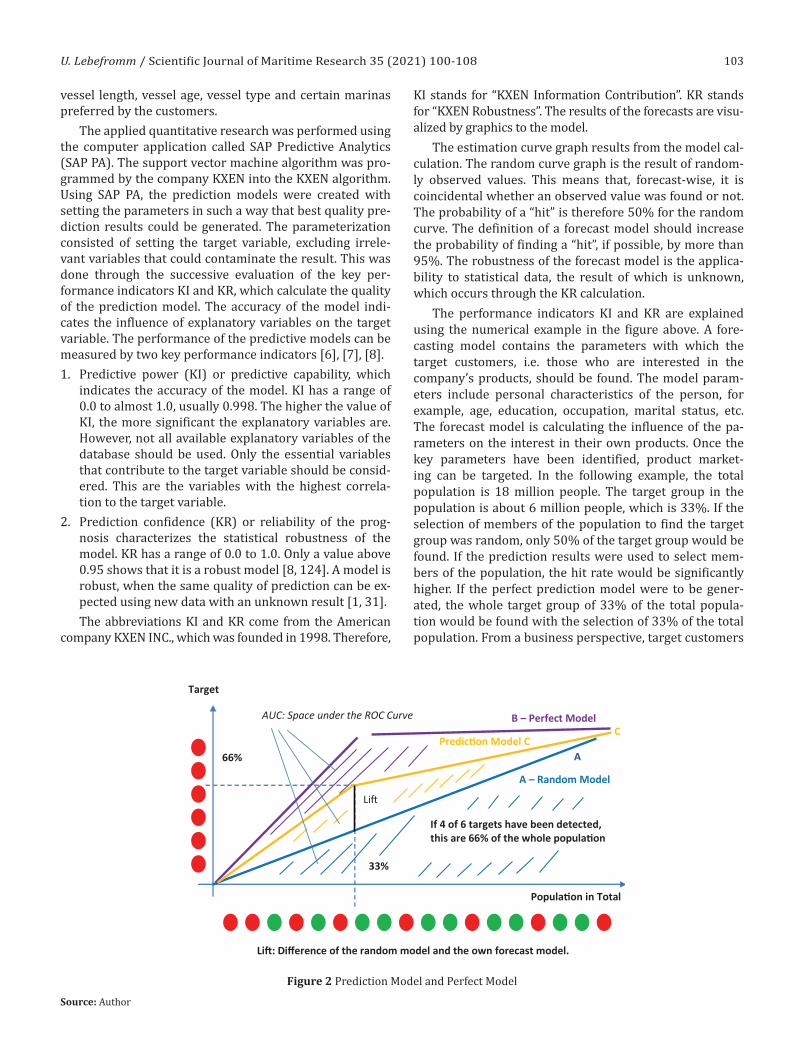
The estimation curve graph results from the model cal-culation. The random curve graph is the result of random-ly observed values. This means that, forecast-wise, it is coincidental whether an observed value was found or not. The probability of a “hit” is therefore 50% for the random curve. The definition of a forecast model should increase the probability of finding a “hit”, if possible, by more than 95%. The robustness of the forecast model is the applica-bility to statistical data, the result of which is unknown, which occurs through the KR calculation.
The performance indicators KI and KR are explained using the numerical example in the figure above. A fore-casting model contains the parameters with which the target customers, i.e. those who are interested in the company’s products, should be found. The model param-eters include personal characteristics of the person, for example, age, education, occupation, marital status, etc. The forecast model is calculating the influence of the pa-rameters on the interest in their own products. Once the key parameters have been identified, product market-ing can be targeted. In the following example, the total population is 18 million people. The target group in the population is about 6 million people, which is 33%. If the selection of members of the population to find the target group was random, only 50% of the target group would be found. If the prediction results were used to select mem-bers of the population, the hit rate would be significantly higher. If the perfect prediction model were to be gener-ated, the whole target group of 33% of the total popula-tion would be found with the selection of 33% of the total population. From a business perspective, target customers
Target
If 4 of 6 targets have been detected, this are 66% of the whole popula�on
66%
33%
Predic�on Model C A
Popula�on in Total
Li�
Li�: Difference of the random model and the own forecast model.
AUC: Space under the ROC Curve B – Perfect Model C
A – Random Model
Figure 2 Prediction Model and Perfect Model
Source: Author
104 U. Lebefromm / Scientific Journal of Maritime Research 35 (2021) 100-108
can be found faster, and marketing costs can be reduced. Revenues can be increased by using forecast models. KI is calculated as follows:
Predictive Power: KI = C/(A + B + C)
The areas A + B + C shown in the previous figure repre-sent the population. The ratio of the area of the forecasting model C and the perfect model B to the population A + B + C is the measure of the predictive accuracy of the mod-el and thus the result of model training (estimation). The ratio of the area of the forecasting model C to the popula-tion A + B + C is a measure for the verification of the fore-casting accuracy of the model (validation). As part of the validation process, it is intended to examine, regarding to the known statistical results, whether the predictions cal-culated by the model on the known statistical results can be confirmed. The robustness of the forecast model, is the applicability to statistical data whose result is not known, takes place via the calculation of KR. KR results as:
Prediction Confidence (KR) ≈ 1 – B/(A + B + C)
The areas are calculated mathematically using the de-termined integral. The computer application uses the so-called rectangle methods as an approximation. For this purpose, the area of the function is divided into large number of rectangles whose areas are summed up. It results in a sum of rectangles, which are above the func-tion and a sum of rectangles that lie below the function. The mean value is formed from both values. The curve therefore is named ROC – curve (Receiver Operating Characteristics) [34].
3 Methods
To be able to calculate a reliable forecast about the sales progress, it is of a decisive advantage for the com-petitive Croatian marina industry should be able to make reliable predictions about future customer behavior. The results of this research show that reliable statements about customer behavior can be made by using predictive analytics. The results show that from the large number of customer characteristics, those having a significant influ-ence on the customers decisions. It is important to filter out less important features, because no decision-making constellations would be possible with an unmanageable number of influencing factors.
Partitioning method of clustering. The partition-ing method of clustering divides a quantity of data into k clusters, whereby an observed characteristic belongs to exactly one cluster. The features observed are points in an n-dimensional Euclidean vector space. A cluster is repre-sented by a centroid. The goal of the partitioning is to di-vide the data set into k partitions in such a way that the sum of the squared distances from the cluster centroids μi is minimal. Mathematically, this corresponds to the opti-mization of the function [14, 51]:
SSE = ∑x∊C dist(x, μi)2
SSE – Sum of Squared Distance to Euclid Center.Ci – cluster i. x – observed variable value of the explanatory variables.μi – cluster centroiddist(x, μi)2 – Squared distance of observed variable xj to the cluster centroid μi
The smaller the sum of the distances between the ob-served values and the centroid of a cluster, the more com-pact the cluster is. The variables used in this research are: x1 = Vessel Type; x2 = Vessel Age; x3 = Vessel Length; x4 = Marina. No Filter. With the use of the learning machine SAP Predictive Analytics, the contract extension was set as the target variable.
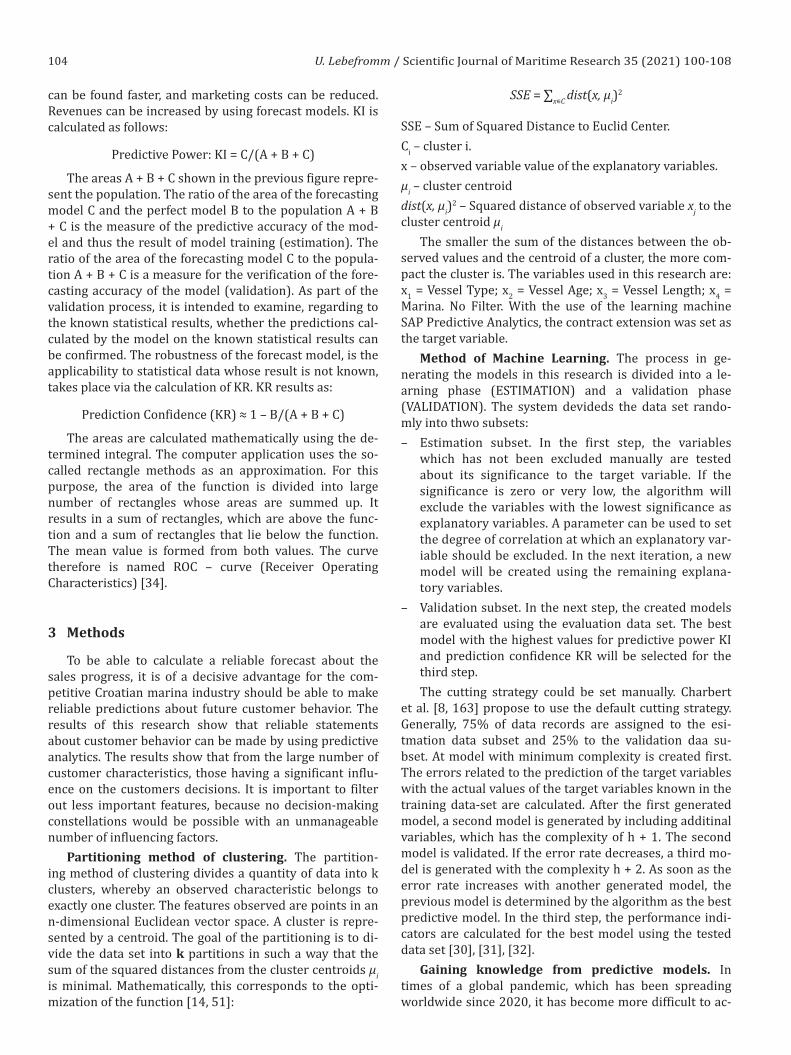
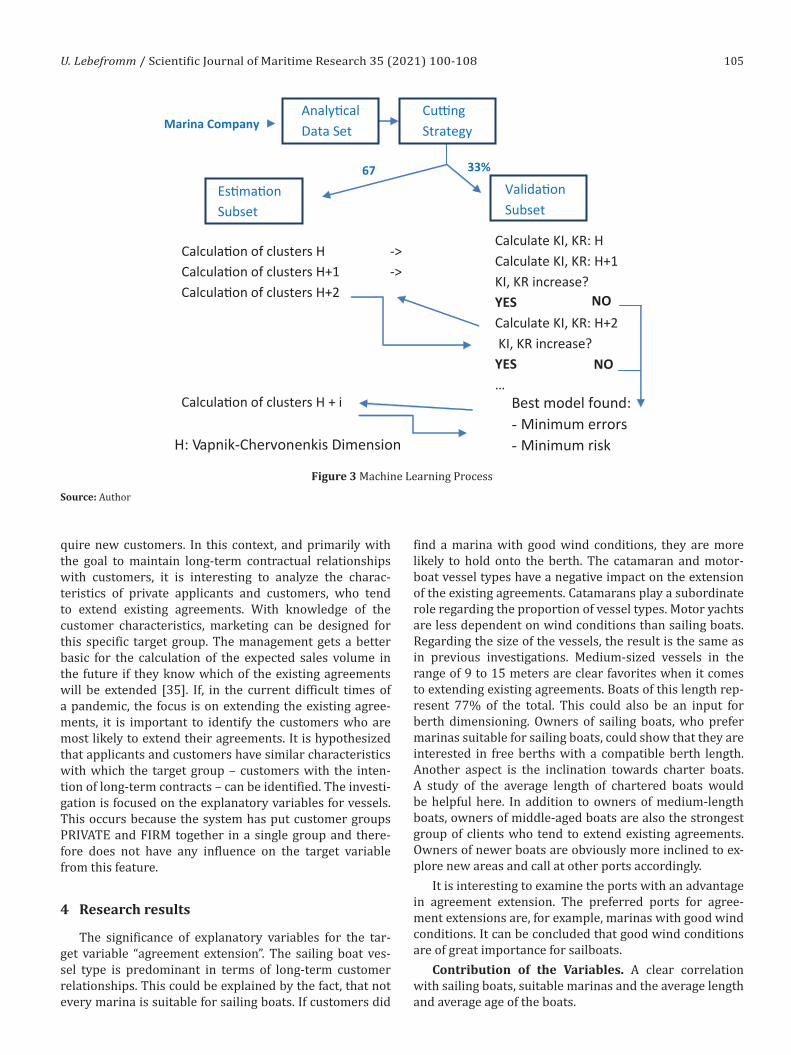
Method of Machine Learning. The process in ge-nerating the models in this research is divided into a le-arning phase (ESTIMATION) and a validation phase (VALIDATION). The system devideds the data set rando-mly into thwo subsets: – Estimation subset. In the first step, the variables
which has not been excluded manually are tested about its significance to the target variable. If the significance is zero or very low, the algorithm will exclude the variables with the lowest significance as explanatory variables. A parameter can be used to set the degree of correlation at which an explanatory var-iable should be excluded. In the next iteration, a new model will be created using the remaining explana-tory variables.
– Validation subset. In the next step, the created models are evaluated using the evaluation data set. The best model with the highest values for predictive power KI and prediction confidence KR will be selected for the third step. The cutting strategy could be set manually. Charbert
et al. [8, 163] propose to use the default cutting strategy. Generally, 75% of data records are assigned to the esi-tmation data subset and 25% to the validation daa su-bset. At model with minimum complexity is created first. The errors related to the prediction of the target variables with the actual values of the target variables known in the training data-set are calculated. After the first generated model, a second model is generated by including additinal variables, which has the complexity of h + 1. The second model is validated. If the error rate decreases, a third mo-del is generated with the complexity h + 2. As soon as the error rate increases with another generated model, the previous model is determined by the algorithm as the best predictive model. In the third step, the performance indi-cators are calculated for the best model using the tested data set [30], [31], [32].
Gaining knowledge from predictive models. In times of a global pandemic, which has been spreading worldwide since 2020, it has become more difficult to ac-
105U. Lebefromm / Scientific Journal of Maritime Research 35 (2021) 100-108
quire new customers. In this context, and primarily with the goal to maintain long-term contractual relationships with customers, it is interesting to analyze the charac-teristics of private applicants and customers, who tend to extend existing agreements. With knowledge of the customer characteristics, marketing can be designed for this specific target group. The management gets a better basic for the calculation of the expected sales volume in the future if they know which of the existing agreements will be extended [35]. If, in the current difficult times of a pandemic, the focus is on extending the existing agree-ments, it is important to identify the customers who are most likely to extend their agreements. It is hypothesized that applicants and customers have similar characteristics with which the target group – customers with the inten-tion of long-term contracts – can be identified. The investi-gation is focused on the explanatory variables for vessels. This occurs because the system has put customer groups PRIVATE and FIRM together in a single group and there-fore does not have any influence on the target variable from this feature.
4 Research results
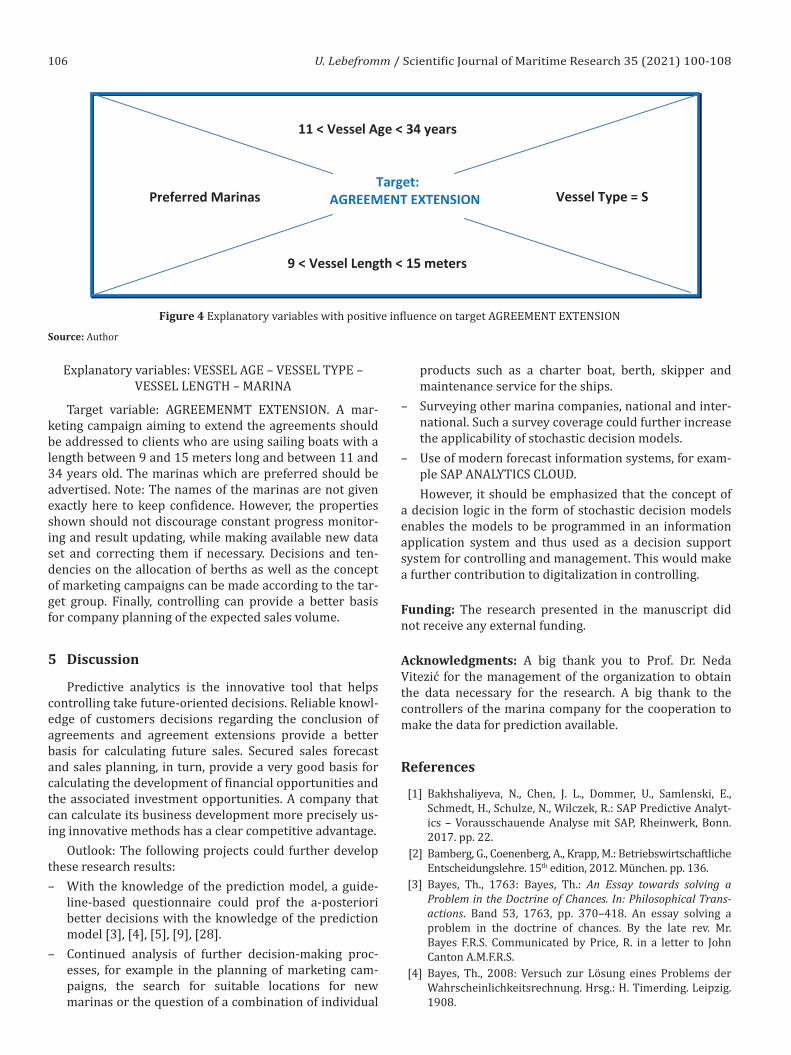
The significance of explanatory variables for the tar-get variable “agreement extension”. The sailing boat ves-sel type is predominant in terms of long-term customer relationships. This could be explained by the fact, that not every marina is suitable for sailing boats. If customers did
find a marina with good wind conditions, they are more likely to hold onto the berth. The catamaran and motor-boat vessel types have a negative impact on the extension of the existing agreements. Catamarans play a subordinate role regarding the proportion of vessel types. Motor yachts are less dependent on wind conditions than sailing boats. Regarding the size of the vessels, the result is the same as in previous investigations. Medium-sized vessels in the range of 9 to 15 meters are clear favorites when it comes to extending existing agreements. Boats of this length rep-resent 77% of the total. This could also be an input for berth dimensioning. Owners of sailing boats, who prefer marinas suitable for sailing boats, could show that they are interested in free berths with a compatible berth length. Another aspect is the inclination towards charter boats. A study of the average length of chartered boats would be helpful here. In addition to owners of medium-length boats, owners of middle-aged boats are also the strongest group of clients who tend to extend existing agreements. Owners of newer boats are obviously more inclined to ex-plore new areas and call at other ports accordingly.
It is interesting to examine the ports with an advantage in agreement extension. The preferred ports for agree-ment extensions are, for example, marinas with good wind conditions. It can be concluded that good wind conditions are of great importance for sailboats.
Contribution of the Variables. A clear correlation with sailing boats, suitable marinas and the average length and average age of the boats.
Analy�cal Data Set
Es�ma�on Subset
Valida�on Subset
Cu�ng Strategy
Calcula�on of clusters H -> Calcula�on of clusters H+1 -> Calcula�on of clusters H+2
Calcula�on of clusters H + i
Calculate KI, KR: H Calculate KI, KR: H+1 KI, KR increase? YES Calculate KI, KR: H+2 KI, KR increase? YES … Best model found:
- Minimum errors - Minimum risk H: Vapnik-Chervonenkis Dimension
NO
NO
Marina Company
67 33%
Figure 3 Machine Learning Process
Source: Author
106 U. Lebefromm / Scientific Journal of Maritime Research 35 (2021) 100-108
Explanatory variables: VESSEL AGE – VESSEL TYPE – VESSEL LENGTH – MARINA
Target variable: AGREEMENMT EXTENSION. A mar-keting campaign aiming to extend the agreements should be addressed to clients who are using sailing boats with a length between 9 and 15 meters long and between 11 and 34 years old. The marinas which are preferred should be advertised. Note: The names of the marinas are not given exactly here to keep confidence. However, the properties shown should not discourage constant progress monitor-ing and result updating, while making available new data set and correcting them if necessary. Decisions and ten-dencies on the allocation of berths as well as the concept of marketing campaigns can be made according to the tar-get group. Finally, controlling can provide a better basis for company planning of the expected sales volume.
5 Discussion
Predictive analytics is the innovative tool that helps controlling take future-oriented decisions. Reliable knowl-edge of customers decisions regarding the conclusion of agreements and agreement extensions provide a better basis for calculating future sales. Secured sales forecast and sales planning, in turn, provide a very good basis for calculating the development of financial opportunities and the associated investment opportunities. A company that can calculate its business development more precisely us-ing innovative methods has a clear competitive advantage.
Outlook: The following projects could further develop these research results:– With the knowledge of the prediction model, a guide-
line-based questionnaire could prof the a-posteriori better decisions with the knowledge of the prediction model [3], [4], [5], [9], [28].
– Continued analysis of further decision-making proc-esses, for example in the planning of marketing cam-paigns, the search for suitable locations for new marinas or the question of a combination of individual
products such as a charter boat, berth, skipper and maintenance service for the ships.
– Surveying other marina companies, national and inter-national. Such a survey coverage could further increase the applicability of stochastic decision models.
– Use of modern forecast information systems, for exam-ple SAP ANALYTICS CLOUD. However, it should be emphasized that the concept of
a decision logic in the form of stochastic decision models enables the models to be programmed in an information application system and thus used as a decision support system for controlling and management. This would make a further contribution to digitalization in controlling.
Funding: The research presented in the manuscript did not receive any external funding.
Acknowledgments: A big thank you to Prof. Dr. Neda Vitezić for the management of the organization to obtain the data necessary for the research. A big thank to the controllers of the marina company for the cooperation to make the data for prediction available.
References
[1] Bakhshaliyeva, N., Chen, J. L., Dommer, U., Samlenski, E., Schmedt, H., Schulze, N., Wilczek, R.: SAP Predictive Analyt-ics – Vorausschauende Analyse mit SAP, Rheinwerk, Bonn. 2017. pp. 22.
[2] Bamberg, G., Coenenberg, A., Krapp, M.: Betriebswirtschaftliche Entscheidungslehre. 15th edition, 2012. München. pp. 136.
[3] Bayes, Th., 1763: Bayes, Th.: An Essay towards solving a Problem in the Doctrine of Chances. In: Philosophical Trans-actions. Band 53, 1763, pp. 370–418. An essay solving a problem in the doctrine of chances. By the late rev. Mr. Bayes F.R.S. Communicated by Price, R. in a letter to John Canton A.M.F.R.S.
[4] Bayes, Th., 2008: Versuch zur Lösung eines Problems der Wahrscheinlichkeitsrechnung. Hrsg.: H. Timerding. Leipzig. 1908.
Target: AGREEMENT EXTENSION Vessel Type = S
11 < Vessel Age < 34 years
9 < Vessel Length < 15 meters
Preferred Marinas
Figure 4 Explanatory variables with positive influence on target AGREEMENT EXTENSION
Source: Author
107U. Lebefromm / Scientific Journal of Maritime Research 35 (2021) 100-108
[5] Beck, H.: Behavioral Economics. Eine Einführung. Springer-Gabler, Wiesbaden. 2014. pp. 80–83.
[6] Busemeyer, J. R. & Townsend, J. T.: Decision field theory: A dynamic cognitive approach to decision-making in an un-certain environment. Psychological Review, 100, pp. 432–459. 1993.
[7] Butsmann, J., Crumbach, M., Franke, J., Köhler, B., Mor-genthaler, J.: SAP S/4HANA Embedded Analytics – Architek-tur, Funktionen, Anwendungen. Rheinwerk, Bonn. 2019. pp. 35–37.
[8] Charbert, A.; Forster, A.; Tessier, L.; Vezzosi, P.: SAP Predic-tive Analysis – The Comprehensive Guide. 2017. Boston, USA. pp. 163.
[9] Clinical Laboratory Management Review: Bayesian Analy-Clinical Laboratory Management Review: Bayesian Analy-sis: An objective scientific approach to better decisions. 1999. pp. 53–148. Published in Europe PMC, online science platform.
[10] Cortes, C., Vapnik, V.: Support Vector Networks. Kluwer Aca-Cortes, C., Vapnik, V.: Support Vector Networks. Kluwer Aca-demic Publishers. Boston (USA). In: Machine Learning, 20, 1995. pp. 273–297.
[11] Dianzi, Keji, Daxue, Xuebao: An Overview of Theory and Al-Dianzi, Keji, Daxue, Xuebao: An Overview of Theory and Al-gorithm of Support Vector Machines. In: Journal of the Uni-versity of Electronic Science and Technology of China. Vol. 40/1, pp. 2–10. Year 2011.
[12] Diederich, A.: Dynamic Stochastic Models for Decision Mak-Diederich, A.: Dynamic Stochastic Models for Decision Mak-ing under Time Constraints. In: Journal of Mathematical Psychology 41, pp. 260–274, 1997
[13] Dörsam, P.: Grundlagen der Entscheidungstheorie. 6. Edi-tion. Heidenau. 2013. pp. 43–47.
[14] Ester, M., Sander, J.: Knowledge Discovery in Databases. Techniken und Anwendungen. Springer. Berlin. 2013. pp. 34, 111, 160.
[15] Feindt, M. und Kerzel, U.: Prognosen bewerten, Springer Ga-bler, 2015, pp. 59.
[16] Fenton, Norman; Neil, Martin: Risk Assessment and Deci-Fenton, Norman; Neil, Martin: Risk Assessment and Deci-sion Analysis with Bayesian Networks. School of Electronic Engineering and Computer Science. Queen Mary University of London. 2nd Edition, 2019. pp. 376.
[17] Fischer, J.: Support Vector Machines (SVM). Seminar „Statis-tische Lerntheorie und ihre Anwendungen“. Universität Ulm. June 12th 2007.
[18] Gänßlein, S.: Die Digitalisierung ist eine Chance für den Con-troller. In: Horvath, P.: Controlling, Zeitschrift für erfolgsori-entierte Unternehmenssteuerung, Sonderausgabe 2017. pp. 21.
[19] Gleich, R.; Tschandl, M. (Hrsg.): Digitalisierung und Control-ling. Technologien, Instrumente, Praxisbeispiele. Haufe. Freiburg, München, Stuttgart. 2018.
[20] Gleich, R., Grönke, K., Kirschmann, M., Leyk,J.: Controlling und Big Data. Anforderungen, Auswirkungen, Lösungen. Haufe. Freiburg, München. 2014.
[21] Gračan, D.; Gregorić, M.; Martinić, T.: NAUTICAL TOURISM IN CROATIA: CURRENT SITUATION AND OUTLOOK; Confer-ence Paper 2016. pp. 1. In Research Gate, https://www.re-searchgate.net/publication/325181470.
[22] Hölscher, Bert F.: Digitales Dilemma – Unternehmen im Spannungsfeld zwischen Effizienz und Innovation. Arkadia, Hamburg, 2017. pp. 94–95.
[23] Horváth, P., Gleich, R., Seiter M.: Controlling. 2015. 13. Au-flage. pp. 362–366.
[24] Hurwitz, J., Kirsch, D.: Machine Learning for Dummies. Un-Hurwitz, J., Kirsch, D.: Machine Learning for Dummies. Un-derstanding Machine learning fundamentals. Make sense of machine learning algorithms. Build your data science team. Jon Wiley & Sons Corp. Hoboken (NE), 2018.
[25] Hyndman Rob J., Athanaspopoulos, G.: Forecasting – Princi-Hyndman Rob J., Athanaspopoulos, G.: Forecasting – Princi-ples and Practice. A comprehensive introduction to the lat-est Forecasting methods using R. Learn to improve your forecast accuracy using dozens of real data Examples. Pub-lisher OTEX. Melbourne 2014. pp. 83.
[26] Ivanić, K., Hadžić Perić, A., Mohorović, D., Nautical Tourism: Generator of Croatian Economy Development. Scientific Journal of Maritime Research 32, pp. 59–66, 2018.
[27] Jeschke, B. G.: Entscheidungsorientiertes Management. Ein-führung in eine konzeptionell fundierte pragmatische Entscheidungsfindung. Berlin, Boston. 2017. pp. 57.
[28] Jugović, A., Kovačić, M., Hadžić, A.: Sustainable development model for nautical tourism ports, Tourism and Hospitality Management, VOl. 17, No. 2, pp. 175–186, 2011.
[29] Kaplan, R. S., Norton, D. P.: Balanced Scorecard, Strategien erfolgreich umsetzen. Schaeffer, Poeschel. 2018. Stuttgart.
[30] Kelleher, J. D., Mac Namee, B., D’Arcy, A.: Machine Learning for Predictive Data Analytics, Algorithms, Worked Examples and Case Studies. Cambridge, London. 2015. pp. 323.
[31] Kießwetter, M., Vahlkamp, D.: Data Mining in SAP Netweaver BI. Gallileo Press, Bonn, 2007.
[32] Kovalczyk, A.: Support Vector Machines Succinctly. Publisher: Syncfusion. Morrisville (USA), 2017. pp. 22.
[33] Kovačić, M: Criteria for selecting a location for a port of nau-Kovačić, M: Criteria for selecting a location for a port of nau-tical tourism. Research Gate. 2009.
[34] Krzanowski, W. J.: Hand, D. J.: ROC Curves for Continuous Data. In: Monographs on Statistics and Applied Probability 111. CRC Press Taylor & Francis Group. London, New York. 2009.
[35] Kucukvar, M. Noori, M., Egilmez, G., Tatri, O.: Stochastic deci-Kucukvar, M. Noori, M., Egilmez, G., Tatri, O.: Stochastic deci-sion modeling for sustainable pavement designs. Springer, Berlin, Heidelberg. 2014.
[36] Kuik, Sw. S., Kaihara, T., Fuji, N.: Stochastic Decision Model of the Remanufactured Product with Warranty. Proceedings of the International Multi-Conference of Engineers and Com-puter Scientists. Vol II, IMECS, March 18–20, Hong Kong. 2015.
[37] Langmann, Chr.: Digitalisierung im Controlling. Springer Verlag, Heidelberg. 2019.
[38] Laux, H., Gellenkirsch, R.M., Schlenk-Mathes, H.: Bildung eines Wahrscheinlichkeitsurteils und Bewertung von Infor-mationen. 9. Auflage. Springer Verlag, Heidelberg. 2014.
[39] Laux, H., Gillenkirch, R. M., Schenk-Mathes, H.Y.: Entschei-dungstheorie. 10th Edition. Frankfurt am Main. 2018.
[40] Lawrence, K. D., Klimberg, R. K.: Advances. Business and Management Forecasting. Vol. 12. Emerald Publishing. Unit-ed Kingdom, North America, Japan, India, Malaysia, China. 2018. pp. 63.
[41] Luković, T.: Nautical Tourism. Dubronik, 2013. [42] Möller, K.: Controlling-Prozessmodell 2.0. Leitfaden für die
Beschreibung und Gestaltung von Controlling-Prozessen. 2. Auflage. Haufe-Verlag. Freiburg – München – Stuttgart. 2017.
[43] Morris, D.: BAYES THEOREM. A visual introduction for beginners. Blue Windmill Media. Printed by Amazon, Leipzig. 2017.
108 U. Lebefromm / Scientific Journal of Maritime Research 35 (2021) 100-108
[44] Nasca, D., Munck, J.-Chr., Gleich, R.: Controlling-Hauptproz-esse: Einfluss der digitalen Transformation. Investigation April – June 2018. In: Gleich, R., et al., 2018. Digitalisierung und Controlling. pp. 73.
[45] Peović, K.: Die politische und wirtschaftliche Situation Kroatiens – die Peripherie Europas heute. Blog. Published in: “transform europe“. Vienna. 2018.
[46] Runkler, A.: Data Mining – Modelle und Algorithmen intelli-genter Datenanalyse. 2nd Edition. Springer-Vieweg‚ Wiesbaden. 2015.
[47] Russell, St., Norvig, P.: Künstliche Intelligenz. Ein moderner Ansatz. 3. Aufl. Pearson DE, München. 2012. pp. 863.
[48] Schäffer, U.: Levers of Organizational Resilience. In: Control-Schäffer, U.: Levers of Organizational Resilience. In: Control-In: Control-ling & Management Review. Zeitschrift für Controlling & Management. 64, Jahrgang. Ausgabe 6-7. 2020. pp. 8–19.
[49] Schäffer, U., Weber, J: Digitalization will radically change con-Schäffer, U., Weber, J: Digitalization will radically change con-trolling. In Schäffer, U: Behavioral Controlling- Anniversary Volume in Honor of Jürgen Weber, Springer. 2019. pp. 160.
[50] Steinke, K.-H.; Schmidt, W.: Auf dem Weg zum Controlling 4.0 – Leitfaden für Controlling im Wandel. Haufe-Lexware, Freiburg. 2017.
[51] Stiegler, St. M.: Who discovered Bayes Theorem. The Ameri-Stiegler, St. M.: Who discovered Bayes Theorem. The Ameri-can Statistician. 1983. Vol. 37. No. 4.
[52] Stiegler, St. M.: Richard Price, the first Bayesian. Statistical Science, 2018. Vol. 33. No. 1. pp. 117–122. Institute of Math-Institute of Math-ematical Statistics.
[53] Subbalakshmi, G., Ramesh, K., Chinna Rao M.: Decision Sup-Subbalakshmi, G., Ramesh, K., Chinna Rao M.: Decision Sup-port in Heart Disease Prediction System using Naive Bayes.
Indian Journal of Computer Science and Engineering (IJCSE). Vol. 2. No. 2. 2011.
[54] Tschandl, M., Kogleck, R.: Controller als Innovatoren: Von der Digitalisierungs-Roadmap zum neuen Geschäftsmodell. In: Gleich, R., et al.: Digitalisierung und Controlling – Tech-nologien – Instrumente – Praxisbeispiele. Haufe. 2018. pp. 27–48.
[55] Vapnik, V. N.: Inductive principals of statistics and learning theory. In: Yearbook of the Academy of Science of the USSR on Recognition, Classification and Forecasting (in Russian). Vol. 1, Nauka, Moscow. (English translation: V.N. Vapnik, Inductive principles of statistics and learning theory. In: Mathematical Perspectives on Neural Networks, Smolensky, Mozer and Rumelhart, eds., Lawrence, Erlbaum Associates. Springer New York. 1996.
[56] Vapnik, V. N.: Statistical Learning Theory. A Volume in the Wiley Series on Adaptive and Learning Systems for Signal Processing. Communications, and Control. Simon Haykin, Series Editor. Wiley. 1998. Reprint 2018. London. New Delhi.
[57] Vapnik, V. N., Chevronenkis, A. Ya.: The necessary and suffi-cient conditions for consistency of the method of empirical risk minimization. Yearbook of the Academy of Science of the USSR on Recognition, Classification and Forecasting. Vol. 2, Nauka, Moscow, pp. 207–249 (in Russian). Enlish translation: V. N. Vapnik and A. Ya. Chevronenkis (1991). The necessary and sufficient conditions for consistency of the method of empirical risk minimization. Pattern Recog-nition. Image Anal.1(3), pp. 284–305.