Prediction of Respiratory Motion Using A Statistical 4D Mean Motion ...
12
Prediction of Respiratory Motion Using A Statistical 4D Mean Motion Model Jan Ehrhardt 1 , Ren´ e Werner 1 , Alexander Schmidt–Richberg 1 , and Heinz Handels 1 Department of Medical Informatics, University Medical Center Hamburg–Eppendorf, Germany, [email protected] Abstract. In this paper we propose an approach to generate a 4D sta- tistical model of respiratory lung motion based on thoracic 4D CT data of different patients. A symmetric diffeomorphic intensity–based registra- tion technique is used to estimate subject–specific motion models and to establish inter–subject correspondence. The statistics on the diffeomor- phic transformations are computed using the Log–Euclidean framework. We present methods to adapt the genererated statistical 4D motion model to an unseen patient–specific lung geometry and to predict individ- ual organ motion. The prediction is evaluated with respect to landmark and tumor motion. Mean absolute differences between model–based pre- dicted landmark motion and corresponding breathing–induced landmark displacements as observed in the CT data sets are 3.3 ± 1.8 mm consid- ering motion between end expiration to end inspiration, if lung dynamics are not impaired by lung disorders. The statistical respiratory motion model presented is capable of provid- ing valuable prior knowledge in many fields of applications. We present two examples of possible applications in the fields of radiation therapy and image guided diagnosis. 1 Introduction Respiration causes significant motion of thoracical and abdominal organs and thus is a source of inaccuracy in image guided interventions and in image acqui- sition itself. Therefore, modeling and prediction of breathing motion has become an increasingly important issue within many fields of application, e.g in radiation therapy [1]. Based on 4D images, motion estimation algorithms enable to determine patient–specific spatiotemporal information about movements and organ defor- mation during breathing. A variety of respiratory motion estimation approaches have been developed in the last years, ranging from using simple analytical functions to describe the motion over landmark–, surface– or intensity–based registration techniques [2,3] to biophysical models of the lung [4]. However, the computed motion models are based on individual 4D image data and their use is usually confined to motion analysis and prediction of an individual patient. The key contribution of this article is the generation of a statistical 4D inter– individual motion model of the lung. A symmetric diffeomorphic non–linear Second International Workshop on Pulmonary Image Processing -3-
-
Upload
nguyenliem -
Category
Documents
-
view
216 -
download
0
Transcript of Prediction of Respiratory Motion Using A Statistical 4D Mean Motion ...
Prediction of Respiratory Motion Using AStatistical 4D Mean Motion Model
Jan Ehrhardt1, Rene Werner1, Alexander Schmidt–Richberg1, and HeinzHandels1
Department of Medical Informatics, University Medical Center Hamburg–Eppendorf,Germany, [email protected]
Abstract. In this paper we propose an approach to generate a 4D sta-tistical model of respiratory lung motion based on thoracic 4D CT dataof different patients. A symmetric diffeomorphic intensity–based registra-tion technique is used to estimate subject–specific motion models and toestablish inter–subject correspondence. The statistics on the diffeomor-phic transformations are computed using the Log–Euclidean framework.We present methods to adapt the genererated statistical 4D motionmodel to an unseen patient–specific lung geometry and to predict individ-ual organ motion. The prediction is evaluated with respect to landmarkand tumor motion. Mean absolute differences between model–based pre-dicted landmark motion and corresponding breathing–induced landmarkdisplacements as observed in the CT data sets are 3.3± 1.8 mm consid-ering motion between end expiration to end inspiration, if lung dynamicsare not impaired by lung disorders.The statistical respiratory motion model presented is capable of provid-ing valuable prior knowledge in many fields of applications. We presenttwo examples of possible applications in the fields of radiation therapyand image guided diagnosis.
1 Introduction
Respiration causes significant motion of thoracical and abdominal organs andthus is a source of inaccuracy in image guided interventions and in image acqui-sition itself. Therefore, modeling and prediction of breathing motion has becomean increasingly important issue within many fields of application, e.g in radiationtherapy [1].
Based on 4D images, motion estimation algorithms enable to determinepatient–specific spatiotemporal information about movements and organ defor-mation during breathing. A variety of respiratory motion estimation approacheshave been developed in the last years, ranging from using simple analyticalfunctions to describe the motion over landmark–, surface– or intensity–basedregistration techniques [2, 3] to biophysical models of the lung [4]. However, thecomputed motion models are based on individual 4D image data and their useis usually confined to motion analysis and prediction of an individual patient.
The key contribution of this article is the generation of a statistical 4D inter–individual motion model of the lung. A symmetric diffeomorphic non–linear
Second International Workshop on Pulmonary Image Processing
-3-
intensity–based registration algorithm is used to estimate lung motion from aset of 4D CT images from different patients acquired during free breathing. Thecomputed vector motion fields are transformed into a common coordinate sys-tem and a 4D mean motion model (4D–MMM) of the respiratory lung motionis extracted using the Log–Euclidean framework [5] to compute statistics on thediffeomorphic transformations. Furthermore, methods are presented to adapt thecomputed 4D–MMM to the patient’s anatomy in order to predict individual or-gan motion without 4D image information. We perform a quantitative in–depthevaluation of the model–based prediction accuracy for intact and impaired lungsand two possible applications of the 4D–MMM in the fields of radiation therapyand image guided diagnosis are shown.
Few works that deal with the development of statistical lung motion modelshave been published. Some approaches exist for the generation of 3D lung at-lases [6], or the geometry–based simulation of cardiac and respiratory motions[7]. First steps towards an average lung motion model generated from differentpatients were done by Sundaram et al. [8], but their work focuses on 2D+t lungMR images and the adaptation of the breathing model to a given patient has notbeen addressed. First methods for building inter–patient models of respiratorymotion and the utilization of the generated motion model for model–based pre-diction of individual breathing motion were presented in [9] and [10]. This paperis an extension of [10] with regard to the methodology and the quantitative eval-uation. In [9] motion models were generated by applying a Principal ComponentAnalysis (PCA) to motion fields generated by a surface–based registration in apopulation of inhale–exhale pairs of CT images. Our approach is different in allaspects: the registration method, the solution of the correspondance problem,the spatial transformation of motion fields, and the computation of statisticsof the motion fields. Furthermore, we present a detailed quantitative evaluationof a model based prediction for intact and impaired lungs. This offers interest-ing insights into the prediction accuracy to be expected depending on size andposition of lung tumors.
2 Method
The goal of our approach is to generate a statistical model of the respiratorylung motion based on a set of Np thoracic 4D CT image sequences. Each 4Dimage sequence is assumed to consist of Nj 3D image volumes Ip,j : Ω → R(Ω ⊂ R3), which are acquired at corresponding states of the breathing cycle.This correspondance is ensured by the applied 4D image reconstruction method[11] and therefore, a temporal alignment of the patient data sets is not necessary.
Our method consists of three main steps: First, the subjectspecific motionis estimated for each 4D image sequence by registering the 3D image frames.In a second step, an average shape and intensity model is generated from theCT images. In the last step, the average shape and intensity model is used asanatomical reference frame to match all subject-specific motion models and tobuild an average intersubject model of the respiratory motion.
-4- Second International Workshop on Pulmonary Image Processing
Image registration is required in all three steps. We use a non–linear, intensity–based, diffeomorphic registration method as described in the next section. Thethree steps to generate the statistical model of the respiratory motion are de-tailed in Sect. 2.2. The utilization of the 4D–MMM for motion predicition ispresented in Sect. 2.3.
2.1 Diffeomorphic image registration
Diffeomorphic mappings ϕ : Ω → Ω, (ϕ ∈ Diff(Ω), Ω ⊂ Rd) guaranteethat the topology of the transformed objects is preserved and are therefore usedin computational anatomy to analyze and characterize the biological variabil-ity of human anatomy [12]. A practical approach for fast diffeomorphic imageregistration was recently proposed in [13] by constraining ϕ to a subgroup ofdiffeomorphisms. Here, diffeomorphisms are parametrized by a stationary veloc-ity field v, and the diffeomorphic transformation ϕ is given by the solution ofthe stationary flow equation at time t = 1 [5]:
∂
∂tφ(x, t) = v(φ(x, t)) and φ(x, 0) = x. (1)
The solution of eq. (1) is given by the group exponential map ϕ(x) = φ(x, 1) =exp(v(x)) and the significant advantage of this approach is that these exponen-tials can be computed very efficiently (see [5] for details).
The problem of image registration can now be understood as finding a para-metrizing velocity field v, so that the diffeomorphic transformation ϕ = exp(v)minimizes a distanceD between a reference image I0 and the target image Ij withrespect to a desired smoothness S of the transformation: J [ϕ] = D[I0, Ij ;ϕ] +αS[ϕ]. Using S[ϕ] =
∫Ω‖∇v‖2dx (with ϕ = exp(v)) as regularization scheme,
the following iterative registration algorithm can be derived:
Algorithm 1 Symmetric diffeomorphic registrationSet v0 = 0, ϕ = ϕ−1 = Id and k = 0repeat
Compute the update step u = 12
“fI0,Ijϕ − fIj ,I0ϕ−1
”Update the velocity field and perform a diffusive regularization:
vk+1 = (Id− τα∆)−1“vk + τu
”(2)
Calculate ϕ = exp(vk+1) and ϕ−1 = exp(−vk+1)Let k ← k + 1
until ‖vk+1 − vk‖ < ε or k ≥ Kmax
Second International Workshop on Pulmonary Image Processing
-5-
The update field u is calculated in an inverse consistent form to assure sourceto target symmetry. The force term f is related to D and is chosen to be:
fI0,Ijϕ(x) = − (I0(x)− (Ij ϕ)(x))∇(Ij ϕ)(x)‖∇(Ij ϕ)(x)‖2 + κ2(I0(x)− (Ij ϕ)(x))2
(3)
with κ2 being the reciprocal of the mean squared spacing. Eq. (2) performs theupdate of the velocity field v, where τ is the step width. The term (Id− τα∆)−1
is related to the diffusive smoother S and can be computed efficiently usingadditive operator splitting (AOS).
We have chosen this diffeomorphic registration approach because of three rea-sons: In the context of the motion model generation, it is important to ensurethat the calculated transformations are symmetric and diffeomorphic because ofthe multiple usage of inverse transformations. The second reason is related toruntime and memory requirements: due to the size of the 4D CT images dif-feomorphic registration algorithms using non–stationary vector fields, e.g. [14],are not feasible. Third, the representation of diffeomorphic transformations bystationary vector fields provides a simple way for computing statistics on diffeo-morphisms via vectorial statistics on the velocity fields.
For a diffeomorphism ϕ = exp(v), we call the velocity field v = log(ϕ) thelogarithm of ϕ. Remarkably, the logarithm v = log(ϕ) is a simple 3D vectorfield and this allows to perform vectorial statistics on diffeomorphisms, whilepreserving the invertibility constraint [15]. Thus, the Log-Euclidean mean ofdiffemorphisms is given by averaging the parametrizing velocity fields:
ϕ = exp
(1N
∑i
log(ϕi)
). (4)
The mean and the distance are inversion-invariant, since log(ϕ) = − log(ϕ−1).Even though the metric linked to this distance is not translation invariant, itprovides a powerful framework where statistics can be computed more efficientlythan in the Riemannian distance framework. For a more detailed introduction tothe mathematics of the diffeomorphism group and the associated tangent spacealgebra, we refer to [5] and the references therein.
2.2 Generation of a 4D mean motion model
In the first step, we estimate the intra–patient respiratory motion for each 4Dimage sequence by registering the 3D image frames. Let Ip,j : Ω → R (Ω ⊂ R3)be the 3D volume of subject p ∈ 1, . . . , Np acquired at respiratory state j ∈0, . . . , Nj − 1. Maximum inhale is chosen as reference breathing state and thediffeomorphic transformations ϕp,j : Ω → Ω are computed by registering thereference image Ip,0 with the target images Ip,j , j ∈ 1, . . . , Nj − 1. In orderto handle discontinuities in the respiratory motion between pleura and rib cage,lung segmentation masks are used to restrict the registration to the lung regionby computing the update field only inside the lung (see [3] for details).
-6- Second International Workshop on Pulmonary Image Processing
In order to build a statistical model of respiratory motion, correspondencebetween different subjects has to be established, i.e. an anatomical referenceframe is necessary. Therefore, the reference images Ip,0 for p = 1, . . . , Np areused to generate an average intensity and shape atlas I0 of the lung in thereference breathing state by the method described in [10]. This 3D atlas imageI0 is now used as reference frame for the statistical lung motion model. Eachpatient–specific reference image Ip,0 is mapped to the average intensity and shapeatlas I0 by an affine alignment and a subsequent diffeomorphic registration.
Let ψp be the transformation between the reference image Ip,0 of subject pand the atlas image I0. Since the intra–subject motion models ϕp,j are definedin the anatomical spaces of Ip,0, we apply a coordinate transformation
ϕp,j = ψp ϕp,j ψ−1p (5)
to transfer the intra–subject deformations into the atlas coordinate space. Sucha coordinate transformation accounts for the differences in the coordinate sys-tems of subject and atlas due to misalignment and size/shape variation andeliminates subject–specific size, shape and orientation information in the de-formation vectors. This enables the motion fields of each of the subjects to becompared directly quantitatively and qualitatively and the 4D–MMM is gener-ated by calculating the Log-Euclidean mean ϕj of the mapped transformationsfor each breathing state j:
ϕj = exp
(1
Np
∑p
log (ϕp,j)
)= exp
(1
Np
∑p
log(ψp ϕp,j ψ−1
p
)). (6)
The method proposed in [16] was used to compute the logarithms log (ϕp,j).The resulting 4D–MMM consists of an average lung image I0 for a refer-
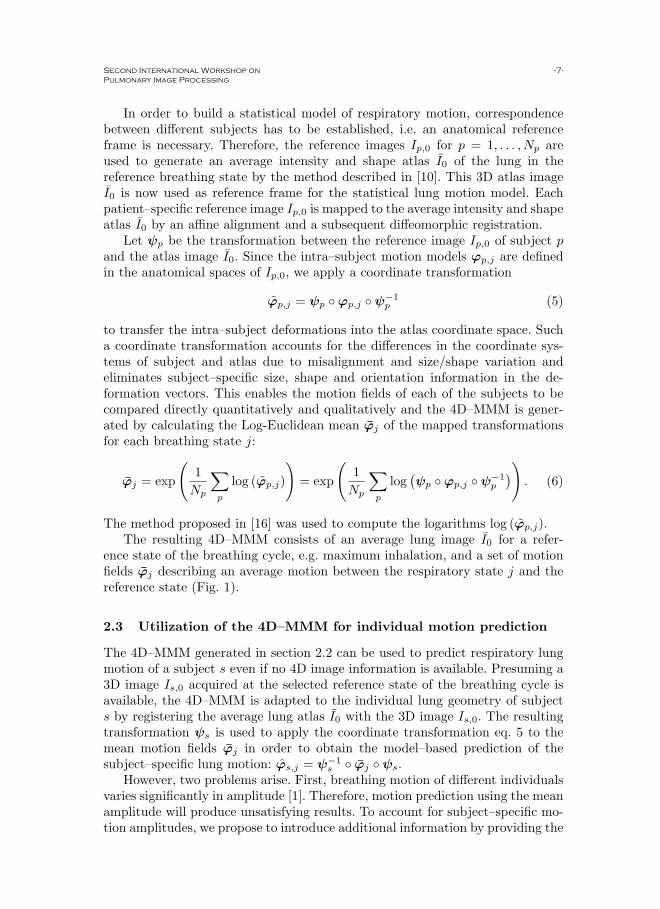
ence state of the breathing cycle, e.g. maximum inhalation, and a set of motionfields ϕj describing an average motion between the respiratory state j and thereference state (Fig. 1).
2.3 Utilization of the 4D–MMM for individual motion prediction
The 4D–MMM generated in section 2.2 can be used to predict respiratory lungmotion of a subject s even if no 4D image information is available. Presuming a3D image Is,0 acquired at the selected reference state of the breathing cycle isavailable, the 4D–MMM is adapted to the individual lung geometry of subjects by registering the average lung atlas I0 with the 3D image Is,0. The resultingtransformation ψs is used to apply the coordinate transformation eq. 5 to themean motion fields ϕj in order to obtain the model–based prediction of thesubject–specific lung motion: ϕs,j = ψ−1
s ϕj ψs.However, two problems arise. First, breathing motion of different individuals
varies significantly in amplitude [1]. Therefore, motion prediction using the meanamplitude will produce unsatisfying results. To account for subject–specific mo-tion amplitudes, we propose to introduce additional information by providing the
Second International Workshop on Pulmonary Image Processing
-7-
(a) (b)
Fig. 1. Visualization of average lung model I0 (a) and magnitude of mean deformationϕj between end inspiration and end expiration (b). The average deformation modelshows a typical respiratory motion pattern. Different windowing and leveling functionsare used to accentuate inner/outer lung structures.
required change in lung air content ∆Vair. Even without 4D-CT data, this infor-mation can be acquired by spirometry measurements. Thus, we search a scalingfactor λ so that the air content of the transformed reference image Is,0 λϕ−1
s,j
is close to the air content Vair (Is,0) + ∆Vair. In order to ensure that the scaledmotion field is diffeomorphic, the scaling is performed in the Log–Euclidean. Todetermine the correct scaling factor λ, a binary search strategy is applied andthe air content is computed using the method described in [17]. ∆Vair can beregarded as a parameter that describes the depth of respiration. In general, othermeasurements can also be used to calculate appropriate scaling factors, e.g. theamplitude of the diaphragm motion.
Further, a second problem arises when predicting individual breathing motionof lung cancer patients. Lung tumors will impair the atlas–patient registrationbecause there is no corresponding structure in the atlas. This leads to distortionsin ψs near the tumor region and consequently the predicted motion fields ϕs,j areaffected. Therefore, we decided to compute ψs by registering lung segmentationmasks from atlas and subject s and by omitting the inner lung structures.
3 Results
To capture the respiratory motion of the lung, 18 4D CT images were acquiredusing a 16–slice CT scanner operating in cine-mode. The scanning protocol andoptical–flow based reconstruction method was described in [11]. The spatial res-olution of the reconstructed 4D CT data sets is between 0.78 × 0.78 × 1.5mm3
and 0.98× 0.98× 1.5mm3. Each data set consists of 3D CT images at 10 to 14preselected breathing phases. Due to computation times, in this study we usethe following 4 phases of the breathing cycle: end inspiration (EI), 42% exhale(ME), end expiration (EE) and 42% inhale (MI). A clinical expert delineatedleft and right lung and the lung tumors in the images.
-8- Second International Workshop on Pulmonary Image Processing
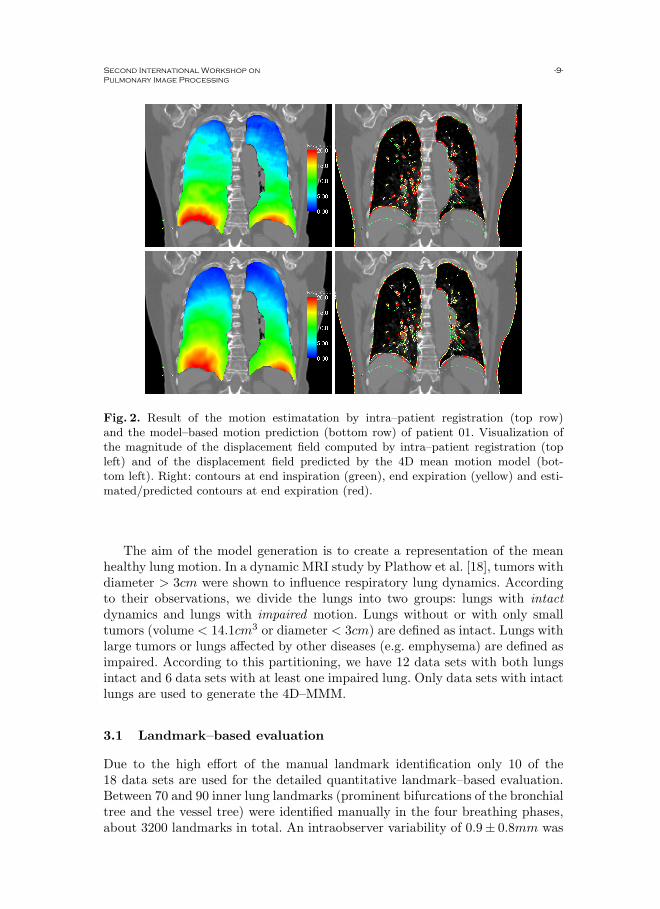
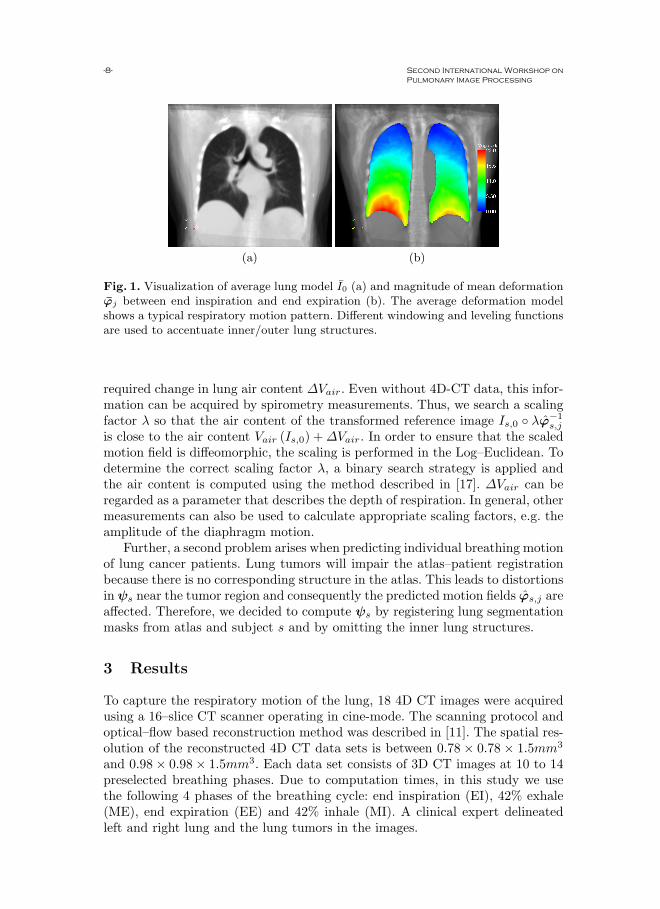
Fig. 2. Result of the motion estimatation by intra–patient registration (top row)and the model–based motion prediction (bottom row) of patient 01. Visualization ofthe magnitude of the displacement field computed by intra–patient registration (topleft) and of the displacement field predicted by the 4D mean motion model (bot-tom left). Right: contours at end inspiration (green), end expiration (yellow) and esti-mated/predicted contours at end expiration (red).
The aim of the model generation is to create a representation of the meanhealthy lung motion. In a dynamic MRI study by Plathow et al. [18], tumors withdiameter > 3cm were shown to influence respiratory lung dynamics. Accordingto their observations, we divide the lungs into two groups: lungs with intactdynamics and lungs with impaired motion. Lungs without or with only smalltumors (volume < 14.1cm3 or diameter < 3cm) are defined as intact. Lungs withlarge tumors or lungs affected by other diseases (e.g. emphysema) are defined asimpaired. According to this partitioning, we have 12 data sets with both lungsintact and 6 data sets with at least one impaired lung. Only data sets with intactlungs are used to generate the 4D–MMM.
3.1 Landmark–based evaluation
Due to the high effort of the manual landmark identification only 10 of the18 data sets are used for the detailed quantitative landmark–based evaluation.Between 70 and 90 inner lung landmarks (prominent bifurcations of the bronchialtree and the vessel tree) were identified manually in the four breathing phases,about 3200 landmarks in total. An intraobserver variability of 0.9± 0.8mm was
Second International Workshop on Pulmonary Image Processing
-9-
Table 1. Landmark motion amplitudes and target registration errors REE for thepatients considered (in mm). Values are averaged over all landmarks per lung. Lungswith impaired motion are indicated by a gray text color.
Landmark Intra-patient Model-basedmotion registration prediction
Data set (Lung) [mm] TRE [mm] TRE [mm]
Patient01 left 4,99 ± 4,84 1,51 ± 1,31 2.43 ± 1,64right 7,25 ± 4,47 1,41 ± 0,83 3.97 ± 2,08
Patient02 left 7,09 ± 2,92 2,28 ± 1,73 4.26 ± 1,28right 4,21 ± 1,75 1,16 ± 0,61 3.82 ± 1,14
Patient03 left 6,15 ± 2,26 1,38 ± 0,73 3.68 ± 1,31right 6,28 ± 2,01 1,78 ± 1,05 3.72 ± 1,37
Patient04 left 6,65 ± 2,56 1,53 ± 0,93 4.01 ± 1,60right 6,22 ± 3,52 1,44 ± 0,82 2.28 ± 1,09
Patient05 left 5,77 ± 2,03 1,50 ± 0,80 3.17 ± 1,34right 3,18 ± 3,36 1,29 ± 1,04 3.47 ± 1,99
Patient06 left 9,67 ± 8,32 1,64 ± 1,42 5.85 ± 2,65right 11,85 ± 7,08 1,60 ± 1,00 4.88 ± 2,02
Patient07 left 8,22 ± 6,52 2,45 ± 2,22 3.99 ± 1,79right 4,99 ± 6,65 1,49 ± 1,48 3.35 ± 1,69
Patient08 left 5,78 ± 4,14 1,18 ± 0,57 3.15 ± 1,70right 6,28 ± 5,63 1,25 ± 1,03 3.11 ± 2,24
Patient09 left 7,43 ± 5,34 1,42 ± 1,22 3.05 ± 1,39right 8,41 ± 5,22 1,67 ± 1,03 4.94 ± 3,01
Patient10 left 7,63 ± 5,83 1,93 ± 2,10 3.16 ± 2,29right 8,85 ± 6,76 1,76 ± 1,33 5.12 ± 2,34
assessed by repeated landmark identification in all test data sets. The targetregistration error (TRE) was determined for a quantitative evaluation of thepatient–specific registration method and the model–based prediction. The TRERk
j is the difference between the motion of landmark k estimated by ϕj and thelandmark motion as observed by the medical expert.
The mean landmark motion magnitude, i.e. the mean distance of correspond-ing landmarks, between EI and EE is 6.8±5.4mm, (2.6±1.6mm between EI andME and 5.0 ± 2.8mm between EI and MI). The TRE of the intra–patient reg-istration is a lower bound for the accuracy of the model–based prediction usingthe 4D–MMM. The average TRE REE between the reference phase (EI) and EEfor patient 01 to 10 (averaged over all landmarks and patients) is 1.6 ± 1.3mm(1.5±0.8mm between EI and ME and 1.6±0.9mm between EI and MI). Detailsfor all test data sets are shown in table 1.
For each of the 10 test data sets the 4D–MMM is used to predict landmarkmotion as described in Sect. 2.3. If both lungs of the test data set are intact,a leave–one–out strategy is applied to ensure that the patient data is not usedfor the model generation. The change in lung air content ∆Vair needed for thecomputation of the scaling factor λ was calculated from the CT images IEI andIEE for each lung side and each test data set. The same factor λ was used to
-10- Second International Workshop on Pulmonary Image Processing
scale the predicted motion fields ϕEE , ϕME and ϕMI . Besides ∆Vair no 4Dinformation is used for the model–based prediction.
In Fig. 2 the motion field predicted by the 4D–MMM is compared to themotion field computed by patient–specific registration. A good correspondencybetween the motion fields is visible, except in the right upper lobe where smalldeviations occur. The prediction accuracy is illustrated by overlayed contours.
The average TREs REE are listed in table 1 for each of the test data sets andfor both the patient–specific and model–based motion estimation. Lungs withimpaired motion are indicated by a gray text color. Regarding table 1, lungs withimpaired motion generally show higher TREs for the model–based predictionthan intact lungs. The average TRE REE for intact lungs is 3.3±1.8mm, whichis significantly lower (p < 0.01) than for lungs with impaired motion (REE =4.2± 2.2mm). Significance is tested by applying a multilevel hierarchical modelwith the individual Rk values nested within the patient (software: SPSS v.17);data are logarithmized to ensure normal distribution and the model is adjustedto landmark motion.
3.2 Model-based prediction of tumor motion
For a second evaluation of the model, we use expert generated tumor segmenta-tions in two breathing phases (EI and EE) of 9 patient data sets with solid lungtumors. The 4D–MMM is transformed into the coordinate space of each testdata set (see Sect. 2.3) and then used to warp the expert–generated tumor seg-mentation at maximum exhale towards maximum inhale. The distance betweenthe predicted tumor mass center and the center of the manual segmentationwas used to evaluate the accuracy of the model–based prediction. Correspond-ing results are summarized in table 2. Large tumors with a diameter > 3cm aremarked in the table as “large”.
Regarding table 2 accuracy of the model–based predicted motion of the tu-mor mass center from EI to EE ranges from 0.66mm to 7.38mm. There is nosignificant correlation between the tumor motion amplitude and the accuracyof the model-based predicted mass center (r = 0.19, p > 0.15). Furthermore, itcannot be shown that the prediction accuracy for small tumors is significantlybetter than for large tumors (p > 0.4). In contrast, the model–based predictionaccuracy of non-adherent tumors is significantly better than for tumors adher-ing to chest wall or hilum (p < 0.05). In these cases the model presumes thetumour moves like surrounding lung tissue, whereas it rather moves like the ad-jacent non-lung structure (e.g. chest wall or hilum). In the last column in table 2those tumors are tagged. Significance is tested by applying a linear mixed model(software: SPSS v.17) and the model is adjusted to tumor motion.
4 Discussion
In this paper, we proposed a method to generate an inter–subject statisticalmodel of the breathing motion of the lung, based on individual motion fields
Second International Workshop on Pulmonary Image Processing
-11-
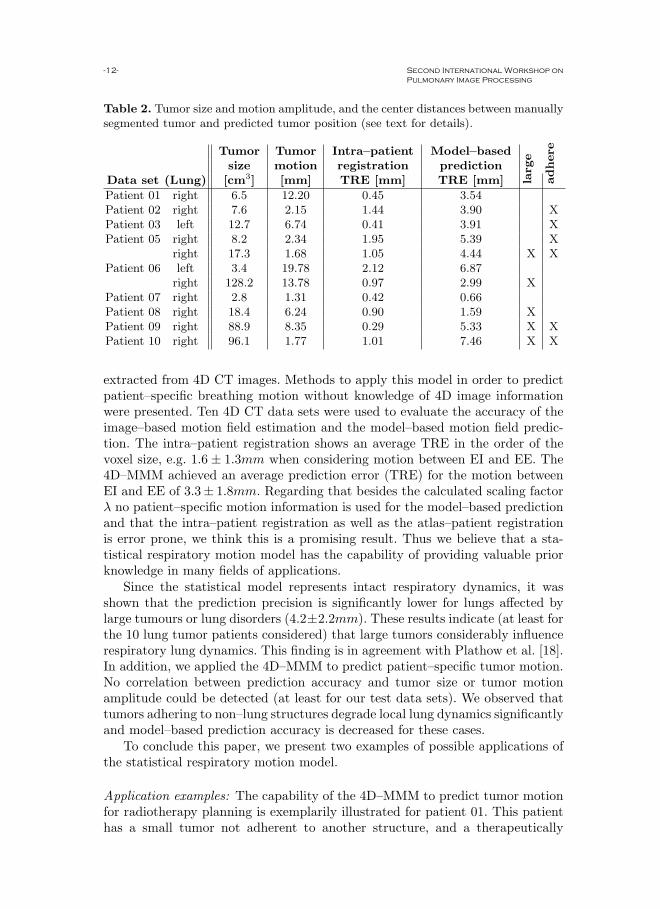
Table 2. Tumor size and motion amplitude, and the center distances between manuallysegmented tumor and predicted tumor position (see text for details).
Tumor Tumor Intra–patient Model–basedsize motion registration prediction
Data set (Lung) [cm3] [mm] TRE [mm] TRE [mm] larg
e
adhere
Patient 01 right 6.5 12.20 0.45 3.54Patient 02 right 7.6 2.15 1.44 3.90 XPatient 03 left 12.7 6.74 0.41 3.91 XPatient 05 right 8.2 2.34 1.95 5.39 X
right 17.3 1.68 1.05 4.44 X XPatient 06 left 3.4 19.78 2.12 6.87
right 128.2 13.78 0.97 2.99 XPatient 07 right 2.8 1.31 0.42 0.66Patient 08 right 18.4 6.24 0.90 1.59 XPatient 09 right 88.9 8.35 0.29 5.33 X XPatient 10 right 96.1 1.77 1.01 7.46 X X
extracted from 4D CT images. Methods to apply this model in order to predictpatient–specific breathing motion without knowledge of 4D image informationwere presented. Ten 4D CT data sets were used to evaluate the accuracy of theimage–based motion field estimation and the model–based motion field predic-tion. The intra–patient registration shows an average TRE in the order of thevoxel size, e.g. 1.6± 1.3mm when considering motion between EI and EE. The4D–MMM achieved an average prediction error (TRE) for the motion betweenEI and EE of 3.3± 1.8mm. Regarding that besides the calculated scaling factorλ no patient–specific motion information is used for the model–based predictionand that the intra–patient registration as well as the atlas–patient registrationis error prone, we think this is a promising result. Thus we believe that a sta-tistical respiratory motion model has the capability of providing valuable priorknowledge in many fields of applications.
Since the statistical model represents intact respiratory dynamics, it wasshown that the prediction precision is significantly lower for lungs affected bylarge tumours or lung disorders (4.2±2.2mm). These results indicate (at least forthe 10 lung tumor patients considered) that large tumors considerably influencerespiratory lung dynamics. This finding is in agreement with Plathow et al. [18].In addition, we applied the 4D–MMM to predict patient–specific tumor motion.No correlation between prediction accuracy and tumor size or tumor motionamplitude could be detected (at least for our test data sets). We observed thattumors adhering to non–lung structures degrade local lung dynamics significantlyand model–based prediction accuracy is decreased for these cases.
To conclude this paper, we present two examples of possible applications ofthe statistical respiratory motion model.
Application examples: The capability of the 4D–MMM to predict tumor motionfor radiotherapy planning is exemplarily illustrated for patient 01. This patienthas a small tumor not adherent to another structure, and a therapeutically
-12- Second International Workshop on Pulmonary Image Processing
(a) (b)
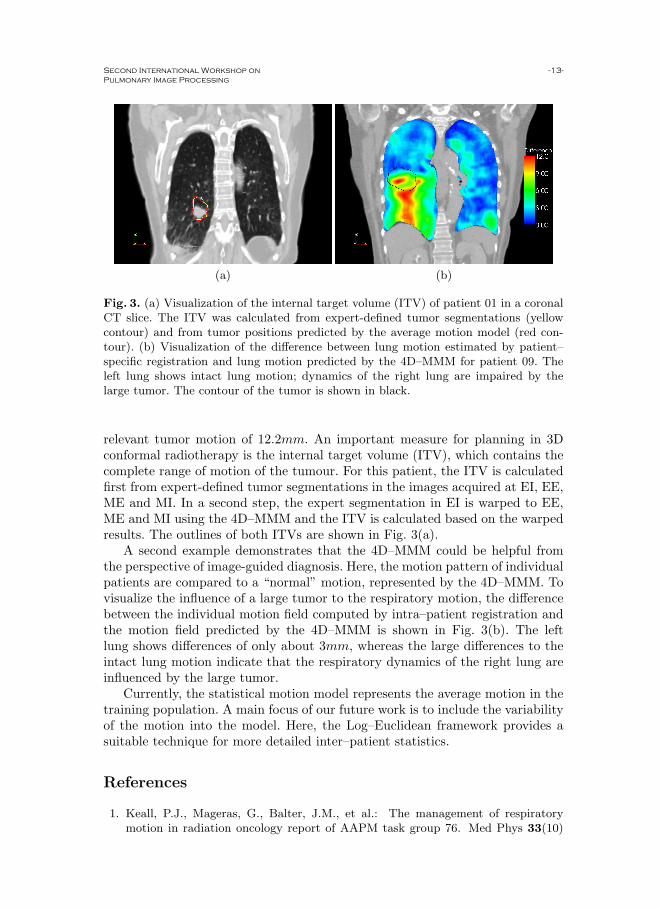
Fig. 3. (a) Visualization of the internal target volume (ITV) of patient 01 in a coronalCT slice. The ITV was calculated from expert-defined tumor segmentations (yellowcontour) and from tumor positions predicted by the average motion model (red con-tour). (b) Visualization of the difference between lung motion estimated by patient–specific registration and lung motion predicted by the 4D–MMM for patient 09. Theleft lung shows intact lung motion; dynamics of the right lung are impaired by thelarge tumor. The contour of the tumor is shown in black.
relevant tumor motion of 12.2mm. An important measure for planning in 3Dconformal radiotherapy is the internal target volume (ITV), which contains thecomplete range of motion of the tumour. For this patient, the ITV is calculatedfirst from expert-defined tumor segmentations in the images acquired at EI, EE,ME and MI. In a second step, the expert segmentation in EI is warped to EE,ME and MI using the 4D–MMM and the ITV is calculated based on the warpedresults. The outlines of both ITVs are shown in Fig. 3(a).
A second example demonstrates that the 4D–MMM could be helpful fromthe perspective of image-guided diagnosis. Here, the motion pattern of individualpatients are compared to a “normal” motion, represented by the 4D–MMM. Tovisualize the influence of a large tumor to the respiratory motion, the differencebetween the individual motion field computed by intra–patient registration andthe motion field predicted by the 4D–MMM is shown in Fig. 3(b). The leftlung shows differences of only about 3mm, whereas the large differences to theintact lung motion indicate that the respiratory dynamics of the right lung areinfluenced by the large tumor.
Currently, the statistical motion model represents the average motion in thetraining population. A main focus of our future work is to include the variabilityof the motion into the model. Here, the Log–Euclidean framework provides asuitable technique for more detailed inter–patient statistics.
References
1. Keall, P.J., Mageras, G., Balter, J.M., et al.: The management of respiratorymotion in radiation oncology report of AAPM task group 76. Med Phys 33(10)
Second International Workshop on Pulmonary Image Processing
-13-
(2006) 3874–39002. Vik, T., Kabus, S., von Berg, J., Ens, K., Dries, S., Klinder, T., Lorenz, C.: Vali-
dation and comparison of registration methods for free-breathing 4D lung CT. In:SPIE Medical Imaging 2008. Volume 6914., SPIE (2008) 2P
3. Werner, R., Ehrhardt, J., Schmidt-Richberg, A., Handels, H.: Validation and com-parison of a biophysical modeling approach and non-linear registration for estima-tion of lung motion fields in thoracic 4D CT data. In: SPIE Medical Imaging 2009:Image Processing. Volume 7259. (2009) 0U–1–8
4. Werner, R., Ehrhardt, J., Schmidt, R., Handels, H.: Patient-specific finite elementmodeling of respiratory lung motion using 4D CT image data. Med Phys 35(5)(May 2009) 1500–1511
5. Arsigny, V.: Processing Data in Lie Groups: An Algebraic Approach. Applicationto Non-Linear Registration and Diffusion Tensor MRI. These de sciences (phdthesis), Ecole polytechnique (November 2006)
6. Li, B., Christensen, G.E., Hoffman, E.A., McLennan, G., Reinhardt, J.M.: Estab-lishing a normative atlas of the human lung: intersubject warping and registrationof volumetric CT images. Acad Radiol 10 (2003) 255–265
7. Segars, W., Lalush, D., Tsui, B.: Modeling respiratory mechanics in the MCATand spline-based MCAT phantoms. IEEE Trans Nucl Sci 48(1) (Feb 2001) 89–97
8. Sundaram, T.A., Avants, B.B., Gee, J.C.: A dynamic model of average lung defor-mation using capacity-based reparameterization and shape averaging of lung mrimages. In: MICCAI 2004, Springer (2004) 1000–1007
9. Klinder, T., Lorenz, C., Ostermann, J.: Respiratory motion modeling and estima-tion. In: Workshop on Pulmonary Image Analysis, New York, USA (2008) 53–62
10. Ehrhardt, J., Werner, R., Schmidt-Richberg, A., Schulz, B., Handels, H.: Genera-tion of a mean motion model of the lung using 4D CT data. In: Visual Computingfor Biomedicine, Delft, Eurographics Association (2008) 69–76
11. Ehrhardt, J., Werner, R., Saring, D., Frenzel, T., Lu, W., Low, D., Handels, H.:An optical flow based method for improved reconstruction of 4D CT data setsacquired during free breathing. Med Phys 34(2) (Feb 2007) 711–721
12. Miller, M.I.: Computational anatomy: shape, growth, and atrophy comparison viadiffeomorphisms. NeuroImage 23 Suppl 1 (2004) S19–S33
13. Vercauteren, T., Pennec, X., Perchant, A., Ayache, N.: Symmetric log-domaindiffeomorphic registration: a demons-based approach. In: Med Image ComputComput Assist Interv, MICCAI 2008, Springer (2008) 754–761
14. Beg, M.F., Miller, M.I., Trouve, A., Younes, L.: Computing large deformationmetric mappings via geodesic flows of diffeomorphisms. Int J Comp Vis 61(2)(2005) 139–157
15. Arsigny, V., Commowick, O., Pennec, X., Ayache, N.: A log-Euclidean frameworkfor statistics on diffeomorphisms. In: MICCAI 2006, Springer (2006) 924–931
16. Bossa, M.N., Gasso, S.O.: A new algorithm for the computation of the grouplogarithm of diffeomorphisms. In: MFCA 2008, New York, USA (2008)
17. Lu, W., Parikh, P.J., El Naqa, I.M., et al.: Quantitation of the reconstruction qual-ity of a four-dimensional computed tomography process for lung cancer patients.Med Phys 32 (2005) 890–901
18. Plathow, C., Fink, C., Ley, S., M.Puderbach, M.Eichinger, I.Zuna, A.Schmahl,H.Kauczor: Measurement of tumor diameter-dependent mobility of lung tumorsby dynamic MRI. Radiother Oncol 73 (2004) 349–354
-14- Second International Workshop on Pulmonary Image Processing