Prediction Of pKa From Chemical Structure Using Free And ...
24
Valery Tkachenko 3 Alex Korotcov 3 Neal Cariello 1 Kamel Mansouri 4 Antony Williams 2 1. Integrated Laboratory Systems, Research Triangle Park, North Carolina, United States 2. National Center for Computational Toxicology, US-EPA, North Carolina, United States 3. Science Data Software, LLC, Rockville, MD 20850 4. ScitoVation, Research Triangle Park, North Carolina, United States Prediction of pKa from chemical structure using free and open-source tools The views expressed in this presentation are those of the author and do not necessarily reflect the views or policies of the U.S. EPA
Transcript of Prediction Of pKa From Chemical Structure Using Free And ...

Valery Tkachenko3
Alex Korotcov3
Neal Cariello1
Kamel Mansouri4
Antony Williams2
1. Integrated Laboratory Systems, Research Triangle Park, North Carolina, United States2. National Center for Computational Toxicology, US-EPA, North Carolina, United States3. Science Data Software, LLC, Rockville, MD 208504. ScitoVation, Research Triangle Park, North Carolina, United States
Prediction of pKa from chemical structure using free and open-source tools
The views expressed in this presentation are those of the author and do not necessarily reflect the views or policies of the U.S. EPA

pKaWhat Is It ?
Why Is It Important ?How Can We Use It ?
How Can We Predict It ?

Question: Which kind of chemicals will preferentially partition into the plasma membrane, charged or uncharged (ionized or non-ionized)?
• In general, chemicals that make it into the plasma membrane (lipid bilayer) have a better chance of getting into the cell.
• The plasma membrane facing the extracellular space is hydrophobic and lipophilic so will charged or uncharged molecules cross the membrane best?
Absorption Of Chemicals Into Cells
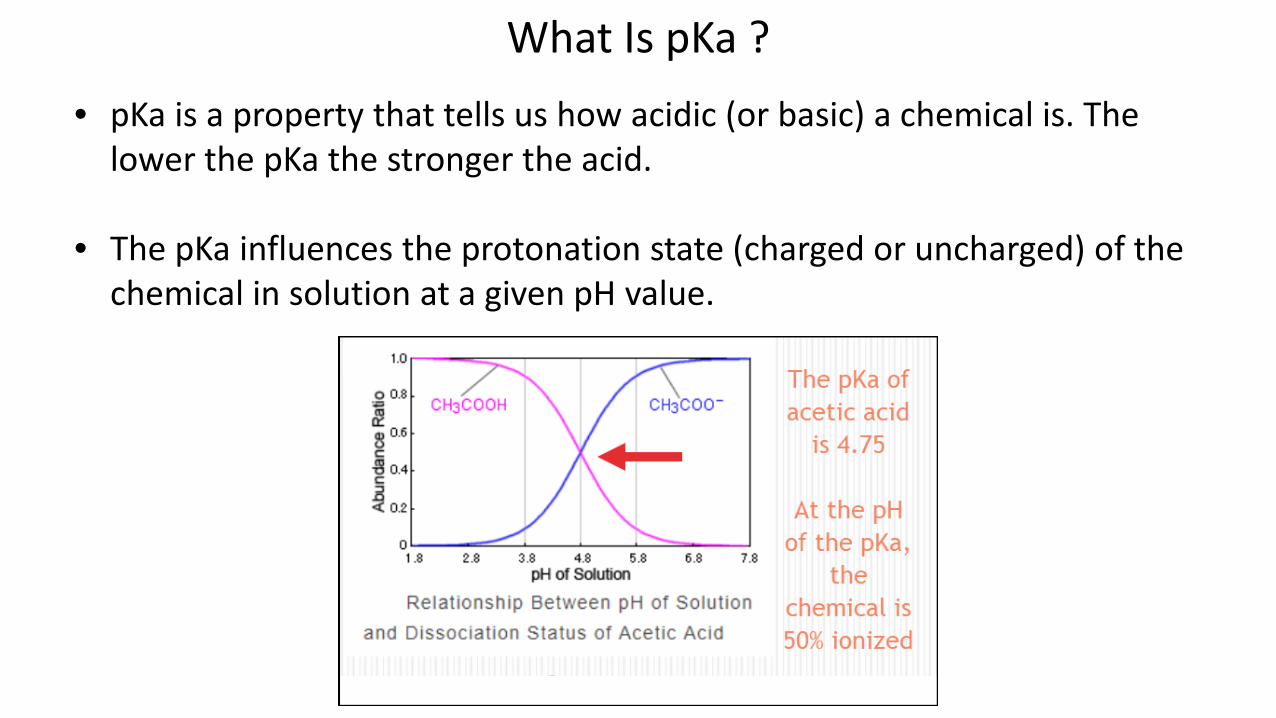
What Is pKa ?• pKa is a property that tells us how acidic (or basic) a chemical is. The
lower the pKa the stronger the acid.
• The pKa influences the protonation state (charged or uncharged) of the chemical in solution at a given pH value.

Chemistry 101
• Ka is the acid dissociation constant which is a measure of the strength of an acid in solution.
• Ka is an equilibrium constant and pKa is the -log10 value of Ka, therefore for acids
𝐻𝐻𝐻𝐻 ↔ 𝐻𝐻− + 𝐻𝐻+
𝐾𝐾𝐴𝐴 =]𝐻𝐻− [𝐻𝐻+
𝐻𝐻𝐻𝐻
𝑝𝑝𝐾𝐾𝑎𝑎 = −𝑙𝑙𝑙𝑙𝑙𝑙10]𝐻𝐻− [𝐻𝐻+
𝐻𝐻𝐻𝐻

pKa Importance
• pKa values reflect the ionization state of a chemical
• Why is this important?• Ionization affects lipophilicity, solubility, protein binding and the
ability of a chemical to cross the plasma membrane• This affects ADMET
• pKa can be used, and is many times required, for • Physiologically Based Pharmacokinetic (PBPK) modeling• In Vitro To In Vivo Extrapolation (IVIVE)• Prediction of tissue:plasma partition coefficients

Using Open Source Software and Data to Build a pKa Prediction
Algorithm:
Data Quality, Algorithm Development and Applications

Good Cheminformatics Data Is Hard To Obtain, Especially pKa
• Obtaining high-quality data sets is difficult• Curation is generally VERY time-consuming without optimized
workflows• Many issues exist with available datasets

7912 Chemicals With pKa In Water Are Available From The Datawarrior Website
• This is not a widely-known dataset• Datawarrior didn’t list the references for the data • We checked ~60 DataWarrior chemicals against literature and the
results were good (< 0.3 pKa units difference between DataWarrior and the literature)

Dataset Has A Bimodal Distribution
7912 structures 3614 acidic 4298 basic

QSAR-ready Workflow
Remove of duplicates
Normalize Nitros& tautomers
Clean salts and counterions
Remove inorganics and mixtures
Final inspection QSAR-ready structures
Indigo
KNIME workflow

QSAR-ready analysis
Full dataset: • 7904 QSAR-ready structures• 6245 unique QSAR-ready structures
Acidic dataset• 3610 QSAR-ready total structures• 3260 unique QSAR-ready structures
Basic dataset• 4294 QSAR-ready total structures• 3680 unique QSAR-ready structures
1659 Duplicate structures!
Standard deviation of duplicates2 as a threshold for averaging?

Modeling Options To deal with complexity of multiple pKa's for a chemical, three datasets were produced and analyzed:Option 1: Only structures with a unique pKa value were used.
• Pre-categorized Acidic dataset: 2960 • Pre-categorized Basic dataset: 3158 • Combined: 4897 (no amphoteric)
Option 2: A unique value/structure (average value if stdDev<2)
• Pre-categorized Acidic dataset: 3095 • Pre-categorized Basic dataset: 3370 • Combined: 5263 (no amphoteric)
Option 3: The entire list of QSAR-ready chemicals was used with averaging for similar pKa values.
if stdDev =< 1: Average value; if stdDev > 1: strongest pKa (min acidic/max basic) • Acidic dataset: 3260 unique QSAR-ready structures• Basic dataset: 3680 unique QSAR-ready structures
Combined dataset
Acidic dataset
Basic dataset

Machine Learning And Predicting pKa
• The term Machine Learning was coined in 1959 Machine learning explores the study and construction of algorithms that can learn from and make predictions on data through building a model from sample inputs.
• Each chemical with a pKa produces ~16.5K data points in 12 datasets• We need to find the best combination of variables (columns) for pKa
prediction

Train And Test Sets For ModelingFor each one of the data options:• Split into training (75%) and test (25%)• Keep similar distribution of pKa values• Keep similar distribution of acidic and basic pKas for combined
datasets• Descriptors (and fingerprints) are generated for all QSAR-ready
structures and can be matched by the generic ID (integers)A classification model to determine if a molecule will have an acidic pKa, basic pKa or both is trained too.

Training Models • Create model and estimate performance using only the training dataset• 5-fold cross-validation was used for training, model performance
evaluation and tuning • Root mean squared error (RMSE) was used as a performance metric for
training optimization.• Choice of machine learning methods:
• Extreme Gradient Boosting (XGBoost), the advanced traditional (shallow) machine learning (SML) method.
• Deep Neural Network (DNN), a deep machine learning method (DML).
• Support Vector Machines (SVM): defines a decision boundary that optimally separates two classes by maximizing the distance between them.

XGBoost training method• XGBoost is an implementation of gradient boosted decision trees
designed for speed and performance.• Coding was done using R. The caret and xgboost packages were used
for all analysis.• RMSE was a metric to be minimized. 5-fold cross validation was used to
train the model using the training dataset• Highly correlated variables were removed using caret::findCorrelation
with a cutoff of 0.90• Low variance variables were removed using caret::nearZeroVar with a
cutoff of 95/5• The following data subsets were modeled using all binary fingerprints
• Remove variables that are all 0's (many) and all 1's (few)• As above with removal of highly correlated variables• As above with removal of near zero variance variables removed

XGBoost training results• Performance using the basic dataset was substantially better than the
acidic dataset • MACCS and FP (Morgan’s, 1024 bins) binary fingerprints generally gave
the best performanceBest RMSE and R-Squared are:
• Basic pKa: 1.585 and 0.765• Acidic pKa: 1.737 and 0.737

DNN training method• The following Deep Neural Network parameters were optimized:
optimization algorithm, weight initialization, hidden layers activation function, L2 regularization, dropout regularization, number of hidden layers and nodes in the hidden layers, and learning rate. Keras(https://keras.io/) and Tensorflow (www.tensorflow.org) were used for deep learning models training.
• The final DNN: 3 hidden layers of 256 nodes each followed by a batch normalization and a drop out layer to generalize trained models.
• 5-fold cross validation on training data using mean square error as a loss function with earlier training stopping base on validation loss, thus further improving of the models’ generalization.
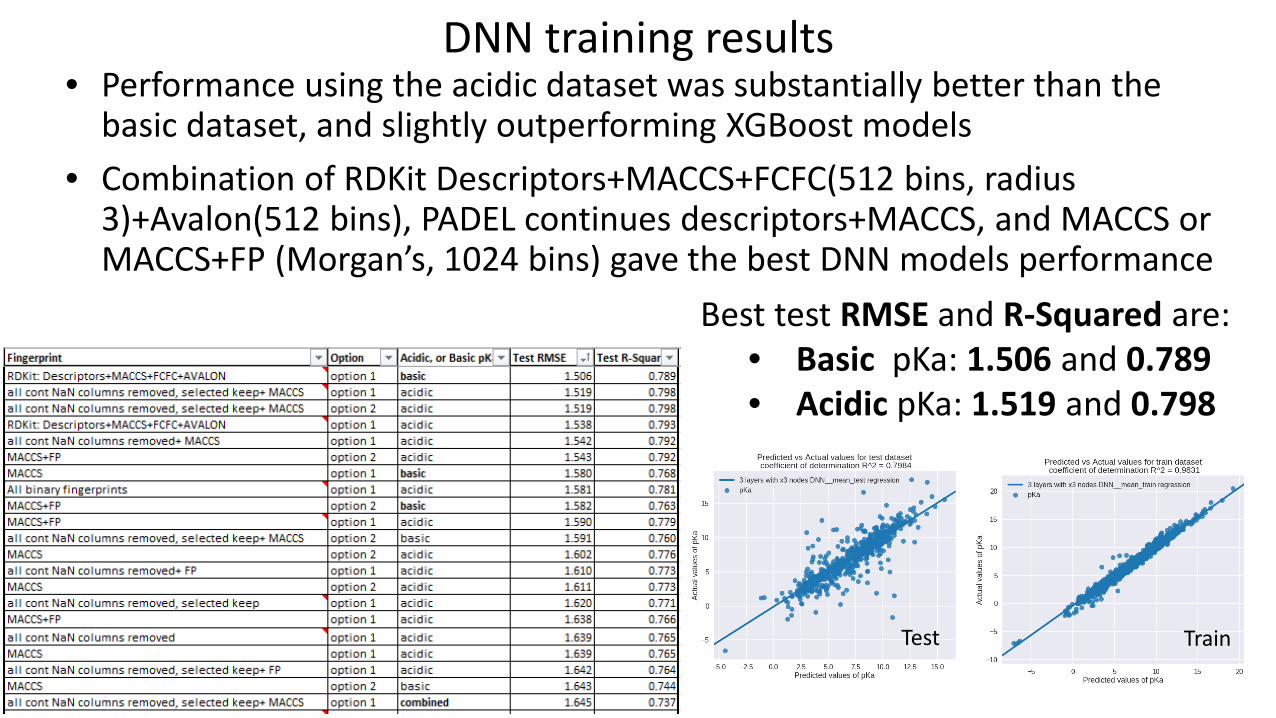
DNN training results• Performance using the acidic dataset was substantially better than the
basic dataset, and slightly outperforming XGBoost models• Combination of RDKit Descriptors+MACCS+FCFC(512 bins, radius
3)+Avalon(512 bins), PADEL continues descriptors+MACCS, and MACCS or MACCS+FP (Morgan’s, 1024 bins) gave the best DNN models performance
Best test RMSE and R-Squared are:• Basic pKa: 1.506 and 0.789• Acidic pKa: 1.519 and 0.798
Test Train

SVM training method
• Used the free and open source package LibSVM3.1 (Chang and Lin 2001).• Originally designed to solve classification problems then generalized to fit continuous
models as well.• Its algorithm defines a decision boundary that optimally separates two classes by
maximizing the distance between them.• The decision boundary can be described as an hyperplane that is expressed in terms of
a linear combination of functions parametrized by support vectors, which consist in a subset of training molecules.• SVM algorithms search for the support vectorsthat give the best separating hyperplane using a kernel function
SVM kernel function maximizing the margin between the classes.

SVM training results
Train 5f CV Testvariables R2 RMSE Q2 RMSE R2 RMSE
AcidicContinuous 870 0.96 0.65 0.58 2.18 0.68 1.91Fingerprint 1548 0.91 1 0.64 2.02 0.71 1.81Fingerprint Count 556 0.9 1.1 0.6 2.16 0.65 2.01Fingerprint – FP Count 2104 0.94 0.8 0.64 2.02 0.72 1.8Fingerprint - Continuous 2418 0.99 0.11 0.67 1.92 0.76 1.65BasicContinuous 876 0.96 0.64 0.65 1.94 0.65 1.93Fingerprint 1535 0.91 0.99 0.69 1.84 0.69 1.83Fingerprint Count 544 0.9 1.05 0.68 1.88 0.69 1.83Fingerprint – FP Count 2079 0.93 0.87 0.72 1.73 0.7 1.8
Train 5f CV Testvariables R2 RMSE Q2 RMSE R2 RMSE
AcidicContinuous 913 0.98 0.49 0.61 2.1 0.69 1.89Fingerprint 1552 0.9 1.05 0.63 2.04 0.69 1.87Fingerprint Count 589 0.9 1.09 0.59 2.17 0.65 1.98Fingerprint – FP Count 2141 0.94 0.85 0.63 2.05 0.71 1.81BasicContinuous 913 0.97 0.52 0.67 1.88 0.66 1.88Fingerprint 1534 0.9 1.02 0.68 1.83 0.75 1.63Fingerprint Count 551 0.9 1.02 0.67 1.87 0.73 1.69Fingerprint – FP Count 2085 0.93 0.88 0.71 1.76 0.78 1.53
Train 5f CV Testvariables R2 RMSE Q2 RMSE R2 RMSE
AcidicContinuous 510 0.96 0.66 0.59 2.17 0.57 2.2Fingerprint 1580 0.91 1 0.64 2.01 0.68 1.91Fingerprint Count 815 0.88 1.19 0.6 2.14 0.61 2.11Fingerprint – FP Count 2395 0.93 0.86 0.65 1.99 0.69 1.87BasicContinuous 510 0.95 0.75 0.61 2.01 0.6 2.09Fingerprint 1543 0.91 0.94 0.72 1.72 0.67 1.9Fingerprint Count 815 0.89 1.06 0.69 1.79 0.69 1.84Fingerprint – FP Count 2358 0.93 0.84 0.73 1.67 0.71 1.79
Train 5f CV TestkNN variables BA BA BAContinuous 15 0.8 0.8 0.77SVMContinuous 15 0.92 0.8 0.73Continuous 511 0.98 0.79 0.72Fingerprints 1565 0.98 0.8 0.74Fingerprint Count 815 0.96 0.8 0.73
Results of Option 1 Results of Option 2
Results of Option 3 kNN and SVM classification models
These models are used to decide if a test chemical has an acidic pKa, basic pKa, or both (amphoteric)

Future Work
• Predict pKa values for all ionizable chemicals in the EPA CompTox Chemistry Dashboard (https://comptox.epa.gov)
• Develop web service for pKa prediction – used for calculation on the fly when registering new chemicals
• Integrate web service into online systems: e.g. the CompTox Chemistry Dashboard to allow for real time prediction of pKa values (https://comptox.epa.gov/dashboard/predictions/index)
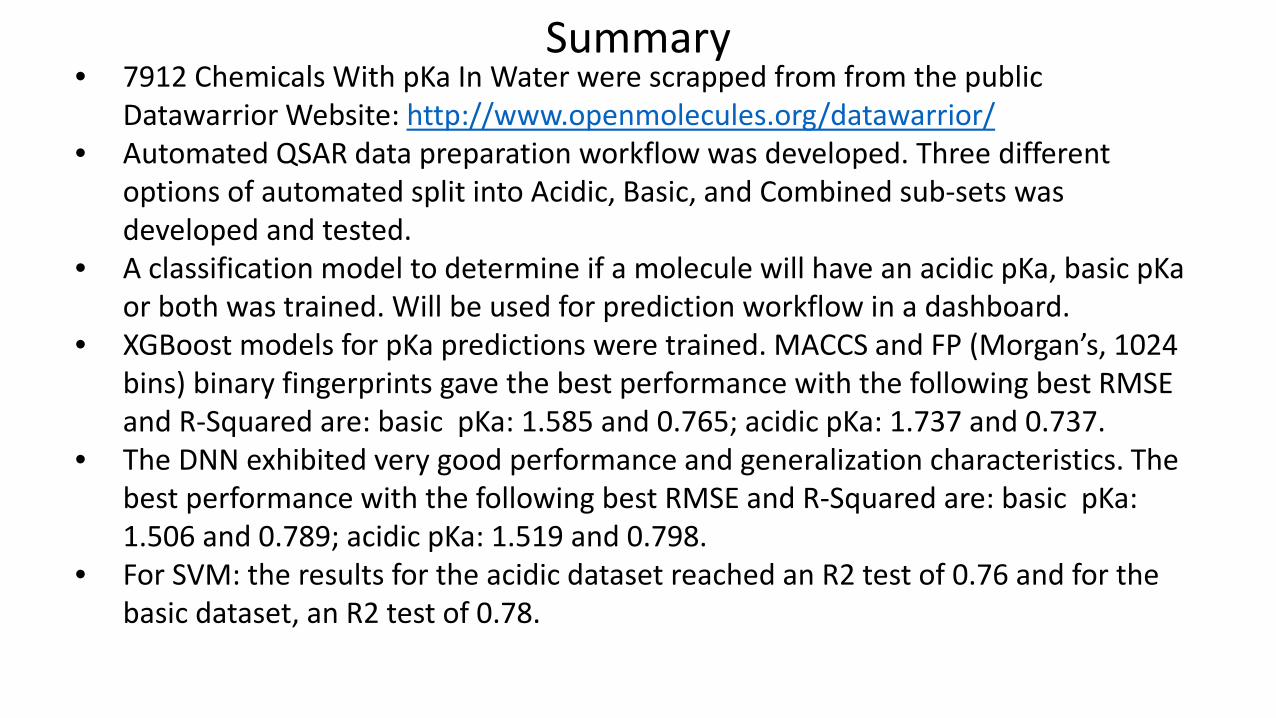
Summary• 7912 Chemicals With pKa In Water were scrapped from from the public
Datawarrior Website: http://www.openmolecules.org/datawarrior/• Automated QSAR data preparation workflow was developed. Three different
options of automated split into Acidic, Basic, and Combined sub-sets was developed and tested.
• A classification model to determine if a molecule will have an acidic pKa, basic pKaor both was trained. Will be used for prediction workflow in a dashboard.
• XGBoost models for pKa predictions were trained. MACCS and FP (Morgan’s, 1024 bins) binary fingerprints gave the best performance with the following best RMSE and R-Squared are: basic pKa: 1.585 and 0.765; acidic pKa: 1.737 and 0.737.
• The DNN exhibited very good performance and generalization characteristics. The best performance with the following best RMSE and R-Squared are: basic pKa: 1.506 and 0.789; acidic pKa: 1.519 and 0.798.
• For SVM: the results for the acidic dataset reached an R2 test of 0.76 and for the basic dataset, an R2 test of 0.78.