PREDICTION OF ANGULAR ERRORS ON A...
15
IJST, Transactions of Mechanical Engineering, Vol. 35, No. M2, pp 181-195 Printed in The Islamic Republic of Iran, 2011 © Shiraz University PREDICTION OF ANGULAR ERRORS ON A VERTICAL CNC MILLING MACHINE * R. A. MAHDAVINEJAD ** School of Mechanical Engineering, College of Engineering, University of Tehran, Tehran, I. R. of Iran Email: [email protected] Abstract– The accuracy and precision of computer numerical control (CNC) machine tools directly affect the dimensional accuracy of machined parts. Accurate detection of machine tool errors with respect to positioning and orientation is imperative to the accuracy of the manufacturing process and, further, to eliminate errors through error compensation techniques. This paper presents a method to measure and determine angular errors resulting from drive axis out-of-straightness. Measurement of errors in discrete steps has been carried out via laser autocollimator and the method of neural networks (NN) has been employed to predict the amount of errors in the range between the steps. The results from this study can be used as a model for industrial applications to identify errors prior to the programming of the manufacturing process. Keywords– Geometric error, kinematic error, cutting-force induced error, error compensation, transformation matrix 1. INTRODUCTION The accuracy of the machined part dimensions directly depends upon the positional accuracy of the cutting tool relative to the part being machined [1]. Therefore, the accuracy of the machine tool used to produce the part is often the limiting factor in obtaining the highest accuracy and part quality. The accuracy of the machine tool is primarily affected by the geometric errors caused by mechanical and/or geometrical imperfections, misalignments and something such as the wear of the machine's structure elements by the non-uniformal thermal expansion of the machine's structure and static/dynamic load induced errors [1]. The errors can be reduced with the structural improvement of the machine tool through better design and production practices. However, in most cases, due to physical limitations, production and design techniques cannot solely and completely improve the machine tool accuracy. Therefore, identification, characterization and compensation of these error sources are necessary to improve machine tool accuracy cost-effectively. Studies on the thermal and geometric effects on machine tool accuracy have been reported in precision engineering for a long time, but widely recognized by the machine tool industry for only about two decades [2]. Hocken [3] clearly indicated the importance of machine geometry, thermal effects and machine loading on the accuracy of the parts being manufactured. Eman et al. [4] presented a methodology to build a generalized error model of a multi-axis machine of arbitrary configuration. Donmez et al. [5] presented a general methodology for the prediction and compensation of machine tool errors using homogenous matrix transformations. Kurtoglu [6] combined much of the previous work and demonstrated the efficiency of the error correction on machined parts. His results provided an accuracy ∗ Received by the editors November 19, 2009; Accepted September 15, 2011. ∗∗ Corresponding author
Transcript of PREDICTION OF ANGULAR ERRORS ON A...

IJST, Transactions of Mechanical Engineering, Vol. 35, No. M2, pp 181-195 Printed in The Islamic Republic of Iran, 2011 © Shiraz University
PREDICTION OF ANGULAR ERRORS ON A VERTICAL CNC MILLING MACHINE*
R. A. MAHDAVINEJAD ** School of Mechanical Engineering, College of Engineering, University of Tehran, Tehran, I. R. of Iran
Email: [email protected]
Abstract– The accuracy and precision of computer numerical control (CNC) machine tools directly affect the dimensional accuracy of machined parts. Accurate detection of machine tool errors with respect to positioning and orientation is imperative to the accuracy of the manufacturing process and, further, to eliminate errors through error compensation techniques. This paper presents a method to measure and determine angular errors resulting from drive axis out-of-straightness. Measurement of errors in discrete steps has been carried out via laser autocollimator and the method of neural networks (NN) has been employed to predict the amount of errors in the range between the steps. The results from this study can be used as a model for industrial applications to identify errors prior to the programming of the manufacturing process.
Keywords– Geometric error, kinematic error, cutting-force induced error, error compensation, transformation matrix
1. INTRODUCTION
The accuracy of the machined part dimensions directly depends upon the positional accuracy of the cutting tool relative to the part being machined [1]. Therefore, the accuracy of the machine tool used to produce the part is often the limiting factor in obtaining the highest accuracy and part quality. The accuracy of the machine tool is primarily affected by the geometric errors caused by mechanical and/or geometrical imperfections, misalignments and something such as the wear of the machine's structure elements by the non-uniformal thermal expansion of the machine's structure and static/dynamic load induced errors [1].
The errors can be reduced with the structural improvement of the machine tool through better design and production practices. However, in most cases, due to physical limitations, production and design techniques cannot solely and completely improve the machine tool accuracy. Therefore, identification, characterization and compensation of these error sources are necessary to improve machine tool accuracy cost-effectively.
Studies on the thermal and geometric effects on machine tool accuracy have been reported in precision engineering for a long time, but widely recognized by the machine tool industry for only about two decades [2]. Hocken [3] clearly indicated the importance of machine geometry, thermal effects and machine loading on the accuracy of the parts being manufactured. Eman et al. [4] presented a methodology to build a generalized error model of a multi-axis machine of arbitrary configuration. Donmez et al. [5] presented a general methodology for the prediction and compensation of machine tool errors using homogenous matrix transformations. Kurtoglu [6] combined much of the previous work and demonstrated the efficiency of the error correction on machined parts. His results provided an accuracy ∗Received by the editors November 19, 2009; Accepted September 15, 2011. ∗∗Corresponding author
R. A. Mahdavinejad
IJST, Transactions of Mechanical Engineering, Volume 35, Number M2 October 2011
182
increase of over 70%. Shin and Wei [7] addressed the machine tool repeatability by using a synthesis and transformation method for the prediction of accuracy and repeatability of any kinematic machine. Duffie and Bollinger [8], and also Mou and Liu [9], used kinematics in modeling machine tool errors for compensation. Dorndorf et al. [10] developed a model for quasi-static errors and its usage as the basis for optimal error budgeting. Shin et al. [11] proposed seven different procedures for the characterization of CNC machine tools. They included volumetric accuracy tests, warm-up test, power transmission efficiency estimation, cutting performance test, cutting accuracy test, spindle dynamic compliance test and spindle out of roundness measurement test.
The table of the machine can be considered as a cantilever beam and when it moves from one point to another, the errors resulting from its weight appears on different directions as rolling, pitching and yawing errors. Novakovic and Atanakovic [12] analyed the problem of determining the stability boundary of an elastic column with the influence of shear stress and axial compressibility. Okafor and Ertekin [13] developed kinematic error models accounting for geometric and thermal errors in a vertical machining center. Using Rigid Body Kinematics and small angle approximation of the errors, the authors modeled each slide of the three axes vertical machine center using homogeneous coordinate transformation. Okafor and Ertekin [2] also used a laser interferometer to characterize the accuracy of a vertical machine center in the form of angular errors and temperature variation along with an environmental controller unit. The accuracy of the vertical machining center was characterized as a function of machine tool nominal axis position, temperature distribution and environmental effects. Castro and Burdekin [14] developed a method for evaluating the positioning accuracy of machine tools and coordinate measuring machines under dynamic conditions using a laser interferometer. The effect of temperature on the error accuracy of all the elements of machine tools is very important and should also be considered. Jaefarzadeh [15] has some operational reports about this subject. His technique provided a more realistic and detailed picture of the errors of the machine. Pahk et al. [16] proposed a technique for assessing the volumetric errors in multiaxis machine tools using a kinematic double ball bar based on a volumetric error model which describes the three-dimensional errors of machine tools. The developed system was also able to assess the dynamic performance of machine tools. Recently, many researchers have started using Artificial Neural Networks for error prediction and compensation [17]. To improve the accuracy of machine tools, in addition to hardware improvements, software compensation methods should be incorporated.
In most cases, due to physical limitations, hardware improvements cannot completely eliminate geometric and thermal errors in machine tool structure. Therefore, characterization and compensation of the geometric and thermal errors emerges as the most economical and inevitable course of action necessary to improve machine tool accuracy. This paper presents a method for the determination and prediction of angular geometric errors on a CNC milling machine. The method involves direct measurement of angular errors using a laser autocollimator at discrete steps along machine travel and artificial neural networks (ANN) to map these errors on the entire table travel.
2. OVERVIEW OF MACHINE TOOL ERRORS There are four main sources of errors in machine tools that determine machine tool accuracy. These errors can be classified as: 1- Geometric errors of machine components and structures. 2- Errors induced by thermal distortions. 3- Deflection errors caused by cutting forces.
Prediction of angular errors on avertical…
October 2011 IJST, Transactions of Mechanical Engineering, Volume 35, Number M2
183
4- Other errors-for example, those caused by servo errors of machine axes (e.g., tracking errors) or numerical control interpolation algorithmic errors.
Among the above error sources of the machine tools, geometric and thermal errors are known to be the most important error sources [2, 18]. a) Geometric errors of machine components
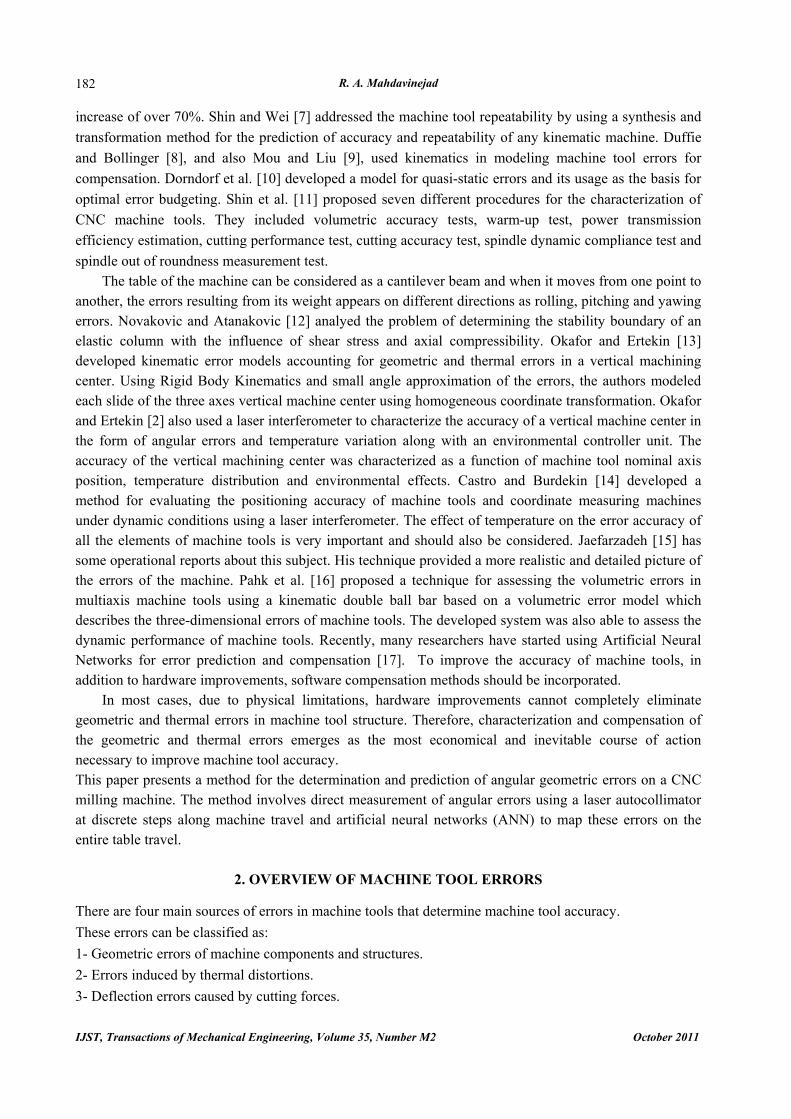
Geometric errors are regarded as the machine errors which exist under cold start conditions. The mechanical imperfections of the machine tool structure and the misalignment of machine tool elements cause geometric errors and they all change gradually due to component wear. The geometric inaccuracies produce errors in the squareness and parallelism between the machine's moving elements. Geometric errors present themselves as position and orientation errors of the cutting tool relative to the workpiece. Table 1 outlines the 21 geometrical error components of a 3-axes vertical machine center. Figure 1 schematically displays some of the error components of a vertical milling machine's X-axis carriage system. A summary of the symbols used is as follows:
OXYZ: Reference coordinate system; O1X1Y1Z1: Carriage coordinate system; X: Desired direction of motion. εx(x): Rotational error around X-axis (rolling); εy(x): Rotational error around Y-axis (pitching); εz(x): Rotational error around Z-axis (yawing); δx(x): Translational (scale) error along X-axis; δy(x): Translational (horizontal straightness) error along Y-axis; δz(x): Translational (vertical straightness) error along Z-axis. The figure includes only translational errors as pertains to the X axis direction of movement and other errors are omitted for clarity.
Table 1. Summary of errors occurring on a machine tool [1]
Kind of errors No. of Errors Linear positioning errors (scale error) 3 Straightness errors 6 Angular errors 9 Orthogonality (squareness) errors of machine axes 3
Fig. 1. Schematic representation of translational errors along X axis of a vertical milling machine

R. A. Mahdavinejad
IJST, Transactions of Mechanical Engineering, Volume 35, Number M2 October 2011
184
It should be noted that the same set of rotational and translational errors also exist for the Y and Z axes. Implicitly, the following notational conventions will be used:ε represents angular error motions, a subscripted letter represents the axis the motion rotates around, and a letter in brackets represents the intended motion direction; positive rotation is defined by the "right-hand rule." δ represents the translational error motions. These axis errors along with the orientation errors between the axes (e.g. squareness and parallelism) are referred to as the parametric errors [1]. It is noteworthy that the table of the machine can be considered as a cantilever beam and when it moves from one point to another, the errors resulting from its weight appear on different directions as rolling, pitching and yawing errors. These errors are noticeable and cannot be omitted. This subject should be considered for many parameters such as; the weight and position of the workpiece, the weight of fixtures and some machining parameters like the depth of cut so that the variations of each one influence angular and translational machine errors.
3. EXPERIMENTAL PROCEDURES FOR MEASURING ERRORS The data requirements for estimation of machine tool parametric errors necessitate the development of an empirical database which combines commanded machine tool position and angular error of the machine. The commanded machine position is nominal axis position, which is determined by the part program being executed. The angular error of the machine at the nominal axis position is directly entered into the database from a laser autocollimator connected to a personal computer. a) Set up of the experiment
Figure 2 displays a schematic drawing of the layout of the machine tool under test and the laser autocollimator device. The vertical CNC milling machine under the test is TRIAC VMC milling machine manufactured by the Denford Machine Tools Company, England. The machine is capable of movements in X, Y and Z directions in the amounts of 290mm, 170mm and 200mm respectively. It is operated by three axis motors that drive lead screws 16mm in diameter and 5mm in pitch.
Fig. 2. Schematic drawing of the layout of the machine tool under the test with laser autocollimator

Prediction of angular errors on avertical…
October 2011 IJST, Transactions of Mechanical Engineering, Volume 35, Number M2
185
The laser measurement system is a "Laser Straightor" autocollimator manufactured by CHUO Precision Industrial Company in Japan. The autocollimator includes a ML10 laser head with low-powered (1 mW) class II He-Ne laser beam with a nominal wavelength of 0.633 mm and long term wavelength stability (in vacuum) better than 0.1 ppm, a detecting block comprising a prism and a reflecting mirror and a processing and printing device capable of data transmission to computer. The system is able to measure angular errors with a resolution of 0.01 arc-seconds with an uncertainty of ± 0.01 arc-seconds in the range of ± 150 seconds. The system is capable of measuring angular errors about the two axes perpendicular to the intended direction of motion [19]. In this paper, εy(x): Rotational error about Y-axis (pitch) when moving in the X direction; εz(x): rotational error about Z-axis (yaw) when moving in the X direction; εx(y): rotational error about X-axis (roll) when moving in the Y direction; and εx(y) rotational error about Z-axis (yaw) when moving in the Y direction have been measured with the device.
The amount of displacement can be calculated using the equation: d=2fθ, where d = displacement in mm, f = focal length of the autocollimator objective in mm and θ is the angular rotation of the mirror. Figure 3 shows a schematic representation of the principle of auto-collimation.
Fig. 3. Principle of auto collimation
b) Experiments
Measurements of angular errors were carried out in X and Y target axis directions in 10mm steps and 10mm intervals of the other axis. In other words, when measuring in X direction, the machine was fixed at Y=0 and programmed to move forward 10mm steps along the entire range of the X axis while moving in positive (+) direction. The machine then proceeds to Y=10, repeating measurements along 10mm steps to traverse the entire movement range of the X axis. The procedure continues for Y=20, 30, … 170 mm, covering the entire range of the machine. The steps were repeated in reverse X direction.
When measuring in Y direction, the machine was fixed at X=0 and programmed to move 10mm steps along the entire range of the Y axis while moving in forward (+) direction. The machine then proceeds to X=10, repeating measurements along 10mm steps to traverse the entire movement range of the Y axis. The procedure continues for X=20, 30, … 290 mm, covering the entire range of the machine. The steps were repeated in reverse Y direction. At each stop point measurements were taken after several seconds to allow the processing device to have an accurate reading of the angular errors. Both angular errors were measured simultaneously and data were transferred to the computer. As the Laser Straightor device measures angular errors relatively and has a limited range of measurement, the authors set the device appropriately so that the entire range of errors from machine movement falls within the measurement of the device. The authors also modified the acquired data so that the first reading at each position becomes zero and subsequent readings are altered accordingly.
4. NEURAL NETWORK DESIGN AND TRAINING The neural network design and training was done using Neural Network Toolbox from Mathworks Inc.'s MATLAB. The data acquired contained a set of three measurements made at each measurement point.

R. A. Mahdavinejad
IJST, Transactions of Mechanical Engineering, Volume 35, Number M2 October 2011
186
The average values of these measurements were used to train the network, and the three sets of data were used to test the resultant network. Generating and training a neural network, and displaying the results of test data were accomplished using MATLAB’s m-file scripting capability.
Training a neural network in the MATLAB environment is normally accomplished using one of the built-in training functions that are included in the Neural Network Toolbox. There are sixteen different training functions implemented and included as part of the toolbox [20]. While each of the training algorithms could be used on any problem, they are each more suited for certain classes of problems and network architectures. For feed-forward, backpropagation networks, the default training algorithm is the Levenberg-Marquardt algorithm [20]. This algorithm is well suited to function approximation problems with networks of moderate size and number of parameters. It is also well suited to problems that require the approximation to be very accurate. Other algorithms that were considered to work well in function approximation problems are the Scaled Conjugate Gradient and the BFGS Quasi-Newton algorithms.
The toolbox offers a discussion on speed and memory comparisons of the various training algorithms for a set of sample problems [20]. This discussion supports the conclusion that the Levenberg-Marquardt (LM) algorithm is the best option available in the toolbox for function approximation problems on small to moderate sized networks. As the problem under study fits into the description, these recommendations were considered and the conclusions on the actual data for this problem were validated.
The work in this research included a function approximation problem that required the final error to be reduced to a very small value and, in general, the networks were of moderate size. A series of ten tests each were conducted on four of the training algorithms where a newly created network was trained against the data collected from the laser-autocollimator measurements of the CNC milling machine. In each of the tests, the entire network was newly created and randomly initialized in the default manner of the toolbox. The training parameters were set to train for 1000 epochs, and the goal of reducing the error to 84 10 −× (arc-second) was set. In each of the tests, the time to complete 1000 epochs (or reach the training goal) was tracked, along with the final error reached. The results of the neural network tests are summarized in Table 2. While the LM algorithm was the slowest of the four tested, it was the only algorithm capable of reaching the training goal specified and it still completed in a reasonable amount of time.
Table 2. Comparison of training algorithms
Training algorithm Average time to 1000 epochs
(seconds)
Final error measure (arc-seconds)
TrainRP 23.4 4.67E-4 TrainSCG 44.9 3.67E-4 TrainBFG 54.3 1.23E-7 TrainLM 65.8 4.81E-8
The accuracy reached in each trial is shown in Fig. 4. Plotted on a logarithmic scale, Fig. 4 shows the
advantage of LM algorithm in reaching a very small error level as required by this application. After reviewing the information on training algorithms, and conducting the test discussed above on actual data from the experiment, it was concluded that the Levenberg-Marquardt was the best training algorithm to use for this work.
All of the values required by the network were determined using the training process. These key parameters are the weights applied to the inputs, the bias values applied to the input neurons, the weights applied to any values passed to neurons in the hidden layers of the network, the bias values applied to hidden neurons, and the transfer functions of all the neurons in the network. Since the design and training of the network were accomplished within the MATLAB environment these parameters are all stored as properties of the network object created in MATLAB.

Prediction of angular errors on avertical…
October 2011 IJST, Transactions of Mechanical Engineering, Volume 35, Number M2
187
Fig. 4. Comparison of training algorithm accuracy
5. DISCUSSION
Three sets of measurement were taken at each step. This provides a more accurate reading and prepares data for the training of the neural network fitted to the data. For final processing the average of these sets of data was used. Forward and reverse measurements were made back to back to provide a better understanding of the effects of lead-screw backlash on angular errors.
Figure 5 shows a sample of yawing errors in X axis direction when the table was programmed to move forward. The general tendency of the yaw errors in X axis direction is a gradual increase in the positive direction and then a sharp decline in the negative direction.
Fig. 5. Yawing errors for X axis in different Y positions
Figure 6 shows the average of yawing errors in X axis direction when the table was programmed to
move forward. The graph of the average errors follows the same general tendency with a gradual increase in the positive direction and then a sharp decline in the negative direction. The average error data shows a total of 18 arc-seconds in yawing error for forward X axis movement. This error induces a considerable amount of error in the machined part.

R. A. Mahdavinejad
IJST, Transactions of Mechanical Engineering, Volume 35, Number M2 October 2011
188
Fig. 6. Average yawing errors in X axis direction
Figure 7 shows a sample of yawing errors in X axis direction when the table was programmed to
move in the reverse direction. The general tendency of a gradual increase in the positive direction and then a sharp decline in the negative direction was witnessed here too, with the difference being that the general range of errors is larger.
Fig. 7. Yawing errors for X Axis in different Y positions with reverse motion
Figure 8 shows the average of yawing errors in X axis direction when the table was programmed to
move in the reverse direction. The graph of the average errors follows the same general tendency

Prediction of angular errors on avertical…
October 2011 IJST, Transactions of Mechanical Engineering, Volume 35, Number M2
189
discussed earlier with a spike at X=90mm, which indicates an anomaly in the data acquired. The authors attribute this anomaly to a sudden change in the measuring conditions, a pressure exerted on the machine table for instance. The average error data again shows a total of 18 arc-seconds in yaw error for reverse X axis movement. This error induces a considerable amount of error in the machined part.
Fig. 8. Average yawing errors in X direction with reverse motion
Figure 9 shows a sample of pitching errors in X axis direction when the table was programmed to
move in the forward direction. The general tendency in pitching errors along X axis is an increase in the positive direction. As is evident from Fig. 9, the range of pitching errors is much larger in magnitude compared to yawing errors and nearly make up the entire range of the measurement device.
Fig. 9. Pitching errors for X axis in different Y positions
R. A. Mahdavinejad
IJST, Transactions of Mechanical Engineering, Volume 35, Number M2 October 2011
190
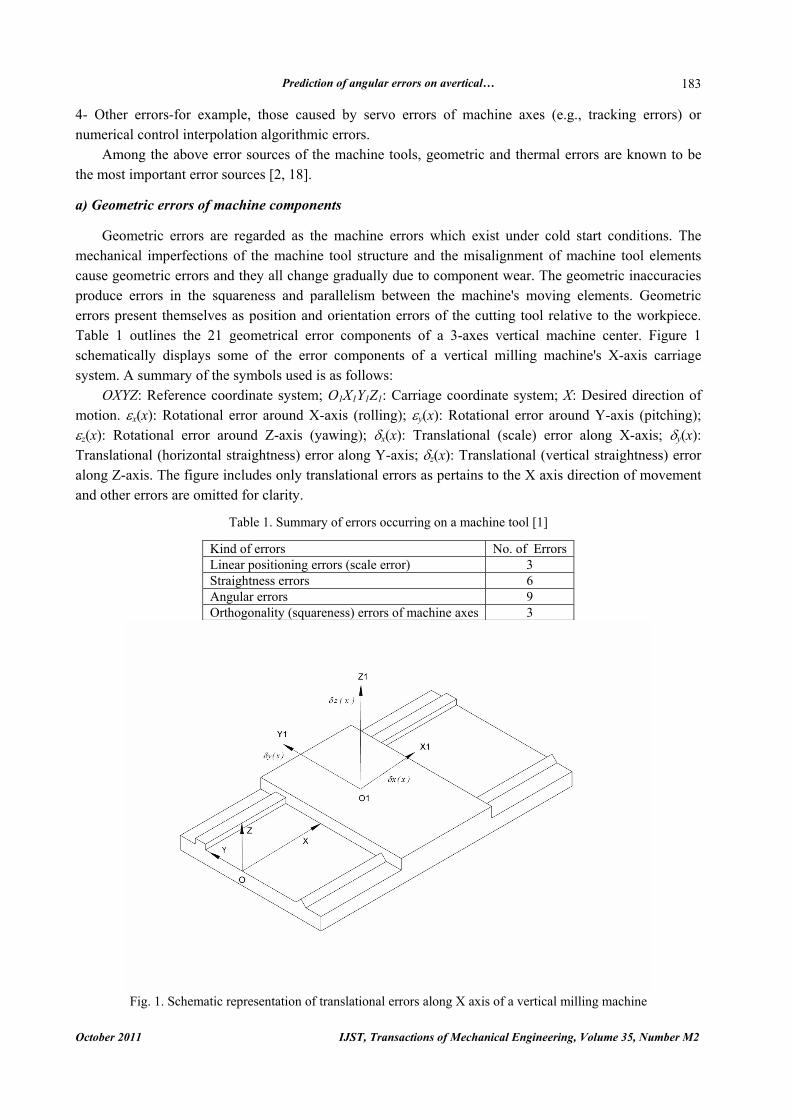
Figure 10 shows the average of pitching errors in X axis direction when the table was programmed to move forward. The average error data shows a total of nearly 140 arc-seconds in pitching error for forward X axis movement. This error will induce a considerable amount of geometric error in the machined part.
Fig. 10. Average pitch errors in X direction
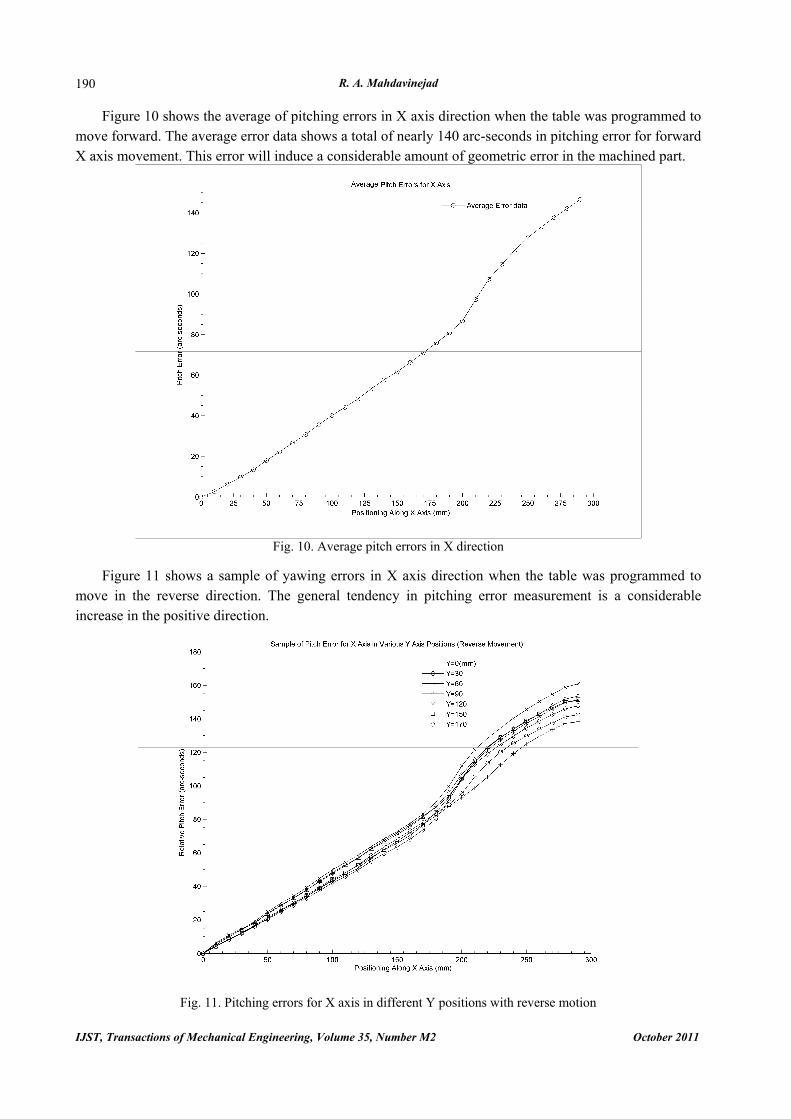
Figure 11 shows a sample of yawing errors in X axis direction when the table was programmed to
move in the reverse direction. The general tendency in pitching error measurement is a considerable increase in the positive direction.
Fig. 11. Pitching errors for X axis in different Y positions with reverse motion

Prediction of angular errors on avertical…
October 2011 IJST, Transactions of Mechanical Engineering, Volume 35, Number M2
191
Figure 12 shows the average of pitching errors in X axis direction when the table is in reverse motion. It is evident from the figure that a considerable error of nearly 140 arc-seconds was also witnessed in this direction.
Fig. 12. Average pitching errors in X direction with reverse motion
Similar errors were recorded from Y axis motion with the difference that along Y axis, rolling and
yawing errors are measured and the amount of rolling errors is greater than pitching errors. a) Network training results
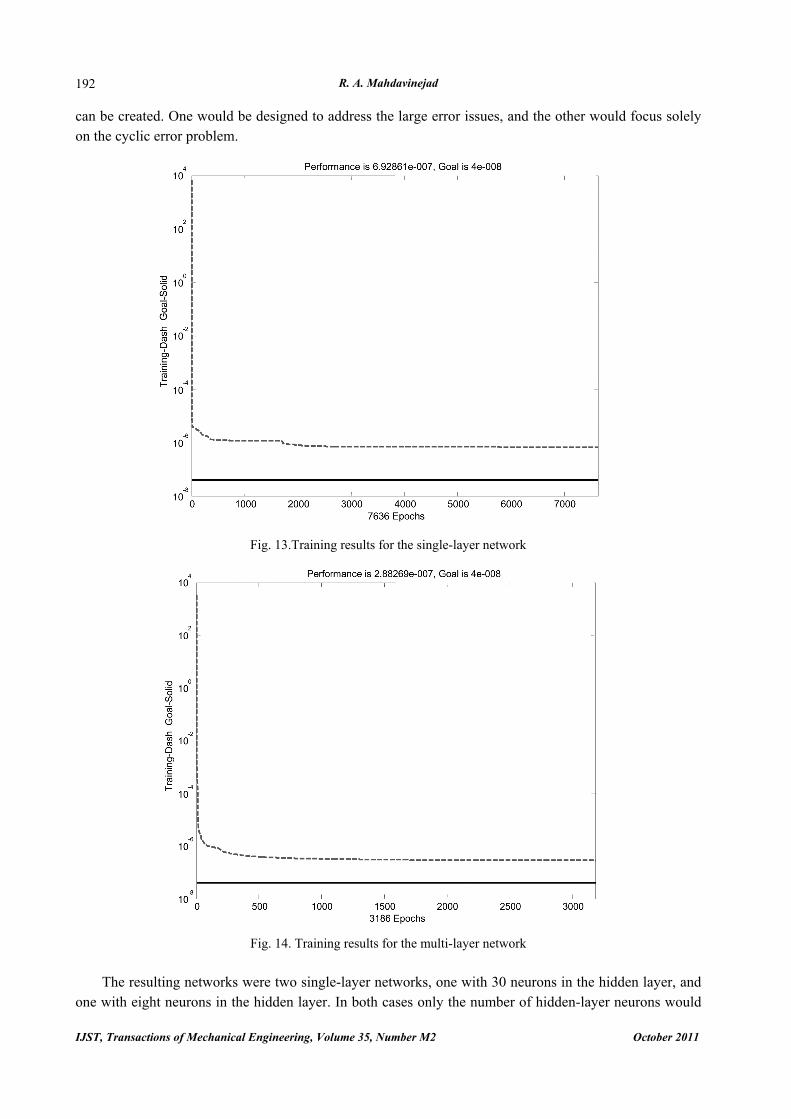
The first network consisted of a single, 40-neuron, hidden layer between the inputs and outputs. Typical training results for the trials of the network are shown in Fig. 13. After approximately 7500 epochs, the network was normally able to get the error measure down to a value of approximately 7.00e-7. With this level of performance, a maximum error of 1.3498e-4 was reached for any single point in the range of operation.
The second network architecture that was closely studied consisted of two hidden layers between the inputs and outputs. Both of these layers were made up of logsig neurons, with 30 neurons in the first layer, and 10 neurons in the second layer. The diagram of this network is shown in Fig. 14.
The training results for this network were typically in the same range as the 40-neuron single-layer network. The training results are shown in Fig. 15. As shown in this figure, the network was able to achieve a comparable level of performance but with only 3200 epochs – or less than half the single-layer network.
The last network architecture closely examined was a combination of two networks. This architecture was arrived at by considering the nature of the problem. From the angular error results (Fig. 6 and Fig. 10) the errors can be classified into two categories – large or gross errors that occur over the range of motion and the cyclic error that occurs within the space of a single revolution of the lead-screw. The large errors would include the general trend of the angular error as the machine moved along the axes and the backlash error as the machine changes direction of motion. By considering these problems separately, two networks
R. A. Mahdavinejad
IJST, Transactions of Mechanical Engineering, Volume 35, Number M2 October 2011
192
can be created. One would be designed to address the large error issues, and the other would focus solely on the cyclic error problem.
Fig. 13.Training results for the single-layer network
Fig. 14. Training results for the multi-layer network
The resulting networks were two single-layer networks, one with 30 neurons in the hidden layer, and
one with eight neurons in the hidden layer. In both cases only the number of hidden-layer neurons would

Prediction of angular errors on avertical…
October 2011 IJST, Transactions of Mechanical Engineering, Volume 35, Number M2
193
change. The training results for the 30-layer network are shown in Fig. 16. For the data presented, this network was able to reduce the error measure to under 4e-8 in less than 600 epochs.
Fig. 15. Training result for large-error network
Fig. 16. Training result for cyclic error network
6. CONCLUSION
Measuring the parametric errors can provide important information about the health condition of the machine. A method has been proposed to measure and estimate angular errors on CNC vertical milling

R. A. Mahdavinejad
IJST, Transactions of Mechanical Engineering, Volume 35, Number M2 October 2011
194
machines. This method can assist the manufacturing engineer by informing, prior to machinery, a number of geometrical errors on the manufactured part. The engineer can then make decisions on the manufacturing process and tolerances required. The method proposed in this study also provides a basis for future works on determination of paths for machine movement with the smallest amount of angular errors. Ultimately, the method outlined in this study may be used to compensate for the angular errors encountered on machine tools.
Based on the findings of this study the following conclusions have been drawn: 1- X-axis pitching and Y-axis yawing errors were the largest among measured angular errors of the machine. Generally, all measured angular errors were higher towards the end of the travel of the respective axis and lower towards the home position (origin). 2- As predicted, reversal of motion induces considerable angular errors on the carriage. For prediction and compensation of angular errors, the amount of angular tilt can be assumed to be an average of the amounts measured in this study. This can become the basis for algorithms predicting errors in different routes of travel for the CNC machine carriage. 3- Angular errors on X and Y axes have a similar tendency to increase and decrease on different X and Y positions. This verifies the fact that angular errors are the result of lead-screw misalignment and wear of mechanical parts. 4- The artificial neural network is a powerful tool ideally suitable for the prediction of angular errors on a machine tool.
REFERENCES 1. Slocum, A. H. (1992). Precision Machine Design. NJ Englewood Cliffs: Prentice-Hall. 2. Okafor, A. C. & Ertekin, Y. M. (2000). Vertical machining center accuracy characterization using laser
interferometer Part 2. Angular errors. J. Mater Process Technol, Vol. 105, No. 3, pp. 407-420. 3. Hocken, R. J. (1980). Technology of machine tools. Vol. 5, Machine Tool Accuracy. Livermore, California:
Lawrence Livermore Laboratory. 4. Eman, K., Wu, B. & DeVries, M. A. (1987). A generalized geometric error model for multi-axis machines. Ann
CIRP, Vol. 36, No. 1, pp. 253-256. 5. Donmez, M. A., Blomquist, D. S., Hocken, R. J., Liu, C. R. & Barash, M. M. (1986). A general methodology for
machine tool accuracy enhancement by error compensation. Prec. Eng., Vol. 8, No. 4, pp. 187-196. 6. Kurtoglu, A. (1992). The accuracy improvement of machine tools. Ann CIRP, Vol. 139, No. 1, pp. 259-262. 7. Shin, Y. & Wei, Y. (1992). A statistical analysis of positional errors of a multiaxis machine tool. Prec Eng, Vol.
14, No. 3, pp. 139-146. 8. Duffie, N. & Bollinger, J. G. (1985). Generation of parametric kinematic error correction functions from
volumetric error measurements. Ann CIRP, Vol. 34, No. 1, pp. 259-262. 9. Mou, J. & Liu, C. R. (1992). A method for enhancing the accuracy of CNC machine tools for on-machine
inspection. J. Manuf. Syst. Vol. 11, No. 4, pp. 229-237. 10. Dorndorf, U., Kridena, V. S. B. & Ferreira, P. M. (1994). Optimal budgeting of quasistatic machine tool errors.
J. Eng. Ind. Vol. 116, pp. 42-53. 11. Shin, Y. C., Chin, H. & Brink, M. J. (1991). Characterization of CNC machining centers. J. Manufacturing Syst.
Vol. 10, No. 5, pp. 407-421. 12. Novakovic, B. N. & Atanackovic, T. M. (2004). On stability of the column with a step change in a cross section.
Iranian Journal of Science and Technology, Transaction B, Engineering, Vol. 28, No. B4, pp. 379-488.
Prediction of angular errors on avertical…
October 2011 IJST, Transactions of Mechanical Engineering, Volume 35, Number M2
195
13. Okafor, A. C. & Ertekin, Y. M. (2000). Derivation of machine tool error models and error compensation procedure for three axes vertical machining center using rigid body kinematics. Int. J. Mach. Tools Man., Vol. 40, No. 8, pp. 1199-1213.
14. Castro, H. F. F. & Burdekin, M. (2003). Dynamic calibration of the positioning accuracy of machine tools and coordinate measuring machines using a laser interferometer. Int. J. Mach. Tools Man., Vol. 43, No. 9, pp. 947-954.
15. Jaefaradeh, M. R. (2005). Thermal behavior of a large salinity-gradient solar pond in the city of Mashhad. Iranian Journal of Science and Technology, Transaction B, Engineering, Vol. 29, No. B2, pp. 219-228.
16. Pahk, H. J., Kim, Y. S. & Moon, J. H. (1997). A new technique for volumetric error assessment of CNC machine tools incorporating ball bar measurement and 3D volumetric error model. Int. J. Mach. Tools Man., Vol. 37, No. 11, pp. 1583-1596.
17. Ramesh, R. & Mannan, M. A. (2000). Error compensation in machine tools - a review Part I: geometric, cutting-force induced and fixture-dependent errors. Int. J. Mach. Tools Man., Vol. 40, No. 9, pp. 1235-1256.
18. Bryan, J. (1990). International status of thermal error research. Ann CIRP, Vol. 39, No. 2, pp. 645-656. 19. Laser Straighor User's Manual. CHUO Precision Industrial Co. 20. Howard, D. & Beale, M. (2006). Neural network toolbox user’s guide. Mathworks, Inc.