PREDICTION AND VALIDATION OF HIGH …The predictions compare favorably with test data, providing...
13
Paper ID: ETC2017-260 Proceedings of 12th European Conference on Turbomachinery Fluid dynamics & Thermodynamics ETC12, April 3-7, 2017; Stockholm, Sweden OPEN ACCESS Downloaded from www.euroturbo.eu 1 Copyright © by the Authors PREDICTION AND VALIDATION OF HIGH-PERFORMANCE CENTRIFUGAL COMPRESSOR IMPELLER FORCED RESPONSE L. Toni 1 , F. Moyroud 2 , K. Ramakrishnan 3 , V. Michelassi 4 , E. Schurr 5 GE Oil & Gas - Via Felice Matteucci 2, 50127, Firenze, Italy, [email protected] GE Oil & Gas - 480 Allée Gustave Eiffel, 71203 Le Creusot, France, [email protected] GE Global Research - 1 Research Circle, 12309-1027, Niskayuna, USA, [email protected] GE Oil & Gas - Via Felice Matteucci 2, 50127, Firenze, Italy, [email protected] GE Oil & Gas - 300 Garlington Road, 29615, Greenville, USA, [email protected] ABSTRACT High-performance centrifugal compressors call for a reduction in weight to relax rotor- dynamic constraints, and a reduction in blade thickness as a way to improve efficiency. In this tight design space, synchronous excitations on impellers are often unavoidable and may represent a potential aeromechanic risk, especially for high speed stages operated at high pressures. Therefore, forced response analysis has become a fundamental design step. The aero/structure unsteady interaction in impellers, mainly driven by both stationary row wakes and potential fields, and the possible overlap with structural frequencies, must be carefully analyzed and quantified since they may lead to high cycle fatigue failures under critical operating conditions. This paper focuses on the forced response analysis of an unshrouded high-speed centrifugal impeller incorporating aircraft engine technology designed for hydrocarbon processing. The methodology focuses on the effects of generic disturbances (inlet distortions, potential fields, aero-acoustic excitations) superimposed in amplitude and frequency on the time averaged flow field, and follows a rigorous numerical approach supported by validation against dedicated aeromechanic test data. Aerodynamic forcing frequencies and amplitudes, and the corresponding aero-mechanic damping jointly contribute to the vibratory response. An unsteady CFD analysis determines the impeller aerodynamic load which, in conjunction with FE (Finite Elements) modal analysis, allows for computing the modal force. A time-linearized Navier-Stokes computation predicts the aerodynamic damping, and allows mapping the mode shapes onto the CFD grid in order to supply the displacement boundary conditions. A purely numerical Goodman diagram has been drawn and the response level for a specific structural mode shape analyzed. The predictions compare favorably with test data, providing confidence in this method for practical high-speed radial compressor design. KEYWORDS AEROMECHANICS, CENTRIFUGAL COMPRESSOR, FORCED RESPONSE, AERO- DAMPING, MODAL FORCE
Transcript of PREDICTION AND VALIDATION OF HIGH …The predictions compare favorably with test data, providing...
Paper ID: ETC2017-260 Proceedings of 12th European Conference on Turbomachinery Fluid dynamics & Thermodynamics
ETC12, April 3-7, 2017; Stockholm, Sweden
OPEN ACCESS Downloaded from www.euroturbo.eu
1 Copyright © by the Authors
PREDICTION AND VALIDATION OF HIGH-PERFORMANCE
CENTRIFUGAL COMPRESSOR IMPELLER FORCED
RESPONSE
L. Toni1, F. Moyroud
2, K. Ramakrishnan
3, V. Michelassi
4, E. Schurr
5
GE Oil & Gas - Via Felice Matteucci 2, 50127, Firenze, Italy, [email protected]
GE Oil & Gas - 480 Allée Gustave Eiffel, 71203 Le Creusot, France, [email protected]
GE Global Research - 1 Research Circle, 12309-1027, Niskayuna, USA, [email protected]
GE Oil & Gas - Via Felice Matteucci 2, 50127, Firenze, Italy, [email protected]
GE Oil & Gas - 300 Garlington Road, 29615, Greenville, USA, [email protected]
ABSTRACT
High-performance centrifugal compressors call for a reduction in weight to relax rotor-
dynamic constraints, and a reduction in blade thickness as a way to improve efficiency. In this
tight design space, synchronous excitations on impellers are often unavoidable and may
represent a potential aeromechanic risk, especially for high speed stages operated at high
pressures. Therefore, forced response analysis has become a fundamental design step. The
aero/structure unsteady interaction in impellers, mainly driven by both stationary row wakes
and potential fields, and the possible overlap with structural frequencies, must be carefully
analyzed and quantified since they may lead to high cycle fatigue failures under critical
operating conditions.
This paper focuses on the forced response analysis of an unshrouded high-speed
centrifugal impeller incorporating aircraft engine technology designed for hydrocarbon
processing. The methodology focuses on the effects of generic disturbances (inlet distortions,
potential fields, aero-acoustic excitations) superimposed in amplitude and frequency on the
time averaged flow field, and follows a rigorous numerical approach supported by validation
against dedicated aeromechanic test data.
Aerodynamic forcing frequencies and amplitudes, and the corresponding aero-mechanic
damping jointly contribute to the vibratory response. An unsteady CFD analysis determines
the impeller aerodynamic load which, in conjunction with FE (Finite Elements) modal
analysis, allows for computing the modal force. A time-linearized Navier-Stokes computation
predicts the aerodynamic damping, and allows mapping the mode shapes onto the CFD grid
in order to supply the displacement boundary conditions. A purely numerical Goodman
diagram has been drawn and the response level for a specific structural mode shape analyzed.
The predictions compare favorably with test data, providing confidence in this method for
practical high-speed radial compressor design.
KEYWORDS
AEROMECHANICS, CENTRIFUGAL COMPRESSOR, FORCED RESPONSE, AERO-
DAMPING, MODAL FORCE
2
NOMENCLATURE
d = Modal Displacement depends on normalization
f = Frequency [Hz]
Faero = Aerodynamic Motion Independent Force [N]
Fmodal = Modal Force depends on normalization
k = Blade to Blade Variability Factor [-]
P = Pressure [Pa]
Q = Damping Amplification Factor 𝑄 = 12𝜁⁄ [-]
Greeks
= Mode Shape depends on normalization
ρ = Density [kg/m3]
σ = Stress [MPa]
ω = Angular Frequency [rad/s]
ζ = Overall Critical Damping Ratio [-]
ζaero = Aerodynamic Critical Damping Ratio [-]
ζmat = Material Critical Damping Ratio [-]
Acronyms
CFD = Computational Fluid Dynamics
FEA = Finite Element Analysis
RANS = Reynolds Averaged Navier-Stokes
SG = Strain Gauge
INTRODUCTION
Centrifugal compressors are routinely used for both gas processing and aero-propulsion.
Although the specifications and operating conditions are quite different (gas properties, tip speeds,
durability, weight constraints and the like), there is a common growing demand for performance,
power density, and weight reduction. Reducing weight by reducing blade, hub and shroud thickness
does mitigate rotor-dynamic risks and improve performance. Nevertheless, the concerted action of
the consequent structural eigen-frequencies reduction together with higher excitation frequencies
and higher static stresses due to higher tip speeds required to meet higher power density, does
increase the risk of incurring into aeromechanics and/or aeroacoustics risks. The complex nature of
the flow field in a centrifugal compressor, where the fluid is subject to both strong meridional and
blade-to-blade curvatures, and the mutual interaction between components calls for a detailed
validation and screening of the aero design, as shown by Guidotti et al. (2014), and aeromechanical
design methods, covered in this paper.
The importance of this topic is witnessed by the vast open literature. Dickmann et al. (2009)
studied the aero mechanics performance of centrifugal compressor components by investigating the
unsteady interaction of a turbocharger impeller with a vaned diffuser and exit scroll. Their analyses
aimed at determining aeromechanic loads at both design point and part load. While showing how
CFD can predict the measured vibrations, they also introduced a new method to account for real
manufacturing mistuning effects.
Open-faced impellers are routinely used in aero-propulsion and turbocharging, and are
becoming more popular in gas processing as well. Unshrouded impeller aeromechanics is very
sensitive to inlet distortions, and Kammerer and Abhari (2009 Part I and II) completed a detailed
experimental investigation in a closed loop rig. They intentionally created inlet flow distortions to
excite three different resonant crossings, and measured fundamental and harmonic frequencies for a
number of pressure settings, and compared with design predictions. While aerodynamic flow field
3
was characterized by FRAP (Fast Response Aerodynamic Probes), they determined how maximum
response amplitudes were a function of inlet pressure, although the amplification with growing inlet
pressure was not the same for all modes. The same authors determined damping, both mechanical
and aerodynamic, as this is very important to understand if a specific mode at a given excitation
frequency is truly dangerous at varying inlet pressure.
On top of forced-response driven by wakes and component-to-component interaction, described
by Dickmann et al. (2009) and Kammerer and Abhari (2009), aeroacoustics proved to be a matter of
concern, as described by Koenig et al. (2009) and by Koenig (2009). While failures of radial
impellers are fortunately very rare, Koenig documented a case in which acoustic eigenmodes could
be responsible for mechanical failures. The so-called triple-crossing, when structural resonance
frequencies correspond to both aerodynamic and acoustic frequencies, may become risky especially
in units that are asked to operate in a wide operating range and under variable inlet conditions. In
particular, Koenig et al. analysis reveals that the design of centrifugal compressor cavities must be
considered when screening aeromechanics. In view of the results of Koenig et al., Clancy et al.
(2014) performed a linearized Navier-Stokes CFD investigation of a centrifugal compressor
equipped with a shrouded impeller. Their unsteady simulations included both the hub and shroud
cavities to reveal how the unsteady pressure field in the flow path may impact excitation of the
impeller by eigenmodes of the impeller, cavity acoustics, and Tyler-Sofrin modes.
Centrifugal compressors are often equipped with vaned diffusers of both the low and high
solidity type. In these cases, the complexity of the unsteady pressure field increases due to the
presence of an additional blade row (the vaned diffuser). Furthermore, the small streamwise gap
between impeller trailing edge and vaned diffuser leading edge, necessary not to jeopardize
efficiency, results in strong wakes and bow waves with potential impeller-diffuser interaction that
must be carefully scrutinized for aeromechanics risks, as performed by Ramakrishnan et al. (2011).
The CFD analysis showed how acoustic modes can grow potentially dangerous as opposed to a
vaneless diffuser configuration.
Mechanical and unsteady aerodynamics analyses can identify frequencies and forcing
amplitude. Nevertheless, to translate this into stresses requires an estimate of damping. Damping is
of material, mechanical, and aerodynamic nature (see Kammerer and Abhari, (2009)). The
determination of the first two contributions requires specific mechanical test, while the third is
much more problematic as it depends on the operating conditions, and may change with both
operating pressure and flow regime (close to choke or to stall). Aerodynamic damping can be
determined by using accurate measurements, as indicated by Kammerer and Abhari (2009, Part II),
essentially by the difference between the measured overall damping during stage operation and the
pre-measured mechanical and material damping. Still, it is desirable to determine aerodynamic
damping in the early design phase to predict and overcome design problems. In this view, Toni et
al. (2016) proved how CFD could led to a realistic estimate of damping, ultimately allowing to
predict the vibratory response levels and the associated stresses.
With this in mind, this paper describes a method to compute aero-damping and modal force for the
aeromechanic verification of centrifugal compressors. The justification for the proposed approach
and its validation are discussed to prove the practical applicability to real designs and realistic
operating conditions.
NUMERICAL METHODOLOGY
The CFD analysis was performed using a proprietary Reynolds Averaged Navier-Stokes flow
solver. The code is a 3D finite-volume, multi-block, multi-grid, structured, explicit Runge-Kutta
solver developed and validated for turbomachinery flows; further details on the CFD method can be
found in Holmes et al. (1997). The grids adopted are the result of a grid sensitivity study that was
conducted in a number of turbomachinery applications. In the present study, k-ω turbulence model
with wall functions has been used and the y+ values generally range from 15-30 on the walls at the
analyzed condition.
4
Damping Computation
The numerical method for time harmonic calculations for aeromechanics is described in detail
in Clancy et al. (2014) and in Toni et al. (2016) and it will be briefly summarized here. A time-
linearized Navier–Stokes method is used to predict the aerodynamic damping, where the
perturbations to the steady base flow arising from blade motion are assumed to be small.
First, the steady flow around a periodic sector of the impeller is computed. Then, the modal
displacements from a finite element model of the structure are mapped onto the CFD grid as a
boundary condition to the linearized Navier-Stokes solver. Then, the unsteady pressures resulting
from the blade motion are used to compute an aerodynamic work per cycle on the vibrating airfoil.
Knowing both frequency and modal mass associated with the vibration mode, the aerodynamic
work may be converted into an equivalent aerodynamic damping. For this analysis, phase lagged
boundary conditions are enforced on the periodic surfaces of the model and non-reflecting boundary
conditions are applied at the inlet and exit boundaries to minimize pressure wave reflections.
The linearized approach predicts aerodynamic damping levels in good agreement with the
measured values in a range of cases; therefore the non-linear method was not applied.
Modal Force Computation
To compute the modal force, an unsteady CFD analysis of the impeller aerodynamic response
to the inlet distortion is performed as described in the next section. The resulting unsteady pressure
field at the frequency of interest is projected onto a basis of orthogonal vectors consisting of a set of
natural mode shapes of the impeller. Like for the aerodynamic damping computation, the mode
shapes are interpolated onto the CFD grid (generally finer than the FEA grid on the impeller
surface). The reader can refer to Moyroud et al. (2000) for a discussion on the pros and cons of
using the CFD grid to compute modal force.
For a given combination of an impeller mode shape and the unsteady pressure field at a given
excitation frequency, the modal force is a complex valued scalar quantity defined as follows:
aero
C
modalmodalFF [1]
Where modal
is the transpose of the vector of complex nodal displacements for all modal
displacement components at all CFD nodes, and aero
F is a vector of nodal unsteady aerodynamic
loads in complex form resulting from the surface integration of frequency domain unsteady pressure
perturbations on the impeller walls at the excitation frequency of interest (or source of excitation).
The C superscript denotes the complex conjugate operator. Generally, the mode shapes are mass
normalized and therefore the corresponding modal response displacements or participation factors
can be calculated as follows:
22
22/
)(
modalemodalemodal
modal
emodal
Q
Fd
[2]
Where Q is the amplification factor calculated from the aero-mechanical modal damping (that is
the sum of material, mechanical and aerodynamic damping, see also “Aero-Damping” section), and
ωmodal is the natural angular frequency of the impeller mode. Under resonance conditions, we have:
2)(
modal
modalmodal
modalemodal
QFd
[3]
5
This single degree of freedom modal participation factor or displacement is used to scale the
modal stresses and to compute physical alternating stresses at any node on the surface of the
impeller FEA model, for representation in the numerical Goodman diagram.
Unsteady CFD Analysis for Forced Response
The aeromechanic response of centrifugal impellers requires the prediction of the unsteady flow
field either by a non-linear or a linear approach. The experience so far, while validating forced
response computations against test data, demonstrated that the more complex and time-consuming
approach based on nonlinear unsteady CFD, leads to results much closer to experimental data, while
a linearized approach was found appropriate to determine aerodynamic damping.
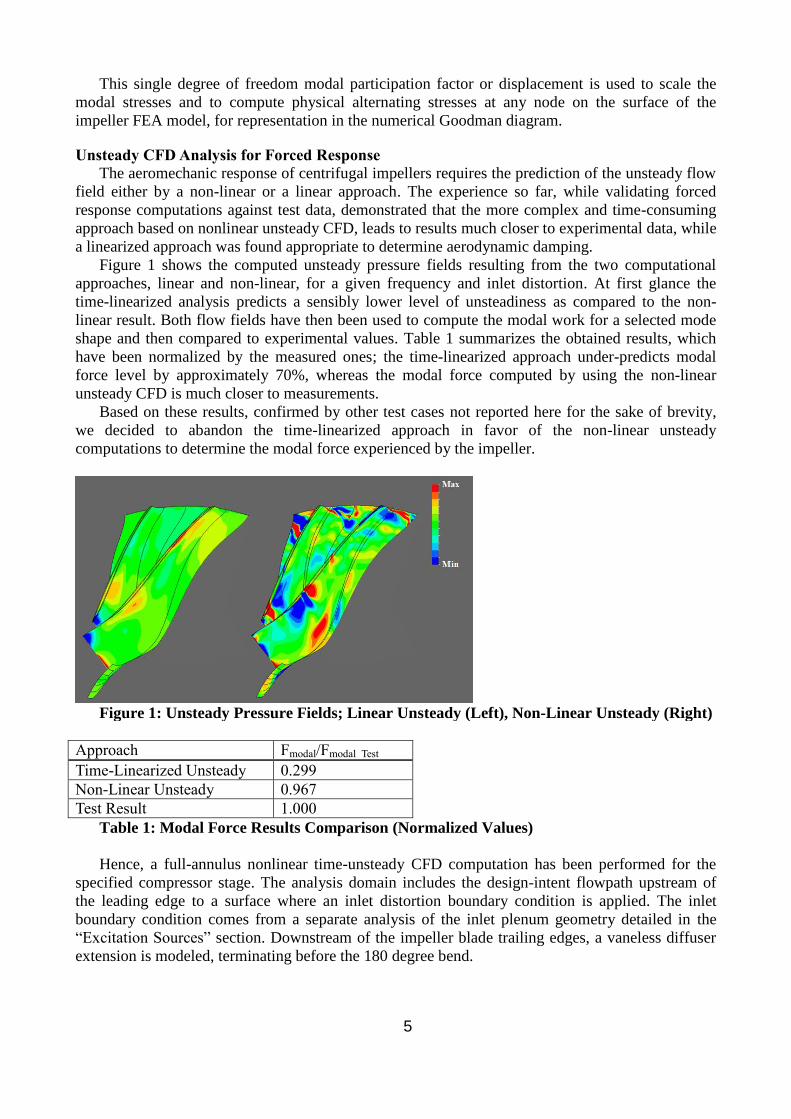
Figure 1 shows the computed unsteady pressure fields resulting from the two computational
approaches, linear and non-linear, for a given frequency and inlet distortion. At first glance the
time-linearized analysis predicts a sensibly lower level of unsteadiness as compared to the non-
linear result. Both flow fields have then been used to compute the modal work for a selected mode
shape and then compared to experimental values. Table 1 summarizes the obtained results, which
have been normalized by the measured ones; the time-linearized approach under-predicts modal
force level by approximately 70%, whereas the modal force computed by using the non-linear
unsteady CFD is much closer to measurements.
Based on these results, confirmed by other test cases not reported here for the sake of brevity,
we decided to abandon the time-linearized approach in favor of the non-linear unsteady
computations to determine the modal force experienced by the impeller.
Figure 1: Unsteady Pressure Fields; Linear Unsteady (Left), Non-Linear Unsteady (Right)
Approach Fmodal/Fmodal_Test
Time-Linearized Unsteady 0.299
Non-Linear Unsteady 0.967
Test Result 1.000
Table 1: Modal Force Results Comparison (Normalized Values)
Hence, a full-annulus nonlinear time-unsteady CFD computation has been performed for the
specified compressor stage. The analysis domain includes the design-intent flowpath upstream of
the leading edge to a surface where an inlet distortion boundary condition is applied. The inlet
boundary condition comes from a separate analysis of the inlet plenum geometry detailed in the
“Excitation Sources” section. Downstream of the impeller blade trailing edges, a vaneless diffuser
extension is modeled, terminating before the 180 degree bend.

6
The structured impeller grid was generated using Autogrid by NUMECA and contains ~56M
cells. Within the domain, the clearance region is accurately modeled, along with the root fillet;
Figure 2 shows CFD impeller grid details.
The steady-state flow field was converged using the proprietary solver, then the unsteady
computation was started by imposing the conditions from the inlet plenum/impeller interface at the
inlet of the impeller. Periodic convergence was achieved through running multiple revolutions of
the rotor. The number of time-steps per revolution was set to the current best practice at GE. After
convergence was achieved, two more revolutions were completed and averaged to output unsteady
static pressures for post-processing. Based on prior GE-internal analyses, averaging the solution
over multiple revolutions has been shown to improve the frequency discretization, especially for
lower order frequency content. For this analysis, the primary focus was on predicted responses in
the choke region. In the choke region, strong shocks are seen on both the main and splitter blades.
These shocks are greatly influenced by the inlet pressure distortion. The modal forces and
aerodynamic damping are also directly connected to the inlet distortion and its effect on the flow
field.
Figure 2: CFD Mesh Details
In order to decompose the unsteady pressures from the full-annulus unsteady calculation into a
suitable form for aeromechanical calculations, a Fast Fourier Transform was performed on the
blades’ time-unsteady static pressures, converting to the frequency domain. This allowed for the
specific harmonics of interest to be extracted for modal force calculations. In particular the 7th
harmonic unsteady pressure field has been considered since, as detailed below, this was the main
harmonic of interest at the choked-flow condition.
EXPERIMENTAL SET-UP
An unshrouded high Mach number and high flow coefficient impeller for Oil & Gas application
has been selected as a test case for aeromechanics validation. The tested impeller has been designed
with 11 main flow channels. Contained in each main channel is a splitter blade.
Rig Layout and Instrumentation
Model testing was performed at the GE Oil & Gas Technology Laboratory (OGTL) in Florence.
The test bench is a closed loop rotating single stage rig, normally employed for performance
measurements of different centrifugal compressor designs; further details can be found Toni et al.
(2010), Bianchini et al. (2012) and in Guidotti et al. (2011).
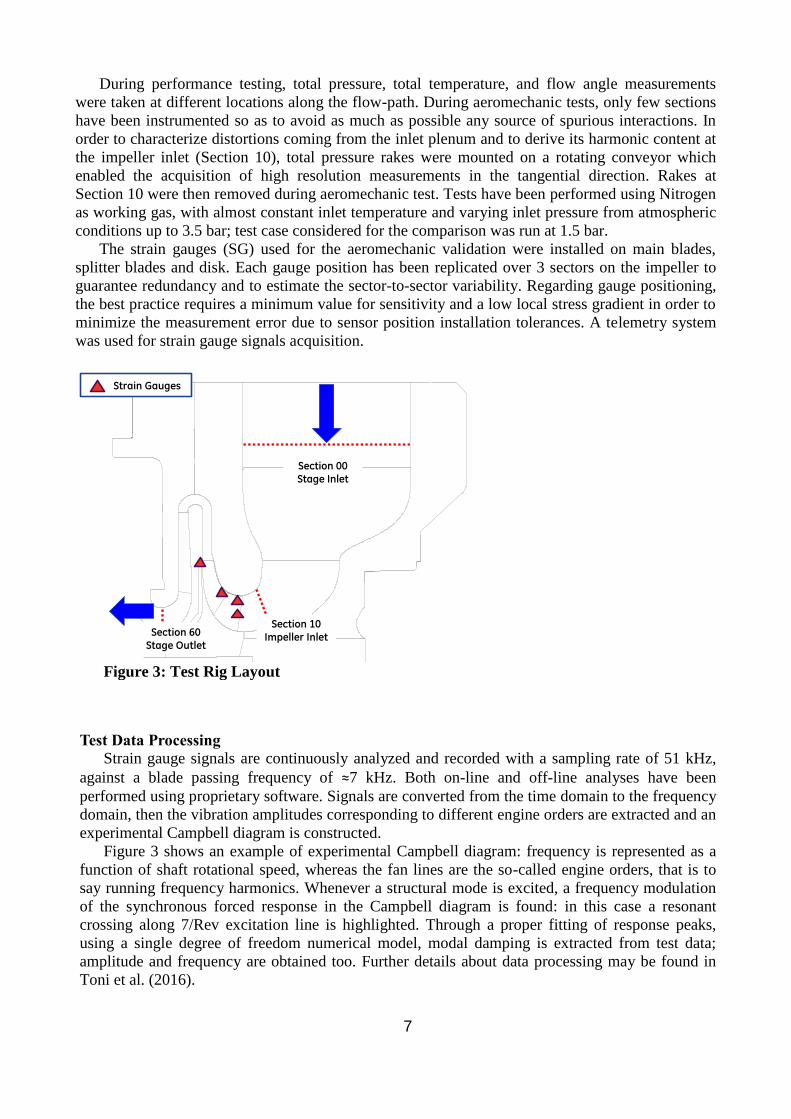
The impeller has been tested in a first stage arrangement, thus an inlet plenum is included; see
Figure 3. This plenum is designed to achieve minimum losses and low flow distortions and
comprises three non-uniformly spaced straightener vanes. A vaneless diffuser and return channel
are included in the stage as well, approximating conditions in a product.
7
During performance testing, total pressure, total temperature, and flow angle measurements
were taken at different locations along the flow-path. During aeromechanic tests, only few sections
have been instrumented so as to avoid as much as possible any source of spurious interactions. In
order to characterize distortions coming from the inlet plenum and to derive its harmonic content at
the impeller inlet (Section 10), total pressure rakes were mounted on a rotating conveyor which
enabled the acquisition of high resolution measurements in the tangential direction. Rakes at
Section 10 were then removed during aeromechanic test. Tests have been performed using Nitrogen
as working gas, with almost constant inlet temperature and varying inlet pressure from atmospheric
conditions up to 3.5 bar; test case considered for the comparison was run at 1.5 bar.
The strain gauges (SG) used for the aeromechanic validation were installed on main blades,
splitter blades and disk. Each gauge position has been replicated over 3 sectors on the impeller to
guarantee redundancy and to estimate the sector-to-sector variability. Regarding gauge positioning,
the best practice requires a minimum value for sensitivity and a low local stress gradient in order to
minimize the measurement error due to sensor position installation tolerances. A telemetry system
was used for strain gauge signals acquisition.
Figure 3: Test Rig Layout
Test Data Processing
Strain gauge signals are continuously analyzed and recorded with a sampling rate of 51 kHz,
against a blade passing frequency of ≈7 kHz. Both on-line and off-line analyses have been
performed using proprietary software. Signals are converted from the time domain to the frequency
domain, then the vibration amplitudes corresponding to different engine orders are extracted and an
experimental Campbell diagram is constructed.
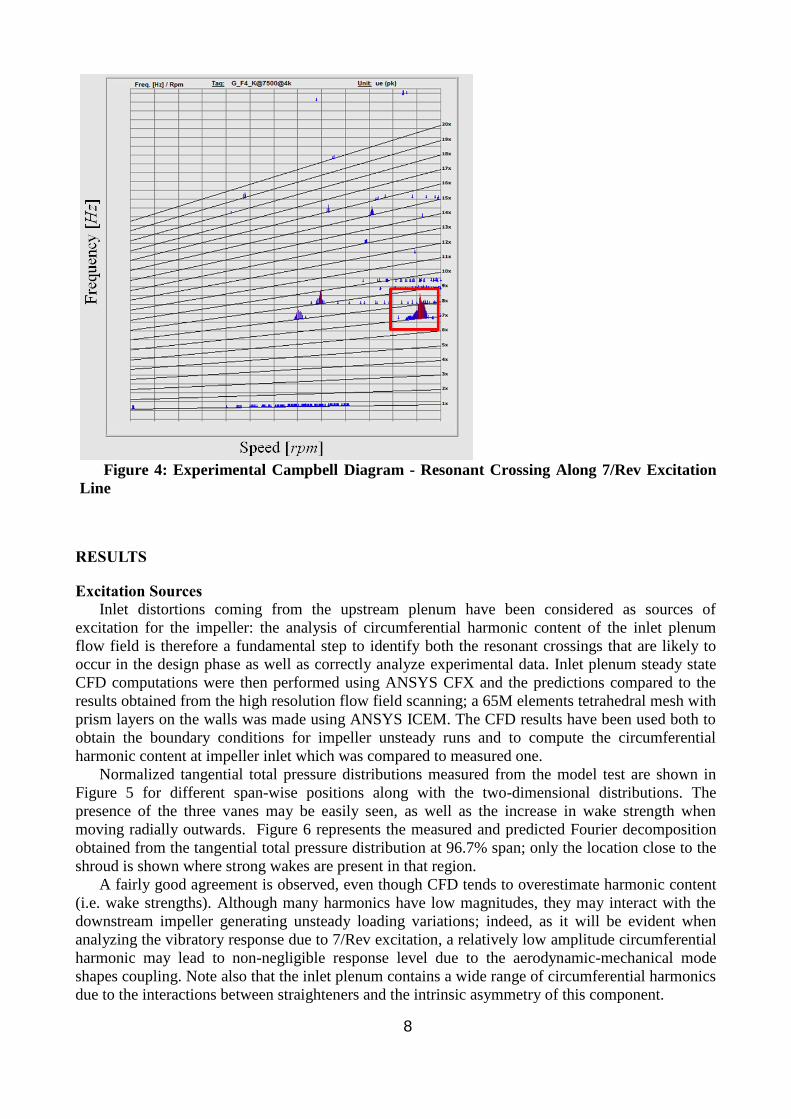
Figure 3 shows an example of experimental Campbell diagram: frequency is represented as a
function of shaft rotational speed, whereas the fan lines are the so-called engine orders, that is to
say running frequency harmonics. Whenever a structural mode is excited, a frequency modulation
of the synchronous forced response in the Campbell diagram is found: in this case a resonant
crossing along 7/Rev excitation line is highlighted. Through a proper fitting of response peaks,
using a single degree of freedom numerical model, modal damping is extracted from test data;
amplitude and frequency are obtained too. Further details about data processing may be found in
Toni et al. (2016).
Section 10Impeller InletSection 60
Stage Outlet
Section 00Stage Inlet
Strain Gauges
8
Figure 4: Experimental Campbell Diagram - Resonant Crossing Along 7/Rev Excitation
Line
RESULTS
Excitation Sources
Inlet distortions coming from the upstream plenum have been considered as sources of
excitation for the impeller: the analysis of circumferential harmonic content of the inlet plenum
flow field is therefore a fundamental step to identify both the resonant crossings that are likely to
occur in the design phase as well as correctly analyze experimental data. Inlet plenum steady state
CFD computations were then performed using ANSYS CFX and the predictions compared to the
results obtained from the high resolution flow field scanning; a 65M elements tetrahedral mesh with
prism layers on the walls was made using ANSYS ICEM. The CFD results have been used both to
obtain the boundary conditions for impeller unsteady runs and to compute the circumferential
harmonic content at impeller inlet which was compared to measured one.
Normalized tangential total pressure distributions measured from the model test are shown in
Figure 5 for different span-wise positions along with the two-dimensional distributions. The
presence of the three vanes may be easily seen, as well as the increase in wake strength when
moving radially outwards. Figure 6 represents the measured and predicted Fourier decomposition
obtained from the tangential total pressure distribution at 96.7% span; only the location close to the
shroud is shown where strong wakes are present in that region.
A fairly good agreement is observed, even though CFD tends to overestimate harmonic content
(i.e. wake strengths). Although many harmonics have low magnitudes, they may interact with the
downstream impeller generating unsteady loading variations; indeed, as it will be evident when
analyzing the vibratory response due to 7/Rev excitation, a relatively low amplitude circumferential
harmonic may lead to non-negligible response level due to the aerodynamic-mechanical mode
shapes coupling. Note also that the inlet plenum contains a wide range of circumferential harmonics
due to the interactions between straighteners and the intrinsic asymmetry of this component.

9
In order to determine if the impeller is exposed to resonant vibratory response and to prevent
high cycle fatigue failures during service, an FEA cyclic symmetric pre-stressed modal analysis was
conducted during the design cycle and prior to testing to extract all natural modes in the band of
relevant aerodynamic excitation frequencies. In this type of analysis, the impeller is assumed to be
perfectly tuned and the effects of sector-to-sector variability are ignored.
Figure 5: High Resolution Flow Field Scanning, Normalized Total Pressure
Figure 6: Inlet Plenum Harmonics in Shroud Region – CFD vs. Test
These impeller modal results were combined with the 7/Rev inlet plenum aerodynamic
excitation frequencies to produce the interference diagram presented in Figure 7. The Fourier orders
of the tuned impeller modes are identified and the modes are grouped according to the impeller
structural component with the dominant modal participation. The impeller has splitter blades, i.e. a
set of long blades paired by a set of shorter blades. Since the impeller main blades are more flexible
than the splitter blades and the disk, the lowest modes form a family of main blade first bending
mode shapes with 0 to 5 nodal diameters. The 7/Rev excitation is represented by a red vertical line
covering the range of shaft speed from 80% to 105% of the test rig nominal speed. The impeller
strain gauge responses clearly show a fully resolved resonance peak, Figure 3.
0.940
0.950
0.960
0.970
0.980
0.990
1.000
1.010
0 90 180 270 360
Pt/
Pt_
Av
g [
-]
Theta [deg]
Span 3.9 %
Span 27.2 %
Span 50 %
Span 73.5 %
Span 96.7 %
0.00%
0.10%
0.20%
0.30%
0.40%
0.50%
0.60%
0.70%
0 1 2 3 4 5 6 7 8 9 10 11 12 13
Pt/
Pt_
Av
g [
-]
Spatial Harmonic
Test CFD

10
Figure 7: Impeller Interference Diagram Showing the Family of Main Blade First Flex
Modes (with 0 to 5 Nodal Diameters) and the 7/Rev Excitation Frequency Band From 80% to
105% Centrifugal Compressor Shaft Speed
Aero-Damping
It is well established that the aeromechanical damping is the sum of material, mechanical and
aerodynamic damping generated during one cycle of vibration in any particular impeller mode
shape. The material damping is related to internal energy dissipation, which may change due to
metallurgical processes, see also Gibert et al. (2012). For one-piece impellers no energy dissipation
due to friction is present so the second term is commonly neglected. The aerodynamic damping is
an inviscid phenomenon resulting from the unsteady pressure response of the impeller primary flow
path and secondary flow path as the impeller walls vibrates in resonance in a natural mode of
vibration. Both the material damping and the aerodynamic damping are driven by the mode shapes
and resonance frequency. Typically, the higher the resonance frequency the higher the material
damping and aerodynamic damping. The effect of the mode shape is difficult to appreciate and this
is why having a numerical prediction capability is important.
For any impeller natural mode, the critical damping ratio may then be expressed as the sum of
pressure dependent (or better, density dependent) aerodynamic damping and the pressure
independent material damping:
)()( aeromatmodal
[4]
Material damping values for the different mode shapes have been obtained through a dedicated
ping test campaign; the ζmat value for the main blade first flexural mode under investigation has
been added to numerical predictions. Material damping values found in present test case are within
the ones which have been obtained, in other cases, for first flexural mode shapes.
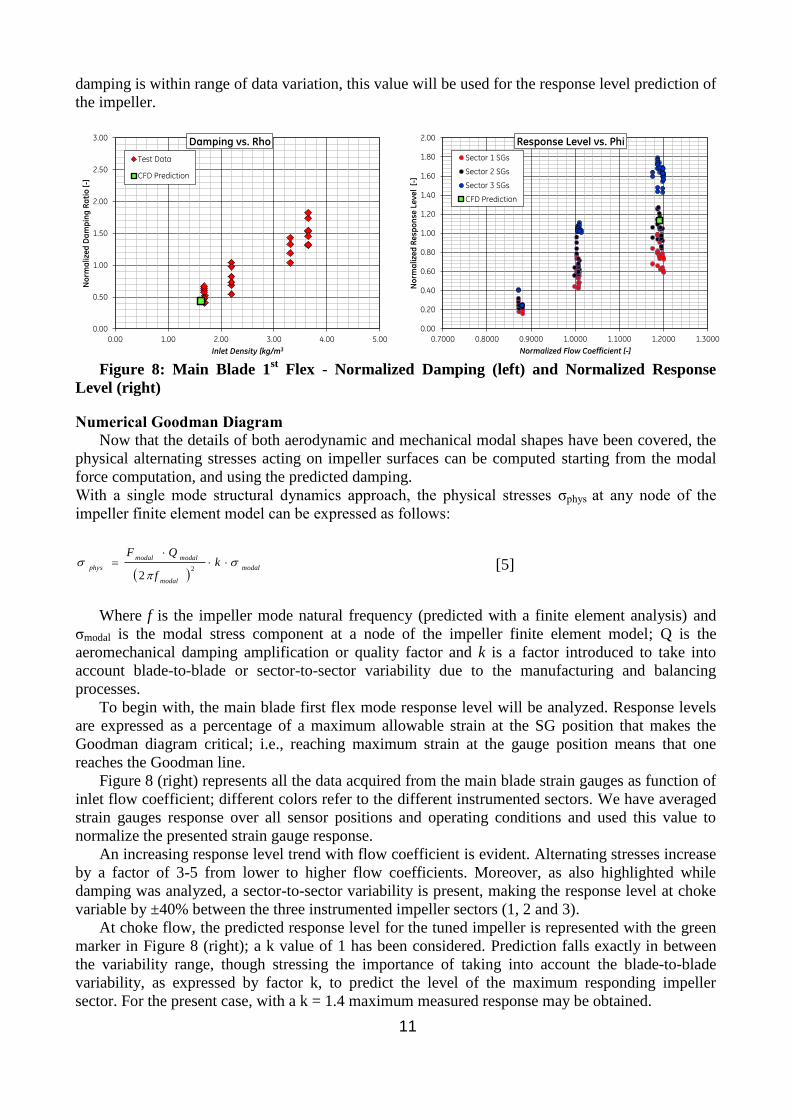
Figure 8 (left) shows the measured damping values for the mode shape under analysis in red
symbols. A linear increase of aeromechanical damping with density is observed in accordance with
the physical dependency on density. The spread in experimental data at constant density is mainly
related to gauge-to-gauge and sector-to-sector variability.
Predicted aeromechanical damping, obtained as per Equation 4 adding material damping to
aerodynamic damping, is then compared to experimental data. The value of predicted damping,
shown by the green symbol, is in good agreement with experimental data. Since the predicted
-5 -4 -3 -2 -1 0 1 2 3 4 5
105% of Nominal Shaft Speed
80% of Nominal Shaft Speed
Family of Main Blade 1st Flex Modes
Fre
qu
en
cy
Fourier Order
0.0 Max
11
damping is within range of data variation, this value will be used for the response level prediction of
the impeller.
Figure 8: Main Blade 1
st Flex - Normalized Damping (left) and Normalized Response
Level (right)
Numerical Goodman Diagram
Now that the details of both aerodynamic and mechanical modal shapes have been covered, the
physical alternating stresses acting on impeller surfaces can be computed starting from the modal
force computation, and using the predicted damping.
With a single mode structural dynamics approach, the physical stresses σphys at any node of the
impeller finite element model can be expressed as follows:
modal
modal
modalmodal
physk
f
QF
2
2 [5]
Where f is the impeller mode natural frequency (predicted with a finite element analysis) and
σmodal is the modal stress component at a node of the impeller finite element model; Q is the
aeromechanical damping amplification or quality factor and k is a factor introduced to take into
account blade-to-blade or sector-to-sector variability due to the manufacturing and balancing
processes.
To begin with, the main blade first flex mode response level will be analyzed. Response levels
are expressed as a percentage of a maximum allowable strain at the SG position that makes the
Goodman diagram critical; i.e., reaching maximum strain at the gauge position means that one
reaches the Goodman line.
Figure 8 (right) represents all the data acquired from the main blade strain gauges as function of
inlet flow coefficient; different colors refer to the different instrumented sectors. We have averaged
strain gauges response over all sensor positions and operating conditions and used this value to
normalize the presented strain gauge response.
An increasing response level trend with flow coefficient is evident. Alternating stresses increase
by a factor of 3-5 from lower to higher flow coefficients. Moreover, as also highlighted while
damping was analyzed, a sector-to-sector variability is present, making the response level at choke
variable by ±40% between the three instrumented impeller sectors (1, 2 and 3).
At choke flow, the predicted response level for the tuned impeller is represented with the green
marker in Figure 8 (right); a k value of 1 has been considered. Prediction falls exactly in between
the variability range, though stressing the importance of taking into account the blade-to-blade
variability, as expressed by factor k, to predict the level of the maximum responding impeller
sector. For the present case, with a k = 1.4 maximum measured response may be obtained.
0.00
0.50
1.00
1.50
2.00
2.50
3.00
0.00 1.00 2.00 3.00 4.00 5.00
No
rma
lize
d D
am
pin
g R
ati
o [
-]
Inlet Density [kg/m3
Damping vs. Rho
Test Data
CFD Prediction
0.00
0.20
0.40
0.60
0.80
1.00
1.20
1.40
1.60
1.80
2.00
0.7000 0.8000 0.9000 1.0000 1.1000 1.2000 1.3000
No
rma
lize
d R
esp
on
se L
ev
el
[-]
Normalized Flow Coefficient [-]
Response Level vs. Phi
Sector 1 SGs
Sector 2 SGs
Sector 3 SGs
CFD Prediction
12
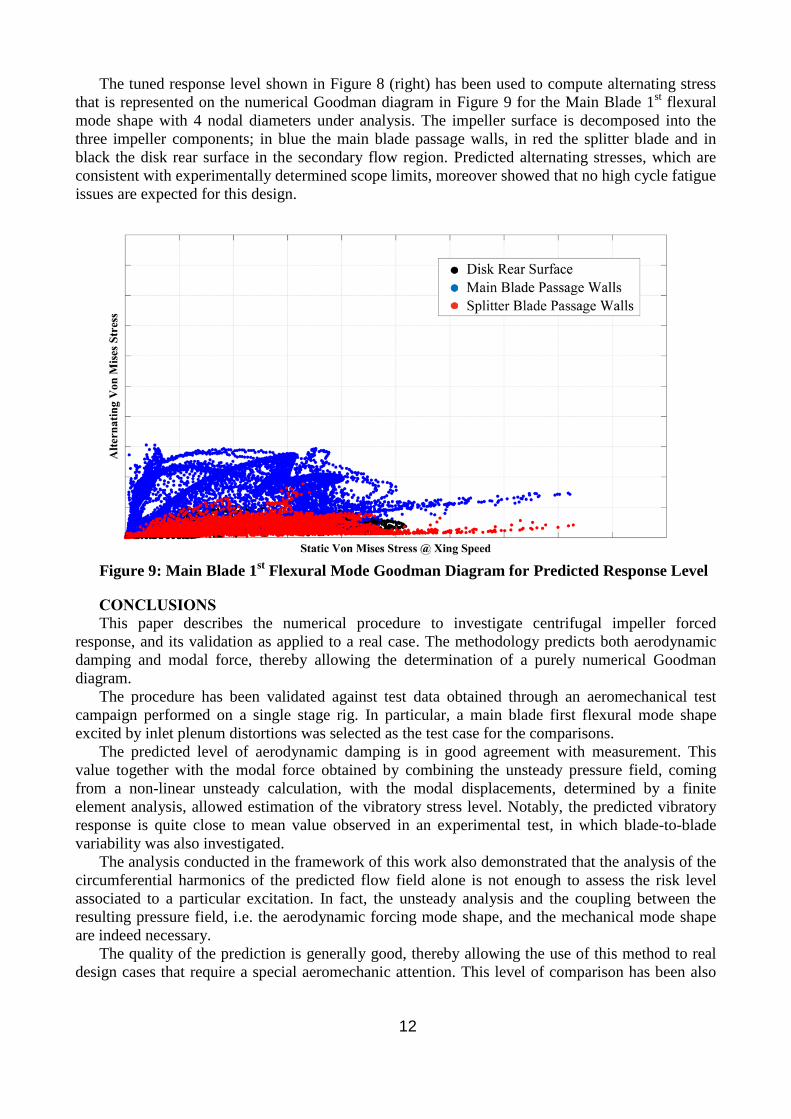
The tuned response level shown in Figure 8 (right) has been used to compute alternating stress
that is represented on the numerical Goodman diagram in Figure 9 for the Main Blade 1st flexural
mode shape with 4 nodal diameters under analysis. The impeller surface is decomposed into the
three impeller components; in blue the main blade passage walls, in red the splitter blade and in
black the disk rear surface in the secondary flow region. Predicted alternating stresses, which are
consistent with experimentally determined scope limits, moreover showed that no high cycle fatigue
issues are expected for this design.
Figure 9: Main Blade 1
st Flexural Mode Goodman Diagram for Predicted Response Level
CONCLUSIONS
This paper describes the numerical procedure to investigate centrifugal impeller forced
response, and its validation as applied to a real case. The methodology predicts both aerodynamic
damping and modal force, thereby allowing the determination of a purely numerical Goodman
diagram.
The procedure has been validated against test data obtained through an aeromechanical test
campaign performed on a single stage rig. In particular, a main blade first flexural mode shape
excited by inlet plenum distortions was selected as the test case for the comparisons.
The predicted level of aerodynamic damping is in good agreement with measurement. This
value together with the modal force obtained by combining the unsteady pressure field, coming
from a non-linear unsteady calculation, with the modal displacements, determined by a finite
element analysis, allowed estimation of the vibratory stress level. Notably, the predicted vibratory
response is quite close to mean value observed in an experimental test, in which blade-to-blade
variability was also investigated.
The analysis conducted in the framework of this work also demonstrated that the analysis of the
circumferential harmonics of the predicted flow field alone is not enough to assess the risk level
associated to a particular excitation. In fact, the unsteady analysis and the coupling between the
resulting pressure field, i.e. the aerodynamic forcing mode shape, and the mechanical mode shape
are indeed necessary.
The quality of the prediction is generally good, thereby allowing the use of this method to real
design cases that require a special aeromechanic attention. This level of comparison has been also

13
achieved and published in previous works with reference to damping computation for different
mode shapes and operating conditions.
This prediction process is now being used routinely as part of the design verifications to
quantify aeromechanical risk for new products.
REFERENCES
Bianchini, A., Ferrara, G., Ferrari, L., Ballarini, V., Bianchi, L., Tapinassi, L., and Toni, L., (2012).
Effects due to the Temperature Measurement Section on the Performance Estimation of a
Centrifugal Compressor Stage. Journal of Engineering for Gas Turbines and Power, 134, pp. 1-9.
Clancy, C., Moyroud, D., Ramakrishnan, K., (2014). Effect of Cavities on Impeller Aeromechanical
Forcing in a Low Pressure Ratio Centrifugal Compressor Stage. ASME GT2014-27304.
Dickmann, H.-P., Secall Wimmel, T., Szwedowicz, J., Kuehnel, J., Essig, U., (2009). Unsteady
Flow in a Turbocharger Centrifugal Compressor: 3D-CFD Simulation, Impeller Blade Vibration
and Vaned Diffuser-Volute Interaction. ASME GT2009-59046.
Gibert, C., Blanc, L., Almeida, P., Leblanc X., Ousty, J.-P., Thouverez, F. and Lainé, J.-P., (2012).
Modal Tests and Analysis of a Radial Impeller at Rest: Influence of Surrounding Air on Damping,
ASME Paper GT2012-69577.
Guidotti, E., Tapinassi, L., Toni, L., Bianchi, L., Gaetani, P., and Persico, G., (2011). Experimental
and Numerical Analysis of the Flow Field in the Impeller of a Centrifugal Compressor Stage at
Design Point. ASME Paper 2011-45036.
Guidotti, E., Toni, L., Rubino, D.T., Tapinassi, L., Naldi, G., Satish Koyyalamudi, Prasad, S.,
(2014). Influence of Cavity Flows Modeling on Centrifugal Compressor Stages Performance
Prediction across Different Flow Coefficient Impellers. ASME GT2014-25830.
Holmes, D.G., Mitchell, B.E., and Lorence, C.B., (1997). Three Dimensional Linearized Navier-
Stokes Calculation for Flutter and Forced Response, ISUAAT Symposium. Sweden.
Kammerer, A., and Abhari, R. S., (2009). Experimental Study on Impeller Blade Vibration During
Resonance Part I: Blade Vibration Due to Inlet Flow Distortion. Journal of Engineering for Gas
Turbines and Power, 131, pp. 022508-1.
Kammerer, A., and Abhari, R. S., (2009). Experimental Study on Impeller Blade Vibration During
Resonance Part II: Blade Damping. Journal of Engineering for Gas Turbines and Power, 131 (2),
pp. 022509-9.
Koenig, Sven (2009). Acoustic Eigenmodes in the Side Cavities of Centrifugal Compressors. ASME
GT2009-59650.
Koenig, S., Petry, N., Wagner, N. G., (2009). Aeroacoustic Phenomena in High-Pressure
Centrifugal Compressors – A Possible Root Cause for Impeller Failures. Proceedings of the 38th
Turbomachinery Symposium.
Moyroud, F., Cosme, N., Jocker, M., Fransson, T. H., Lornage, D., Jacquet G., (2000). A fluid-
structure interfacing technique for computational aeroelatic simulations, 9th International
Symposium on Unsteady Aerodynamics, Aeroacoustics and Aeroelasticity of Turbomachines, Lyon,
Sep 2000, France
Ramakrishnan, K., Richards, S. K., Moyroud, F., Michelassi, V., (2011). Multi-Blade Row
Interactions in a Low-Pressure Ratio Centrifugal Compressor Stage with a Vaned Diffuser. ASME
GT2011-45932.
Toni, L., Ballarini, V., Cioncolini, S., Persico, G., and Gaetani, P., (2010). Unsteady Flow Field
Measurements in an Industrial Centrifugal Compressor. Proceedings of the 39th
Turbomachinery
Symposium, Houston, USA.
Toni, L., Moyroud, F., Rubino, D. T., Gatta, G., Guglielmo, A., Ramakrishnan, K., (2016). Aero-
Damping Measurements and Computation in a Full-Scale Multistage Centrifugal Compressor.
Proceedings of the 45th
Turbomachinery and 32nd
Pump Symposia.