Predicting Fatigue Life with ANSYS Workbench Predicting Fatigue ...

1
Predicting the distribution of the Vulnerable Yellow-breasted Pipit (Anthus chloris) using
Species Distribution Modelling
Darren W. Pietersen1*, Ian T. Little2, Raymond Jansen3 and Andrew E. McKechnie1
1DST-NRF Centre of Excellence at the Percy FitzPatrick Institute, Department of Zoology and
Entomology, University of Pretoria, Private Bag X20, Hatfield, 0028, South Africa
2The Endangered Wildlife Trust, Private Bag X11, Modderfontein, 1645, Johannesburg, South Africa
3Department of Environmental, Water and Earth Sciences, Tshwane University of Technology,
Private Bag X680, Pretoria, 0001, South Africa
*Address for correspondence:
Department of Zoology and Entomology
University of Pretoria
Private Bag X20
Hatfield
0028
+27 82 937 6052
2
Abstract
The Yellow-breasted Pipit (Anthus chloris) is endemic to the eastern escarpment of South Africa,
marginally entering eastern Lesotho. This species is classified as globally Vulnerable due to a
perceived decreasing population size and loss of habitat. We employed Species Distribution
Modelling to investigate the predicted range of this species to determine whether additional
purportedly suitable habitat exists where this species may be found, and to assess the degree to
which habitat loss has affected this species. We used a database of 250 independently obtained and
verified sightings to predict the summer breeding distribution of this species and compare our
verified sightings and predicted range to the sightings currently in the Second Southern African Bird
Atlas Project (SABAP2) database and the latest regional conservation assessment. Our models
closely approximate the current distribution of the Yellow-breasted Pipit, and suggest that most of
the purportedly suitable habitat is occupied, at least at the macro-scale. Our models further suggest
that the Eastern Cape Province does not hold much suitable habitat for this species, and that the
purported range contraction in this region may have been overestimated.
Key words: Anthus chloris; Yellow-breasted Pipit; Breeding range; Range contraction
Suggested running head: Modelling Yellow-breasted Pipit distribution

3
Introduction
Species Distribution Models (SDM) are becoming increasingly prevalent in ecological and
biogeographical studies as a means, inter alia, to understand the drivers of species’ distributions,
predict the distributions of secretive and/or little-known species, and provide improved data for
conservation assessments (Elith and Leathwick 2009; Barve et al. 2011; Cassini 2011; Keith et al.
2014; Syfert et al. 2014; Collins and du Toit 2016). Species Distribution Models extract predictor
variable values at georeferenced occurrence locations, compare these values to sites where the
species of interest has not been recorded, and based on these comparisons predict regions where
these suitable variables (and thus the species) are most likely to occur (Elith and Leathwick 2009;
Barve et al. 2011). Three basic datasets are used by SDMs to identify areas matching a species’
environmental requirements, viz. mainly abiotic factors such as climate and topography;
predominantly biotic factors such as food resources, competitors and predators; and the
geographical regions that have potentially been utilised by a species over a fixed period of time,
taking into account any potential barriers to dispersal (Barve et al. 2011). Because the biotic factors
that may potentially affect a species’ distribution are often too complex to include in predictive
modelling, these are usually excluded (Soberón 2010; Barve et al. 2011).
The Yellow-breasted Pipit (Anthus chloris) is a southern African endemic passerine which occurs
along the eastern escarpment of South Africa from Dullstroom in the north to Cathcart in the south
(Clancey 1997; Barnes 2000; Voelker 2005, Peacock 2006; Little 2015; BirdLife International 2016).
The majority of this species’ range falls within South Africa, with marginal populations occurring in
eastern Lesotho (Osborne and Tigar 1990; Clancey 1997; Voelker 2005, Peacock 2006; Little 2015;
BirdLife International 2016). Small, apparently isolated populations persist in the north-eastern
Eastern Cape and the eastern Free State Provinces of South Africa, with recent evidence that this
species’ distribution has contracted in the Eastern Cape Province (Little 2015). It has further been

4
suggested that this species’ overall range has contracted in the past two decades, raising concerns
about its population size and status (Little 2015).
The Yellow-breasted Pipit is a summer breeder, with most breeding recorded between November
and February (Dean 1971; Tarboton et al. 1987; Clancey 1997; Muchai 2002; Little et al. 2015). The
species breeds in lush sub-montane grasslands at altitudes above 1,400 m a.s.l., and usually at
elevations of 2000–2300 m a.s.l., where they prefer grasslands that are 150–300 mm in height
(Clancey 1997; Tarboton 2001; Little 2015). They are highly sensitive to burning frequency and
timing as well as grazing intensity, preferring grasslands that are burnt every 2–3 years and
moderately grazed (Jansen et al. 1999; Muchai 2002; Little 2011, 2015; Little et al. 2013, 2015).
Although being restricted to the eastern escarpment during the breeding season, some individuals
descend to lower elevations on either side of the escarpment during the non-breeding season
(Clancey 1990, 1997; Peacock 2006), but due to their cryptic colouration and the consequent
difficulty in identifying this species during the non-breeding season (Keith et al. 1992; Voelker 2005;
Peacock 2006), the extent of their non-breeding range remains largely unknown.
Yellow-breasted Pipits are currently listed as globally and regionally Vulnerable owing to a projected
continued reduction in the population size, a continued reduction in the species’ extent of
occurrence and the highly-fragmented nature of the population (Little 2015). The main factors
driving this decline are believed to be habitat loss and fragmentation, mainly attributable to crop
agriculture, incompatible grazing and fire regimens, and an increasing number of open-cast coal
mines (Allan et al. 1997; Barnes 2000; Little 2011, 2015; BirdLife International 2016). This range
contraction is believed to signify a concomitant overall decrease in this species’ population size
(Little 2015; BirdLife International 2016). In this study, we aimed to assess the potential distribution
of this threatened species and to assess the potential impacts of current land use practices on this
distribution.

5
Methods
A total of 250 verified sighting records were sourced from specialist bird guides, databases of
threatened bird species curated by provincial conservation authorities and our own field work. We
did not include sightings by citizen scientists as these data are usually not accompanied by additional
material such as photographs or call recordings that can be used for species verification. We
restricted our database to observations made between the austral spring and autumn (August–April)
because: a) successful breeding is essential to the continued existence of any species and thus we
feel that it is biologically appropriate to restrict our study to this crucial period; b) Yellow-breasted
Pipits obtain a conspicuous and distinctive bright yellow plumage when breeding, thus rendering
them unmistakeable, whereas; c) they moult into a drab grey-brown winter plumage following the
breeding season which renders individuals less conspicuous (Keith et al. 1992; Voelker 2005;
Peacock 2006) and also harder for observers not acutely familiar with this species to distinguish from
sympatric pipit species. Because of this nondescript winter plumage, only a handful of verified
distribution records exist for the non-breeding season and these are too few to meaningfully model.
Although our database is likely to be biased towards breeding birds due to their distinctive plumage
rendering them more visible and identifiable, individuals are expected to attain their breeding
plumage by the first breeding season, even if they do not actively partake in breeding during their
first season, and thus any bias thus induced is believed to be negligible.
We ran an initial analysis using all 250 sightings and all 19 BioClim variables as well as altitude
downloaded from the WorldClim database (Hijmans et al. 2005, available online at
http://www.worldclim.org) and vegetation (Mucina and Rutherford 2006), all at 30 arc-second
spatial resolution (see Online Supplementary Material S1). In order to improve the predictive powers
of our model we selected eight bioclimatic variables from the WorldClim database, with emphasis
placed on variables pertaining to the austral summer breeding season. We also included vegetation
type (Mucina and Rutherford 2006, n = 111 categories) as a predictor variable, with this latter

6
dataset being converted to the same spatial extent and grid size as the bioclimatic data using the
Conversion tool in ArcGIS 10.4 (ESRI 2011). All data were projected to Albers Equal Area conical
projection for Africa (WGS 84) prior to incorporation into the models. Predictor variables were
tested for correlation in ENMTools 1.3. (Warren et al. 2010; Warren and Seifert 2011), and initially
autocorrelated variables with (R ≥ |0.9|) were removed from the analyses (Online Supplementary
Material S2) as they contain information that is already present in the other layers. Subsequently,
variables that had a correlation of (R ≥ |0.7|) were removed from the analyses and a simplified
vegetation layer (Acocks 1988) was employed to further improve the predictive powers of our
model. This resulted in Mean temperature of the warmest quarter, Precipitation seasonality
(coefficient of variation), Precipitation of the warmest quarter and Acocks’ (1988) vegetation types
(n = 19 categories) being included in the final model.
As we specifically wanted to predict the summer breeding distribution of Yellow-breasted Pipits, we
delimited a rectangle that encompassed the full extent of this species’ known summer distribution,
ensuring that it was at least 100 km from the nearest recorded locality at any given point. We
believe that this geographic extent is reasonable for approximating the assumption of background
selection as it does not include large areas of unsuitable and/or unavailable habitat (Anderson and
Raza 2010; Radosavljevic and Anderson 2014). Furthermore, although the summer distribution of
this species appears to be well-known, we wanted to assess whether there were any nearby regions
that appeared climatically suitable for this species, and where additional populations may potentially
be found.
SDM analyses were executed in MaxEnt version 3.3.3k (Phillips et al. 2004, 2006; Phillips and Dudík
2008) with default parameters (Online Supplementary material S3), a logistic output format, 100-
fold cross-validation to estimate errors around fitted functions and a maximum of 500 iterations. We
enforced a Minimum Training Threshold, which represents the least suitable environmental
7
conditions for which a locality was available in the calibration dataset (Radosavljevic and Anderson
2014). MaxEnt uses species presence data and a set of background absence points (points randomly
selected from the geographical extent of the model and assumed to represent sites where the
species is absent) to predict the potential distribution of the species under investigation (Merow et
al. 2013). MaxEnt is known to perform well with small sample sizes, as well as when using small
predictor variable datasets (Jackson and Robertson 2010; Bean et al. 2012; Platts et al. 2014). We
used an initial regularization multiplier of unity to prevent over-fitting of the data (Elith et al. 2011;
Jones et al. 2012; Radosavljevic and Anderson 2014), and progressively increased this value to
investigate the effects of the regularization factor on model performance. Model performance was
determined by examining the Area Under the Curve (AUC) value and visually inspecting the resultant
predicted distributions.
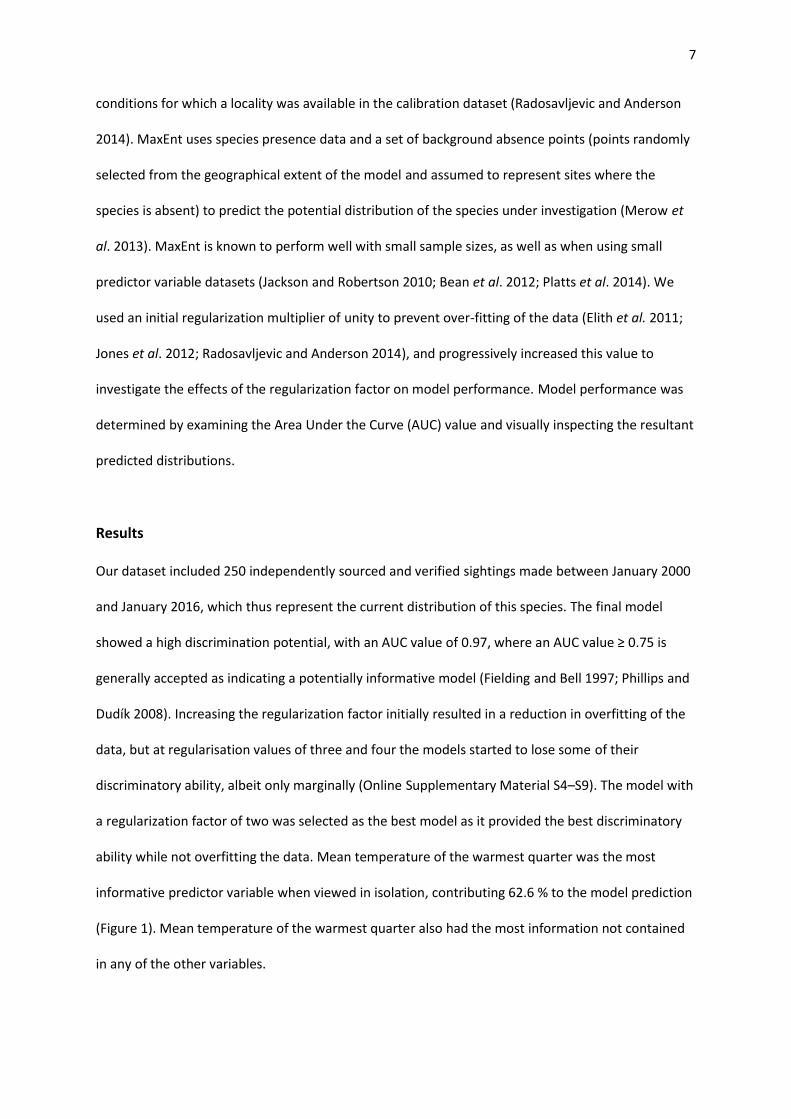
Results
Our dataset included 250 independently sourced and verified sightings made between January 2000
and January 2016, which thus represent the current distribution of this species. The final model
showed a high discrimination potential, with an AUC value of 0.97, where an AUC value ≥ 0.75 is
generally accepted as indicating a potentially informative model (Fielding and Bell 1997; Phillips and
Dudík 2008). Increasing the regularization factor initially resulted in a reduction in overfitting of the
data, but at regularisation values of three and four the models started to lose some of their
discriminatory ability, albeit only marginally (Online Supplementary Material S4–S9). The model with
a regularization factor of two was selected as the best model as it provided the best discriminatory
ability while not overfitting the data. Mean temperature of the warmest quarter was the most
informative predictor variable when viewed in isolation, contributing 62.6 % to the model prediction
(Figure 1). Mean temperature of the warmest quarter also had the most information not contained
in any of the other variables.

8
Figure 1. Partial dependence plots showing the mean (dark grey) and standard deviation (light grey) marginal
response curves of the Yellow-breasted Pipit (Anthus chloris) to each of the four environmental variables used
to model its distribution. A regularisation factor of two was used to prevent over-fitting of the model. Bars in
the vegetation partial dependence plot represent each vegetation type, with absent vegetation types having
been regularised out of the model. The y-axis indicates logistic output, and the variable importance is indicated
below each graph.
The relative probability of occurrence of Yellow-breasted Pipits as inferred from the best-performing
model closely mirrored this species’ actual distribution when considering both our sightings and the
verified SABAP2 sightings (Figure 2). The modelled distribution reflected the SABAP2 data in
indicating core populations around the Steenkampsberg (Dullstroom), Wakkerstroom, Memel and
the southern Drakensberg foothills, but differed in also indicating purportedly suitable habitat in the
Lydenburg-Ohrigstad region in Mpumalanga Province. The model further indicated that all of the
purportedly suitable habitat is restricted to a fairly narrow belt along the Eastern Escarpment of

9
South Africa, and failed to indicate any significant areas of purportedly suitable habitat in the
Eastern Cape Province.
Figure 2. Relative probability of occurrence of the Yellow-breasted Pipit (Anthus chloris) in southern Africa as
inferred in MaxEnt using 250 verified observations and four environmental variables. Data from the Second
Southern African Bird Atlas Project (SABAP2) includes only observations made between the austral spring and
autumn (August–April), and were not used to predict the distribution of the species. Inset: map of southern
Africa, indicating the magnified region.
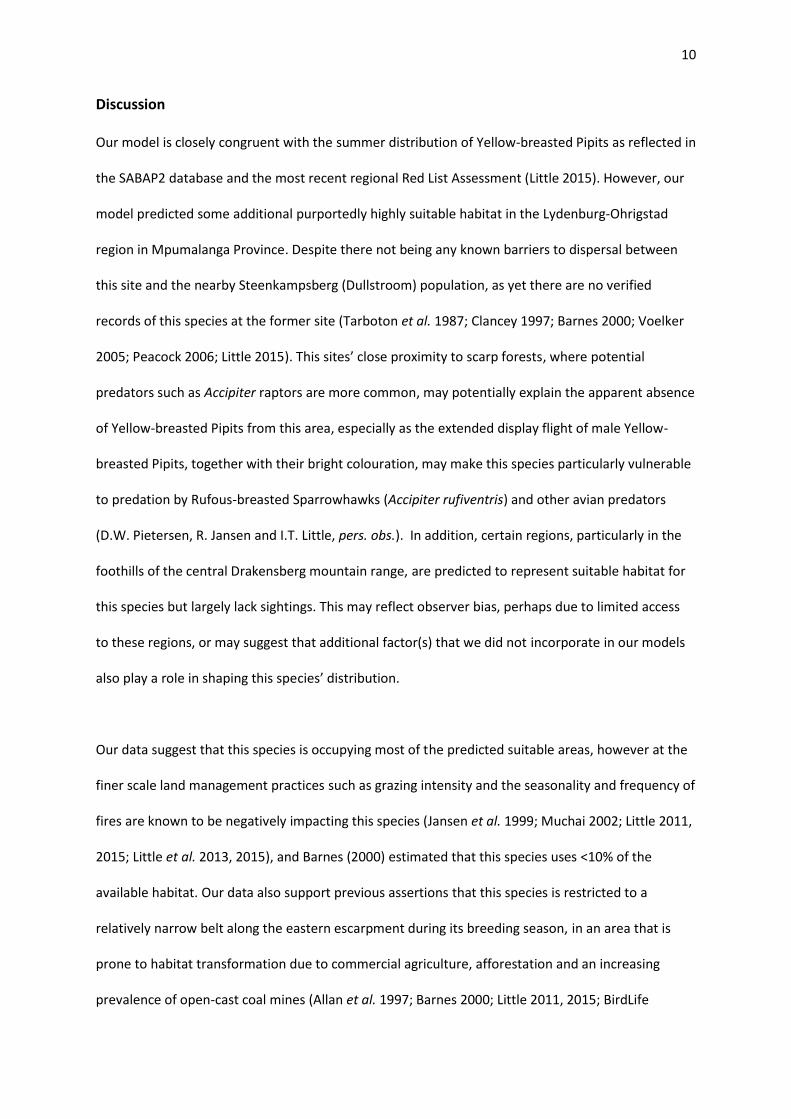
10
Discussion
Our model is closely congruent with the summer distribution of Yellow-breasted Pipits as reflected in
the SABAP2 database and the most recent regional Red List Assessment (Little 2015). However, our
model predicted some additional purportedly highly suitable habitat in the Lydenburg-Ohrigstad
region in Mpumalanga Province. Despite there not being any known barriers to dispersal between
this site and the nearby Steenkampsberg (Dullstroom) population, as yet there are no verified
records of this species at the former site (Tarboton et al. 1987; Clancey 1997; Barnes 2000; Voelker
2005; Peacock 2006; Little 2015). This sites’ close proximity to scarp forests, where potential
predators such as Accipiter raptors are more common, may potentially explain the apparent absence
of Yellow-breasted Pipits from this area, especially as the extended display flight of male Yellow-
breasted Pipits, together with their bright colouration, may make this species particularly vulnerable
to predation by Rufous-breasted Sparrowhawks (Accipiter rufiventris) and other avian predators
(D.W. Pietersen, R. Jansen and I.T. Little, pers. obs.). In addition, certain regions, particularly in the
foothills of the central Drakensberg mountain range, are predicted to represent suitable habitat for
this species but largely lack sightings. This may reflect observer bias, perhaps due to limited access
to these regions, or may suggest that additional factor(s) that we did not incorporate in our models
also play a role in shaping this species’ distribution.
Our data suggest that this species is occupying most of the predicted suitable areas, however at the
finer scale land management practices such as grazing intensity and the seasonality and frequency of
fires are known to be negatively impacting this species (Jansen et al. 1999; Muchai 2002; Little 2011,
2015; Little et al. 2013, 2015), and Barnes (2000) estimated that this species uses <10% of the
available habitat. Our data also support previous assertions that this species is restricted to a
relatively narrow belt along the eastern escarpment during its breeding season, in an area that is
prone to habitat transformation due to commercial agriculture, afforestation and an increasing
prevalence of open-cast coal mines (Allan et al. 1997; Barnes 2000; Little 2011, 2015; BirdLife

11
International 2016). As such, a concerted effort should be made to protect the remaining suitable
habitat in this region, acquire additional suitable habitat, and ensure the persistence of dispersal
corridors between the remaining stronghold populations. As most of this species’ breeding range
falls outside of protected areas, private landowners should be engaged with the view of employing
compatible land management practices that will ensure the co-existence of farmers and Yellow-
breasted Pipits. Such practices include burning grasslands only every 2–3 years and only burning in
winter, thus ensuring that the grass sward has sufficient time to recover and provide sufficient
protection to nesting Yellow-breasted Pipits (Little 2011, 2015; Little et al. 2013). Grazing should also
be conservative and stocking rates should not exceed 5 ha/LAU (Little 2011, 2015).
Our results suggest that the purported range contractions in the Eastern Cape Province (Little 2015)
may be an artefact of the data rather than a genuine contraction in the summer breeding
distribution of this species. The data used to infer this range contraction were collected by citizen
scientists during two successive atlassing periods (SABAP1: 1987–1991, SABAP2: 2007–present) and
as far as we can establish, no effort was made to account for differences in atlassing intensity or
observer ability for either of these periods, nor was the season(s) in which the respective records
were made taken into account. Another potential explanation is that the aforementioned records
from the Eastern Cape Province may indicate individuals reacting to extreme climatic conditions
such as drought, as local movements have been observed in other portions of this species’ range in
reaction to severe droughts (D.W. Pietersen, pers. obs.).
Sightings of this species, especially in the Eastern Cape, Lesotho and central Free State, in areas not
having a high predicted occurrence potential may be attributable to non-breeding birds either
seeking breeding territories or occupying sub-optimal habitats, birds still on passage to their
breeding grounds, or misidentifications by citizen scientists. Alternatively, these sightings could also
suggest that additional factor(s) which we did not include in our models may also influence the

12
distribution of this species. Such factors may include aberrant movements in response to droughts,
as have been recorded in other portions of this species’ range (D.W. Pietersen, pers. obs.). Further
field studies are required to better understand the biology of this species, which in turn would result
in further refinement of the species distribution model. Furthermore, as individual survival is also
crucial to the survival of the species, it would be informative to determine the winter range of this
species through a combination of verified field sightings and Species Distribution Modelling. This
would allow conservationists to assess where the greatest threats to this species’ continued survival
are, thus facilitating the compilation of a holistic Species Action Plan.
The finding that Mean temperature of the warmest quarter had the greatest predictive power of the
summer breeding distribution of Yellow-breasted Pipits is surprising, as we expected vegetation type
to be the most important predictor. However, this result is congruent with the fact that both
temperature and rainfall would influence vegetation type, and thus the predictive power of
vegetation structure is likely incorporated to a large extent in the other environmental variables that
we included in our study. The comparatively poor predictive ability of vegetation type may also be as
a result of the relatively coarse vegetation types that we included in our final model.
We obtained a number of verified sightings that fell within pentads in which this species has not yet
been recorded during SABAP2, suggesting that this species’ range may be larger than currently
predicted if only SABAP2 data are considered, albeit marginally. Of particular interest are the three
verified records from northern Lesotho. Osborne and Tigar (1990) are of the opinion that this species
was previously more widespread in Lesotho, but that overgrazing and excessive burning in
unprotected areas has limited its distribution to the Sehlabathebe National Park. Although Little
(2015) mentioned the presence of a potential population here, it was not plotted in that publication.
Despite our data not predicting a high probability of this species occurring in northern Lesotho
during the summer breeding season, the aforementioned records may suggest that improvements in
13
grazing and burning practices in this region may have resulted in this area again becoming suitable
for Yellow-breasted Pipits (Little 2015), although it remains to be seen whether these sightings
represent transient individuals or whether this is the start of a population (re-)establishment.
Acknowledgements
The DST/NRF Centre of Excellence at the Percy FitzPatrick Institute of African Ornithology, The
Rufford Small Grants Fund (Grant no. 16316-1), Tshwane University of Technology, The Endangered
Wildlife Trust and the University of Pretoria are thanked for financial and in-kind support. David
Allan, Robin Colyn, Greg Davies, John Davies, Bradley Gibbons, Stuart MacLean, Duncan McKenzie,
Jake Mulvaney, Faansie Peacock, Morné Pretorius, Nick Theron, the Mpumalanga Tourism and Parks
Agency and Ezemvelo KZN Wildlife are thanked for sharing their sightings data with us, and for
assistance with field work. Lizanne Roxburgh, Samantha Nicolson and Mark Robertson are gratefully
acknowledged for their assistance with Species Distribution Modelling. Three anonymous reviewers
greatly improved the content of this manuscript.
References
Acocks, J.P.H. (1988). ‘Veld types of South Africa, IIIrd edition’. Botanical Research Institute,
Department of Agriculture and Water Supply, Pretoria, South Africa.
Allan, D.G., Harrison, J.A., Navarro, R.A., Van Wilgen, B.W., and Thompson, M.W. (1997). The impact
of commercial afforestation on bird populations in Mpumalanga Province, South Africa: Insights
from bird atlas data. Biological Conservation 79, 173–185.
Anderson, R.P., and Raza, A. (2010). The effect of the extent of the study region on GIS models of
species geographic distributions and estimates of niche evolution: Preliminary tests with
montane rodents (genus Nephelomys) in Venezuela. Journal of Biogeography, 37, 1378–1393.

14
Barnes, K.N. (2000). Yellowbreasted Pipit Hemimacronyx chloris. In ‘The Eskom Red Data Book of
birds of South Africa, Lesotho and Swaziland’ (Ed K.N. Barnes.) pp. 126–128. (BirdLife South
Africa: Johannesburg.)
Barve, N., Barve, V., Jiménez-Valverde, A., Lira-Noriega, A., Maher, S.P., Peterson, A.T., Soberón, J.,
and Villalobos, F. (2011). The crucial role of the accessible area in ecological niche modeling and
species distribution modeling. Ecological Modelling 222, 1810–1819.
Bean, W.T., Stafford, R., and Brashares, J.S. (2012). The effects of small sample size and sample bias
on threshold selection and accuracy assessment of species distribution models. Ecography 35,
250–258.
BirdLife International. (2016). Species factsheet: Yellow-breasted Pipit Anthus chloris. Available
online at http://www.birdlife.org/datazone/species/factsheet/22718444. [Accessed 13 June
2016].
Cassini, M.H. (2011). Ranking threats using species distribution models in the IUCN Red List
assessment process. Biodiversity and Conservation 20, 3689–3692.
Clancey, P.A. (1990). A review of the indigenous pipits (Genus Anthus Bechstein: Motacillidae) of the
Afrotropics. Durban Museum Novitates 15, 42–72.
Clancey, P.A. (1997). Yellowbreasted Pipit Hemimacronyx chloris. In ‘The atlas of southern African
birds. Vol. 2: Passerines’. (Eds. J.A. Harrison, D.G. Allan, L.G. Underhill, M. Herremans, A.J. Tree, V.
Parker and C.J. Brown.) pp. 398–399. (BirdLife South Africa: Johannesburg.)
Collins, K., and du Toit, J.T. (2016). Population status and distribution modelling of the critically
endangered riverine rabbit (Bunolagus monticularis). African Journal of Ecology 54(2), 195–206.
Dean, W.R.J. (1971). Breeding data for the birds of Natal and Zululand. Durban Museum Novitates 9,
59–91.
Elith, J., and Leathwick, J.R. (2009). Species distribution models: Ecological explanation and
prediction across space and time. Annual Review of Ecology, Evolution and Systematics 40(1),
677–697.

15
Elith, J., Phillips, S.J., Hastie, T., Dudík, M., Chee, Y.E., and Yates, C.J. (2011). A statistical
explanation of MaxEnt for ecologists. Diversity and Distributions 17(1), 43–57.
ESRI. (2011). ArcGIS 10.4 for Desktop. Environmental Systems Research Unit, Redlands, CA.
Fielding, A.H., and Bell, J.F. (1997). A review of methods for the assessment of prediction errors in
conservation presence/absence models. Environmental Conservation 24(1), 38–49.
GEOTERRAIMAGE, 2014. 2013 – 2014 South African National Land-Cover Dataset.
Hijmans, R.J., Cameron, S.E., Parra, J.L., Jones, P.G., and Jarvis, A. (2005). Very high resolution
interpolated climate surfaces for global land areas. International Journal of Climatology 25(15),
1965–1978.
Jackson, C.R., and Robertson, M.P. (2010). Predicting the potential distribution of an endangered
cryptic subterranean mammal from few occurrence records. Journal for Nature Conservation 19,
87–94.
Jansen, R., Little, R.M., and Crowe, T.M. (1999). Implications of grazing and burning on grasslands on
the sustainable use of francolins (Francolinus spp.) and overall bird conservation in the highlands
of Mpumalanga province, South Africa. Biodiversity Conservation 8, 587–602.
Jones, M.C., Dye, S.R., Pinnegar, J.K., Warren, R., and Cheung, W.W.L. (2012). Modelling commercial
fish distributions: Prediction and assessment using different approaches. Ecological Modelling
225, 133–145.
Keith, S, Urban, E.K., and Fry, C.H. (Eds.) (1992). ‘The Birds of Africa. Vol. IV. Broadbills to Chats’.
(Academic Press: New York.)
Keith, D.A., Mahony, M., Hines, H., Elith, J., Regan, T.J., Baumgartner, J.B., Hunter, D., Heard, G.W.,
Mitchell, N.J., Parris, K.M., Penman, T.D., Scheele, B., Simpson, C.C., Tingley, R., Tracy, C.R., West,
M., and Akclakaya, H.R. (2014). Detecting extinction risk from climate change by IUCN red list
criteria. Conservation Biology 28, 810–819.

16
Little, I.T. (2011). Bird reproductive success and faunal habitat selection as tools for understanding
the impacts of land-use management on moist highland grassland biodiversity in South Africa.
PhD Thesis, Percy FitzPatrick Institute, University of Cape Town, Cape Town.
Little, I.T. (2015). Yellow-breasted Pipit Anthus chloris. In ‘The Eskom Red Data Book of birds of South
Africa, Lesotho and Swaziland.’ (Eds. M.R. Taylor, F. Peacock, and R.W. Wanless.) pp. 261–263.
(BirdLife South Africa: Johannesburg.)
Little, I.T., Hockey, P.A.R., and Jansen, R. (2013). A burning issue: Fire overrides grazing as a
disturbance driver for South African grassland bird and arthropod assemblage structure and
diversity. Biological Conservation 158, 258–270.
Little, I.T., Hockey, P.A.R., and Jansen, R. (2015). Predation drives nesting success in moist highland
grasslands: The importance of maintaining vegetation cover for bird conservation. Ostrich
86(1&2), 97–111.
Merow, C., Smith, M.J., and Silander, J.A. (2013). A practical guide to MaxEnt for modeling species’
distributions: What it does, and why inputs and settings matter. Ecography 36, 1058–1069.
Muchai, S.M. (2002). Going through the motions: The impacts of frequent fires and grazing pressure
on reproduction by montane grassland birds. PhD Thesis, University of Cape Town.
Mucina, L., and Rutherford, M.C. (Eds.) (2006). ‘The vegetation of South Africa, Lesotho and
Swaziland.’ Strelitzia 19. (South African National Biodiversity Institute: Pretoria.)
Osborne, P.E., and Tigar, B.J. (1990). ‘The status and distribution of birds in Lesotho’. (Nature
Conservation Bureau Ltd: Newbury, UK.)
Peacock, F. (2006). ‘Pipits of southern Africa.’ (Published by the author: Pretoria.)
Phillips, S.J., and Dudík, M. (2008). Modeling of species distributions with Maxent: New extensions
and a comprehensive evaluation. Ecography 31(2), 161–175.
Phillips, S.J., Anderson, R.P., and Schapire, R.E. (2006). Maximum entropy modeling of species
geographic distributions. Ecological Modelling 190, 231–259.
17
Phillips, S.J., Dudík, M., and Schapire, R.E. (2004). A maximum entropy approach to species
distribution modeling. Proceedings of the Twenty-First International Conference on Machine
Learning, 655-662.
Platts, P.J., Garcia, R.A., Hof, C., Foden, W., Hansen, L.A., Rahbek, C., and Burgess, N.D. (2014).
Conservation implications of omitting narrow-ranging taxa from species distribution models, now
and in the future. Diversity and Distributions 20(11), 1307–1320.
Radosavljevic, A., and Anderson, R.P. (2014). Making better Maxent models of species distributions:
Complexity, overfitting and evaluation. Journal of Biogeography 41(4), 629–643.
Soberón, J.M. (2010). Niche and area of distribution modelling: A population ecology perspective.
Ecography 33, 159–167.
Syfert, M.M., Joppa, L., Smith, M.J., Coomes, D.A., Bachman, S.P., and Brummitt, N.A. (2014). Using
species distribution models to inform IUCN Red List assessments. Biological Conservation 177,
174–184.
Tarboton, W.R. (2001). ‘A guide to the nests and eggs of southern African birds.’ (Struik Publishers:
Cape Town).
Tarboton, W.R., Kemp, M.I., and Kemp, A.C. (1987). ‘Birds of the Transvaal.’ p. 228. (Transvaal
Museum: Pretoria.)
Voelker, G. (2005). Yellow-breasted Pipit Anthus chloris. In ‘Roberts – Birds of southern Africa. VIIth
Ed.’ (Eds. P.A.R. Hockey, W.R.J. Dean and P.G. Ryan.) pp. 1100–1101. (The Trustees of the John
Voelcker Bird Book Fund: Cape Town.)
Warren, D.L., and Seifert, S.N. (2011). Ecological niche modeling in Maxent: The importance of
model complexity and the performance of model selection criteria. Ecological Applications 21,
335-342.
Warren, D.L., Glor, R.E., and Turelli, M. (2010). ENMtools: A toolbox for comparative studies of
environmental niche models. Ecography 33, 607–611.