Predicting Sales Revenue by Using Artificial Neural...
6
Abstract—Forecasting sales quantity and sales revenue is very vital for a company to take action for the next period for sustainable competition. It is especially important for growing industries like grocery retailing industry. Turkey’s grocery retailing industry is evolving rapidly. Due to increasing importance; the aim of this study is to forecast the sales revenue of grocery retailing industry in Turkey with the help of grocery retailers marketing costs, gross profit, and its competitors’ gross profit by using artificial neural network. Artificial neural networks are models which are used for forecasting because of their capabilities of pattern recognition and machine learning. ANN method is used to forecast the sales revenue of upcoming period. According to results there are high similarities between forecasted and actual data. Forecasted results of this study are bigger or smaller than the actual data for only 10%. Because of this high accuracy, companies at grocery retailing industry in Turkey can use ANN as a forecasting tool. Index Terms—Sales revenue, forecasting sales revenue, grocery retailing industry, artificial neural network. I. INTRODUCTION Globalization differentiates the business environment, provokes competition among companies and even countries. Today‟s business environment forces companies to maintain and sustain competitive advantage that can results with profitability. Marketing has a crucial part in competition and companies which effectively manage costs can make stable profits. Forecasting sales quantity and sales revenue is very vital for a company to take action for the next period. Sales forecast enable companies to manage their budget effectively, to minimize uncertainty, to reduce risks, to speed up the decision making process etc. For this reason some techniques are used for years. Focusing on grocery retailing has been increasing rapidly especially in developing countries like Turkey due to the supermarket radical changes. Grocery retailing industry is an organic, active and highly competitive industry; it‟s evolving every single day. With the economy seemingly emerging from the crises, industry leaders are looking for a picture of what is ahead of them. In this respect, declaring the sales forecasts in grocery retailing industry in Turkey is important more than ever. Manuscript received April 9, 2014; revised July 10, 2014. The authors are with Adana Science and Technology University, Adana, Turkey (e-mail: [email protected], [email protected]). II. NEURAL NETWORK Artificial neural networks (ANN) can be defined as a highly connected array of elementary processors called neurons [1]. According to Specht, ANN is usually defined as a network composed of a large number of simple processors (neurons) that are massively interconnected, operate in parallel, and learn from experience (examples) [2]. At information processing and pattern identification, ANN‟s are used. It takes its roots from the working mechanism of human brains. At this model, like human brains, there are neurons which are computing units, and they are interconnected with each other in an organized fashion. Neurons process information and convert inputs into outputs. According to the relationship between these neurons, reliable information can be generated [3]. It is a simplistic form of the neural system at human brains, but if inputs have a strong connection than notable information can be achieved. One major application area of ANNs is forecasting for both researchers and practitioners [4]. The neural network approach produces better classification, handles complex underlying relationships better, and is stronger at interpolation [5]. ANNs have a high modelling flexibility and adaptability, as they can control the learning process. On the other hand it can adjust their parameters if new input data are available [6]. Using ANN in studies has its own benefits to some extent. Different neural system models have been created for different applications. The most used neural network is feed forward neural network. At this type there are three layers, which are; input layer, hidden layer, and output layer. At input layer, different independent variables are used to forecast output layer, which consists of dependent variable. At hidden layer, neurons are interconnected to input and output layers. This is used for examining the pattern at nonlinear relationships between output and input layers [3]. Because at our study there is linear relationship between inputs and outputs, hidden layer is not used. The type which doesn‟t contain hidden layer in ANN is called single-layer perceptron. Inputs are simply connected with outputs via weights. According to Sexton and Dorsey, criticisms are generally focused on the inability to adequately identify identify unnecessary weights in the solution [7]. This limits to reach a strong output but some algorithms are created to eliminate this problem. ANN should be trained before forecasting process implemented. Neural networks give weights to connections at the training process. The overall better performance of Predicting Sales Revenue by Using Artificial Neural Network in Grocery Retailing Industry: A Case Study in Turkey Dilek Penpece and Orhan Emre Elma International Journal of Trade, Economics and Finance, Vol. 5, No. 5, October 2014 435 DOI: 10.7763/IJTEF.2014.V5.411
Transcript of Predicting Sales Revenue by Using Artificial Neural...
Abstract—Forecasting sales quantity and sales revenue is
very vital for a company to take action for the next period for
sustainable competition. It is especially important for growing
industries like grocery retailing industry. Turkey’s grocery
retailing industry is evolving rapidly. Due to increasing
importance; the aim of this study is to forecast the sales revenue
of grocery retailing industry in Turkey with the help of grocery
retailers marketing costs, gross profit, and its competitors’
gross profit by using artificial neural network. Artificial neural
networks are models which are used for forecasting because of
their capabilities of pattern recognition and machine learning.
ANN method is used to forecast the sales revenue of upcoming
period. According to results there are high similarities between
forecasted and actual data. Forecasted results of this study are
bigger or smaller than the actual data for only 10%. Because of
this high accuracy, companies at grocery retailing industry in
Turkey can use ANN as a forecasting tool.
Index Terms—Sales revenue, forecasting sales revenue,
grocery retailing industry, artificial neural network.
I. INTRODUCTION
Globalization differentiates the business environment,
provokes competition among companies and even countries.
Today‟s business environment forces companies to maintain
and sustain competitive advantage that can results with
profitability. Marketing has a crucial part in competition and
companies which effectively manage costs can make stable
profits. Forecasting sales quantity and sales revenue is very
vital for a company to take action for the next period. Sales
forecast enable companies to manage their budget
effectively, to minimize uncertainty, to reduce risks, to speed
up the decision making process etc. For this reason some
techniques are used for years.
Focusing on grocery retailing has been increasing rapidly
especially in developing countries like Turkey due to the
supermarket radical changes. Grocery retailing industry is an
organic, active and highly competitive industry; it‟s evolving
every single day. With the economy seemingly emerging
from the crises, industry leaders are looking for a picture of
what is ahead of them. In this respect, declaring the sales
forecasts in grocery retailing industry in Turkey is important
more than ever.
Manuscript received April 9, 2014; revised July 10, 2014.
The authors are with Adana Science and Technology University, Adana,
Turkey (e-mail: [email protected], [email protected]).
II. NEURAL NETWORK
Artificial neural networks (ANN) can be defined as a
highly connected array of elementary processors called
neurons [1]. According to Specht, ANN is usually defined as
a network composed of a large number of simple processors
(neurons) that are massively interconnected, operate in
parallel, and learn from experience (examples) [2]. At
information processing and pattern identification, ANN‟s are
used. It takes its roots from the working mechanism of human
brains. At this model, like human brains, there are neurons
which are computing units, and they are interconnected with
each other in an organized fashion. Neurons process
information and convert inputs into outputs. According to the
relationship between these neurons, reliable information can
be generated [3]. It is a simplistic form of the neural system at
human brains, but if inputs have a strong connection than
notable information can be achieved.
One major application area of ANNs is forecasting for
both researchers and practitioners [4]. The neural network
approach produces better classification, handles complex
underlying relationships better, and is stronger at
interpolation [5]. ANNs have a high modelling flexibility and
adaptability, as they can control the learning process. On the
other hand it can adjust their parameters if new input data are
available [6]. Using ANN in studies has its own benefits to
some extent.
Different neural system models have been created for
different applications. The most used neural network is feed
forward neural network. At this type there are three layers,
which are; input layer, hidden layer, and output layer. At
input layer, different independent variables are used to
forecast output layer, which consists of dependent variable.
At hidden layer, neurons are interconnected to input and
output layers. This is used for examining the pattern at
nonlinear relationships between output and input layers [3].
Because at our study there is linear relationship between
inputs and outputs, hidden layer is not used. The type which
doesn‟t contain hidden layer in ANN is called single-layer
perceptron. Inputs are simply connected with outputs via
weights. According to Sexton and Dorsey, criticisms are
generally focused on the inability to adequately identify
identify unnecessary weights in the solution [7]. This limits
to reach a strong output but some algorithms are created to
eliminate this problem.
ANN should be trained before forecasting process
implemented. Neural networks give weights to connections
at the training process. The overall better performance of
Predicting Sales Revenue by Using Artificial Neural
Network in Grocery Retailing Industry: A Case Study in
Turkey
Dilek Penpece and Orhan Emre Elma
International Journal of Trade, Economics and Finance, Vol. 5, No. 5, October 2014
435DOI: 10.7763/IJTEF.2014.V5.411
ANN could be related to the assertion that ANN is better able
to handle non-linearities in the data [8]. Training process tries
to create a learning algorithm in order to forecast outputs in
ANN. So ANN use this learning algorithm in the process.
Forecasting problems arise in so many different disciplines
and the literature on forecasting that use ANNs is scattered in
so many diverse fields. It is hard for a researcher to be aware
of all the work done to date in the area [4]. ANNs have
increasingly been used in many disciplines from the early
1980s to recent years such as engineering, medical diagnosis,
data mining, and corporate business available [6]. For
example ANN is used in data mining [9]. There are other
areas that ANN‟s are successful, and these include
competitive market structuring, market segmentation
analysis, identification of loyal and profitable customers, also
forecasting brand shares etc. [10]-[15]. ANN models are
increasingly being used as a decision aid. Number of areas
such as manufacturing, marketing, and retailing used it [16].
Several authors have given comprehensive reviews of neural
networks, examples of its applications, and comparisons with
the statistical approach [11], [17].
III. NEURAL NETWORK IN FORECASTING SALES
Marketing costs are very essential when maximizing
profits. An effective business should cut costs. But if a
business wants to reach more customers an efficient
advertising budget can help reaching this goal. In developing
countries, if a business is working efficiently, when
advertising costs, as a means of marketing costs, are
increased, generally its net profits increased [18]. Dekimpe
and Hannsens‟s study examined the relationship between
marketing expenditures and sales performance [19]. The
empirical evidence in this study suggests that advertising has
strong effects on almost all sales. Especially for big
companies the advertising cost has a crucial place as a means
of marketing expenditures. But it is not sufficient to use just
advertising in forecasting sales as a marketing cost.
Compared to 50 years from now, marketing costs have
been increasing dramatically from 20% to 50%. As a result,
companies want to make the most of their marketing costs. In
order to employ a good strategy, companies have to make
sure that suitable marketing efforts are directed towards right
target customers. This situation can increase productivity
[20]. On the other hand the rate of increase in marketing cost
may not effect sales revenue simultaneously. So in order to
maintain effective sales management companies should
balance their marketing costs with sales revenue at an
optimum level.
The marketing costs that passed over to the customers have
always been criticized over the years. Critics said that the
prices could be lower if less money were spent for marketing.
But when inflation and time factor has taken into
consideration, this hypothesis is not true. In 1950 the average
price of carpeting In the US was $6.02, but by the time 1992
the price was came to $6.27 and quality has also risen. The
price is very low when inflation effect has put into
consideration [21]. In order to fact that price increases is not
always the result of marketing cost, there are other factors
effecting this situation.
Effective sales forecasting, results in appropriate
marketing costs and maximum sales revenue. This forecast is
very vital for companies. Good forecast can reduce
production and material costs, and gives competitive
advantage on sales prices [22]. As a result low inventory
level goals can be reached and efficient Just-in-time (JIT)
delivery occurs. JIT can used for cost minimization
especially in grocery retail industry. Exploring retail demand
is very important for retailers, because inventory
management is essential for maximizing revenue and gaining
a competitive position in the industry [16]. In order to control
JIT delivery, the marketing department should estimate sales
quantity. Marketing, material and production departments
should work as a team to specify the needs of the company
for next quarter, and take necessary action. This coordination
results in reduction of the operating costs.
On the other hand market share is positively correlated
with profits. According to Johnson and Scholes, gaining and
maintaining higher market share results in higher
profitability. The market share is important in nationally as
well as internationally [23]. If a company‟s market share in a
given growing sector increases then it is possible that its
gross profit rises. So we determine the gross profit as a
variable that can affect the sales revenue in retailing. Gross
profit can be obtained by subtracting cost of goods sold from
total sales. It is directly related with sales. In order to
maintain and increase profitability, a company should
increase its sales higher than its cost of goods sold.
Retailing sector is rapidly growing in Turkey. The total
volume of the retail sector has almost tripled in 5 years, from
US $70 billion in 2005 to US $187 billion in 2010. By the
year 2014, this sector is expected to reach US $250 billion.
The number of modern shopping malls in Turkey doubled in
five years, from 129 in 2006 to 291 in 2011. 2.1 million
employees find their jobs in this industry, and total retail area
used for this sector is at least 23 million square meters.
Turkey is the 7th largest retail market in Europe and the tenth
in the world [24]. So it is assumed that as a variable of
forecasting gross profit is strongly related to sales revenue at
grocery retailing industry in Turkey as a growing sector.
Retail industry companies compete with each other in
different ways. Food retailing has also a big potential within
retailing sector and intensive competition exists in food
retailing. Food retailers try to gain a competitive advantage
against their rivals with their product selection and type,
offered service types and their quality, discount policies etc.
According to Zhu et al. [25] an appropriate characterization
of expected revenues would require correct measurement of
the importance of competition in a market. At this study, BİM
is a hard discount retailer, which generally produces its own
products and sells them at a fairly discounted price. Migros is
the first grocery retailer in Turkey, and this company operates
in almost every segment for grocery retailing and also
implemented the online grocery shopping. Carrefour, is a
major player in Europe and also in Turkey. This company can
be considered as multi format retailer, which attracts different
types of customers according to their needs.
So it is expected that competitors‟ gross profit will affect
the sales revenue of each company in grocery retailing
industry as a steady market.
International Journal of Trade, Economics and Finance, Vol. 5, No. 5, October 2014
436

In order to forecast sales revenue gross profit, competitors‟
gross profit and marketing costs are put into account in this
study. Some studies focused on exploring sales quantity by
the help of time series [26]-[28]. According to Thall, when
forecasting the retail demand, grocery products industry uses
artificial neural networks [29]. Lots of analysis can be used
for forecasting sales revenue such as time series, regression
analysis and artificial neural network. As explained earlier
gross profit, competitors‟ gross profit and marketing costs are
strongly related to sales revenue. Because of the fact that if
inputs have a strong connection than notable information can
be achieved in artificial neural network, ANN is preferred
over time series and regression analysis in this study.
IV. METHODOLOGY
The structure of the food retailing sector in Turkey is
largely based on micro-grocers which are basically founded
as small family businesses. But with the help of globalization
food retailing in Turkey has dramatically increased. While
some factors like, urbanization, evolving life styles of
individuals, and education level helped demand side of this
growth, other factors like government support policies and
foreign direct investments supported the supply side [30].
Although Turkish consumers have been shopping
primarily from small markets and grocery stores, the market
share of traditional retailers has been steadily eroding,
because customers preferences are moving towards mass
grocery retailers. Due to this fast growing nature of the
industry, the aim of this study is to forecast the sales revenue
of grocery retailing industry in Turkey with the help of
grocery retailers marketing costs, gross profit, and its
competitors‟ gross profit by using artificial neural network.
Turkish grocery retail industy is segmented. There are
different types of markets, which attract different types of
customers. Multi-format retailers, regional supermarkets,
discount retailers and convenience stores can be identified as
the types of grocery retailers in Turkey. Because of this
variety, this sector is very fragmented and four largest
companies at this sector couldn‟t reach one fifth of the total
revenues.
It is very difficult to reach all the companies that are
operating at grocery retailing industry in Turkey. Sampling is
determined to overcome this issue. Turkish Stock Exchange
is used for sampling. There are 5 major players which are
listed at the Turkish Stock Exchange (Borsa Istanbul). These
include Kiler, Migros, Carrefour, BİM and Adese. In ANN‟s
there should be enough data to build a strong learning
algorithm. In order to maintain that goal quarterly reports are
used from the beginning of 2010 until the last quarter of
2013. Because there is no enough data for Kiler and Adese,
these companies are subtracted from the study. As a result
this study‟s sample consists of BİM, Migros, Carrefour.
Information about these firms, number of store and type of
outlet are shown in Table I.
TABLE I: THE GROCERY RETAILING SECTOR PROFILE IN TURKEY
Company name and ownership Information about firm
Number of store and type of outlet
(2013)
Migros (Turkish and UK)
This is the first and oldest grocery retailer in Turkey. Founded in
1954. The majority of the shares (50.8%) of Migros was taken
over by British BC Partners in 2008.
919 store, 6 different format, Largest
multi-format retailer in Turkey
with a revenue of 7 billion TL
Bim (Turkish, Saudi Arabia and USA) This discount market is founded at 1995, and its business style is
similar to ALDI in Germany.
3751 store, Discount format retailer,
Largest retailer in Turkey with a
revenue of 12 billion TL
CarrefourSA (Turkish and French) This retailer started its operations in Turkey as a single store 243 store, Multi format retailer, 3
in Istanbul. Then they did a joint venture with Sabancı in 1996. different formats, 2.6 billion revenue
in sales
Artificial neural network models are preferred to
accomplish the sales forecast at recent years. Production and
sales costs can allocated with the help of this forecast. As
discussed earlier, neural networks are used for different
reasons in marketing. Customer service, prospect
identification and segmentation etc. are some of the areas that
use artificial neural network in marketing. ANN is used as a
method that shows its superiority in some studies [16], [31],
[32]. As described at the previous chapter, marketing costs,
gross profits, and competitors gross profits are identified as
the inputs that can affect sales revenue of the upcoming
period, and the ANN model is build on this perspective.
An important but difficult problem is to determine the
optimal number of hidden layers in ANN [33]. This is true
fact that by taking suitable number of hidden layers and the
number of neurons in each hidden layer, better results in less
training time can be obtained [34]. According to Karsoliya,
there are some rules that are used for determining the number
of neurons in the hidden nodes [34]:
The number of hidden layer neurons is 2/3 (or 70% to
90%) of the size of the input layer.
The number of hidden layer neurons should be less
than twice of the number of neurons in input layer.
The size of the hidden layer neurons is between the
input layer size and the output layer size
In order to forecast the sales revenues with ANN, in one
hidden layer, two neurons are used as shown in Fig. 1.
NeuroXL add-on is used on Excel in order to implement
neural network system to forecast upcoming sales revenue.
For training purposes, the period from the first quarter of
2010 until the third quarter of 2013 is used. And for the
prediction the last quarter without actual sales revenue is
used and with these data, sales revenue is forecasted and
compared with the actual data for the same period. The
analysis with the help of ANN is conducted at March 2014.
International Journal of Trade, Economics and Finance, Vol. 5, No. 5, October 2014
437

International Journal of Trade, Economics and Finance, Vol. 5, No. 5, October 2014
438
Fig. 1. Neural network of predicting sales revenue.
BİM, Migros and Carrefour‟s marketing costs, gross
profit, competitors gross profit, sales revenue, forecasted
sales revenue of each grocery retailer is shown below at the
Table II between 2010 and 2013 quarterly. Only these three
factors are taken into account in this study. Because of the
limitations in accessing related data, the other factors that
could affect sales revenue are ignored. Sales revenue just
used for training the data.
Because of there is no linear relationship between
variables, in one hidden layer two neurons are implemented
to the model. Backpropagation is preferred as a method for
training in this model. For training, limit of epochs is
assigned at 3000 and minimum weight delta is set its default
value which is 0,000001. For prediction, initial weight and
learning rate is set at 0,30 while momentum is set at 0,60.
These values are used because this estimate gives the better
results. Hyperbolic tangent function is used because positive
and also negative data are used as inputs.
As shown in Table II, BİM is the biggest discounted
market in Turkey, and leader at the grocery retail industry in
Turkey with 12 billion revenue in sales in 2013. This
company started its operations at 1995 and rapidly grown
since. When looked at closely, its sales revenue is almost
always raised.
TABLE II: THE SALES REVENUE FORECASTING FOR THE LAST QUARTER OF 2013 FOR COMPANIES AT RETAILING SECTOR IN TURKEY
Retailer Years Period Marketing Costs Gross Profit Comp. Gr. Profit Sales Revenue Sim. 2013 - 4 A. S. R.
BİM 2010 1 -163.570.000 267.505.000 491.830.366 1.575.876.000
2010 2 -176.362.000 253.689.000 520.061.646 1.553.942.000
2010 3 -186.917.000 289.678.000 610.731.630 1.720.326.000
2010 4 -181.956.000 293.807.000 512.638.197 1.723.807.000
2011 1 -191.991.000 313.712.000 523.920.331 1.877.948.000
2011 2 -205.410.000 305.922.000 437.145.847 1.935.859.000
2011 3 -221.168.000 343.758.000 552.955.001 2.160.396.000
2011 4 -217.093.000 345.938.000 553.496.981 2.214.932.000
2012 1 -234.689.000 378.704.000 523.460.979 2.427.968.000
2012 2 -253.386.000 369.571.000 556.259.959 2.352.881.000
2012 3 -265.083.000 402.799.000 624.104.967 2.543.820.000
2012 4 -261.895.000 408.140.000 602.544.313 2.581.698.000
2013 1 -280.387.000 434.359.000 565.181.407 2.795.492.000
2013 2 -290.960.000 442.027.000 587.254.456 2.833.595.000
2013 3 -314.800.000 493.432.000 676.651.023 3.087.557.000
2013 4 -311.238.000 487.513.000 684.671.784 2.971.580.509 94,87% 3.132.197.000
Carrefour 2010 1 -10.705.399 134.523.366 624.812.000 601.756.889
2010 2 -16.371.507 138.436.646 635.314.000 574.286.361
2010 3 -27.076.906 149.136.630 751.273.000 642.092.271
2010 4 -9.568.516 129.444.197 677.001.000 627.408.867
2011 1 -12.039.378 134.107.331 703.525.000 584.630.150
2011 2 -14.472.333 133.208.847 609.859.000 565.191.365
2011 3 -13.022.598 146.627.001 750.086.000 649.951.075
2011 4 -12.389.599 159.084.981 740.350.000 646.089.123
2012 4 -11.614.208 164.279.313 846.405.000 653.654.782
2013 1 -11.656.880 143.138.407 856.402.000 584.686.913
2013 2 -11.775.436 131.358.456 897.923.000 611.439.988
2013 3 -12.241.909 153.944.023 1.016.139.000 681.481.391
2013 4 -7.828.685 190.615.784 981.569.000 645.952.939 89,35% 722.925.484
Migros 2010 1 -246.861.000 357.307.000 402.028.366 1.434.086.000
International Journal of Trade, Economics and Finance, Vol. 5, No. 5, October 2014
439
2010 2 -286.818.000 381.625.000 392.125.646 1.537.811.000
2010 3 -339.380.000 461.595.000 438.814.630 1.790.246.000
2010 4 -266.458.000 383.194.000 423.251.197 1.602.981.000
2011 1 -297.537.000 389.813.000 447.819.331 1.575.319.000
2011 2 -186.386.000 303.937.000 439.130.847 1.064.549.000
2011 3 -274.155.000 406.328.000 490.385.001 1.613.335.000
2011 4 -272.606.000 394.412.000 505.022.981 1.499.909.000
2012 1 -268.970.000 385.240.000 516.924.979 1.454.768.000
2012 2 -299.390.000 413.799.000 512.031.959 1.552.452.000
2012 3 -324.494.000 468.051.000 558.852.967 1.825.431.000
2012 4 -310.647.000 438.265.000 572.419.313 1.649.751.000
2013 1 -302.790.000 422.043.000 577.497.407 1.590.678.000
2013 2 -338.026.000 455.896.000 573.385.456 1.720.517.000
2013 3 -367.223.000 522.707.000 647.376.023 2.000.737.000
2013 4 -342.240.000 494.056.000 678.128.784 1.904.503.692 104,93% 1.814.993.000
Migros is the largest multi factor retailer in Turkey with 7
billion revenue in sales in 2013. This is the first and oldest
grocery retail store in Turkey. As seen in Table II, this
retailer‟s gross profit is increasing at a steady pace, but its
sales revenue is not changing at the same direction. This is
because of cost per unit sold is increasing .
Carrefour is another big player in the Turkish grocery
retail business with 2.6 billion revenue in sales in 2013.
Because of the tough competition, this company‟s sales
revenue did not change much through years.
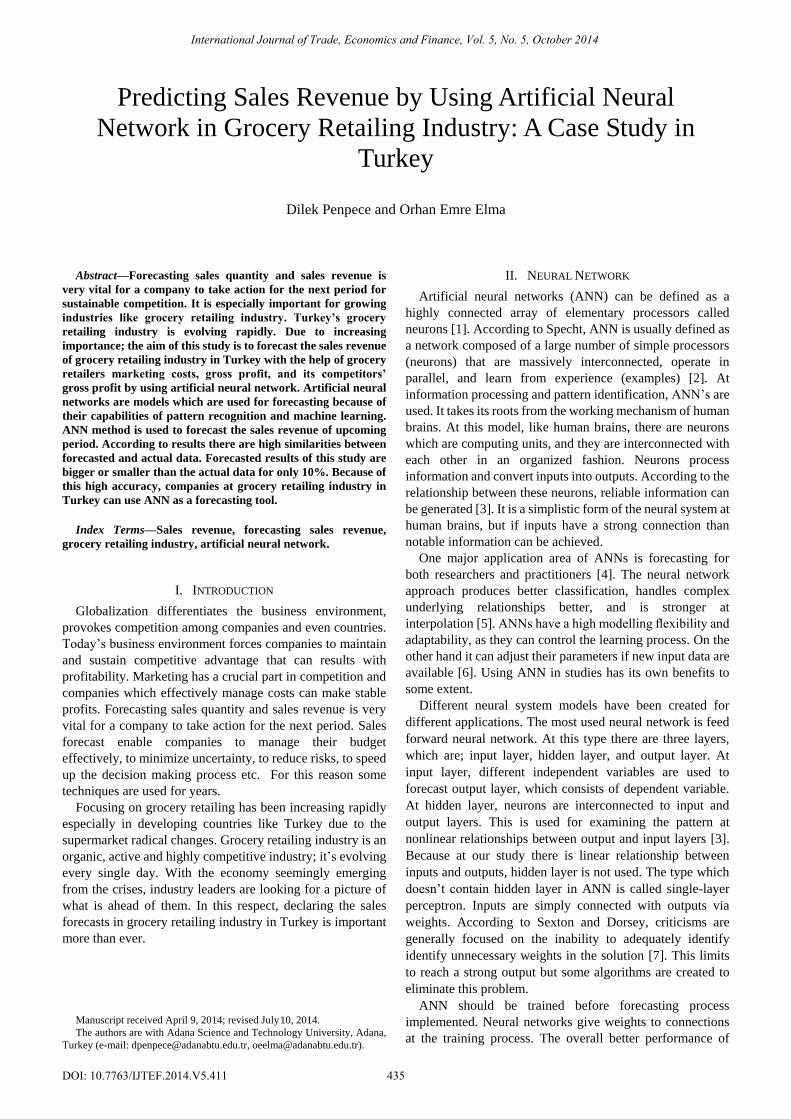
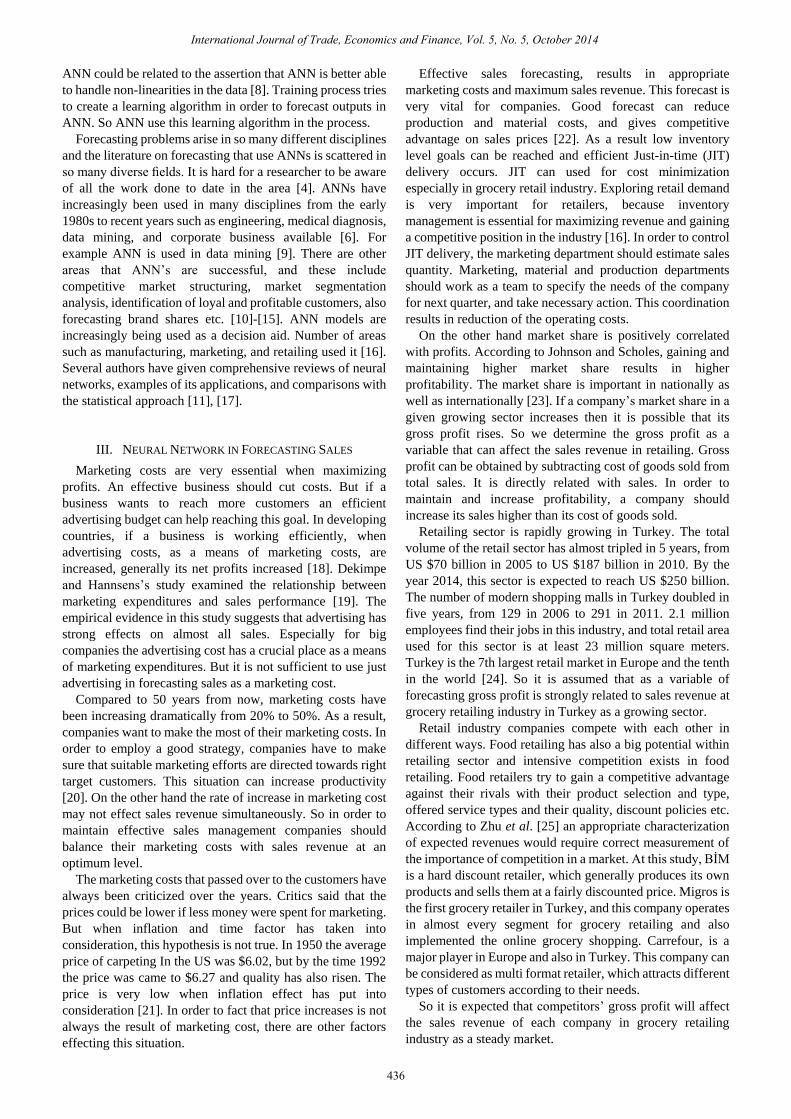
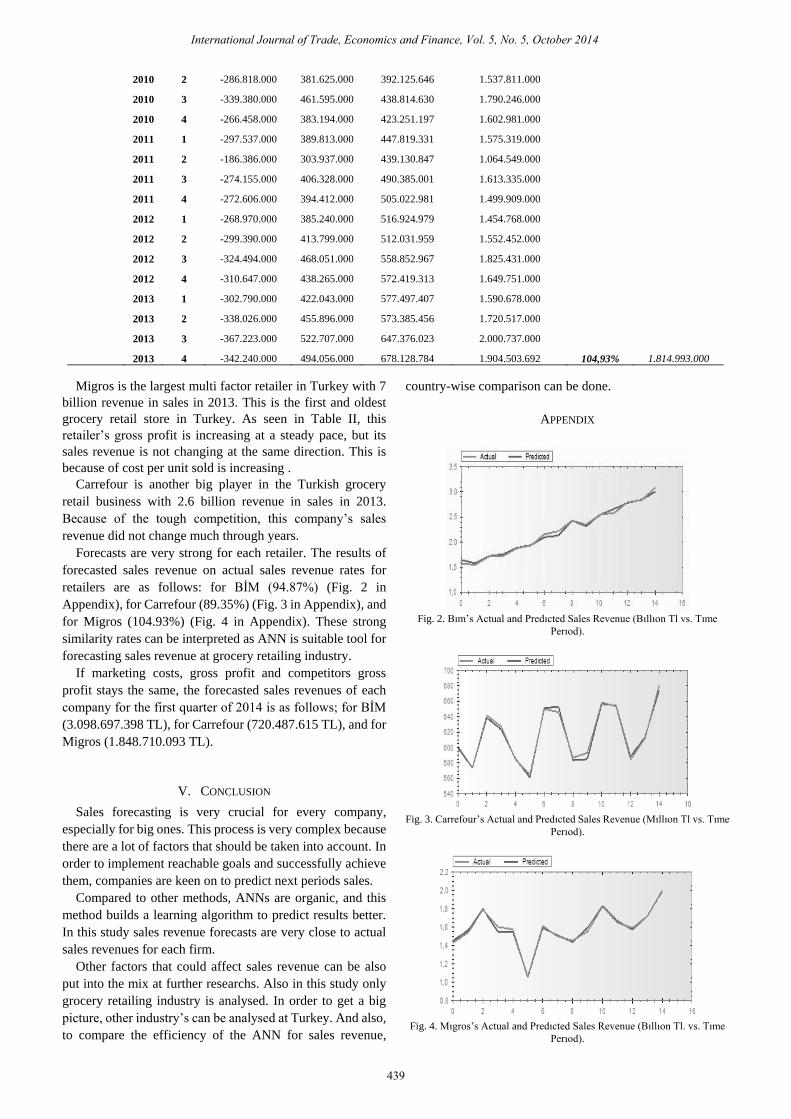
Forecasts are very strong for each retailer. The results of
forecasted sales revenue on actual sales revenue rates for
retailers are as follows: for BİM (94.87%) (Fig. 2 in
Appendix), for Carrefour (89.35%) (Fig. 3 in Appendix), and
for Migros (104.93%) (Fig. 4 in Appendix). These strong
similarity rates can be interpreted as ANN is suitable tool for
forecasting sales revenue at grocery retailing industry.
If marketing costs, gross profit and competitors gross
profit stays the same, the forecasted sales revenues of each
company for the first quarter of 2014 is as follows; for BİM
(3.098.697.398 TL), for Carrefour (720.487.615 TL), and for
Migros (1.848.710.093 TL).
V. CONCLUSION
Sales forecasting is very crucial for every company,
especially for big ones. This process is very complex because
there are a lot of factors that should be taken into account. In
order to implement reachable goals and successfully achieve
them, companies are keen on to predict next periods sales.
Compared to other methods, ANNs are organic, and this
method builds a learning algorithm to predict results better.
In this study sales revenue forecasts are very close to actual
sales revenues for each firm.
Other factors that could affect sales revenue can be also
put into the mix at further researchs. Also in this study only
grocery retailing industry is analysed. In order to get a big
picture, other industry‟s can be analysed at Turkey. And also,
to compare the efficiency of the ANN for sales revenue,
country-wise comparison can be done.
APPENDIX
Fig. 2. Bım‟s Actual and Predıcted Sales Revenue (Bıllıon Tl vs. Tıme
Perıod).
Fig. 3. Carrefour‟s Actual and Predıcted Sales Revenue (Mıllıon Tl vs. Tıme
Perıod).
Fig. 4. Mıgros‟s Actual and Predıcted Sales Revenue (Bıllıon Tl. vs. Tıme
Perıod).
International Journal of Trade, Economics and Finance, Vol. 5, No. 5, October 2014
440
REFERENCES
[1] D. C. Park, M. A. El-Sharkawi, R. J. Marks II, L. E. Atlas, and M. J.
Damborg, “Electric load forecasting using an artificial neural network
1991,” IEEE Transactions on Power Engineering, vol. 6, pp. 442-449.
[2] D. Specht, “A general regression neural network „1991‟ A General
Regression Neural Network,” IEEE Transactions on Neural Networks,
vol. 2, no. 6, pp. 568-576.
[3] P. Zhang, Neural Networks in Business Forecasting, USA: Idea Group
Inc., 2003, ch. 1.
[4] G. Zhang, E. Patuwo, and M. Hu, “Forecasting with artificial neural
networks: The state of the art,” International Journal of Forecasting,
vol. 14, 1998, pp. 35-62.
[5] A. Kumar, R. Vithala, and S. Harsh, "An empirical comparison of
neural network and logistic regression models," Marketing Letters, vol.
6, no. 4, pp. 251-263, 1995.
[6] G. Gianluigi, I. Prete, S. Miraglia, and I. De Mare, “Targeting direct
marketing campaigns by neural networks,” Journal of Marketing
Management, vol. 27, pp. 992-1006, 2011.
[7] R. S. Sexton, R. E. Dorsey, and N. A. Sikander, “Simultaneous
optimization of neural network function and architecture algorithm,”
Decision Support Systems, 2004, vol. 36, pp. 283-96.
[8] H. Harald, “Determining market response functions by neural network
modeling: A comparison to econometric techniques,” European
Journal of Operational Research, vol. 66, pp. 27-35, 1993.
[9] K. Smith and J. Gupta, “Neural networks in business: techniques and
applications for the operations researcher,” Computers & Operations
Research, vol. 27, pp. 1023-1044, 2000.
[10] B. Curry and L. Moutinho, “Neural networks in marketing: modeling
consumer responses to advertising stimuli,” Eur. J. Marketing, vol. 27,
no. 7, pp. 5-20, 1993.
[11] G. Zahavi and N. Levin, “Applying neural computing to target
marketing,” J. Direct Marketing, vol. 11, no. 4, pp. 76-93, 1997.
[12] M. Y. Hu, M. Shanker, and S. M. Hung, “Estimation of posterior
probabilities of consumer situational choices with neural network
classifiers,” Int. J. Res. Marketing, vol. 16, no. 4, pp. 307-317, 1999.
[13] G. Zhang, M. Hu, B. E. Patuwo, and D. C. Indro, “Artificial neural
networks in bankruptcy prediction: general framework and cross
validation analysis,” European Journal of Operations Research, vol.
116, no. 1, pp. 16-32, 1999.
[14] Y. S. Kim, N. W. Street, J. G. Russell, and F. Menczer, “Customer
targeting: a neural network approach guided by genetic algorithms,”
Management Science, vol. 51, no. 2, pp. 264-276, 2005.
[15] H. Hruschka, “Using a heterogeneous multinomial probit model with a
neural net extension to model brand choice,” Journal of Forecasting,
vol. 26, no. 2, pp. 113–127, 2007.
[16] D. Agrawal and C. Schorling, “Market share forecasting: an empirical
comparison of artificial neural networks and multinomial logit model,”
Journal of Retailing, vol. 72, no. 4, pp. 383-407, 1996.
[17] V. Venugopal and W. Beats, “Neural networks and statistical
techniques in marketing research: A conceptual comparison,”
Marketing Intelligence & Planning, vol. 12, no. 7, pp. 30-38, 1994.
[18] T. Ambler and F. Kokkinaki, “Measures of marketing success,”
Journal of Marketing Management, vol. 13, 1997, pp. 665-678.
[19] M. Dekimpe and D. Hanssens, “The persistence of marketing effects on
sales,” Marketing Science, vol. 14, no. l, pp. 1-21, 1995.
[20] J. A. Weber, “Managing the marketing budget in a cost-constrained
environment,” Industrial Marketing Management, vol. 31, 2002, pp.
705–717.
[21] D. Reibstein and P. Farris, “Do marketing expenditures to gain
distribution cost the customer,” European Management Journal, vol.
13, no. 1, 1995, pp. 31-38.
[22] G. S. LeVee, “The key to understanding the forecasting process,”
Journal of Business Forecasting, vol. 11, no. 4, pp. 12-16, 1992-1993.
[23] G. Johnson and K. Scholes, Exploring Corporate Strategy, 6th Edition,
Prentice Hall, 2002.
[24] M. Atalaysun, “USDA foreign agricultural service,” Global
Agricultural Information Network, December 2011.
[25] T. Zhu, V. Singh, and M. Manuszak, “Market structure and competition
in the retail discount industry,” Carnegie Mellon University Working
Paper, 2007.
[26] G. G. Meyer, “Marketing research and sales forecasting at Schlegel
Corporation,” Journal of Business Forecasting, vol. 12, no. 2, 1993,
pp. 22-23.
[27] C. W. Chase, “Ways to improve sales forecasts,” Journal of Business
Forecasting, vol. 12, no. 3, pp. 15–17, 1993.
[28] M. M. Florance and M. S. Sawicz, “Positioning sales forecasting for
better results,” Journal of Business Forecasting, vol. 12, no. 4, 1993,
pp. 27-28.
[29] N. Thall, “Neural forecasts: A retail sales booster,” Discount
Merchandiser, vol. 32, no. 10, 1992, pp. 41-42.
[30] A. Koç, G. Boluk, and S. Kovaci, “Concentration of food retailing and
anti-competitive practices in Turkey,” Food Economics – Acta
Agriculturae Scandinavica, Section C, vol. 7, iss. 2-4, 2010, pp.
151-162.
[31] P. West, P. Brockett, and L. Golden, “A comparative analysis of neural
networks and statistical methods for predicting consumer choice,”
Marketing Science, vol. 16, no. 4, pp. 370-391, 1997.
[32] F. Kaefer, C. Heilman, and S. Ramenofsky, “A neural network
application to consumer classification to ımprove the timing of direct
marketing activities, Computers & Operations Research, vol. 32, pp.
2595–2615, 2005.
[33] M. Noboru and Y. Shuji, “Network Information Criterion-Determining
the Number of Hidden Units for an Artificial Neural Network Model,”
IEEE Transactions on Neural Network, vol.5, no. 6, pp. 865-872, 1994.
[34] S. Karsoliya, “Approximating number of hidden layer neurons in
multiple hidden layer BPNN architecture,” International Journal of
Engineering Trends and Technology, vol. 31, no. 6, pp.714-717, 2012
Dilek Penpece was born in Kahramanmaras, Turkey.
She earned her BA and MS degrees of business
administration from Kahramanmaras Sutcu Imam
University at 2003 and 2006. She finished her Ph.D.
studies at Cukurova University in the field of
Marketing at 2012 in Turkey. Her major field of study
is marketing.
She did research assistant job at Kahramanmaras
Sutcu Imam University from 2003 until 2006. After
that she started working at Cag University at 2009 and worked there until
2012. She earned the title of assistant professor and started working at Adana
Science and Technology, and currently working there since. Her current
research interests include digital marketing, integrated marketing
communication, and crisis communication.
Orhan Emre Elma was born in Konya, Turkey. He
earned his BA degree of business administration from
Istanbul University at 2008, MBA degree in capital
markets and finance from Bahcesehir University at
2011, and he is currently pursuing his Ph.D. degree in
finance at Pamukkale University in Turkey. His major
field of study is finance.
He did tourist guiding at New York for two
consecutive summers at 2006 and 2007. He enlisted
for his military service at 2012. After accomplishing that he did research
assistant job at Adnan Menderes University. At 2013, he started working at
Adana Science and Technology University as a research assistant and
currently working there since. His current research interests include
behavioral finance, portfolio management, and capital markets.
Author‟s formal
photo
Author‟s formal
photo