Predicting More Scouts in New York City Neighborhoods A project of the Greater New York Councils and
17
Predicting More Scouting in New York City Empowering people who care about neighborhood kids to create impact using data.
-
Upload
ethan-draddy -
Category
Education
-
view
70 -
download
6
Transcript of Predicting More Scouts in New York City Neighborhoods A project of the Greater New York Councils and

Predicting More Scouting in New York City
Empowering people who care about neighborhood kids to create impact using data.
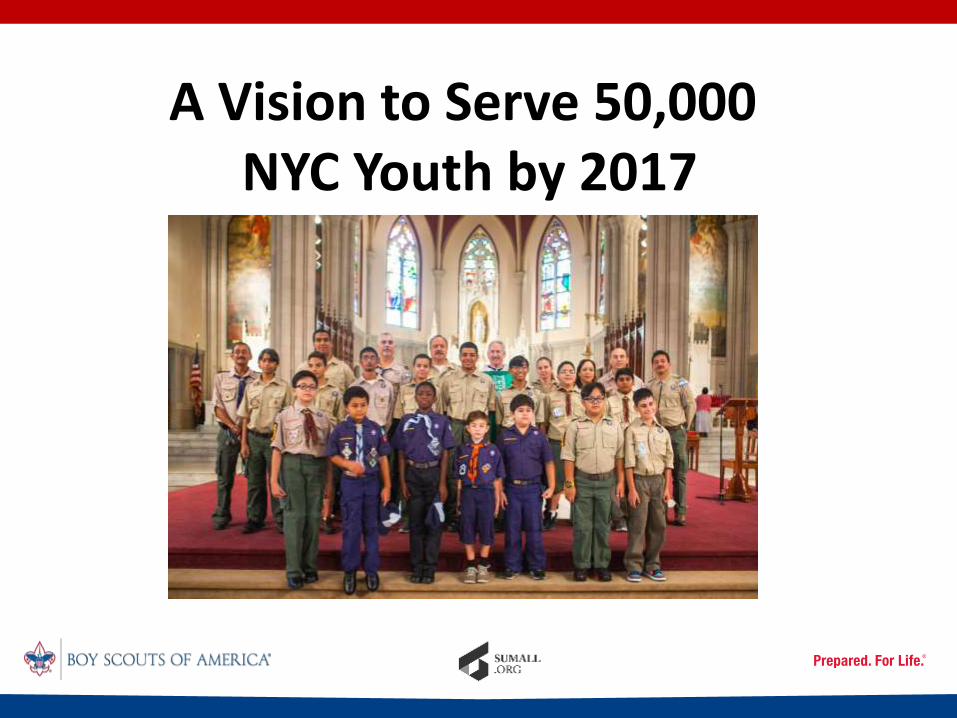
A Vision to Serve 50,000NYC Youth by 2017

Data driven decision making has become a staple of most corporations.
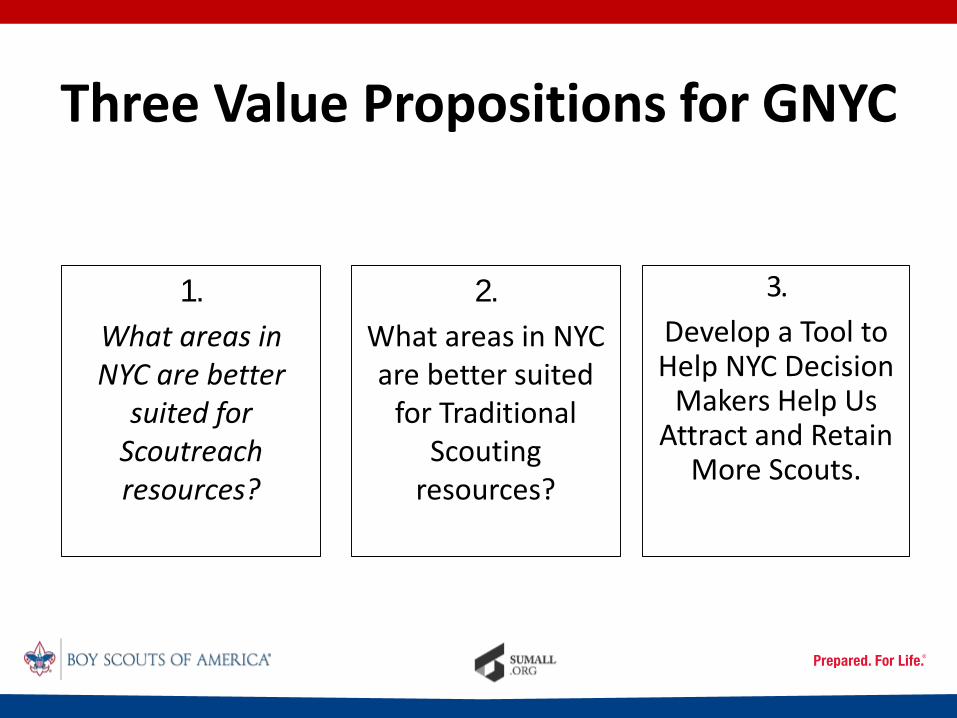
Three Value Propositions for GNYC
2.
What areas in NYC are better suited
for Traditional Scouting
resources?
3.
Develop a Tool to Help NYC Decision
Makers Help Us Attract and Retain
More Scouts.
1.
What areas in NYC are better
suited for Scoutreach resources?

Data Science Methodology
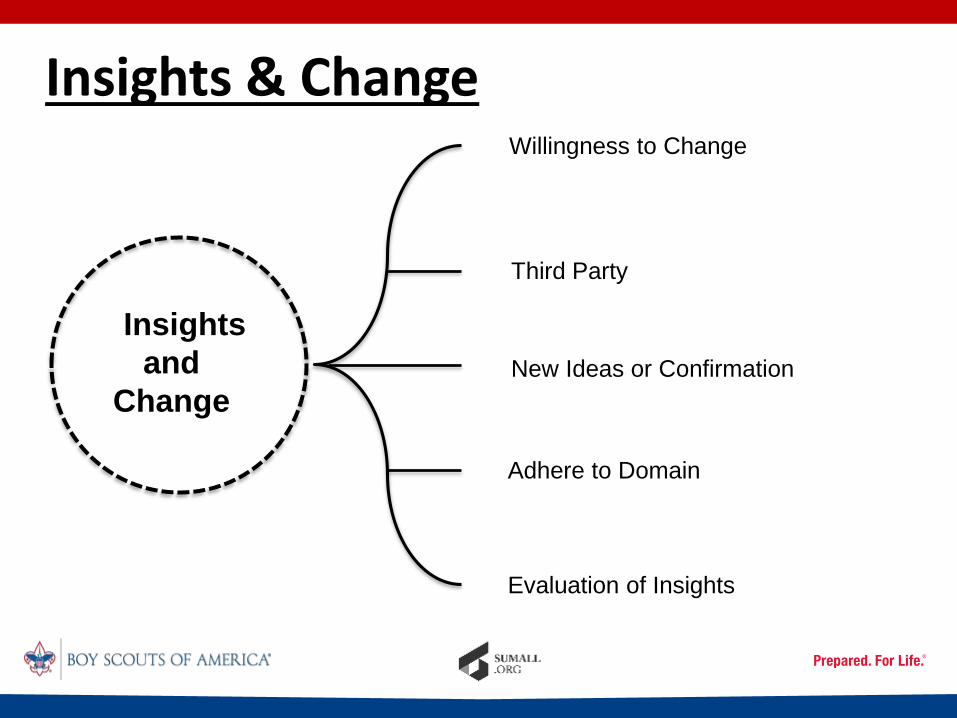
Insights & Change
Insights
and
Change
Willingness to Change
Adhere to Domain knowledge
New Ideas or Confirmation of
beliefs
Third Party
Evaluation of Insights & change

Understand Social risk Makes Issues Visible
Finds Those in Need
Transforms Outreach

From Data to Action
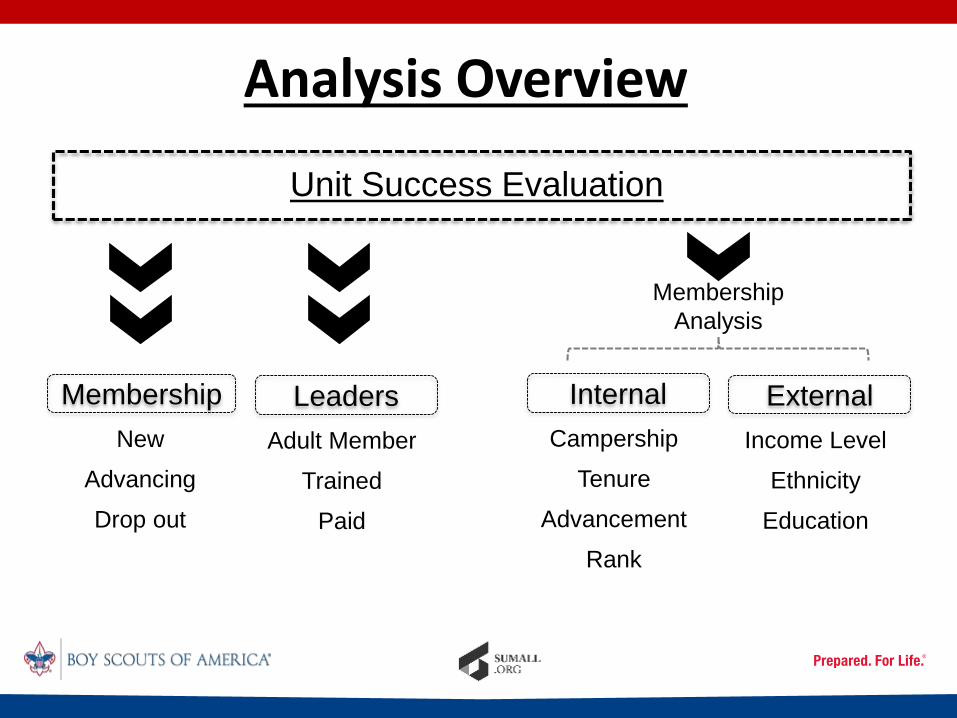
Campership
Internal
Advancement
Rank
Tenure
Income Level
External
Education
Ethnicity
Unit Success Evaluation
New
Membership
Drop out
Advancing
Adult Member
Leaders
Paid
Trained
Membership
Analysis
Analysis Overview

Start with Success
Successful
Member
Successful Unit
Start With Success

Classifying SuccessCub Scouts
Stay for 3 or more years
Become a Boy Scout
Boy Scout
Stay for 5 or more years
Attain high level of
advancements or rank (Eagles)
Successful UnitSuccessful
Member
Cub Scouts
15 % of members stay for 3
or more years
Boy Scout
20% of members stay for 5 or
more years
Or 20% attain Eagle
SumAll.org
Feb 3rd 2015
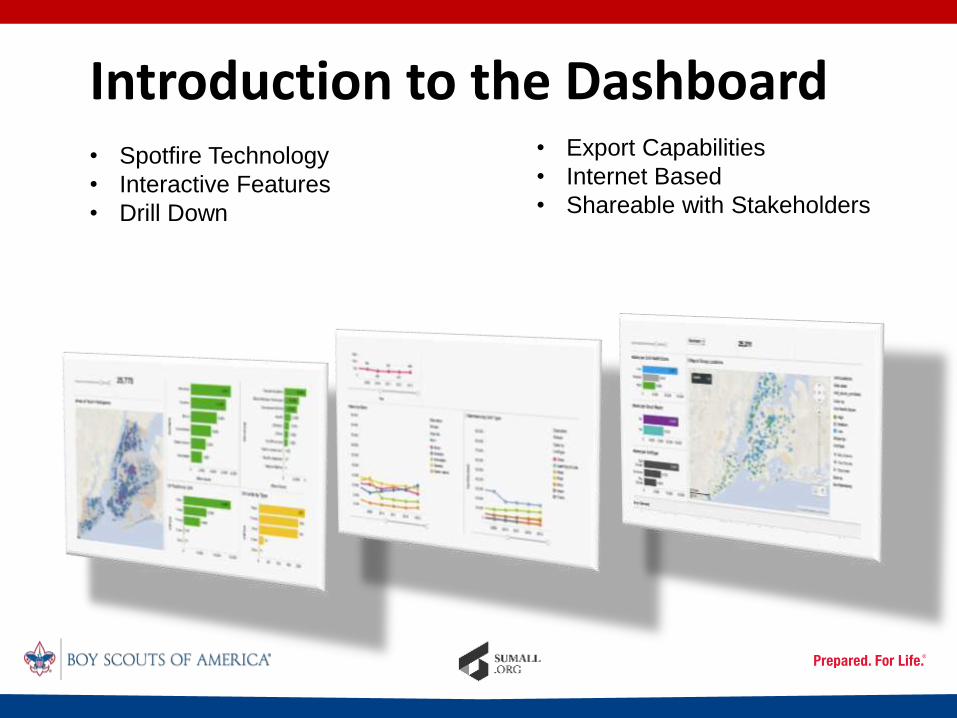
Introduction to the Dashboard• Spotfire Technology
• Interactive Features
• Drill Down
• Export Capabilities
• Internet Based
• Shareable with Stakeholders

Streamline Workflow
Benefits of a Dashboard
Consolidate
Information
Understand
Strengths &
Challenge Areas

Mapping within the Dashboard
What the map shows
• Identification of where units & schools are located
• Classification of which Units are the most healthy
• Understand external factors (income levels) to location of Units
What the User can do with mapping
• Identify neighborhoods that are ripe for either traditional
Scouting or Scoutreach Scouting resources
• Identify local schools for recruiting in existing units
• Tool for NYC decision makers To help expand local scouting

GNYC- BSA Membership vs Median Income
GNYC – BSA Youth Membership Heat
map
Density
Low High

Group
Pack
Post
Troop
GNYC – BSA Unit
Locations and
Median Household
Income Map
Membership
Type
* Membership
** Size of Income relative
to # of members
Median Household
Income
> $ 75K
$ 50K - $ 75K
$ 25K - $ 50K
< $ 25K
* Based on 2010 US
Census Data

The Next Six Months
• Share findings with key community and scout leaders throughout New York City.
• Invite these leaders to join in identifying prospective new units and leadership to organize them.
• Train volunteers and staff how to effectively use the Sum All findings/dashboard to better allocate our Council resources and grow scouting in existing Packs, Troops, Crews and Posts.