Predicting environmental chemical factors associated with disease
17
Patel and Butte BMC Medical Genomics 2010, 3:17 http://www.biomedcentral.com/1755-8794/3/17 Open Access RESEARCH ARTICLE BioMed Central © 2010 Patel and Butte; licensee BioMed Central Ltd. This is an Open Access article distributed under the terms of the Creative Com- mons Attribution License (http://creativecommons.org/licenses/by/2.0), which permits unrestricted use, distribution, and reproduc- tion in any medium, provided the original work is properly cited. Research article Predicting environmental chemical factors associated with disease-related gene expression data Chirag J Patel 1,2,3 and Atul J Butte* 1,2,3 Abstract Background: Many common diseases arise from an interaction between environmental and genetic factors. Our knowledge regarding environment and gene interactions is growing, but frameworks to build an association between gene-environment interactions and disease using preexisting, publicly available data has been lacking. Integrating freely-available environment-gene interaction and disease phenotype data would allow hypothesis generation for potential environmental associations to disease. Methods: We integrated publicly available disease-specific gene expression microarray data and curated chemical- gene interaction data to systematically predict environmental chemicals associated with disease. We derived chemical- gene signatures for 1,338 chemical/environmental chemicals from the Comparative Toxicogenomics Database (CTD). We associated these chemical-gene signatures with differentially expressed genes from datasets found in the Gene Expression Omnibus (GEO) through an enrichment test. Results: We were able to verify our analytic method by accurately identifying chemicals applied to samples and cell lines. Furthermore, we were able to predict known and novel environmental associations with prostate, lung, and breast cancers, such as estradiol and bisphenol A. Conclusions: We have developed a scalable and statistical method to identify possible environmental associations with disease using publicly available data and have validated some of the associations in the literature. Background The etiology of many diseases results from interactions between environmental factors and biological factors [1]. Our knowledge regarding interaction between environ- mental factors, such chemical exposure, and biological factors, such as genes and their products, is increasing with the advent of high-throughput measurement modal- ities. Building associations between environmental and genetic factors and disease is essential in understanding pathogenesis and creating hypotheses regarding disease etiology. However, it is currently difficult to ascertain multiple associations of chemicals to genes and disease without significant experimental investment or large- scale epidemiological study. Use of publicly-available environmental chemical factor and genomic data may facilitate the discovery of these associations. We desired to use pre-existing datasets and knowledge- bases in order to derive hypotheses regarding chemical association to disease without upfront experimental design. Specifically, we asked what environmental chemi- cals could be associated with gene expression data of dis- ease states such as cancer, and what analytic methods and data are required to query for such correlations. This study describes a method for answering these questions. We integrated publicly available data from gene expres- sion studies of cancer and toxicology experiments to examine disease/environment associations. Central to our investigation was the Comparative Toxicogenomics Database (CTD) [2], which contains information about chemical/gene/protein interactions and chemical/gene/ disease relationships, and the Gene Expression Omnibus (GEO) [3], the largest public gene expression data reposi- * Correspondence: [email protected] 1 Department of Pediatrics, Stanford University School of Medicine, Stanford, CA 94305, USA Full list of author information is available at the end of the article
Transcript of Predicting environmental chemical factors associated with disease

Patel and Butte BMC Medical Genomics 2010, 3:17http://www.biomedcentral.com/1755-8794/3/17
Open AccessR E S E A R C H A R T I C L E
Research articlePredicting environmental chemical factors associated with disease-related gene expression dataChirag J Patel1,2,3 and Atul J Butte*1,2,3
AbstractBackground: Many common diseases arise from an interaction between environmental and genetic factors. Our knowledge regarding environment and gene interactions is growing, but frameworks to build an association between gene-environment interactions and disease using preexisting, publicly available data has been lacking. Integrating freely-available environment-gene interaction and disease phenotype data would allow hypothesis generation for potential environmental associations to disease.
Methods: We integrated publicly available disease-specific gene expression microarray data and curated chemical-gene interaction data to systematically predict environmental chemicals associated with disease. We derived chemical-gene signatures for 1,338 chemical/environmental chemicals from the Comparative Toxicogenomics Database (CTD). We associated these chemical-gene signatures with differentially expressed genes from datasets found in the Gene Expression Omnibus (GEO) through an enrichment test.
Results: We were able to verify our analytic method by accurately identifying chemicals applied to samples and cell lines. Furthermore, we were able to predict known and novel environmental associations with prostate, lung, and breast cancers, such as estradiol and bisphenol A.
Conclusions: We have developed a scalable and statistical method to identify possible environmental associations with disease using publicly available data and have validated some of the associations in the literature.
BackgroundThe etiology of many diseases results from interactionsbetween environmental factors and biological factors [1].Our knowledge regarding interaction between environ-mental factors, such chemical exposure, and biologicalfactors, such as genes and their products, is increasingwith the advent of high-throughput measurement modal-ities. Building associations between environmental andgenetic factors and disease is essential in understandingpathogenesis and creating hypotheses regarding diseaseetiology. However, it is currently difficult to ascertainmultiple associations of chemicals to genes and diseasewithout significant experimental investment or large-scale epidemiological study. Use of publicly-available
environmental chemical factor and genomic data mayfacilitate the discovery of these associations.
We desired to use pre-existing datasets and knowledge-bases in order to derive hypotheses regarding chemicalassociation to disease without upfront experimentaldesign. Specifically, we asked what environmental chemi-cals could be associated with gene expression data of dis-ease states such as cancer, and what analytic methods anddata are required to query for such correlations. Thisstudy describes a method for answering these questions.We integrated publicly available data from gene expres-sion studies of cancer and toxicology experiments toexamine disease/environment associations. Central toour investigation was the Comparative ToxicogenomicsDatabase (CTD) [2], which contains information aboutchemical/gene/protein interactions and chemical/gene/disease relationships, and the Gene Expression Omnibus(GEO) [3], the largest public gene expression data reposi-
* Correspondence: [email protected] Department of Pediatrics, Stanford University School of Medicine, Stanford, CA 94305, USAFull list of author information is available at the end of the article
BioMed Central© 2010 Patel and Butte; licensee BioMed Central Ltd. This is an Open Access article distributed under the terms of the Creative Com-mons Attribution License (http://creativecommons.org/licenses/by/2.0), which permits unrestricted use, distribution, and reproduc-tion in any medium, provided the original work is properly cited.

Patel and Butte BMC Medical Genomics 2010, 3:17http://www.biomedcentral.com/1755-8794/3/17
Page 2 of 17
tory. Information in the CTD is curated from the peer-reviewed literature, while gene expression data in GEO isuploaded by submitters of manuscripts.
Most approaches to date to associate environmentalchemicals with genome-wide changes can be put into 2categories. These approaches either 1.) have tested asmall number of chemicals on cells and measuredresponses on a genomic scale, or 2.) used existing knowl-edge bases, such as Gene Ontology, to associate anno-tated pathways to environmental insult.
The first method involves measuring physiologicalresponse on a gene expression microarray. This approachallows researchers to test chemical association on agenomic scale, but the breadth of discoveries is con-strained by the number of chemicals tested against a cellline or model organism. These experiments are notintended for hypothesis generation across hundreds ofpotential chemical factors with multiple phenotypicstates. Only a few chemicals can be tractably tested forassociation to gene activity [4,5], or disease on cell lines[6], or on model organisms, including rat and mouse [7].In rare cases, this approach has reached the level of ahundred or thousand chemical compounds, such as theConnectivity Map, developed by Lamb, Golub, and col-leagues [8], which attempts to associate drugs with geneexpression changes. After measuring the genome-wideeffect on gene expression after application of hundreds ofdrugs at various doses, drug signatures are calculated andare then queried with other datasets for which a potentialtherapeutic is desired. While this has proven to be anexcellent system to find chemicals that essentially reversethe genome-wide effects seen in disease, the approach ofmeasuring gene expression and calculating signaturesacross tens of thousands of environmental chemicals isnot always feasible or scalable. Although other data-driven approaches have been described [9], few havegiven insight into external causes of disease.
A second approach has been to use knowledge bases,such as Gene Ontology [10] to aid in the interpretation ofgenomic results. For example, Gene Ontology analysis ofa cancer experiment might elucidate a molecular mecha-nism related to an environmental chemical. Unfortu-nately, there is still a lack of methodology to derivehypotheses for environmental-genetic associations in dis-ease pathogenesis, as Gene Ontology and general gene-set based approaches have limited information on envi-ronmental chemicals.
In contrast to the previous approaches, we claim thatthe integration of pre-existing data and knowledge basescan derive hypotheses regarding the association of chem-icals to gene activity and disease from multiple datasets ina scalable manner. Gohlke et al have proposed anapproach to predict environmental chemicals associatedwith phenotypes also using knowledge from the CTD
[11]. Their method utilizes the Genetic Association Data-base (GAD) [12] to associate phenotypes to genetic path-ways and the CTD to link pathways to environmentalfactors. This method has proved its utility, allowing forproduction of hypotheses for chemicals associated withdiseases categorized as metabolic or neuropsychiatricdisorders. However, in its current configuration, theirmethod is dependent on the GAD, which contains stati-cally annotated phenotypes in relation to genes contain-ing variants; such DNA changes are not likely to bereflective of molecular profiles of tissues being suspectedfor environmental influence. Unlike this method, ourproposed approach is tissue- and data-driven in that thephenotype is determined by the individual measurementsof gene expression in cells and tissues, allowing for thedynamic capture of phenotypes.
The approach we propose here is agnostic to experi-ment protocol, such as cell line or chemical agent tested,and provides for a less resource-intensive screening ofchemicals to biologically validate. Our methodologyessentially combines the best features of these currentapproaches. We start by compiling "chemical signatures"in a scalable way using the CTD. These chemical signa-tures capture known changes in gene expression second-ary to hundreds of environmental chemicals. In a mannersimilar to how Gene Ontology categories are tested forover-representation, we then calculate the genes differen-tially expressed in disease-related experiments and deter-mine which chemical signatures are significantly over-represented. We first verified the accuracy of our meth-odology by analyzing microarray data of samples withknown chemical exposure. After these verification stud-ies yielded positive results, we then applied the method topredict disease-chemical associations in breast, lung, andprostate cancer datasets. We validated some of these pre-dictions with curated disease-chemical relations, war-ranting further study regarding pathogenesis andbiological mechanism in context of environmental expo-sure. Our method appears to be a promising and scalableway to use existing datasets to predict environmentalassociations between genes and disease.
MethodsMethod to Predict Environmental Associations to Gene Expression DataThe Comparative Toxicogenomics Database (CTD)includes manually-curated, cross-species relationsbetween chemicals and genes, proteins, and mRNA tran-scripts [13]. We downloaded the knowledge-base span-ning 4,078 chemicals and 15 461 genes and 85 937relationships between them in January 2009. An exampleof a relationship in the CTD is "Chemical TCDD resultsin higher expression of CYP1A1 mRNA as cited byAnwar-Mohamed et al. in H. sapiens" (demonstrated in

Patel and Butte BMC Medical Genomics 2010, 3:17http://www.biomedcentral.com/1755-8794/3/17
Page 3 of 17
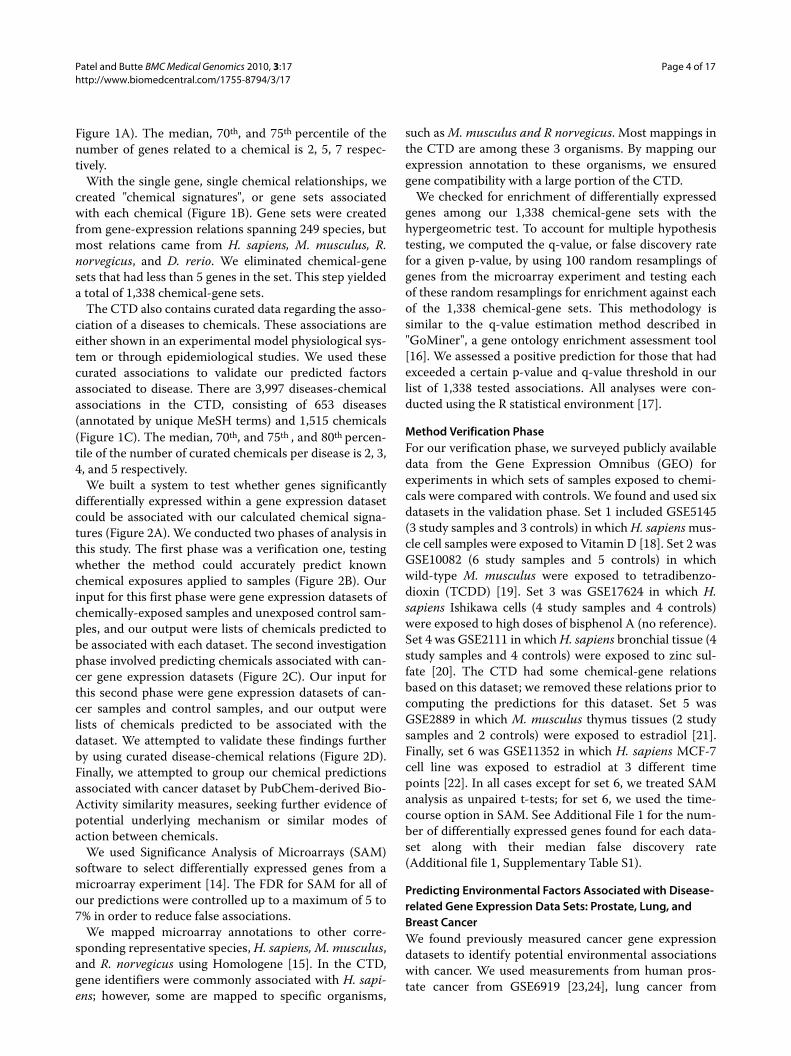
Figure 1 Prediction database creation based on the Comparative Toxicogenomics Database (CTD). A.) The CTD contained 85,937 total unique chemical-gene relations over 4,078 chemicals and 15,461 genes. Each relation had one or more citations of support. An example hypothetical relation, "TCDD lead to higher expression of CYP1A1 mRNA in H. sapiens as shown in Anwar-Mohamed et al" is seen on the right panel. B.) Creation of chemical-gene set relations. Each chemical-gene relation had a number of citations of support, xi. For each chemical, we constructed a gene set, or "signature" from the individual chemical-gene relations. We filtered out signatures that had at least 5 genes in the set, leaving a total of 1,338 chemical-gene sets. An example of one chemical-gene set is seen on the right panel of B: the genes CYP1A1, AHR, AHR2 are shown to have multiple citations for the relation, 60, 40, and 9 respectively.
chemical4,078
gene15,461
organism249
1 ncited relations85,937 total unique chemical-gene relations
chemical1,338
gene 1
gene 2
gene n
1,338 total chemical-gene setsor "signatures"
A
B
TCDD
CYP1A1
increased expressionAnwar-Mohamed et al
H. sapiens
Example: "Chemical TCDD leads to higher expression of CYP1A1 mRNA in H. sapiens (Anwar-Mohamed et al)"
Dioxins
CYP1A1
AHR
AHR2
Example: Gene set for the Dioxins chemical,with 60, 40, and 9 references of CYP1A1, AHR
and AHR2 interactions
60
40
9
x1
x2
xn
xi denote number of references
for a chemical-gene relation
C
chemical 1
chemical 2
chemical n
disease653
x1x2
xn
xi denote number of references
for a disease-chemical relation
Prostatic Neoplasms
sodium arsenite
cadmium
bisphenol A
Example: Chemical set for the "Prostatic Neoplasms" disease
(MeSH: D011471),with references of associating the disease
to sodium arsenite, cadmium, and bisphenol A
Patel and Butte BMC Medical Genomics 2010, 3:17http://www.biomedcentral.com/1755-8794/3/17
Page 4 of 17
Figure 1A). The median, 70th, and 75th percentile of thenumber of genes related to a chemical is 2, 5, 7 respec-tively.
With the single gene, single chemical relationships, wecreated "chemical signatures", or gene sets associatedwith each chemical (Figure 1B). Gene sets were createdfrom gene-expression relations spanning 249 species, butmost relations came from H. sapiens, M. musculus, R.norvegicus, and D. rerio. We eliminated chemical-genesets that had less than 5 genes in the set. This step yieldeda total of 1,338 chemical-gene sets.
The CTD also contains curated data regarding the asso-ciation of a diseases to chemicals. These associations areeither shown in an experimental model physiological sys-tem or through epidemiological studies. We used thesecurated associations to validate our predicted factorsassociated to disease. There are 3,997 diseases-chemicalassociations in the CTD, consisting of 653 diseases(annotated by unique MeSH terms) and 1,515 chemicals(Figure 1C). The median, 70th, and 75th , and 80th percen-tile of the number of curated chemicals per disease is 2, 3,4, and 5 respectively.
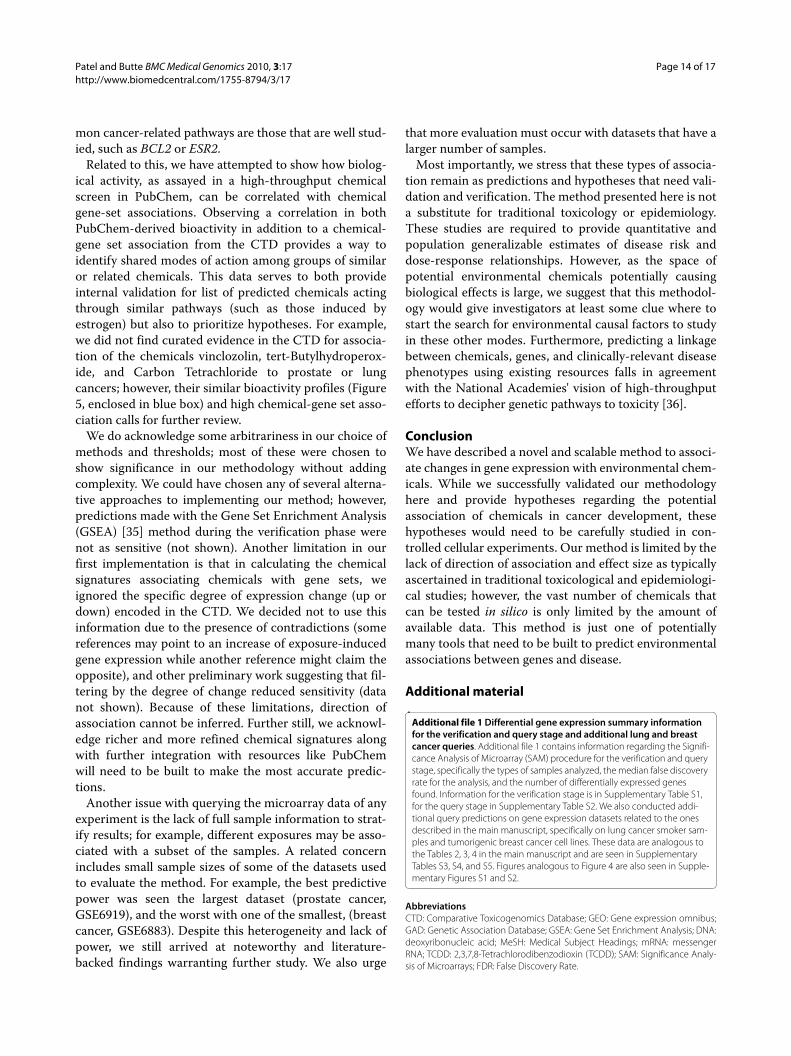
We built a system to test whether genes significantlydifferentially expressed within a gene expression datasetcould be associated with our calculated chemical signa-tures (Figure 2A). We conducted two phases of analysis inthis study. The first phase was a verification one, testingwhether the method could accurately predict knownchemical exposures applied to samples (Figure 2B). Ourinput for this first phase were gene expression datasets ofchemically-exposed samples and unexposed control sam-ples, and our output were lists of chemicals predicted tobe associated with each dataset. The second investigationphase involved predicting chemicals associated with can-cer gene expression datasets (Figure 2C). Our input forthis second phase were gene expression datasets of can-cer samples and control samples, and our output werelists of chemicals predicted to be associated with thedataset. We attempted to validate these findings furtherby using curated disease-chemical relations (Figure 2D).Finally, we attempted to group our chemical predictionsassociated with cancer dataset by PubChem-derived Bio-Activity similarity measures, seeking further evidence ofpotential underlying mechanism or similar modes ofaction between chemicals.
We used Significance Analysis of Microarrays (SAM)software to select differentially expressed genes from amicroarray experiment [14]. The FDR for SAM for all ofour predictions were controlled up to a maximum of 5 to7% in order to reduce false associations.
We mapped microarray annotations to other corre-sponding representative species, H. sapiens, M. musculus,and R. norvegicus using Homologene [15]. In the CTD,gene identifiers were commonly associated with H. sapi-ens; however, some are mapped to specific organisms,
such as M. musculus and R norvegicus. Most mappings inthe CTD are among these 3 organisms. By mapping ourexpression annotation to these organisms, we ensuredgene compatibility with a large portion of the CTD.
We checked for enrichment of differentially expressedgenes among our 1,338 chemical-gene sets with thehypergeometric test. To account for multiple hypothesistesting, we computed the q-value, or false discovery ratefor a given p-value, by using 100 random resamplings ofgenes from the microarray experiment and testing eachof these random resamplings for enrichment against eachof the 1,338 chemical-gene sets. This methodology issimilar to the q-value estimation method described in"GoMiner", a gene ontology enrichment assessment tool[16]. We assessed a positive prediction for those that hadexceeded a certain p-value and q-value threshold in ourlist of 1,338 tested associations. All analyses were con-ducted using the R statistical environment [17].
Method Verification PhaseFor our verification phase, we surveyed publicly availabledata from the Gene Expression Omnibus (GEO) forexperiments in which sets of samples exposed to chemi-cals were compared with controls. We found and used sixdatasets in the validation phase. Set 1 included GSE5145(3 study samples and 3 controls) in which H. sapiens mus-cle cell samples were exposed to Vitamin D [18]. Set 2 wasGSE10082 (6 study samples and 5 controls) in whichwild-type M. musculus were exposed to tetradibenzo-dioxin (TCDD) [19]. Set 3 was GSE17624 in which H.sapiens Ishikawa cells (4 study samples and 4 controls)were exposed to high doses of bisphenol A (no reference).Set 4 was GSE2111 in which H. sapiens bronchial tissue (4study samples and 4 controls) were exposed to zinc sul-fate [20]. The CTD had some chemical-gene relationsbased on this dataset; we removed these relations prior tocomputing the predictions for this dataset. Set 5 wasGSE2889 in which M. musculus thymus tissues (2 studysamples and 2 controls) were exposed to estradiol [21].Finally, set 6 was GSE11352 in which H. sapiens MCF-7cell line was exposed to estradiol at 3 different timepoints [22]. In all cases except for set 6, we treated SAManalysis as unpaired t-tests; for set 6, we used the time-course option in SAM. See Additional File 1 for the num-ber of differentially expressed genes found for each data-set along with their median false discovery rate(Additional file 1, Supplementary Table S1).
Predicting Environmental Factors Associated with Disease-related Gene Expression Data Sets: Prostate, Lung, and Breast CancerWe found previously measured cancer gene expressiondatasets to identify potential environmental associationswith cancer. We used measurements from human pros-tate cancer from GSE6919 [23,24], lung cancer from

Patel and Butte BMC Medical Genomics 2010, 3:17http://www.biomedcentral.com/1755-8794/3/17
Page 5 of 17
GSE10072 [25], and breast cancer from GSE6883 [26].We conducted all SAM analyses using an unpaired t-testbetween disease and control samples. Additional File 1shows the number of differentially expressed genes mea-sured for each dataset along with the level of FDR control(Additional file 1, Supplementary Table S2).
We deliberately chose cancer datasets that used a dif-ferent population of controls rather than normal tissuesfrom the same patients. The prostate cancer dataset(GSE6919) consisted of 65 prostate tissue cancer samplesand 17 normal prostate tissue samples as controls.
The lung cancer dataset (GSE10072) consisted of twopatient groups: non-smokers with cancer (historicallyand currently), and current smokers with cancer. We con-ducted the predictions on these groups separately. Thecancer-non smoker group consisted of 16 samples andthe cancer-smoker group had 24 samples. The controlgroup consisted of 15 samples.
The breast cancer dataset (GSE6883) consisted of twodistinct cancer sub-groups: non-tumorigenic and tumori-genic. As with the lung cancer data, we conducted ourpredictions on these groups separately. The non-tumori-genic group consisted of three samples and the tumori-genic group had six samples. The control groupcontained three samples.
We then validated our highly ranked factor predictionswith disease-chemical knowledge from the CTD. In par-ticular, we determined if the highly significant chemicalsin our prediction list included those that had curatedrelationship with cancer in the CTD (disease-chemicakrelation). This step was similar to measuring associationto chemicals via enriched gene sets using the hypergeo-metric test as described above. We used curated factorsassociated with Prostatic Neoplasms (MeSH ID:D011471), Lung Neoplasms (D008175), and Breast Neo-plasms (D001943), to validate our predictions generatedwith the prostate cancer, lung cancer, and breast cancerdatasets respectively. Further, we assessed the validationby computing the actual number of false positives andtrue negatives. To compute this number, we assessedwhether the prediction list was enriched for chemicalsassociated with any of the other diseases in the CTD at ahigher significance level than the true disease; for thistest, we chose diseases that had at least 5 chemical associ-ations, a total of 141 diseases. As an example, to assessthe false positive rate for the prostate cancer (MeSH ID:D011471) predictions, we determined the curated enrich-ment of our predictions for all 140 other disease-chemi-cal sets and counted the number of diseases that had alower p-value than that computed for D011471.
Figure 2 Predicting environmental chemical association to gene expression datasets. A.) A representation of the 1338 chemical-gene sets in our prediction database. B.) For the validation step, we conducted SAM to find genes whose expression was altered in each of our datasets. We then mapped the differentially expressed genes to corresponding extra-species genes in our database by using Homologene. For each chemical-gene set signature, we conduct a hypergeometric test for enrichment and ranked each result by p-value. C.) We applied the approach used in B to predict chemical association to prostate, breast, and lung cancer data and validated these results with curated disease-chemical annotations from the CTD represented in D.). D.) Representation of the curated disease-chemical associations in the CTD.
Chemically Perturbed Microarray Data:
Exposed vs. Non-exposedChemical annotated dataset
Estradiol (2), TCDD, Zinc, Bisphenol A, Vitamin D
Accuracy:rank of correctly identified
chemical
Disease Microarray Data:Disease vs. Non-disease
Prostate, Lung, Breast Cancers
Significance Analysis of Microarrays
Homologene mapping
Hypergeometric test
Literature Validation:proof of disease association
among highly ranked chemicals
n
Comparative Toxicogenomics Database (CTD) derived chemical-gene sets or "signatures"
gene
chemical
organism
gene organism
1
gene
chemical
organism
gene organism
1
n
1,338
A B C
Comparative Toxicogenomics Database (CTD) derived disease-chemical associations
diseasechemical
chemical
1
n
D
Predictions:ranked by p-value, q-value
factor p1.)2.)
q
Predictions:ranked by p-value, q-value
factor p1.)2.)
q

Patel and Butte BMC Medical Genomics 2010, 3:17http://www.biomedcentral.com/1755-8794/3/17
Page 6 of 17
Clustering Significant Predictions By PubChem-derived Biological ActivityChemical-gene sets derived from the CTD are but onerepresentation of how a chemical might affect biologicalactivity. Biological activity of chemicals may also bederived from high-throughput, in-vitro chemical screenssuch as those archived in PubChem [27,28]. Specifically,the PubChem database provides a large number of phe-notypic measurements (or "BioAssays") for many of thechemicals we predicted for cancer. In addition, PubChemprovides tools to compare BioAssay measurements fordifferent chemicals. Quantitative and standardized Bio-Assay measurements (normalized "scores") allow com-parison of biological activities of chemicals andderivation of biological activity similarity between chemi-cals. For example, PubChem represents the biologicalactivity of a compound through a vector of BioAssayscores and assembles a bioactivity similarity matrixbetween each pair of chemicals with this data.
We sought further external evidence of the relevance ofthe predicted chemicals though comparison of their pat-terns of PubChem-sourced biological activity (Figure 3).First, we produced a list of chemical predictions for eachcancer dataset as described above (Figure 2, 3A, and 3B)and submitted our list of chemicals to PubChem foractivity comparison (Figure 3C). Finally, we observed pat-terns of correlation between PubChem-derived biologicalactivities of the compounds to their chemical-gene setassociation significance by clustering the chemicals in theprediction list by their biological activity.
ResultsWe implemented a method to predict a list of environ-mental factors associated with differentially expressedgenes (Figure 2). The method is centered on chemical-gene sets that are derived from single curated chemical-gene relationships in the CTD. We determine whetherthe differentially expressed genes are associated to achemical by assessing if the expressed genes are enrichedfor a chemical-gene set, or contain more genes from thechemical-gene set than expected at random using thehypergeometric test. We applied this method in twophases, the first a verification phase in which we soughtto rediscover known exposures applied to samples, and aquery phase, in which we sought to find factors associ-ated with cancer gene expression datasets. We refer tosignificant chemical-gene set associations to gene expres-sion data as "associations" or "predictions" in the follow-ing.
Verification PhaseWe first applied our method to gene expression data fromexperiments in which samples were exposed to specificchemicals, reasoning that if our method could identify
these known chemical exposures, we could use themethod to predict chemicals that may have perturbedgene expression in unknown experimental or diseaseconditions. Our goal was to determine where a geneexpression-altering chemical might lie in the range of sig-nificance rankings applied by the prediction method.
We applied our method on datasets that measured geneexpression after exposure to vitamin D, tetrachlorodiben-zodioxin (TCDD), bisphenol A, zinc, and estradiol (2datasets) on different tissue types (Additional File 1, Sup-plementary Table S1). Table 1 shows the results of ourpredictions along with a subset of genes in the chemical-gene set that were differentially expressed.
We were able to satisfactorily predict the exposuresapplied to the gene expression datasets. We ascertained apositive prediction if the exposure had a relatively highranking (low p-value for enrichment) and if the q-valuewas lower than 0.1. For the datasets measuring expres-sion after exposure to Vitamin D, calcitriol, a type of vita-min D, was ranked first in the list (p = 10-23, q = 0).Similarly, TCDD was predicted third in its respective list(p = 10-15, q = 0). The other exposures ranked within thetop percentile, ranging from 15 to 19; the lower bound ofp-values were between 10-6 and 0.01 and q-values lessthan 0.1. We reasoned that we could detect true associa-tions between environmental chemicals and gene expres-sion phenotypes provided they met these significancethresholds.
Predicting Environmental Chemicals Associated with Cancer Data SetsWe applied our prediction methods to datasets measur-ing the gene expression for prostate, breast, and lung can-cers. In particular, we computed predictions for prostatecancer from primary prostate tumor tissue, lung adeno-carcinomas from lung tissue from non-smoking individu-als, and non-tumorigenic breast cancer cells grown inmouse xenografts. Additional File 1 shows predictions forrelated data on tumorigenic breast cancer and smokerlung cancer samples (Additional file 1, SupplementaryTables S3 and S4). To validate and select specific predic-tions from our ranked list of 1,338 environmental chemi-cals, we measured how enriched top-ranking chemicalswere for annotated disease-chemical citations in for dis-eases of interest ("Prostate Neoplasms", "Breast Neo-plasms", and "Lung Neoplasms"). To call a positivechemical association or prediction to disease phenotype,we used p-value thresholds similar to what we observedduring the verification phase (α ≤ 10-4, 0.001, 0.01) alongwith q-values as low as possible, specifically less than 0.1.For comparison, we also used the typical p-value thresh-old of 0.05.
Figure 4 shows the result of the disease validationphase. In all cases, the signficant chemicals contained

Patel and Butte BMC Medical Genomics 2010, 3:17http://www.biomedcentral.com/1755-8794/3/17
Page 7 of 17
many of the specific curated disease-chemical relations.For example, if we call chemicals with p-values less than0.01 as positive predictions, then we were able to capture18%, 16%, and 7% of all of the curated relationships forprostate, lung, and breast cancers respectively (p = 10-7,10-4, and 4 × 10⁻⁵). We assessed specificity of our list bycomputing how many curated chemicals we found for allother diseases in the CTD (Figure 4, offset points inorange and black). We achieved false positive ratesbetween 1 to 4% for prostate cancer, 8 to 20% for lungcancer, and 2 to 10% for breast cancer. However, most allof the "false positives" were other types of neoplasms orcancers (Figure 4, examples annotated in italics/arrows).For example, for the lung and prostate cancer predictionsat α = 0.001 only 1 disease other than neoplasm or carci-noma was detected: Liver Cirrhosis, Experimental(MeSH ID: MESH:D008325).
For the prostate cancer dataset, we chose a chemicalsignature association threshold of 0.001 (q ≤ 0.01). Of1,338 chemicals tested, 50 total were found under thisthreshold. Of these 50 chemicals predicted, 10 had acurated relation with the MeSH term "Prostate neo-plasms". This amounted to prediction of 15% of all CTDcurated disease-chemical relations for the Prostatic Neo-plasms term (p = 3 × 10⁻⁷). These chemicals are seen inTable 2 and include estradiol, sodium arsenite, cadmium,and bisphenol A. Also predicted were known therapeu-tics, including raloxifene, doxorubicin, genistein, diethyl-stilbestrol, fenretinide, and zinc. We observed that manyof the genes detected were well-studied, additional sup-port to our predictions. For example, ESR2, PGR, andMAPK1 had 37, 34, and 14 references respectively citingtheir activity in the context of estradiol exposure (Table 2,second-to-right column). Second, we observed common
Figure 3 Clustering chemical prediction lists by biological activity archived in PubChem. A.) A representation of the CTD and chemical-gene sets as shown in detail in Figure 2. B.) Prediction of the chemicals associated to each cancer dataset using chemical-gene sets from the CTD. We se-lected highly significant chemical predictions for each cancer and clustered these chemicals by their "Bioactivity" similarity as defined and computed in PubChem. C.) Within PubChem, each of these chemicals has a vector of standardized BioAssay scores. PubChem had 790 BioAssay scores for 66 of our significant predictions. The PubChem BioActivity similarity tool uses these vectors of scores to computes the biological activity similarity for each pair of chemicals and similarity is represented as a matrix.
Disease Microarray Data:Disease vs. Non-disease
Prostate, Lung, Breast Cancers
Predictions:ranked by p-value, q-value
factor p1.)2.)
qPubChem BioActivity Score Data
chemicalbioass
ay 1
bioassay 2
bioassay 3
bioassay 7
90
chemical
PubChem BioActivity Similarity MatrixCorrelation of bioassay scores
66
66
Significant Predictions:clustered by BioActivity Similarity
factor p
CTD
cg
g
A B C
significant chemicalsp < α1
66

Patel and Butte BMC Medical Genomics 2010, 3:17http://www.biomedcentral.com/1755-8794/3/17
Page 8 of 17
occurrence of genes such as ESR2, BCL2, and MAPK1,among some of the gene sets associated with chemicalssuch as estradiol, raloxifene, sodium arsenite, doxorubi-cin, diethylstilbestrol, and genistein.
For the lung cancer dataset, we also chose a thresholdof 0.001 (q ≤ 0.004). Of 1,338 chemicals tested, 42 werefound under this threshold. Of these 42 chemicals, 7 hada cited relation with "Lung neoplasms", 14% of all curateddisease-chemical relations for the term (p = 1 × 10⁻⁵).These chemicals are seen in Table 3. For lung cancer, weobserved cited chemicals such as sodium arsenite, vana-dium pentoxide, dimethylnitroamine, 2-acetylamino-flourene, and asbestos. Therapeutics observed includeddoxorubicin and indomethacin. We did not observe com-mon genes represented for different chemical-gene sets,unlike the prostate cancer predictions. Predictions for thesmoker-lung cancer samples were similar, resulting insodium arsenite, dimethylnitrosamine, and vanadiumpentoxide, albeit through different differentially
expressed genes (Additional File 1, Supplementary FigureS1 and Table 3).
For the breast cancer dataset, we chose a threshold of0.01 (q ≤ 0.08). Of 1,338 chemicals tested, 28 were foundunder this threshold. Of these 28 chemicals, 7 had a citedrelation with "Breast neoplasms", 7% of all curated dis-ease-chemical relations for the disease. These chemicalsare seen in Table 4 (p = 4 × 10⁻⁵). The chemicals predictedincluded progesterone and bisphenol A. Therapeuticsfound included indomethacin and cyclophosphamide.There was evidence for both a harmful chemical and atherapeutic for chemicals such as estradiol, genistein, anddiethylstilbestrol for breast cancer. Unlike the predictionsshown for prostate and lung cancer, the genes utilized inthe predictions for breast cancer were not as well studied,with 1 to 3 references for the gene and environment asso-ciation. We observed some commonality in chemical-gene sets, such as the presence of IL6 and CEBPD in sev-eral of the top chemicals predicted in association to thedisease. Similar chemicals were predicted for the tumori-
Table 1: Chemical Prediction Results from the Verification Phase.
Actual Chemical Exposure (GEO
accession)
Chemicals Predicted
Hypergeometric P-value
Rank (Percentile) q-value Relevant Genes Expressed
Vitamin D3 on H. sapiens muscle cells (GSE5145)
Calcitriol 1 × 10-23 1 (100) 0 VDR (25), CYP24A1 (14)
TCDD on M. musculus
(GSE10082)
TCDD 2 × 10-15 3 (99) 0 CYP1A1 (59), CYP1B1 (15),
AHRR(6), CYP1A2 (14)
Bisphenol A on H. sapiens Ishikawa cells (GSE17624)
Bisphenol A 1 × 10⁻⁶ 15 (99) 0 ESR1(31), ESR2(7), S100G (6)
Zinc sulfate on H. sapiens bronchial tissue (GSE2111)
Zinc sulfate 3 × 10⁻³ 15 (99) 0.04 SLC30A1 (3), MT1F(2), MT1G(2)
Estradiol on M. musculus thymus
(GSE2889)
Estradiol 5 × 10⁻³ 17 (99) 0.08 C3(6), LPL (4), CTSB (2)
Estradiol on H. sapiens MCF7 cell line (GSE11352)
Estradiol 5 × 10⁻³ 19 (99) 0.08 ISG20 (2), MGP (2), SERPINA1 (2)
Each row represents a gene expression dataset and relevant prediction and ranking. The first column specifies the gene expression dataset, the 2nd column the actual exposure applied to the samples for the gene expression set. The 3rd and 4th columns represent the hypergeometric p-value for chemical-gene set enrichment along with the rank of the chemical in the prediction list. The 5th column shows the 5th percentile of the ranking derived from 100 random samplings of genes from the gene expression dataset. The 6th column show notable genes expressed in the chemical-gene set along with the number of references the chemical-gene relation in the CTD.

Patel and Butte BMC Medical Genomics 2010, 3:17http://www.biomedcentral.com/1755-8794/3/17
Page 9 of 17
Figure 4 Curated disease-chemical enrichment versus prediction lists for prostate, lung, and breast cancer datasets. For a prediction list, we selected chemicals that ranked within α = 10-4, 10-3, 10-2, and 0.05. This -log10(threshold) along with number of total chemicals found (in parentheses) for each threshold is seen on the x-axis of each figure. We tested if these highly ranked chemicals found under each threshold were enriched for chem-icals that had known curated association with the cancer in question. The -log10(p-value) for this enrichment is seen on the y-axis. The solid round red marker represents the enrichment test for the actual disease for which the predictions were based; the number underneath represents the total number of chemicals found in the prediction list that had a curated association with the disease and the percent found among all curated relations for that disease. We estimated accuracy and precision by computing disease-chemical enrichment for all other diseases; false positives are offset in black and true negatives are in yellow. The false positive rate is bracketed and in italics. Examples of false positives are annotated in blue italics along with the number of chemicals found in the prediction list corresponding to that disease and the percent found among all curated relations for that disease. We computed this validation enrichment for A.) prostate cancer, B.) lung cancer from nonsmokers, and C.) non-tumorigenic breast cancers.
−log10(pvalue) threshold for factor ranking (number of chemicals found)
−lo
g10(
pval
ue)
fact
or−
dise
ase
enric
hmen
t
�
�
�
�
7(10%)
10(15%)
12(18%)13(19%)
�
�
�
� ��
�
�
� �
�
��
�
�
�
��
�
�
�
�
�
�
�
�
�
�
�
�
�
�
�
�
�� �
�
��
�
�
�
�
�
�
��
�
�
� �
�
�
� �
�
�
��
�
�
��
�
�
�
�
�
�
�
�
�
�
�
�
�
�
�
�
�� ��
�
�
�
�
� �
�
�
�
�
�
�
�
�
�
�
�� �
�
��� ��
�
�
��
�
�
�
��
�
�
�
�
��
��
�
�
�
�
���
�
�� �
�
��
�
�
�
�
�
�
�
�
�
�
�
�
�
�
�
�
�
�
�
�
�
�
�
�
�
�
�
�
�
�
����
�
�
�
��
�
�
�
�
�
�
�
�
�
�
��
�
�
�
�
�
�
��
�
�
��
�
�
�
�
�
�
�
�
�
�
�
�
�
�
�
���
�
�
�
�
�
�
�
�
�
�
�
�
�
�
�
�
�
�
��
�
�
�
�
�
�
�
�
�
�
�
�
�
�
�
�
�
�
�
�
��
�
�
�
�
�
�
�
�
��
�
�� �
�
��
�
�
�
�
�
�
�
��
�
�
�
�
�
�
�
�
�
�
�
�
�
�
�
�
�
�
�
�
�
��
�
�
�
��
�
�
�
�
�
�
�
�
�
�
�
�
�
�
�
�
�
�
��
�
�
��
�
�
�
�
�
�
�
�
�
�
�
�
�
�
�
�
�
���
�
�
�
�
�
�
�
�
�
��
�
�
�
�
�
�
�
��
�
�
�
�
�
�
�
�
�
�
�
�
�
��
�
�
�
�
�
��
�
�
��
�
�
�
�
�
�
�
��
�
�
�
�
�
�
�
�
�
�
�
�
�
��
�
�
�
�
�
�
�
�
�
�
�
�
�
�
�
�
�
���
��
�
�
�
��
�
�
�
�
�
�
�
�
�
�
�
�
�
�
�
�
�
�
��
�
�
��
�
�
�
�
�
�
�
�
�
�
�
�
�
�
�
�
���
�
�
�
�
�
��
�
�
��
�
�
�
�
�
�
�
��
�
�
�
�
�
�
�
�
�
�
�
�
�
�
�
�
�
�
�
�
��
�
�
���
�
�
�
�
�
�
��
�
�
�
�
1.3 (89) 2 (68) 3 (50) 4 (27)
02
46
810
�
�
�
True NegativesFalse PositivesProstatic Neoplasms
2%
1%
3%4%
}}
} }
Carcinoma, Hepatocellular 10(30%)
Liver Neoplasms 10(29%)
Liver Cirrhosis 10(16%)
−log10(pvalue) threshold for factor ranking (number of chemicals found)
−lo
g10(
pval
ue)
fact
or−
dise
ase
enric
hmen
t
�
�
�
�
0(0%)
3(3%)
7(7%)
9(10%)
���� ��
��
�
�
������
�
�
�
�
�
�
�
�
�
�
�
�
�
�
�
�
�
�
�
�
�
�
����� ����������������� ������ ������ ������ ��� ��� ������������������������������� �� �������� ���� �� ���� ��� ��
�
�
�
�
�
����������� ��
�
����
�
�
�
�
�
�
���
�
���
�
���
��
����
�
��������
�
��������
�
�
�
�� ���
�
�
�
�
��
�
�
����
�
�
�
��
�
��������
�
����
�
������
�
���������
�
��� ����
�
�
�
���������
�
�
�
�
�
�
�
�
���
�
�
�
��
�
���
�
�
�
�
�
�
�
�
��
�
�
��
�
�
�
�
�
�
�
�
�
�
�
��
��
�
�
��
�
��
�
�
��
�
�
�
�
�
�
�
��
�
��
�
�
�
�
�
�
�
�
�
�
�
�
�
�
�
�
�
��
� ��
�
�
�
�
�
�
�
�
��
�
������
�
�
�
�
��
�
�
�
�
�
�
�
��
��
��
�
���
�
���
�
�
�
�
�
�
�
�
�
�
�
�
�
��
�
�
�
�
�
�
�
����
�
�
�
�
�
�
�
�
�
�
�
�
�
��
�
��
�
�
�
�
�
�
�
�
�
�
�
�
�
�
�
��
����
�
�
��
�
�
�
�
�
�
�
�
�
�
�
�
�
�
�
��
�
�
�
��
��
�
�
�
�
�
�
�
�
�
�
�
�
�
��
�
���
�
�
�
�
�
�
�
�
�
�
�
�
�
�
�
���
��
��
��
�
�
�
�
��
1.3 (86) 2 (28) 3 (11) 4 (5)
01
23
45
6
�
�
�
True NegativesFalse PositivesBreast Neoplasms
Carcinoma, Hepatocellular 5(33%)
Prostatic Neoplasms 7(11%)
Skin Neoplasms4 (19%)
2%}
10%} 4%}
A
B
C
−log10(pvalue) threshold for factor ranking (number of chemicals found)
−lo
g10(
pval
ue)
fact
or−
dise
ase
enric
hmen
t
�
�
�
�
4(8%)
7(14%)8(16%)
9(18%)
�
�
�
�
�
�
�
�
�
���
�
�
�
�
�
�
�
�
�
�
�
�
�
�
��
�
�
�
�
��
�
�
��
�
��
�
��
�
�
�
�
�
�
���
�
��
�
�
�
��
�
�
�
�
��
�
� �
�
�
��
�
�
��
�
���
�
�
�
�
� �� �
�
�
�
�
��
�
�
��
�
�
��
�
��
�
� ����
��
���
�
���
� �
�
�� ��
��
� ����
�
�� �
�
�
�
�
�
�
�
�
�
�
�
�
�
�
�
��
�
�
�
�
�
�
�
�
�
�
�
�
�
��
�
�
�
�
�
���
�
�
�
�
�
�
�
�
�
�
�
�
�
�
�
�
�
��
�
�
�
�
�
�
�
�
�
�
��
�
���
�
�
�
��
�
�
��
�
�
�
�
�
�
�
�
�
�
��
�
�
�
�
�
�
��
��
�
���
��
�
�
�
�
�
���
��� ��
�
�
�
�
�
�
�
�
�
��
�
�
�
�
�
�
�
�
�
�
�
�
�
�
�
�
�
�
�
�
�
�
��
�
�
�
�
�
�
�
�
�
�
�
�
����
�
�
���
�
�
�
�
�
�
�
�
��
�
�
�
�
�
�
��
��
�
�
�
�
�
�
�
�
�
�
�
�
�
�
�
�
�
�
�
�
��
�
�
�
�
�
�
�
�
�
�
��
�
�
�
�
�
�
�
� �
��
�
���
�
�
�
�
�
�
�
��
�
�
� ���
�
�
�
�
�
�
�
�
�
���
�
�
�
�
�
�
�
�
�
�
�
�
�
�
�
�
�
�
�
�
�
�
��
�
�
�
�
�
�
�
�
�
��
�
����
�
�
�
��
�
�
�
�
�
��
�
�
��
�
�
�
�
�
�
��
�
�
�
�
��
�
�
�
�
�
�
�
�
�
�
�
�
�
�
�
��
�
�
�
�
�
�
�
�
�
�
��
�
�
��
��
�
��
��
�
���
�
�
�
�
�
�
�
�
�
�
��
�
�
�
�
�
�
�
�
�
�
�
��
�
�
�
�
1.3 (84) 2 (73) 3 (42) 4 (29)
02
46
810
1214
�
�
�
True NegativesFalse PositivesLung Neoplasms
10%} 9%}8%}
20%}
Prostatic Neoplasms (15%)
Carcinoma, Hepatocellular9(27%)
Mammary Neoplasms,
Experimental 7(28%)
Liver Cirrhosis 9(15%)

Patel and Butte BMC Medical Genomics 2010, 3:17http://www.biomedcentral.com/1755-8794/3/17
Page 10 of 17
genic breast cancer dataset, such as estradiol and proges-terone. However, chemicals not highly ranked in the non-tumorigenic predictions included benzene and the thera-pies tamoxifen and resveratrol (Additional File 1, Supple-mentary Figure S2 and Supplementary Table S4).
Some of the chemicals found were common to morethan one type of cancer (Figure 5). For example, we pre-dicted chemicals such as sodium arsenite for both pros-tate cancer and lung cancers, and bisphenol A for bothprostate and breast cancers. In some of the cases, the pre-
dicted chemical overlap across different cancers are dueto the expression of distinct genes for each dataset, high-lighting the potential of many possibilities for interactionbetween environmental chemicals and genes.
Clustering Significant Predictions by PubChem-derived Biological ActivityWe have described a method of generating a list of chem-ical predictions associated with disease-annotated geneexpression datasets and applied the method on gene
Table 2: Prediction of environmental chemicals associated with prostate cancer samples (GSE6919).
Chemical Predicted
Hypergeometric P-value
Rank (percentile) q-value Relevant genes in set (number of
references)
Citations
Estradiol 4 × 10⁻¹⁰ 5 (99) 0 ESR2(37), PGR(34), MAPK1(14)
[37]
Raloxifene 1 × 10⁻⁹ 6 (99) 0 ESR2(6), IGF1(5), BCL2(4)
[38]
Sodium arsenite 1 × 10⁻⁸ 8 (99) 0 JUN(13), MAPK1(9),
CCND1(8), FOS(6)
[30]
Doxorubicin 7 × 10⁻⁷ 11 (99) 0 BCL2(23), MAPK1(14),
TNF(10)
[39-42]
Cadmium 6 × 10⁻⁶ 13 (99) 0 MT2A(14), MT1A(12),
MT3(11), MT1(6)
[43]
Genistein 3 × 10⁻⁵ 19 (99) 6 × 10⁻⁴ ESR2(22), PGR (10), MAPK1 (5)
[44-46]
Diethylstilbestrol 3 × 10⁻⁵ 22 (98) 0.001 ESR2(8), FOS(8), HOXA10(4)
[47,48]
Fenretinide 3 × 10⁻⁴ 40 (97) 0.004 BCL2(3), ELF3(2), LDHA(2)
[49]
Bisphenol A 6 × 10⁻⁴ 47 (96) 0.01 PGR(8), ESR2(7), IL4RA(2)
[37]
Zinc 9 × 10⁻⁴ 53 (96) 0.01 MT3(18), MT2A(13), MT1A(11)
[50-53]
Shown in the table are a subset of the highly ranked chemicals (p < 0.001) that were predicted to have association with prostate cancer gene expression and had evidence of association with the MeSH term "Prostatic Neoplasms" as in the CTD. The 1st column represents the chemical predicted and the 2nd and 3rd columns show the hypergeometric p-value and ranking. The 4th column shows q-value derived from random samples of genes. The 5th column shows the notable genes in the chemical-gene set that were differentially expressed. The 6th column contains references for the prostate cancer and chemical association found from the CTD.

Patel and Butte BMC Medical Genomics 2010, 3:17http://www.biomedcentral.com/1755-8794/3/17
Page 11 of 17
expression data for several cancers. We have validated asubset of our predictions with evidence from the litera-ture as described above (Tables 2, 3, 4).
We sought further evidence of the biological relevanceof our predictions through internal comparison of theirpotential activity archived in PubChem. Specifically, weexpected some degree of correlation between "similar"chemicals and their gene set significance to the cancerdatasets. We opted to use PubChem BioActivity to assesschemical similarity, assuming this measure of phenotypicsimilarity would be representative of underlying biologi-cal pathways of action. We picked chemicals that weredeemed significant for thresholds used above (p = 0.001,0.001, 0.01, for the prostate, lung, and breast cancer data-sets) for all of the cancer datasets. This resulted in a totalof 130 chemicals, 66 of which had BioActivity data inPubChem. The BioActivity similarity for each of the 66chemicals was computed through 790 BioAssay scores.
Figure 5 shows the -log10 of significance for the highestranked chemical predictions clustered by their BioActiv-ity similarity.
We found some chemicals with similar biological activ-ity profiles in PubChem had similar patterns of chemical-gene set association across the cancer datasets. For exam-ple, sodium arsenite, sodium arsenate, and doxorubicinhave closely related biological profiles as well as high sig-nificance of chemical-gene set association for the pros-tate and lung cancer data (Figure 5, enclosed in orangebox); however, we did not observe other biologically simi-lar chemicals such as Tetradihydrobenzodioxin. On theother hand, we also observed correlation between thebiological activity similarity and chemical-gene set asso-ciation for hormone or steroidal chemicals such as ethi-nyl estradiol, estradiol, and diethylstilbestrol as well asprogesterone and corticosterone (Figure 5, enclosed inpurple boxes).
Table 3: Prediction of environmental chemicals associated with lung cancer samples (GSE10072).
Chemical Predicted Hypergeometric P-value
Rank (percentile) q-value Relevant genes in set (number of
references)
Citations
Doxorubicin 1 × 10⁻⁶ 16 (99) 4 × 10⁻⁴ CASP3(60), ABCB1(28),
BAX(26), BCL2 (23)
[54]
Sodium arsenite 8 × 10⁻⁶ 20 (98) 4 × 10⁻⁴ JUN(13), NQ01(6), EGR1(6)
[55-57]
Vanadium pentoxide 1 × 10⁻⁵ 24 (98) 6 × 10⁻⁴ HBEGF(3), CDK7(1), CDKN1B
(1), CDKN1C(1)
[58]
Dimethylnitrosamine 6 × 10⁻⁵ 27 (98) 7 × 10⁻⁴ TGFB1(23), TIMP1(15),
PCNA(6)
[31]
Indomethacin 2 × 10⁻⁴ 34 (97) 0.002 BIRC5(3), CDKN1B(2),
MMP9(2)
[59-61]
2-Acetylaminofluorene 3 × 10⁻⁴ 36 (97) 0.003 ABCB1(4), ABCG2(4), KRT19(2)
[62]
Asbestos, Serpentine 4 × 10⁻⁴ 39 (97) 0.004 IL6(2), MMP9(2), MMP12(2), PDGFB(2)
[63]
Shown in the table are a subset of the highly ranked chemicals (p < 0.001) that were predicted to have association with lung cancer gene expression (non-smokers) and had evidence of association with the MeSH term "Lung Neoplasms". Columns have similar definitions as Table 2.

Patel and Butte BMC Medical Genomics 2010, 3:17http://www.biomedcentral.com/1755-8794/3/17
Page 12 of 17
DiscussionWe have developed a knowledge- and data-drivenmethod to predict chemical associations with geneexpression datasets, using publicly available and previ-ously disjoint datasets. To our knowledge, there are fewmethods that generate hypotheses regarding environ-mental associations with disease from gene expressiondata. Most current approaches in toxicology have focusedon a small number of environmental influences on singleor small groups of genes, while current approaches intoxicogenomics have been concentrated on measuringgenome-wide responses for a few chemicals [29]. Ourprediction method enables the generation of hypothesesin a larger scalable manner using existing data, examiningthe potential role of hundreds of chemicals over thou-sands of genome-wide measurements and diseases.
As an example, we found predicted chemicals such assodium arsenite in its association with prostate and lungcancers, estrogenic compounds such as bisphenol A andestradiol with prostate and breast cancers, and dimethyl-nitrosamine with lung cancer. Although each has curatedknowledge behind the association in the CTD, mecha-nisms for the action are not well known and call for fur-
ther study. So far, Benbrahim-Talaa et al have foundhypomethylation patterns in the presence of arsenic inprostate cancer cells [30]. Zanesi et al show a potentialinteraction role of FHIT gene and dimethylnitrosamine toproduce lung cancers [31]. Evidence of a complex mecha-nistic action of estrogens, such as estradiol, on breastcancer carcinogenesis has been established [32]; howeverthe role of other estrogenic-like compounds have onlyrecently been studied. For example, bisphenol A has beenshown to invoke an aggressive response in cancer celllines [33], possibly by affecting estrogen-dependent path-ways [34]. It is evident that more experimentation isrequired involving the measurements of exposure-affected proteins and genes and their activation state incellular models and their relation to the chemical signa-tures.
An overlap of activity of the same genes induced by dif-ferent chemicals would suggest a common physiologicalaction by these chemicals. For example, the ESR2 andMAPK1 genes in the prostate cancer prediction, and theIL6 and CEBPD in the breast cancer predictions, wereassociated with several chemicals for each of the diseases.We also found an overlap between chemicals amongst
Table 4: Prediction of environmental chemicals associated with breast cancer samples (GSE6883).
Chemical Predicted
Hypergeometric P-value
Rank (percentile) q-value Relevant genes in set (number of
references)
Citations
Progesterone 2 × 10⁻⁴ 6 (99) 0.01 IL6(3), STC1(3), CEBPD(2)
[64,65]
Genistein 6 × 10⁻⁴ 10 (99) 0.03 CEBPD(1), APLP2(1), MLF1(1)
[66-68]
Estradiol 7 × 10⁻⁴ 11 (99) 0.03 LPL(4), IL6(3), CEBPD(2)
[69-73]
Indomethacin 3 × 10⁻³ 17 (99) 0.05 CCDC50(1), BIRC3(1), DNAJB(1)
[74]
Diethylstilbestrol 3 × 10⁻³ 18 (99) 0.05 IL6(1), MARCKS(1), MXD1(1), MMP7(1)
[75,76]
Cyclophosphamide 4 × 10⁻⁴ 19 (99) 0.06 IL6(3), MARCKS(1), PSMA5(1)
[77-79]
Bisphenol A 6 × 10⁻³ 21 (99) 0.08 CEBPD(1), MLF1(1), DTL(1)
[80]
Shown in the table are a subset of the highly ranked chemicals (p < 0.01) that were predicted to have association with breast cancer gene expression (non-tumorigenic) and had evidence of association with the MeSH term "Breast Neoplasms". Columns have similar definitions as Table 2.

Patel and Butte BMC Medical Genomics 2010, 3:17http://www.biomedcentral.com/1755-8794/3/17
Page 13 of 17
different cancers. This result comes as a result of the cor-relation in the significant pathways shared by these can-cers; however, it may also indicate a need to explore lesssignificant associations in order to find unique and spe-
cific gene expression/chemical exposure relationships fora given disease. Furthermore, this result may also indicatea bias of gene and chemical relationships cataloged in theCTD. For example, it could be that genes specific to com-
Figure 5 Chemical predictions for Prostate, Lung, and Breast Cancer datasets clustered by PubChem BioActivity. Highly significant chemical prediction p-values for the prostate, lung, and breast cancer datasets (p = 0.001, 0.001, 0.01, for the prostate, lung, and breast cancer datasets) are reordered by their BioActivity similarity computed by PubChem. A column represents the cancer analyzed and each cell corresponds to the chemical-gene set association -log10(p-value). Examples of correlation between BioActivity similarity and chemical-gene set significance include the sodium arsenite, sodium arsenate, and Doxorubicin cluster (labeled in orange), the Genistein, Estradiol, Ethinyl Estradiol, and Diethylbisterol and Progesterone, Tretinoin, and Corticosterone clusters (labeled in purple). Other examples of BioActivity similarity and chemical-gene set association include chemicals vinclozolin, tert-Butylhydroperoxide, and Carbon Tetrachloride (outlined in blue).
IndomethacinresveratrolCorticosteroneTretinoinProgesteroneVitamin K 3DisulfiramMifepristoneCalcitriol4-hydroxytamoxifenDiethylstilbestrolEthinyl EstradiolEstradiolGenisteinFenretinidepirinixic acidAm 580pyrazoleCadmium ChloridehydroquinoneFurosemideAcetaminophenVitamin AMethylnitronitrosoguanidineCholecalciferolalachlorindole-3-carbinolFenthionTrichloroethylenenaphthalene3-dinitrobenzenePiperonyl ButoxideAcroleinEthanolmono-(2-ethylhexyl)phthalateDimethylnitrosamineFolic AcidCyclosporineMechlorethamineLindaneIsotretinoinTamoxifenEtoposidebisphenol AMethapyrileneRaloxifene4-(N-methyl-N-nitrosamino)-1-(3-pyridyl)-1-butanonebenzyloxycarbonylleucyl-leucyl-leucine aldehydeCarbon Tetrachloride2-nitrofluorenetert-ButylhydroperoxidevinclozolinalitretinoinMetribolonefulvestrantflavopiridolnickel chloride2-AcetylaminofluoreneAflatoxin B1Hydrogen PeroxideBenzeneThioacetamideTetrachlorodibenzodioxinDoxorubicinsodium arsenatesodium arsenite
0 2 4 6 8
Value
02
04
06
0
Color Key
and Histogram
Co
un
t
prostate cancer
GSE 6919 lung cancer
non-smokers
GSE 10072 breast cancer
non-tumorigenic
GSE 10072
-log10(pvalue)
Bio
Act
ivity
Sim
ilarit
y
Patel and Butte BMC Medical Genomics 2010, 3:17http://www.biomedcentral.com/1755-8794/3/17
Page 14 of 17
mon cancer-related pathways are those that are well stud-ied, such as BCL2 or ESR2.
Related to this, we have attempted to show how biolog-ical activity, as assayed in a high-throughput chemicalscreen in PubChem, can be correlated with chemicalgene-set associations. Observing a correlation in bothPubChem-derived bioactivity in addition to a chemical-gene set association from the CTD provides a way toidentify shared modes of action among groups of similaror related chemicals. This data serves to both provideinternal validation for list of predicted chemicals actingthrough similar pathways (such as those induced byestrogen) but also to prioritize hypotheses. For example,we did not find curated evidence in the CTD for associa-tion of the chemicals vinclozolin, tert-Butylhydroperox-ide, and Carbon Tetrachloride to prostate or lungcancers; however, their similar bioactivity profiles (Figure5, enclosed in blue box) and high chemical-gene set asso-ciation calls for further review.
We do acknowledge some arbitrariness in our choice ofmethods and thresholds; most of these were chosen toshow significance in our methodology without addingcomplexity. We could have chosen any of several alterna-tive approaches to implementing our method; however,predictions made with the Gene Set Enrichment Analysis(GSEA) [35] method during the verification phase werenot as sensitive (not shown). Another limitation in ourfirst implementation is that in calculating the chemicalsignatures associating chemicals with gene sets, weignored the specific degree of expression change (up ordown) encoded in the CTD. We decided not to use thisinformation due to the presence of contradictions (somereferences may point to an increase of exposure-inducedgene expression while another reference might claim theopposite), and other preliminary work suggesting that fil-tering by the degree of change reduced sensitivity (datanot shown). Because of these limitations, direction ofassociation cannot be inferred. Further still, we acknowl-edge richer and more refined chemical signatures alongwith further integration with resources like PubChemwill need to be built to make the most accurate predic-tions.
Another issue with querying the microarray data of anyexperiment is the lack of full sample information to strat-ify results; for example, different exposures may be asso-ciated with a subset of the samples. A related concernincludes small sample sizes of some of the datasets usedto evaluate the method. For example, the best predictivepower was seen the largest dataset (prostate cancer,GSE6919), and the worst with one of the smallest, (breastcancer, GSE6883). Despite this heterogeneity and lack ofpower, we still arrived at noteworthy and literature-backed findings warranting further study. We also urge
that more evaluation must occur with datasets that have alarger number of samples.
Most importantly, we stress that these types of associa-tion remain as predictions and hypotheses that need vali-dation and verification. The method presented here is nota substitute for traditional toxicology or epidemiology.These studies are required to provide quantitative andpopulation generalizable estimates of disease risk anddose-response relationships. However, as the space ofpotential environmental chemicals potentially causingbiological effects is large, we suggest that this methodol-ogy would give investigators at least some clue where tostart the search for environmental causal factors to studyin these other modes. Furthermore, predicting a linkagebetween chemicals, genes, and clinically-relevant diseasephenotypes using existing resources falls in agreementwith the National Academies' vision of high-throughputefforts to decipher genetic pathways to toxicity [36].
ConclusionWe have described a novel and scalable method to associ-ate changes in gene expression with environmental chem-icals. While we successfully validated our methodologyhere and provide hypotheses regarding the potentialassociation of chemicals in cancer development, thesehypotheses would need to be carefully studied in con-trolled cellular experiments. Our method is limited by thelack of direction of association and effect size as typicallyascertained in traditional toxicological and epidemiologi-cal studies; however, the vast number of chemicals thatcan be tested in silico is only limited by the amount ofavailable data. This method is just one of potentiallymany tools that need to be built to predict environmentalassociations between genes and disease.
Additional material
AbbreviationsCTD: Comparative Toxicogenomics Database; GEO: Gene expression omnibus;GAD: Genetic Association Database; GSEA: Gene Set Enrichment Analysis; DNA:deoxyribonucleic acid; MeSH: Medical Subject Headings; mRNA: messengerRNA; TCDD: 2,3,7,8-Tetrachlorodibenzodioxin (TCDD); SAM: Significance Analy-sis of Microarrays; FDR: False Discovery Rate.
Additional file 1 Differential gene expression summary information for the verification and query stage and additional lung and breast cancer queries. Additional file 1 contains information regarding the Signifi-cance Analysis of Microarray (SAM) procedure for the verification and query stage, specifically the types of samples analyzed, the median false discovery rate for the analysis, and the number of differentially expressed genes found. Information for the verification stage is in Supplementary Table S1, for the query stage in Supplementary Table S2. We also conducted addi-tional query predictions on gene expression datasets related to the ones described in the main manuscript, specifically on lung cancer smoker sam-ples and tumorigenic breast cancer cell lines. These data are analogous to the Tables 2, 3, 4 in the main manuscript and are seen in Supplementary Tables S3, S4, and S5. Figures analogous to Figure 4 are also seen in Supple-mentary Figures S1 and S2.

Patel and Butte BMC Medical Genomics 2010, 3:17http://www.biomedcentral.com/1755-8794/3/17
Page 15 of 17
Competing interestsThe authors declare that they have no competing interests.
Authors' contributionsAJB conceived of the study and edited the manuscript. CJP carried out theanalysis and drafted the manuscript. All authors have read and approved thefinal manuscript.
AcknowledgementsCJP was funded by National Library of Medicine (T15 LM 007033). AJB was funded by the Lucile Packard Foundation for Children's Health, the National Library of Medicine (R01 LM009719), the National Institute of General Medical Sciences (R01 GM079719), and the Howard Hughes Medical Institute. We thank Alex Skrenchuk and Boris Oskotsky from Stanford University for computer sup-port and Rong Chen from Stanford University for critical review.
Author Details1Department of Pediatrics, Stanford University School of Medicine, Stanford, CA 94305, USA, 2Center for Biomedical Informatics Research, Department of Medicine, Stanford University School of Medicine, Stanford, CA 94305, USA and 3Lucile Packard Children's Hospital, 725 Welch Road, Palo Alto, CA 94304, USA
References1. Schwartz D, Collins F: Medicine. Environmental biology and human
disease. Science 2007, 316(5825):695-696.2. Davis AP, Murphy CG, Saraceni-Richards CA, Rosenstein MC, Wiegers TC,
Mattingly CJ: Comparative Toxicogenomics Database: a knowledgebase and discovery tool for chemical-gene-disease networks. Nucleic Acids Res 2009:D786-792.
3. Barrett T, Troup DB, Wilhite SE, Ledoux P, Rudnev D, Evangelista C, Kim IF, Soboleva A, Tomashevsky M, Edgar R: NCBI GEO: mining tens of millions of expression profiles--database and tools update. Nucleic Acids Res 2007:D760-765.
4. Andrew AS, Jewell DA, Mason RA, Whitfield ML, Moore JH, Karagas MR: Drinking-water arsenic exposure modulates gene expression in human lymphocytes from a U.S. population. Environ Health Perspect 2008, 116(4):524-531.
5. Malard V, Berenguer F, Prat O, Ruat S, Steinmetz G, Quemeneur E: Global gene expression profiling in human lung cells exposed to cobalt. BMC Genomics 2007, 8:147.
6. Wang W, Li Y, Li Y, Hong A, Wang J, Lin B, Li R: NDRG3 is an androgen regulated and prostate enriched gene that promotes in vitro and in vivo prostate cancer cell growth. Int J Cancer 2009, 124(3):521-530.
7. Gottipolu RR, Wallenborn JG, Karoly ED, Schladweiler MC, Ledbetter AD, Krantz T, Linak WP, Nyska A, Johnson JA, Thomas R, et al.: One-month diesel exhaust inhalation produces hypertensive gene expression pattern in healthy rats. Environ Health Perspect 2009, 117(1):38-46.
8. Lamb J, Crawford ED, Peck D, Modell JW, Blat IC, Wrobel MJ, Lerner J, Brunet JP, Subramanian A, Ross KN, et al.: The Connectivity Map: using gene-expression signatures to connect small molecules, genes, and disease. Science 2006, 313(5795):1929-1935.
9. Bild AH, Yao G, Chang JT, Wang Q, Potti A, Chasse D, Joshi MB, Harpole D, Lancaster JM, Berchuck A, et al.: Oncogenic pathway signatures in human cancers as a guide to targeted therapies. Nature 2006, 439(7074):353-357.
10. Ashburner M, Ball CA, Blake JA, Botstein D, Butler H, Cherry JM, Davis AP, Dolinski K, Dwight SS, Eppig JT, et al.: Gene ontology: tool for the unification of biology. The Gene Ontology Consortium. Nat Genet 2000, 25(1):25-29.
11. Gohlke JM, Thomas R, Zhang Y, Rosenstein MC, Davis AP, Murphy C, Becker KG, Mattingly CJ, Portier CJ: Genetic and environmental pathways to complex diseases. BMC Syst Biol 2009, 3:46.
12. Becker KG, Barnes KC, Bright TJ, Wang SA: The genetic association database. Nat Genet 2004, 36(5):431-432.
13. Mattingly CJ, Rosenstein MC, Davis AP, Colby GT, Forrest JN, Boyer JL: The comparative toxicogenomics database: a cross-species resource for
building chemical-gene interaction networks. Toxicol Sci 2006, 92(2):587-595.
14. Tusher VG, Tibshirani R, Chu G: Significance analysis of microarrays applied to the ionizing radiation response. Proc Natl Acad Sci USA 2001, 98(9):5116-5121.
15. Homologene [http://www.ncbi.nlm.nih.gov/homologene]16. Zeeberg BR, Qin H, Narasimhan S, Sunshine M, Cao H, Kane DW, Reimers
M, Stephens RM, Bryant D, Burt SK, et al.: High-Throughput GoMiner, an 'industrial-strength' integrative gene ontology tool for interpretation of multiple-microarray experiments, with application to studies of Common Variable Immune Deficiency (CVID). BMC Bioinformatics 2005, 6:168.
17. R Core Team: R: A language and enviornment for statistical computing. In 2.8.0 edn Vienna, Austria: R Foundation for Statistical Computing; 2008.
18. Bossé Y, Maghni K, Hudson TJ: 1alpha,25-dihydroxy-vitamin D3 stimulation of bronchial smooth muscle cells induces autocrine, contractility, and remodeling processes. Physiol Genomics 2007, 29(2):161-168.
19. Tijet N, Boutros PC, Moffat ID, Okey AB, Tuomisto J, Pohjanvirta R: Aryl hydrocarbon receptor regulates distinct dioxin-dependent and dioxin-independent gene batteries. Mol Pharmacol 2006, 69(1):140-153.
20. Li Z, Stonehuerner J, Devlin RB, Huang YC: Discrimination of vanadium from zinc using gene profiling in human bronchial epithelial cells. Environ Health Perspect 2005, 113:1747-1754.
21. Selvaraj V, Bunick D, Finnigan-Bunick C, Johnson RW, Wang H, Liu L, Cooke PS: Gene expression profiling of 17beta-estradiol and genistein effects on mouse thymus. Toxicol Sci 2005, 87(1):97-112.
22. Lin CY, Vega VB, Thomsen JS, Zhang T, Kong SL, Xie M, Chiu KP, Lipovich L, Barnett DH, Stossi F, et al.: Whole-genome cartography of estrogen receptor alpha binding sites. PLoS Genet 2007, 3(6):e87.
23. Chandran UR, Ma C, Dhir R, Bisceglia M, Lyons-Weiler M, Liang W, Michalopoulos G, Becich M, Monzon FA: Gene expression profiles of prostate cancer reveal involvement of multiple molecular pathways in the metastatic process. BMC Cancer 2007, 7:64.
24. Yu YP, Landsittel D, Jing L, Nelson J, Ren B, Liu L, McDonald C, Thomas R, Dhir R, Finkelstein S, et al.: Gene expression alterations in prostate cancer predicting tumor aggression and preceding development of malignancy. J Clin Oncol 2004, 22(14):2790-2799.
25. Landi MT, Dracheva T, Rotunno M, Figueroa JD, Liu H, Dasgupta A, Mann FE, Fukuoka J, Hames M, Bergen AW, et al.: Gene expression signature of cigarette smoking and its role in lung adenocarcinoma development and survival. PLoS ONE 2008, 3(2):e1651.
26. Liu R, Wang X, Chen GY, Dalerba P, Gurney A, Hoey T, Sherlock G, Lewicki J, Shedden K, Clarke MF: The prognostic role of a gene signature from tumorigenic breast-cancer cells. N Engl J Med 2007, 356(3):217-226.
27. Wang Y, Xiao J, Suzek TO, Zhang J, Wang J, Bryant SH: PubChem: a public information system for analyzing bioactivities of small molecules. Nucleic Acids Res 2009:W623-633.
28. Wang Y, Bolton E, Dracheva S, Karapetyan K, Shoemaker BA, Suzek TO, Wang J, Xiao J, Zhang J, Bryant SH: An overview of the PubChem BioAssay resource. Nucleic Acids Res 2010:D255-266.
29. Uehara T, Hirode M, Ono A, Kiyosawa N, Omura K, Shimizu T, Mizukawa Y, Miyagishima T, Nagao T, Urushidani T: A toxicogenomics approach for early assessment of potential non-genotoxic hepatocarcinogenicity of chemicals in rats. Toxicology 2008, 250(1):15-26.
30. Benbrahim-Tallaa L, Waterland RA, Styblo M, Achanzar WE, Webber MM, Waalkes MP: Molecular events associated with arsenic-induced malignant transformation of human prostatic epithelial cells: aberrant genomic DNA methylation and K-ras oncogene activation. Toxicol Appl Pharmacol 2005, 206(3):288-298.
31. Zanesi N, Mancini R, Sevignani C, Vecchione A, Kaou M, Valtieri M, Calin GA, Pekarsky Y, Gnarra JR, Croce CM, et al.: Lung cancer susceptibility in Fhit-deficient mice is increased by Vhl haploinsufficiency. Cancer Res 2005, 65(15):6576-6582.
32. Yager JD, Davidson NE: Estrogen carcinogenesis in breast cancer. N Engl J Med 2006, 354(3):270-282.
33. Dairkee SH, Seok J, Champion S, Sayeed A, Mindrinos M, Xiao W, Davis RW, Goodson WH: Bisphenol A induces a profile of tumor aggressiveness in high-risk cells from breast cancer patients. Cancer Res 2008, 68(7):2076-2080.
Received: 23 October 2009 Accepted: 6 May 2010 Published: 6 May 2010This article is available from: http://www.biomedcentral.com/1755-8794/3/17© 2010 Patel and Butte; licensee BioMed Central Ltd. This is an Open Access article distributed under the terms of the Creative Commons Attribution License (http://creativecommons.org/licenses/by/2.0), which permits unrestricted use, distribution, and reproduction in any medium, provided the original work is properly cited.BMC Medical Genomics 2010, 3:17

Patel and Butte BMC Medical Genomics 2010, 3:17http://www.biomedcentral.com/1755-8794/3/17
Page 16 of 17
34. Buteau-Lozano H, Velasco G, Cristofari M, Balaguer P, Perrot-Applanat M: Xenoestrogens modulate vascular endothelial growth factor secretion in breast cancer cells through an estrogen receptor-dependent mechanism. J Endocrinol 2008, 196(2):399-412.
35. Subramanian A, Tamayo P, Mootha VK, Mukherjee S, Ebert BL, Gillette MA, Paulovich A, Pomeroy SL, Golub TR, Lander ES, et al.: Gene set enrichment analysis: a knowledge-based approach for interpreting genome-wide expression profiles. Proc Natl Acad Sci USA 2005, 102(43):15545-15550.
36. Committee on Toxicity Testing and Assessment of Environmental Agents, National Research Council: Toxicity Testing in the 21st Century: A Vision and a Strategy. Washington, D.C.: National Academies Press; 2007.
37. Ho SM, Tang WY, Belmonte de Frausto J, Prins GS: Developmental exposure to estradiol and bisphenol A increases susceptibility to prostate carcinogenesis and epigenetically regulates phosphodiesterase type 4 variant 4. Cancer Res 2006, 66(11):5624-5632.
38. Shazer RL, Jain A, Galkin AV, Cinman N, Nguyen KN, Natale RB, Gross M, Green L, Bender LI, Holden S, et al.: Raloxifene, an oestrogen-receptor-beta-targeted therapy, inhibits androgen-independent prostate cancer growth: results from preclinical studies and a pilot phase II clinical trial. BJU Int 2006, 97(4):691-697.
39. Bertilaccio MT, Grioni M, Sutherland BW, Degl'Innocenti E, Freschi M, Jachetti E, Greenberg NM, Corti A, Bellone M: Vasculature-targeted tumor necrosis factor-alpha increases the therapeutic index of doxorubicin against prostate cancer. Prostate 2008, 68(10):1105-1115.
40. Borden LS Jr, Clark PE, Lovato J, Hall MC, Stindt D, Harmon M, R MM, Torti FM: Vinorelbine, doxorubicin, and prednisone in androgen-independent prostate cancer. Cancer 2006, 107(5):1093-1100.
41. Amato RJ, Sarao H: A phase I study of paclitaxel/doxorubicin/thalidomide in patients with androgen- independent prostate cancer. Clin Genitourin Cancer 2006, 4(4):281-286.
42. Kang J, Bu J, Hao Y, Chen F: Subtoxic concentration of doxorubicin enhances TRAIL-induced apoptosis in human prostate cancer cell line LNCaP. Prostate Cancer Prostatic Dis 2005, 8(3):274-279.
43. Benbrahim-Tallaa L, Liu J, Webber MM, Waalkes MP: Estrogen signaling and disruption of androgen metabolism in acquired androgen-independence during cadmium carcinogenesis in human prostate epithelial cells. Prostate 2007, 67(2):135-145.
44. Raschke M, Wahala K, Pool-Zobel BL: Reduced isoflavone metabolites formed by the human gut microflora suppress growth but do not affect DNA integrity of human prostate cancer cells. Br J Nutr 2006, 96(3):426-434.
45. Takahashi Y, Lavigne JA, Hursting SD, Chandramouli GV, Perkins SN, Barrett JC, Wang TT: Using DNA microarray analyses to elucidate the effects of genistein in androgen-responsive prostate cancer cells: identification of novel targets. Mol Carcinog 2004, 41(2):108-119.
46. Li Y, Che M, Bhagat S, Ellis KL, Kucuk O, Doerge DR, Abrams J, Cher ML, Sarkar FH: Regulation of gene expression and inhibition of experimental prostate cancer bone metastasis by dietary genistein. Neoplasia 2004, 6(4):354-363.
47. Koike H, Ito K, Takezawa Y, Oyama T, Yamanaka H, Suzuki K: Insulin-like growth factor binding protein-6 inhibits prostate cancer cell proliferation: implication for anticancer effect of diethylstilbestrol in hormone refractory prostate cancer. Br J Cancer 2005, 92(8):1538-1544.
48. Oh WK: The evolving role of estrogen therapy in prostate cancer. Clin Prostate Cancer 2002, 1(2):81-89.
49. Tokar EJ, Ancrile BB, Ablin RJ, Webber MM: Cholecalciferol (vitamin D3) and the retinoid N-(4-hydroxyphenyl)retinamide (4-HPR) are synergistic for chemoprevention of prostate cancer. J Exp Ther Oncol 2006, 5(4):323-333.
50. Costello LC, Franklin RB: The clinical relevance of the metabolism of prostate cancer; zinc and tumor suppression: connecting the dots. Mol Cancer 2006, 5:17.
51. Uzzo RG, Crispen PL, Golovine K, Makhov P, Horwitz EM, Kolenko VM: Diverse effects of zinc on NF-kappaB and AP-1 transcription factors: implications for prostate cancer progression. Carcinogenesis 2006, 27(10):1980-1990.
52. Michael IP, Pampalakis G, Mikolajczyk SD, Malm J, Sotiropoulou G, Diamandis EP: Human tissue kallikrein 5 is a member of a proteolytic cascade pathway involved in seminal clot liquefaction and potentially in prostate cancer progression. J Biol Chem 2006, 281(18):12743-12750.
53. Uzzo RG, Leavis P, Hatch W, Gabai VL, Dulin N, Zvartau N, Kolenko VM: Zinc inhibits nuclear factor-kappa B activation and sensitizes prostate cancer cells to cytotoxic agents. Clin Cancer Res 2002, 8(11):3579-3583.
54. Filyak Y, Filyak O, Stoika R: Transforming growth factor beta-1 enhances cytotoxic effect of doxorubicin in human lung adenocarcinoma cells of A549 line. Cell Biol Int 2007, 31(8):851-855.
55. Shen J, Liu J, Xie Y, Diwan BA, Waalkes MP: Fetal onset of aberrant gene expression relevant to pulmonary carcinogenesis in lung adenocarcinoma development induced by in utero arsenic exposure. Toxicol Sci 2007, 95(2):313-320.
56. Waalkes MP, Liu J, Ward JM, Diwan BA: Enhanced urinary bladder and liver carcinogenesis in male CD1 mice exposed to transplacental inorganic arsenic and postnatal diethylstilbestrol or tamoxifen. Toxicol Appl Pharmacol 2006, 215(3):295-305.
57. Waalkes MP, Liu J, Ward JM, Diwan BA: Animal models for arsenic carcinogenesis: inorganic arsenic is a transplacental carcinogen in mice. Toxicol Appl Pharmacol 2004, 198(3):377-384.
58. Devereux TR, Holliday W, Anna C, Ress N, Roycroft J, Sills RC: Map kinase activation correlates with K-ras mutation and loss of heterozygosity on chromosome 6 in alveolar bronchiolar carcinomas from B6C3F1 mice exposed to vanadium pentoxide for 2 years. Carcinogenesis 2002, 23(10):1737-1743.
59. Diament MJ, Peluffo GD, Stillitani I, Cerchietti LC, Navigante A, Ranuncolo SM, Klein SM: Inhibition of tumor progression and paraneoplastic syndrome development in a murine lung adenocarcinoma by medroxyprogesterone acetate and indomethacin. Cancer Invest 2006, 24(2):126-131.
60. Moody TW, Leyton J, Zakowicz H, Hida T, Kang Y, Jakowlew S, You L, Ozbun L, Zia H, Youngberg J, et al.: Indomethacin reduces lung adenoma number in A/J mice. Anticancer Res 2001, 21(3B):1749-1755.
61. Levin G, Kariv N, Khomiak E, Raz A: Indomethacin inhibits the accumulation of tumor cells in mouse lungs and subsequent growth of lung metastases. Chemotherapy 2000, 46(6):429-437.
62. Meira LB, Reis AM, Cheo DL, Nahari D, Burns DK, Friedberg EC: Cancer predisposition in mutant mice defective in multiple genetic pathways: uncovering important genetic interactions. Mutat Res 2001, 477(1-2):51-58.
63. Fan JG, Wang QE, Liu SJ: Chrysotile-induced cell transformation and transcriptional changes of c-myc oncogene in human embryo lung cells. Biomed Environ Sci 2000, 13(3):163-169.
64. Carvajal A, Espinoza N, Kato S, Pinto M, Sadarangani A, Monso C, Aranda E, Villalon M, Richer JK, Horwitz KB, et al.: Progesterone pre-treatment potentiates EGF pathway signaling in the breast cancer cell line ZR-75. Breast Cancer Res Treat 2005, 94(2):171-183.
65. Kato S, Pinto M, Carvajal A, Espinoza N, Monso C, Sadarangani A, Villalon M, Brosens JJ, White JO, Richer JK, et al.: Progesterone increases tissue factor gene expression, procoagulant activity, and invasion in the breast cancer cell line ZR-75-1. J Clin Endocrinol Metab 2005, 90(2):1181-1188.
66. Verheus M, van Gils CH, Keinan-Boker L, Grace PB, Bingham SA, Peeters PH: Plasma phytoestrogens and subsequent breast cancer risk. J Clin Oncol 2007, 25(6):648-655.
67. Nobert GS, Kraak MM, Crawford S: Estrogen dependent growth inhibitory effects of tamoxifen but not genistein in solid tumors derived from estrogen receptor positive (ER+) primary breast carcinoma MCF7: single agent and novel combined treatment approaches. Bull Cancer 2006, 93(7):E59-66.
68. Seo HS, DeNardo DG, Jacquot Y, Laios I, Vidal DS, Zambrana CR, Leclercq G, Brown PH: Stimulatory effect of genistein and apigenin on the growth of breast cancer cells correlates with their ability to activate ER alpha. Breast Cancer Res Treat 2006, 99(2):121-134.
69. Lakshmanaswamy R, Guzman RC, Nandi S: Hormonal prevention of breast cancer: significance of promotional environment. Adv Exp Med Biol 2008, 617:469-475.
70. Bergman Jungestrom M, Thompson LU, Dabrosin C: Flaxseed and its lignans inhibit estradiol-induced growth, angiogenesis, and secretion of vascular endothelial growth factor in human breast cancer xenografts in vivo. Clin Cancer Res 2007, 13(3):1061-1067.
71. Vogel VG: Recent results from clinical trials using SERMs to reduce the risk of breast cancer. Ann N Y Acad Sci 2006, 1089:127-142.

Patel and Butte BMC Medical Genomics 2010, 3:17http://www.biomedcentral.com/1755-8794/3/17
Page 17 of 17
72. Eliassen AH, Missmer SA, Tworoger SS, Spiegelman D, Barbieri RL, Dowsett M, Hankinson SE: Endogenous steroid hormone concentrations and risk of breast cancer among premenopausal women. J Natl Cancer Inst 2006, 98(19):1406-1415.
73. Russo J, Hasan Lareef M, Balogh G, Guo S, Russo IH: Estrogen and its metabolites are carcinogenic agents in human breast epithelial cells. J Steroid Biochem Mol Biol 2003, 87(1):1-25.
74. Ackerstaff E, Gimi B, Artemov D, Bhujwalla ZM: Anti-inflammatory agent indomethacin reduces invasion and alters metabolism in a human breast cancer cell line. Neoplasia 2007, 9(3):222-235.
75. Green M, Newell O, Aboyade-Cole A, Darling-Reed S, Thomas RD: Diallyl sulfide induces the expression of estrogen metabolizing genes in the presence and/or absence of diethylstilbestrol in the breast of female ACI rats. Toxicol Lett 2007, 168(1):7-12.
76. Walter G, Liebl R, von Angerer E: Synthesis and biological evaluation of stilbene-based pure estrogen antagonists. Bioorg Med Chem Lett 2004, 14(18):4659-4663.
77. Vegran F, Boidot R, Oudin C, Riedinger JM, Bonnetain F, Lizard-Nacol S: Overexpression of caspase-3s splice variant in locally advanced breast carcinoma is associated with poor response to neoadjuvant chemotherapy. Clin Cancer Res 2006, 12(19):5794-5800.
78. Untch M, Eidtmann H, du Bois A, Meerpohl HG, Thomssen C, Ebert A, Harbeck N, Jackisch C, Heilman V, Emons G, et al.: Cardiac safety of trastuzumab in combination with epirubicin and cyclophosphamide in women with metastatic breast cancer: results of a phase I trial. Eur J Cancer 2004, 40(7):988-997.
79. Machiels JP, Reilly RT, Emens LA, Ercolini AM, Lei RY, Weintraub D, Okoye FI, Jaffee EM: Cyclophosphamide, doxorubicin, and paclitaxel enhance the antitumor immune response of granulocyte/macrophage-colony stimulating factor-secreting whole-cell vaccines in HER-2/neu tolerized mice. Cancer Res 2001, 61(9):3689-3697.
80. Murray TJ, Maffini MV, Ucci AA, Sonnenschein C, Soto AM: Induction of mammary gland ductal hyperplasias and carcinoma in situ following fetal bisphenol A exposure. Reprod Toxicol 2007, 23(3):383-390.
Pre-publication historyThe pre-publication history for this paper can be accessed here:http://www.biomedcentral.com/1755-8794/3/17/prepub
doi: 10.1186/1755-8794-3-17Cite this article as: Patel and Butte, Predicting environmental chemical fac-tors associated with disease-related gene expression data BMC Medical Genomics 2010, 3:17