
Predicting cancer outcomes from histology and … cancer outcomes from histology and genomics using...
10
Predicting cancer outcomes from histology and genomics using convolutional networks Pooya Mobadersany a , Safoora Yousefi a , Mohamed Amgad a , David A. Gutman b , Jill S. Barnholtz-Sloan c , José E. Velázquez Vega d , Daniel J. Brat e , and Lee A. D. Cooper a,f,g,1 a Department of Biomedical Informatics, Emory University School of Medicine, Atlanta, GA 30322; b Department of Neurology, Emory University School of Medicine, Atlanta, GA 30322; c Case Comprehensive Cancer Center, Case Western Reserve University School of Medicine, Cleveland, OH 44106; d Department of Pathology and Laboratory Medicine, Emory University School of Medicine, Atlanta, GA 30322; e Department of Pathology, Northwestern University Feinberg School of Medicine, Chicago, IL 60611; f Winship Cancer Institute, Emory University, Atlanta, GA 30322; and g Department of Biomedical Engineering, Emory University and Georgia Institute of Technology, Atlanta, GA 30322 Edited by Bert Vogelstein, Johns Hopkins University, Baltimore, MD, and approved February 13, 2018 (received for review October 4, 2017) Cancer histology reflects underlying molecular processes and disease progression and contains rich phenotypic information that is predictive of patient outcomes. In this study, we show a computational approach for learning patient outcomes from digital pathology images using deep learning to combine the power of adaptive machine learning algorithms with traditional survival models. We illustrate how these survival convolutional neural networks (SCNNs) can integrate infor- mation from both histology images and genomic biomarkers into a single unified framework to predict time-to-event outcomes and show prediction accuracy that surpasses the current clinical paradigm for predicting the overall survival of patients diagnosed with glioma. We use statistical sampling techniques to address challenges in learning survival from histology images, including tumor heterogeneity and the need for large training cohorts. We also provide insights into the prediction mechanisms of SCNNs, using heat map visualization to show that SCNNs recognize important structures, like microvascu- lar proliferation, that are related to prognosis and that are used by pathologists in grading. These results highlight the emerging role of deep learning in precision medicine and suggest an expanding utility for computational analysis of histology in the future practice of pathology. artificial intelligence | machine learning | digital pathology | deep learning | cancer H istology has been an important tool in cancer diagnosis and prognostication for more than a century. Anatomic pathol- ogists evaluate histology for characteristics, like nuclear atypia, mitotic activity, cellular density, and tissue architecture, in- corporating cytologic details and higher-order patterns to classify and grade lesions. Although prognostication increasingly relies on genomic biomarkers that measure genetic alterations, gene expression, and epigenetic modifications, histology remains an important tool in predicting the future course of a patient’s disease. The phenotypic information present in histology reflects the aggregate effect of molecular alterations on cancer cell be- havior and provides a convenient visual readout of disease ag- gressiveness. However, human assessments of histology are highly subjective and are not repeatable; hence, computational analysis of histology imaging has received significant attention. Aided by advances in slide scanning microscopes and computing, a number of image analysis algorithms have been developed for grading (1–4), classification (5–10), and identification of lymph node metastases (11) in multiple cancer types. Deep convolutional neural networks (CNNs) have emerged as an important image analysis tool and have shattered perfor- mance benchmarks in many challenging applications (12). The ability of CNNs to learn predictive features from raw image data is a paradigm shift that presents exciting opportunities in medical imaging (13–15). Medical image analysis applications have heavily relied on feature engineering approaches, where algorithm pipelines are used to explicitly delineate structures of interest using segmentation algorithms to measure predefined features of these structures that are believed to be predictive and to use these features to train models that predict patient outcomes. In contrast, the feature learning paradigm of CNNs adaptively learns to transform images into highly predictive features for a specific learning objective. The images and patient labels are presented to a network composed of interconnected layers of convolutional filters that highlight important patterns in the images, and the filters and other parameters of this network are mathematically adapted to minimize prediction error. Feature learning avoids biased a priori definition of features and does not require the use of segmentation algorithms that are often con- founded by artifacts and natural variations in image color and intensity. While feature learning has become the dominant paradigm in general image analysis tasks, medical applications pose unique challenges. Large amounts of labeled data are needed to train CNNs, and medical applications often suffer from data deficits that limit performance. As “black box” mod- els, CNNs are also difficult to deconstruct, and therefore, their prediction mechanisms are difficult to interpret. Despite these Significance Predicting the expected outcome of patients diagnosed with cancer is a critical step in treatment. Advances in genomic and imaging technologies provide physicians with vast amounts of data, yet prognostication remains largely subjective, leading to suboptimal clinical management. We developed a computa- tional approach based on deep learning to predict the overall survival of patients diagnosed with brain tumors from micro- scopic images of tissue biopsies and genomic biomarkers. This method uses adaptive feedback to simultaneously learn the visual patterns and molecular biomarkers associated with pa- tient outcomes. Our approach surpasses the prognostic accu- racy of human experts using the current clinical standard for classifying brain tumors and presents an innovative approach for objective, accurate, and integrated prediction of patient outcomes. Author contributions: P.M., S.Y., M.A., D.A.G., D.J.B., and L.A.D.C. designed research; P.M., S.Y., J.E.V.V., and L.A.D.C. performed research; P.M., J.S.B.-S., and L.A.D.C. analyzed data; and P.M., M.A., D.A.G., J.S.B.-S., J.E.V.V., D.J.B., and L.A.D.C. wrote the paper. Conflict of interest statement: L.A.D.C. leads a research project that is financially sup- ported by Ventana Medical Systems, Inc. While this project is not directly related to the manuscript, it is in the general area of digital pathology. This article is a PNAS Direct Submission. This open access article is distributed under Creative Commons Attribution-NonCommercial- NoDerivatives License 4.0 (CC BY-NC-ND). Data deposition: Software and other resources related to this paper have been deposited at GitHub, https://github.com/CancerDataScience/SCNN. 1 To whom correspondence should be addressed. Email: [email protected]. This article contains supporting information online at www.pnas.org/lookup/suppl/doi:10. 1073/pnas.1717139115/-/DCSupplemental. Published online March 12, 2018. E2970–E2979 | PNAS | vol. 115 | no. 13 www.pnas.org/cgi/doi/10.1073/pnas.1717139115
Transcript of Predicting cancer outcomes from histology and … cancer outcomes from histology and genomics using...
Predicting cancer outcomes from histology andgenomics using convolutional networksPooya Mobadersanya, Safoora Yousefia, Mohamed Amgada, David A. Gutmanb, Jill S. Barnholtz-Sloanc,José E. Velázquez Vegad, Daniel J. Brate, and Lee A. D. Coopera,f,g,1
aDepartment of Biomedical Informatics, Emory University School of Medicine, Atlanta, GA 30322; bDepartment of Neurology, Emory University School ofMedicine, Atlanta, GA 30322; cCase Comprehensive Cancer Center, Case Western Reserve University School of Medicine, Cleveland, OH 44106; dDepartmentof Pathology and Laboratory Medicine, Emory University School of Medicine, Atlanta, GA 30322; eDepartment of Pathology, Northwestern UniversityFeinberg School of Medicine, Chicago, IL 60611; fWinship Cancer Institute, Emory University, Atlanta, GA 30322; and gDepartment of BiomedicalEngineering, Emory University and Georgia Institute of Technology, Atlanta, GA 30322
Edited by Bert Vogelstein, Johns Hopkins University, Baltimore, MD, and approved February 13, 2018 (received for review October 4, 2017)
Cancer histology reflects underlying molecular processes and diseaseprogression and contains rich phenotypic information that is predictiveof patient outcomes. In this study, we show a computational approachfor learning patient outcomes from digital pathology images usingdeep learning to combine the power of adaptive machine learningalgorithms with traditional survival models. We illustrate how thesesurvival convolutional neural networks (SCNNs) can integrate infor-mation from both histology images and genomic biomarkers into asingle unified framework to predict time-to-event outcomes and showprediction accuracy that surpasses the current clinical paradigm forpredicting the overall survival of patients diagnosed with glioma. Weuse statistical sampling techniques to address challenges in learningsurvival from histology images, including tumor heterogeneity andthe need for large training cohorts. We also provide insights into theprediction mechanisms of SCNNs, using heat map visualization toshow that SCNNs recognize important structures, like microvascu-lar proliferation, that are related to prognosis and that are used bypathologists in grading. These results highlight the emerging roleof deep learning in precision medicine and suggest an expandingutility for computational analysis of histology in the future practiceof pathology.
artificial intelligence | machine learning | digital pathology |deep learning | cancer
Histology has been an important tool in cancer diagnosis andprognostication for more than a century. Anatomic pathol-
ogists evaluate histology for characteristics, like nuclear atypia,mitotic activity, cellular density, and tissue architecture, in-corporating cytologic details and higher-order patterns to classifyand grade lesions. Although prognostication increasingly relieson genomic biomarkers that measure genetic alterations, geneexpression, and epigenetic modifications, histology remains animportant tool in predicting the future course of a patient’sdisease. The phenotypic information present in histology reflectsthe aggregate effect of molecular alterations on cancer cell be-havior and provides a convenient visual readout of disease ag-gressiveness. However, human assessments of histology arehighly subjective and are not repeatable; hence, computationalanalysis of histology imaging has received significant attention.Aided by advances in slide scanning microscopes and computing,a number of image analysis algorithms have been developed forgrading (1–4), classification (5–10), and identification of lymphnode metastases (11) in multiple cancer types.Deep convolutional neural networks (CNNs) have emerged as
an important image analysis tool and have shattered perfor-mance benchmarks in many challenging applications (12). Theability of CNNs to learn predictive features from raw image datais a paradigm shift that presents exciting opportunities in medicalimaging (13–15). Medical image analysis applications haveheavily relied on feature engineering approaches, where algorithmpipelines are used to explicitly delineate structures of interestusing segmentation algorithms to measure predefined features of
these structures that are believed to be predictive and to usethese features to train models that predict patient outcomes. Incontrast, the feature learning paradigm of CNNs adaptivelylearns to transform images into highly predictive features for aspecific learning objective. The images and patient labels arepresented to a network composed of interconnected layers ofconvolutional filters that highlight important patterns in theimages, and the filters and other parameters of this network aremathematically adapted to minimize prediction error. Featurelearning avoids biased a priori definition of features and does notrequire the use of segmentation algorithms that are often con-founded by artifacts and natural variations in image color andintensity. While feature learning has become the dominantparadigm in general image analysis tasks, medical applicationspose unique challenges. Large amounts of labeled data areneeded to train CNNs, and medical applications often sufferfrom data deficits that limit performance. As “black box” mod-els, CNNs are also difficult to deconstruct, and therefore, theirprediction mechanisms are difficult to interpret. Despite these
Significance
Predicting the expected outcome of patients diagnosed withcancer is a critical step in treatment. Advances in genomic andimaging technologies provide physicians with vast amounts ofdata, yet prognostication remains largely subjective, leading tosuboptimal clinical management. We developed a computa-tional approach based on deep learning to predict the overallsurvival of patients diagnosed with brain tumors from micro-scopic images of tissue biopsies and genomic biomarkers. Thismethod uses adaptive feedback to simultaneously learn thevisual patterns and molecular biomarkers associated with pa-tient outcomes. Our approach surpasses the prognostic accu-racy of human experts using the current clinical standard forclassifying brain tumors and presents an innovative approachfor objective, accurate, and integrated prediction ofpatient outcomes.
Author contributions: P.M., S.Y., M.A., D.A.G., D.J.B., and L.A.D.C. designed research; P.M.,S.Y., J.E.V.V., and L.A.D.C. performed research; P.M., J.S.B.-S., and L.A.D.C. analyzed data;and P.M., M.A., D.A.G., J.S.B.-S., J.E.V.V., D.J.B., and L.A.D.C. wrote the paper.
Conflict of interest statement: L.A.D.C. leads a research project that is financially sup-ported by Ventana Medical Systems, Inc. While this project is not directly related to themanuscript, it is in the general area of digital pathology.
This article is a PNAS Direct Submission.
This open access article is distributed under Creative Commons Attribution-NonCommercial-NoDerivatives License 4.0 (CC BY-NC-ND).
Data deposition: Software and other resources related to this paper have been depositedat GitHub, https://github.com/CancerDataScience/SCNN.1To whom correspondence should be addressed. Email: [email protected].
This article contains supporting information online at www.pnas.org/lookup/suppl/doi:10.1073/pnas.1717139115/-/DCSupplemental.
Published online March 12, 2018.
E2970–E2979 | PNAS | vol. 115 | no. 13 www.pnas.org/cgi/doi/10.1073/pnas.1717139115
challenges, CNNs have been successfully used extensively formedical image analysis (9, 11, 16–26).Many important problems in the clinical management of
cancer involve time-to-event prediction, including accurate pre-diction of overall survival and time to progression. Despiteoverwhelming success in other applications, deep learning hasnot been widely applied to these problems. Survival analysis hasoften been approached as a binary classification problem bypredicting dichotomized outcomes at a specific time point (e.g.,5-y survival) (27). The classification approach has importantlimitations, as subjects with incomplete follow-up cannot be usedin training, and binary classifiers do not model the probability ofsurvival at other times. Time-to-event models, like Cox re-gression, can utilize all subjects in training and model theirsurvival probabilities for a range of times with a single model.Neural network-based Cox regression approaches were exploredin early machine learning work using datasets containing tens offeatures, but subsequent analysis found no improvement overbasic linear Cox regression (28). More advanced “deep” neuralnetworks that are composed of many layers were recentlyadapted to optimize Cox proportional hazard likelihood andwere shown to have equal or superior performance in predictingsurvival using genomic profiles containing hundreds to tens ofthousands of features (29, 30) and using basic clinical profilescontaining 14 features (31).Learning survival from histology is considerably more difficult,
and a similar approach that combined Cox regression with CNNsto predict survival from lung cancer histology achieved onlymarginally better than random accuracy (0.629 c index) (32).Time-to-event prediction faces many of the same challenges asother applications where CNNs are used to analyze histology.Compared with genomic or clinical datasets, where features haveintrinsic meaning, a “feature” in an image is a pixel with meaningthat depends entirely on context. Convolution operations canlearn these contexts, but the resulting networks are complex,often containing more than 100 million free parameters, andthus, large cohorts are needed for training. This problem is in-tensified in time-to-event prediction, as clinical follow-up is oftendifficult to obtain for large cohorts. Data augmentation tech-niques have been adopted to address this problem, where ran-domized rotations and transformations of contrast andbrightness are used to synthesize additional training data (9, 11,14, 15, 17, 19, 25, 26, 33). Intratumoral heterogeneity also pre-sents a significant challenge in time-to-event prediction, as atissue biopsy often contains a range of histologic patterns thatcorrespond to varying degrees of disease progression or aggres-siveness. The method for integrating information from hetero-geneous regions within a sample is an important consideration inpredicting outcomes. Furthermore, risk is often reflected insubtle changes in multiple histologic criteria that can requireyears of specialized training for human pathologists to recognizeand interpret. Developing an algorithm that can learn the con-tinuum of risks associated with histology can be more challengingthan for other learning tasks, like cell or region classification.In this paper, we present an approach called survival con-
volutional neural networks (SCNNs), which provide highly ac-curate prediction of time-to-event outcomes from histologyimages. Using diffuse gliomas as a driving application, we showhow the predictive accuracy of SCNNs is comparable withmanual histologic grading by neuropathologists. We further ex-tended this approach to integrate both histology images andgenomic biomarkers into a unified prediction framework thatsurpasses the prognostic accuracy of the current WHO paradigmbased on genomic classification and histologic grading. OurSCNN framework uses an image sampling and risk filteringtechnique that significantly improves prediction accuracy bymitigating the effects of intratumoral heterogeneity and deficitsin the availability of labeled data for training. Finally, we use
heat map visualization techniques applied to whole-slide imagesto show how SCNNs learn to recognize important histologicstructures that neuropathologists use in grading diffuse gliomasand suggest relevance for patterns with prognostic significancethat is not currently appreciated. We systematically validate ourapproaches by predicting overall survival in gliomas using datafrom The Cancer Genome Atlas (TCGA) Lower-Grade Glioma(LGG) and Glioblastoma (GBM) projects.
ResultsLearning Patient Outcomes with Deep Survival Convolutional NeuralNetworks. The SCNN model architecture is depicted in Fig. 1(Fig. S1 shows a detailed diagram). H&E-stained tissue sections arefirst digitized to whole-slide images. These images are reviewedusing a web-based platform to identify regions of interest (ROIs)that contain viable tumor with representative histologic character-istics and that are free of artifacts (Methods) (34, 35). High-powerfields (HPFs) from these ROIs are then used to train a deep con-volutional network that is seamlessly integrated with a Cox pro-portional hazards model to predict patient outcomes. The networkis composed of interconnected layers of image processing opera-tions and nonlinear functions that sequentially transform the HPFimage into highly predictive prognostic features. Convolutionallayers first extract visual features from the HPF at multiple scalesusing convolutional kernels and pooling operations. These image-derived features feed into fully connected layers that perform ad-ditional transformations, and then, a final Cox model layer outputsa prediction of patient risk. The interconnection weights and con-volutional kernels are trained by comparing risk predicted by thenetwork with survival or other time-to-event outcomes using abackpropagation technique to optimize the statistical likelihood ofthe network (Methods).To improve the performance of SCNN models, we developed
a sampling and risk filtering technique to address intratumoralheterogeneity and the limited availability of training samples(Fig. 2). In training, new HPFs are randomly sampled from eachROI at the start of each training iteration, providing the SCNNmodel with a fresh look at each patient’s histology and capturingheterogeneity within the ROI. Each HPF is processed usingstandard data augmentation techniques that randomly trans-form the field to reinforce network robustness to tissue orien-tation and variations in staining (33). The SCNN is trainedusing multiple transformed HPFs for each patient (one for eachROI) to further account for intratumoral heterogeneity acrossROIs. For prospective prediction, we first sample multipleHPFs within each ROI to generate a representative collectionof fields for the patient. The median risk is calculated withineach ROI, and then, these median risks are sorted and filteredto predict a robust patient-level risk that reflects the aggres-siveness of their disease while rejecting any outlying risk pre-dictions. These sampling and filtering procedures are describedin detail in Methods.
Assessing the Prognostic Accuracy of SCNN. To assess the prognosticaccuracy of SCNN, we assembled whole-slide image tissue sectionsfrom formalin-fixed, paraffin-embedded specimens and clinicalfollow-up for 769 gliomas from the TCGA (Dataset S1). Thisdataset comprises lower-grade gliomas (WHO grades II and III)and glioblastomas (WHO grade IV), contains both astrocytomasand oligodendrogliomas, and has overall survivals ranging fromless than 1 to 14 y or more. A summary of demographics, grades,survival, and molecular subtypes for this cohort is presented inTable S1. The Digital Slide Archive was used to identify ROIs in1,061 H&E-stained whole-slide images from these tumors.The prognostic accuracy of SCNN models was assessed using
Monte Carlo cross-validation. We randomly split our cohort intopaired training (80%) and testing (20%) sets to generate15 training/testing set pairs. We trained an SCNN model using
Mobadersany et al. PNAS | vol. 115 | no. 13 | E2971
MED
ICALSC
IENCE
SBIOPH
YSICSAND
COMPU
TATIONALBIOLO
GY
PNASPL
US

each training set and then, evaluated the prognostic accuracy ofthese models on the paired testing sets, generating a total of15 accuracy measurements (Methods and Dataset S1). Accuracy wasmeasured using Harrell’s c index, a nonparametric statistic thatmeasures concordance between predicted risks and actual sur-vival (36). A c index of 1 indicates perfect concordance between
predicted risk and overall survival, and a c index of 0.5 correspondsto random concordance.For comparison, we also assessed the prognostic accuracy of
baseline linear Cox models generated using the genomic bio-markers and manual histologic grades from the WHO classifi-cation of gliomas (Fig. 3A). The WHO assigns the diffuse gliomas
B Region of interest selection
C
......
...... ... ......
-
Out
put
High power field(20X objective)
Convolutional layers Fully connected layersCox model
Patientsurvival
Convolution Pooling Rectifier
Prediction error (negative log-likelihood)
Survival Convolutional Neural Network (SCNN)
Whole-slide imagingA
Resection / biopsy
80K
+ p
ixel
s
Whole-slide imageWeb viewer Regions of interest
Input
Fig. 1. The SCNN model. The SCNN combines deep learning CNNs with traditional survival models to learn survival-related patterns from histology images.(A) Large whole-slide images are generated by digitizing H&E-stained glass slides. (B) A web-based viewer is used to manually identify representative ROIs inthe image. (C) HPFs are sampled from these regions and used to train a neural network to predict patient survival. The SCNN consists of (i) convolutionallayers that learn visual patterns related to survival using convolution and pooling operations, (ii) fully connected layers that provide additional nonlineartransformations of extracted image features, and (iii) a Cox proportional hazards layer that models time-to-event data, like overall survival or time toprogression. Predictions are compared with patient outcomes to adaptively train the network weights that interconnect the layers.
A SCNN model training
B SCNN prediction
1. Sample HPFs for test patient
Outcome? Testing slides and regions
2. Calculate median risks in each region 3. Calculate patient risk
Sortedmedian risks
...
R2
R4
decrea sing riskR3
R1
Sampled fields(one region)
... ...
Medianrisk
R1R1,3
R1,1
R1,2
R1,4...
Predicted risks(one region)
1. Sample HPFs for training patient
Training slides and regions of interestOutcome:1077 days,deceased
2. Model training
1077 days,deceased
-
BackpropagationSampled HPFs Randomized
transformations
Orie
ntat
ion,
cont
r ast
,brig
htn e
ss
SurvivalCNN
TrainedSurvivalCNN
Fig. 2. SCNN uses image sampling and filtering to improve the robustness of training and prediction. (A) During training, a single 256 × 256-pixel HPF issampled from each region, producing multiple HPFs per patient. Each HPF is subjected to a series of random transformations and is then used as an in-dependent sample to update the network weights. New HPFs are sampled at each training epoch (one training pass through all patients). (B) When predictingthe outcome of a newly diagnosed patient, nine HPFs are sampled from each ROI, and a risk is predicted for each field. The median HPF risk is calculated ineach region, these median risks are then sorted, and the second highest value is selected as the patient risk. This sampling and filtering framework wasdesigned to deal with tissue heterogeneity by emulating manual histologic evaluation, where prognostication is typically based on the most malignant regionobserved within a heterogeneous sample. Predictions based on the highest risk and the second highest risk had equal performance on average in our ex-periments, but the maximum risk produced some outliers with poor prediction accuracy.
E2972 | www.pnas.org/cgi/doi/10.1073/pnas.1717139115 Mobadersany et al.

to three genomic subtypes defined by mutations in the isocitratedehydrogenase (IDH) genes (IDH1/IDH2) and codeletion of
chromosomes 1p and 19q. Within these molecular subtypes, gliomasare further assigned a histologic grade based on criteria that vary
Comparing histologic grade and SCNN-based risk categoriesD
C SCNN predictions by molecular subtype, histologic grade
A Genomic and histologic classification of gliomas Histologic characteristics
Microvascularproliferation
NecrosisPleomorphism
Histologic grade
0
II III VI
SC
NN
ris
k (z
-sco
red)
II IIIVIII III
IDH-wtastrocytoma
IDH-mutantastrocytoma
Oligodendro-glioma
1
2
-1
-2
-3
p=6.56e-20
Oligodendroglioma
Astrocytoma Mitoses
B SCNN prediction accuracy
Con
cord
ance
inde
x
0.5
0.6
0.7
0.8
0.9
Sub
type
+ g
rade
SC
NN
SC
NN
w/o
resa
mpl
ing
Sub
type
Gra
de
p=0.307
p=6.55e-4p=2.61e-3
p=4.68e-2
hist
olog
y
geno
mic
s
hist
olog
y+
gen
omic
s
hist
olog
y
His
tolo
gic
grad
eM
olec
ular
subt
ype
IIIIIIV
IIIIIIV
IDH wild-typeastrocytoma
IDH mutantastrocytoma
oligodendro-glioma
IIIII
N/A
IDH mutation
(N)
(Y)
1p19q co-deletion
(N)
better outcome
bette
r ou
tcom
e
5μm
5μm
10μm 10μm
50μm 5μm
Fig. 3. Prognostication criteria for diffuse gliomas. (A) Prognosis in the diffuse gliomas is determined by genomic classification and manual histologicgrading. Diffuse gliomas are first classified into one of three molecular subtypes based on IDH1/IDH2 mutations and the codeletion of chromosomes 1p and19q. Grade is then determined within each subtype using histologic characteristics. Subtypes with an astrocytic lineage are split by IDH mutation status, andthe combination of 1p/19q codeletion and IDH mutation defines an oligodendroglioma. These lineages have histologic differences; however, histologicevaluation is not a reliable predictor of molecular subtype (37). Histologic criteria used for grading range from nuclear morphology to higher-level patterns,like necrosis or the presence of abnormal microvascular structures. (B) Comparison of the prognostic accuracy of SCNN models with that of baseline modelsbased on molecular subtype or molecular subtype and histologic grade. Models were evaluated over 15 independent training/testing sets with randomizedpatient assignments and with/without training and testing sampling. (C) The risks predicted by the SCNN models correlate with both histologic grade andmolecular subtype, decreasing with grade and generally trending with the clinical aggressiveness of genomic subtypes. (D) Kaplan–Meier plots comparingmanual histologic grading and SCNN predictions. Risk categories (low, intermediate, high) were generated by thresholding SCNN risks. N/A, not applicable.
Mobadersany et al. PNAS | vol. 115 | no. 13 | E2973
MED
ICALSC
IENCE
SBIOPH
YSICSAND
COMPU
TATIONALBIOLO
GY
PNASPL
US
depending on cell of origin (either astrocytic or oligodendroglial).These criteria include mitotic activity, nuclear atypia, the presenceof necrosis, and the characteristics of microvascular structures(microvascular proliferation). Histologic grade remains a significantdeterminant in planning treatment for gliomas, with grades IIIand IV typically being treated aggressively with radiation andconcomitant chemotherapy.SCNN models showed substantial prognostic power, achieving
a median c index of 0.754 (Fig. 3B). SCNN models also per-formed comparably with manual histologic-grade baselinemodels (median c index 0.745, P = 0.307) and with molecularsubtype baseline models (median c index 0.746, P = 4.68e-2).Baseline models representing WHO classification that in-tegrate both molecular subtype and manual histologic gradeperformed slightly better than SCNN, with a median c index of0.774 (Wilcoxon signed rank P = 2.61e-3).We also evaluated the impact of the sampling and ranking
procedures shown in Fig. 2 in improving the performance ofSCNN models. Repeating the SCNN experiments without thesesampling techniques reduced the median c index of SCNNmodels to 0.696, significantly worse than for models wheresampling was used (P = 6.55e-4).
SCNN Predictions Correlate with Molecular Subtypes and ManualHistologic Grade. To further investigate the relationship betweenSCNN predictions and the WHO paradigm, we visualized howrisks predicted by SCNN are distributed across molecular sub-type and histologic grade (Fig. 3C). SCNN predictions werehighly correlated with both molecular subtype and grade andwere consistent with expected patient outcomes. First, withineach molecular subtype, the risks predicted by SCNN increasewith histologic grade. Second, predicted risks are consistent withthe published expected overall survivals associated with molec-ular subtypes (37). IDH WT astrocytomas are, for the most part,highly aggressive, having a median survival of 18 mo, and thecollective predicted risks for these patients are higher than forpatients from other subtypes. IDH mutant astrocytomas are an-other subtype with considerably better overall survival rangingfrom 3 to 8 y, and the predicted risks for patients in this subtypeare more moderate. Notably, SCNN risks for IDH mutant as-trocytomas are not well-separated for grades II and III, consis-tent with reports of histologic grade being an inadequatepredictor of outcome in this subtype (38). Infiltrating gliomaswith the combination of IDH mutations and codeletion ofchromosomes 1p/19q are classified as oligodendrogliomas in thecurrent WHO schema, and these have the lowest overall pre-dicted risks consistent with overall survivals of 10+ y (37, 39).Finally, we noted a significant difference in predicted risks whencomparing the IDH mutant and IDH WT grade III astrocytomas(rank sum P = 6.56e-20). These subtypes share an astrocyticlineage and are graded using identical histologic criteria. Al-though some histologic features are more prevalent in IDH-mutant astrocytomas, these features are not highly specific orsensitive to IDH mutant tumors and cannot be used to reliablypredict IDH mutation status (40). Risks predicted by SCNN areconsistent with worse outcomes for IDHWT astrocytomas in thiscase (median survival 1.7 vs. 6.3 y in the IDH mutant counter-parts), suggesting that SCNN models can detect histologic dif-ferences associated with IDH mutations in astrocytomas.We also performed a Kaplan–Meier analysis to compare
manual histologic grading with “digital grades” based on SCNNrisk predictions (Fig. 3D). Low-, intermediate-, and high-riskcategories were established by setting thresholds on SCNN pre-dictions to reflect the proportions of manual histologic grades ineach molecular subtype (Methods). We observed that, withineach subtype, the differences in survival captured by SCNN riskcategories are highly similar to manual histologic grading. SCNNrisk categories and manual histologic grades have similar prognostic
power in IDH WT astrocytomas (log rank P = 1.23e-12 vs. P =7.56e-11, respectively). In IDHmutant astrocytomas, both SCNNrisk categories and manual histologic grades have difficultyseparating Kaplan–Meier curves for grades II and III, but bothclearly distinguish grade IV as being associated with worse out-comes. Discrimination for oligodendroglioma survival is alsosimilar between SCNN risk categories and manual histologicgrades (log rank P = 9.73e-7 vs. P = 8.63e-4, respectively).
Improving Prognostic Accuracy by Integrating Genomic Biomarkers.To integrate both histologic and genomic data into a singleunified prediction framework, we developed a genomic survivalconvolutional neural network (GSCNN model). The GSCNNlearns from genomics and histology simultaneously by incorporatinggenomic data into the fully connected layers of the SCNN (Fig. 4).Both data are presented to the network during training, enablinggenomic variables to influence the patterns learned by the SCNN byproviding molecular subtype information.We repeated our experiments using GSCNN models with
histology images, IDH mutation status, and 1p/19q codeletion asinputs and found that the median c index improved from 0.754 to0.801. The addition of genomic variables improved performanceby 5% on average, and GSCNN models significantly outperformthe baseline WHO subtype-grade model trained on equivalentdata (signed rank P = 1.06e-2). To assess the value of integratinggenomic variables directly into the network during training, wecompared GSCNN with a more superficial integration approach,where an SCNN model was first trained using histology images,and then, the risks from this model were combined with IDH and1p/19q variables in a simple three-variable Cox model (Fig. S2).Processing genomic variables in the fully connected layers andincluding them in training provided a statistically significantbenefit; models trained using the superficial approach performedworse than GSCNN models with median c index decreasing to0.785 (signed rank P = 4.68e-2).To evaluate the independent prognostic power of risks pre-
dicted by SCNN and GSCNN, we performed a multivariable Coxregression analysis (Table 1). In a multivariable regression thatincluded SCNN risks, subtype, grade, age, and sex, SCNN riskshad a hazard ratio of 3.05 and were prognostic when correctingfor all other features, including manual grade and molecularsubtype (P = 2.71e-12). Molecular subtype was also significant inthe SCNN multivariable regression model, but histologic gradewas not. We also performed a multivariable regression withGSCNN risks and found GSCNN to be significant (P = 9.69e-12)with a hazard ratio of 8.83. In the GSCNN multivariable re-gression model, molecular subtype was not significant, but his-tologic grade was marginally significant. We also used Kaplan–Meier analysis to compare risk categories generated from SCNNand GSCNN (Fig. S3). Survival curves for SCNN and GSCNNwere very similar when evaluated on the entire cohort. In con-trast, their abilities to discriminate survival within molecularsubtypes were notably different.
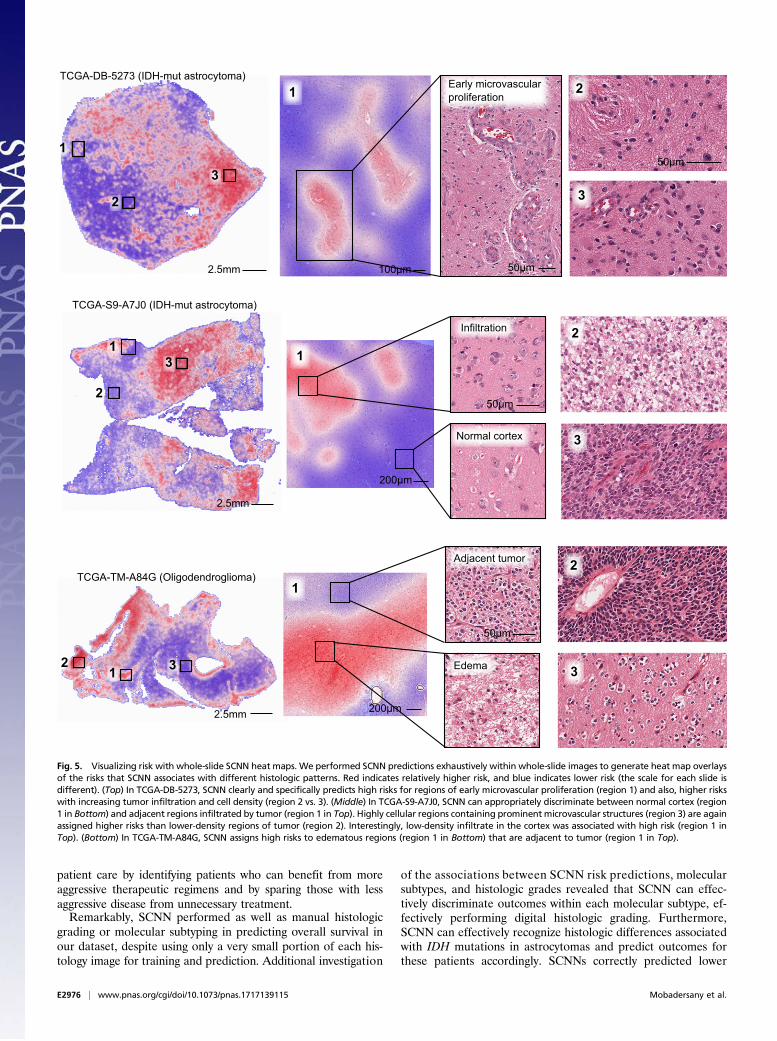
Visualizing Histologic Patterns Associated with Prognosis. Deeplearning networks are often criticized for being black box ap-proaches that do not reveal insights into their prediction mech-anisms. To investigate the visual patterns that SCNN modelsassociate with poor outcomes, we used heat map visualizations todisplay the risks predicted by our network in different regions ofwhole-slide images. Transparent heat map overlays are fre-quently used for visualization in digital pathology, and in ourstudy, these overlays enable pathologists to correlate the pre-dictions of highly accurate survival models with the underlyinghistology over the expanse of a whole-slide image. Heat mapswere generated using a trained SCNN model to predict the riskfor each nonoverlapping HPF in a whole-slide image. The pre-dicted risks were used to generate a color-coded transparent
E2974 | www.pnas.org/cgi/doi/10.1073/pnas.1717139115 Mobadersany et al.

overlay, where red and blue indicate higher and lower SCNNrisk, respectively.A selection of risk heat maps from three patients is presented
in Fig. 5, with inlays showing how SCNNs associate risk withimportant pathologic phenomena. For TCGA-DB-5273 (WHOgrade III, IDH mutant astrocytoma), the SCNN heat map clearlyand specifically highlights regions of early microvascular pro-liferation, an advanced form of angiogenesis that is a hallmark ofmalignant progression, as being associated with high risk. Risk inthis heat map also increases with cellularity, heterogeneity innuclear shape and size (pleomorphism), and the presence ofabnormal microvascular structures. Regions in TCGA-S9-A7J0 have varying extents of tumor infiltration ranging fromnormal brain to sparsely infiltrated adjacent normal regionsexhibiting satellitosis (where neoplastic cells cluster aroundneurons) to moderately and highly infiltrated regions. This heatmap correctly associates the lowest risks with normal brain re-gions and can distinguish normal brain from adjacent regionsthat are sparsely infiltrated. Interestingly, higher risks areassigned to sparsely infiltrated regions (region 1, Top) than toregions containing relatively more tumor infiltration (region 2,Top). We observed a similar pattern in TCGA-TM-A84G, whereedematous regions (region 1, Bottom) adjacent to moderatelycellular tumor regions (region 1, Top) are also assigned higherrisks. These latter examples provide risk features embeddedwithin histologic sections that have been previously unrecognizedand could inform and improve pathology practice.
DiscussionWe developed a deep learning approach for learning survivaldirectly from histological images and created a unified frame-work for integrating histology and genomic biomarkers for pre-dicting time-to-event outcomes. We systematically evaluated theprognostic accuracy of our approaches in the context of the
current clinical standard based on genomic classification andhistologic grading of gliomas. In contrast to a previous study thatachieved only marginally better than random prediction accu-racy, our approach rivals or exceeds the accuracy of highlytrained human experts in predicting survival. Our study providesinsights into applications of deep learning in medicine and theintegration of histology and genomic data and provides methodsfor dealing with intratumoral heterogeneity and training datadeficits when using deep learning algorithms to predict survivalfrom histology images. Using visualization techniques to gaininsights into SCNN prediction mechanisms, we found thatSCNNs clearly recognize known and time-honored histologicpredictors of poor prognosis and that SCNN predictions suggestprognostic relevance for histologic patterns with significance thatis not currently appreciated by neuropathologists.Our study investigated the ability to predict overall survival in
diffuse gliomas, a disease with wide variations in outcomes andan ideal test case where histologic grading and genomic classi-fications have independent prognostic power. Treatment plan-ning for gliomas is dependent on many factors, including patientage and grade, but gliomas assigned to WHO grades III and IVare typically treated very aggressively with radiation and con-comitant chemotherapy, whereas WHO grade II gliomas may betreated with chemotherapy or even followed in some cases (41).Histologic diagnosis and grading of gliomas have been limited byconsiderable intra- and interobserver variability (42). While theemergence of molecular subtyping has resolved uncertainty re-lated to lineage, criteria for grading need to be redefined in thecontext of molecular subtyping. For example, some morphologicfeatures used to assess grade (e.g., mitotic activity) are no longerprognostic in IDH mutant astrocytomas (38). The field of neuro-oncology is currently awaiting features that can better discriminatemore aggressive gliomas from those that are more indolent. Im-proving the accuracy and objectivity of grading will directly impact
Genomic survival convolutional network (GSCNN) GSCNN prediction accuracy
Image data
Convolutional layers
Fullyconnected
layersCox
model
......
...
Genomic data
... ... ... +
IDH mutation
1p/19qco-deletion
Con
cord
ance
inde
x
0.5
0.6
0.7
0.8
0.9
Sub
type
+ g
rade
SC
NN
GS
CN
N
SC
NN
+ s
ubty
pe
p=1.06e-2 p=4.68e-2
10μm
A B
Fig. 4. GSCNN models integrate genomic and imaging data for improved performance. (A) A hybrid architecture was developed to combine histology imageand genomic data to make integrated predictions of patient survival. These models incorporate genomic variables as inputs to their fully connected layers.Here, we show the incorporation of genomic variables for gliomas; however, any number of genomic or proteomic measurements can be similarly used.(B) The GSCNN models significantly outperform SCNN models as well as the WHO paradigm based on genomic subtype and histologic grading.
Table 1. Hazard ratios for single- and multiple-variable Cox regression models
Variable
Single variable Multivariable (SCNN) Multivariable (GSCNN)
c Index Hazard ratio 95% CI P value Hazard ratio 95% CI P value Hazard ratio 95% CI P value
SCNN 0.741 7.15 5.64, 9.07 2.08e-61 3.05 2.22, 4.19 2.71e-12 — — —
GSCNN 0.781 12.60 9.34, 17.0 3.08e-64 — — — 8.83 4.66, 16.74 9.69e-12IDH WT astrocytoma 0.726 9.21 6.88, 12.34 3.48e-52 4.73 2.57, 8.70 3.49e-7 0.97 0.43, 2.17 0.93IDH mutant astrocytoma — 0.23 0.170, 0.324 2.70e-19 2.35 1.27, 4.34 5.36e-3 1.67 0.90, 3.12 0.10Histologic grade IV 0.721 7.25 5.58, 9.43 2.68e-51 1.52 0.839, 2.743 0.159 1.98 1.11, 3.51 0.017Histologic grade III — 0.44 0.332, 0.591 1.66e-08 1.57 0.934, 2.638 0.0820 1.78 1.07, 2.97 0.024Age 0.744 1.77 1.63, 1.93 2.52e-42 1.33 1.20, 1.47 9.57e-9 1.34 1.22, 1.48 9.30e-10Sex, female 0.552 0.89 0.706, 1.112 0.29 0.85 0.67, 1.08 0.168 0.86 0.68, 1.08 0.18
Bold indicates statistical significance (P < 5e-2).
Mobadersany et al. PNAS | vol. 115 | no. 13 | E2975
MED
ICALSC
IENCE
SBIOPH
YSICSAND
COMPU
TATIONALBIOLO
GY
PNASPL
US
patient care by identifying patients who can benefit from moreaggressive therapeutic regimens and by sparing those with lessaggressive disease from unnecessary treatment.Remarkably, SCNN performed as well as manual histologic
grading or molecular subtyping in predicting overall survival inour dataset, despite using only a very small portion of each his-tology image for training and prediction. Additional investigation
of the associations between SCNN risk predictions, molecularsubtypes, and histologic grades revealed that SCNN can effec-tively discriminate outcomes within each molecular subtype, ef-fectively performing digital histologic grading. Furthermore,SCNN can effectively recognize histologic differences associatedwith IDH mutations in astrocytomas and predict outcomes forthese patients accordingly. SCNNs correctly predicted lower
11
2
3
TCGA-S9-A7J0 (IDH-mut astrocytoma)
2
3
2
312 3
TCGA-TM-A84G (Oligodendroglioma)1
1
1
2
3
TCGA-DB-5273 (IDH-mut astrocytoma)2
3
Early microvascularproliferation
Normal cortex
Infiltration
Edema
Adjacent tumor
50μm
50μm
50μm
50μm
100μm
200μm
200μm
2.5mm
2.5mm
2.5mm
Fig. 5. Visualizing risk with whole-slide SCNN heat maps. We performed SCNN predictions exhaustively within whole-slide images to generate heat map overlaysof the risks that SCNN associates with different histologic patterns. Red indicates relatively higher risk, and blue indicates lower risk (the scale for each slide isdifferent). (Top) In TCGA-DB-5273, SCNN clearly and specifically predicts high risks for regions of early microvascular proliferation (region 1) and also, higher riskswith increasing tumor infiltration and cell density (region 2 vs. 3). (Middle) In TCGA-S9-A7J0, SCNN can appropriately discriminate between normal cortex (region1 in Bottom) and adjacent regions infiltrated by tumor (region 1 in Top). Highly cellular regions containing prominent microvascular structures (region 3) are againassigned higher risks than lower-density regions of tumor (region 2). Interestingly, low-density infiltrate in the cortex was associated with high risk (region 1 inTop). (Bottom) In TCGA-TM-A84G, SCNN assigns high risks to edematous regions (region 1 in Bottom) that are adjacent to tumor (region 1 in Top).
E2976 | www.pnas.org/cgi/doi/10.1073/pnas.1717139115 Mobadersany et al.
risks for WHO grade III IDH mutant astrocytomas comparedwith WHO grade III IDH WT astrocytomas, consistent with theconsiderably longer median survival for patients with IDH mu-tant astrocytoma (6.3 vs. 1.7 y). While there are histologic fea-tures of astrocytomas that are understood to be more prevalentin IDH mutant astrocytomas, including the presence of micro-cysts and the rounded nuclear morphology of neoplastic nuclei,these are not reliable predictors of IDH mutations (40).To integrate genomic information in prognostication, we de-
veloped a hybrid network that can learn simultaneously fromboth histology images and genomic biomarkers. The GSCNNpresented in our study significantly outperforms the WHOstandard based on identical inputs. We compared the perfor-mance of GSCNN and SCNN in several ways to evaluate theirability to predict survival and to assess the relative importance ofhistology and genomic data in GSCNN. GSCNN had signifi-cantly higher c index scores due to the inclusion of genomicvariables in the training process. Performance significantly de-clined when using a superficial integration method that combinesgenomic biomarkers with a pretrained SCNN model.In multivariable regression analyses, GSCNN has a much
higher hazard ratio than SCNN (8.83 vs. 3.05). Examining theother variables in the regression models, we noticed an in-teresting relationship between the significance of histologic-grade and molecular subtype variables. In the SCNN regressionanalysis, histologic-grade variables were not significant, butmolecular subtype variables were highly significant, indicatingthat SCNN could capture histologic information from image databut could not learn molecular subtype information entirely fromhistology. In contrast, molecular subtype information was notsignificant in the GSCNN regression analysis. Interestingly,histologic-grade variables were marginally significant, suggestingthat some prognostic value in the histology images remaineduntapped by GSCNN.Kaplan–Meier analysis showed remarkable similarity in the
discriminative power of SCNN and GSCNN. Additional Kaplan–Meier analysis of risk categories within molecular subtypesrevealed interesting trends that are consistent with the regressionanalyses presented in Table 1. SCNN clearly separates outcomeswithin each molecular subtype based on histology. Survivalcurves for GSCNN risk categories, however, overlap significantlyin each subtype. Since SCNN models do not have access to ge-nomic data when making predictions, their ability to discriminateoutcomes was worse in general when assessed by c index ormultivariable regression.Integration of genomic and histology data into a single pre-
diction framework remains a challenge in the clinical implementa-tion of computational pathology. Our previous work in developingdeep learning survival models from genomic data has shown thataccurate survival predictions can be learned from high-dimensionalgenomic and protein expression signatures (29). Incorporating ad-ditional genomic variables into GSCNNmodels is an area for futureresearch and requires larger datasets that combine histology imageswith rich genomic and clinical annotations.While deep learning methods frequently deliver outstanding
performance, the interpretability of black box deep learningmodels is limited and remains a significant barrier in their vali-dation and adoption. Heat map analysis provides insights intothe histologic patterns associated with increased risk and can alsoserve as a practical tool to guide pathologists to tissue regionsassociated with worse prognosis. The heat maps suggest thatSCNN can learn visual patterns known to be associated withhistologic features related to prognosis and used in grading, in-cluding microvascular proliferation, cell density, and nuclearmorphology. Microvascular prominence and proliferation areassociated with disease progression in all forms of diffuse glioma,and these features are clearly delineated as high risk in the heatmap presented for slide TCGA-DB-5273. Likewise, increases in
cell density and nuclear pleomorphism were also associated withincreased risk in all examples. SCNN also assigned high risks toregions that do not contain well-recognized features associatedwith a higher grade or poor prognosis. In region 1 of slideTCGA-S9-A7J0, SCNN assigns higher risk to sparsely infiltratedcerebral cortex than to region 2, which is infiltrated by a higherdensity of tumor cells (normal cortex in region 1 is properlyassigned a very low risk). Widespread infiltration into distantsites of the brain is a hallmark of gliomas and results in treatmentfailure, since surgical resection of visible tumor often leaves re-sidual neoplastic infiltrates. Similarly, region 1 of slide TCGA-TM-A84G illustrates a high risk associated with low-cellularityedematous regions compared with adjacent oligodendrogliomawith much higher cellularity. Edema is frequently observedwithin gliomas and in adjacent brain, and its degree may be re-lated to the rate of growth (43), but its histologic presence hasnot been previously recognized as a feature of aggressive be-havior or incorporated into grading paradigms. While it is notentirely clear why SCNN assigns higher risks to the regions in thesparsely infiltrated or edematous regions, these examples con-firm that SCNN risks are not purely a function of cellular densityor nuclear atypia. Our human interpretations of these findingsprovide possible explanations for why SCNN unexpectedly pre-dicts high risks in these regions, but these findings need addi-tional investigation to better understand what specific featuresthe SCNN network perceives in these regions. Nevertheless, thisshows that SCNN can be used to identify potentially practice-changing features associated with increased risk that are em-bedded within pathology images.Although our study provides insights into the application of
deep learning in precision medicine, it has some importantlimitations. A relatively small portion of each slide was used fortraining and prediction, and the selection of ROIs within eachslide required expert guidance. Future studies will explore moreadvanced methods for automatic selection of regions and forincorporating a higher proportion of each slide in training andprediction to better account for intratumoral heterogeneity. Wealso plan to pursue the development of enhanced GSCNN modelsthat incorporate additional molecular features and to evaluate thevalue added of histology in these more complex models. In ourKaplan–Meier analysis, the thresholds used to define risk cate-gories were determined in a subjective manner using the pro-portion of manual histologic grades in the TCGA cohort, and alarger dataset would permit a more rigorous definition of thesethresholds to optimize survival stratification. The interpretation ofrisk heat maps was based on subjective evaluation by neuropa-thologists, and we plan to pursue studies that evaluate heat mapsin a more objective manner to discover and validate histologicfeatures associated with poor outcomes. Finally, while we haveapplied our techniques to gliomas, validation of these approachesin other diseases is needed and could provide additional insights.In fact, our methods are not specific to histology imaging or cancerapplications and could be adapted to other medical imaging mo-dalities and biomedical applications.
MethodsData and Image Curation. Whole-slide images and clinical and genomic datawere obtained from TCGA via the Genomic Data Commons (https://gdc.cancer.gov/). Images of diagnostic H&E-stained, formalin-fixed, paraffin-embedded sections from the Brain LGG and the GBM cohorts werereviewed to remove images containing tissue-processing artifacts, includingbubbles, section folds, pen markings, and poor staining. Representative ROIscontaining primarily tumor nuclei were manually identified for each slidethat passed a quality control review. This review identified whole-slide im-ages with poor image quality arising from imaging artifacts or tissue pro-cessing (bubbles, significant tissue section folds, overstaining, understaining)where suitable ROIs could not be selected. In the case of grade IV disease,some regions include microvascular proliferation, as this feature wasexhibited throughout tumor regions. Regions containing geographic necrosis
Mobadersany et al. PNAS | vol. 115 | no. 13 | E2977
MED
ICALSC
IENCE
SBIOPH
YSICSAND
COMPU
TATIONALBIOLO
GY
PNASPL
US

were excluded. A total of 1,061 whole-slide images from 769 unique patientswere analyzed.
ROI images (1,024 × 1,024 pixels) were cropped at 20× objective magni-fication using OpenSlide and color-normalized to a gold standard H&E cal-ibration image to improve consistency of color characteristics across slides.HPFs at 256 × 256 pixels were sampled from these regions and used fortraining and testing as described below.
Network Architecture and Training Procedures. The SCNN combines elementsof the 19-layer Visual Geometry Group (VGG) convolutional network archi-tecture with a Cox proportional hazards model to predict time-to-event datafrom images (Fig. S1) (44). Image feature extraction is achieved by fourgroups of convolutional layers. (i) The first group contains two convolutionallayers with 64 3 × 3 kernels interleaved with local normalization layers andthen followed with a single maximum pooling layer. (ii) The second groupcontains two convolutional layers (128 3 × 3 kernels) interleaved with twolocal normalization layers followed by a single maximum pooling layer. (iii)The third group interleaves four convolutional layers (256 3 × 3 kernels) withfour local normalization layers followed by a single maximum pooling layer.(iv) The fourth group contains interleaves of eight convolutional (512 3 ×3 kernels) and eight local normalization layers, with an intermediate poolinglayer and a terminal maximum pooling layer. These four groups are fol-lowed by a sequence of three fully connected layers containing 1,000, 1,000,and 256 nodes, respectively.
The terminal fully connected layer outputs a prediction of risk R= βTX
associated with the input image, where β∈R256×1 are the terminal layer
weights and X ∈R256×1 are the inputs to this layer. To provide an error signalfor backpropagation, these risks are input to a Cox proportional hazardslayer to calculate the negative partial log likelihood:
Lðβ,XÞ=−Xi∈U
βTXi − log
Xj∈Ωi
e βT Xj
!, [1]
where βTXi is the risk associated with HPF i, U is the set of right-censoredsamples, and Ωi is the set of “at-risk” samples with event or follow-up timesΩi = fjjYj ≥Yig (where Yi is the event or last follow-up time of patient i).
The adagrad algorithm was used to minimize the negative partial loglikelihood via backpropagation to optimize model weights, biases, andconvolutional kernels (45). Parameters to adagrad include the initial accu-mulator value = 0.1, initial learning rate = 0.001, and an exponentiallearning rate decay factor = 0.1. Model weights were initialized using thevariance scaling method (46), and a weight decay was applied to the fullyconnected layers during training (decay rate = 4e-4). Models were trained for100 epochs (1 epoch is one complete cycle through all training samples) usingminibatches consisting of 14 HPFs each. Each minibatch produces a modelupdate, resulting in multiple updates per epoch. Calculation of the Cox partiallikelihood requires access to the predicted risks of all samples, which are notavailable within any single minibatch, and therefore, Cox likelihood was cal-culated locally within each minibatch to perform updates (U and Ωi were re-stricted to samples within each minibatch). Local likelihood calculation can bevery sensitive to how samples are assigned to minibatches, and therefore, werandomize the minibatch sample assignments at the beginning of each epochto improve robustness. Mild regularization was applied during training byrandomly dropping out 5% of weights in the last fully connected layer in eachminibatch during training to mitigate overfitting.
Training Sampling. Each patient has possibly multiple slides and multipleregions within each slide that can be used to sample HPFs. During training, asingle HPF was sampled from each region, and these HPFs were treated assemiindependent training samples. Each HPF was paired with patient out-come for training, duplicating outcomes for patients containing multipleregions/HPFs. The HPFs are sampled at the beginning of each training epochto generate an entirely new set of HPFs. Randomized transforms were alsoapplied to these HPFs to improve robustness to tissue orientation and colorvariations. Since the visual patterns in tissues can often be anisotropic, werandomly apply a mirror transform to each HPF. We also generate randomtransformations of contrast and brightness using the “random_contrast” and“random_brightness” TensorFlow operations. The contrast factor was ran-domly selected in the interval [0.2, 1.8], and the brightness was randomlyselected in the interval [−63, 63]. These sampling and transformation pro-cedures along with the use of multiple HPFs for each patient have the effectof augmenting the effective size of the labeled training data. In tissues withpronounced anisotropy, including adenocarcinomas that exhibit prominentglandular structures, these mirror transformations are intended to improve
the robustness of the network to tissue orientation. Similar approaches fortraining data augmentation have shown considerable improvements ingeneral imaging applications (33).
Testing Sampling, Risk Filtering, and Model Averaging. Sampling was alsoperformed to increase the robustness and stability of predictions. (i) NineHPFs are first sampled from each region j corresponding to patient m. (ii)
The risk of the kth HPF in region j for patient m, denoted R j,km , is then cal-
culated using the trained SCNN model. (iii ) The median risk
R jm =mediankfR j,k
m g is calculated for region j using the aforementioned HPFsto reject outlying risks. (iv) These median risks are then sorted from highest
to lowest cR1m > cR2
m > cR3m . . . , where the superscript index now corresponds to
the risk rank. (v) The risk prediction for patient m is then selected as the
second highest risk R*m = cR2m. This filtering procedure was designed to emu-
late how a pathologist integrates information from multiple areas within aslide, determining prognosis based on the region associated with the worstprognosis. Selection of the second highest risk (as opposed to the highestrisk) introduces robustness to outliers or high risks that may occur due tosome imaging or tissue-processing artifact.
Since the accuracy of our models can vary significantly from one epoch toanother, largely due to the training sampling and randomized minibatchassignments, a model-averaging technique was used to reduce predictionvariance. To obtain final risk predictions for the testing patients that arestable, we perform model averaging using the models from epochs 96 to100 to smooth variations across epochs and increase stability. Formally, themodel-averaged risk for patient m is calculated as
R*m =15
X100γ=96
R*mðγÞ, [2]
where R*mðγÞ denotes the predicted risk for patient m in training epoch γ.
Validation Procedures. Patients were randomly assigned to nonoverlappingtraining (80%) and test (20%) sets that were used to train models and evaluatetheir performance. If a patient was assigned to training, then all slides corre-sponding to that patient were assigned to the training set and likewise, for thetesting set. This ensures that no data from any one patient are represented inboth training and testing sets to avoid overfitting and optimistic estimates ofgeneralization accuracy. We repeated the randomized assignment of patientstraining/testing sets 15 times and used each of these training/testing sets totrain and evaluate amodel. The same training/testing assignmentswere used ineachmodel (SCNN, GSCNN, baseline) for comparability. Prediction accuracywasmeasured using Harrell’s c index to measure the concordance between pre-dicted risk and actual survival for testing samples (36).
Statistical Analyses. The c indices generated by Monte Carlo cross-validationwere performed using the Wilcoxon signed rank test. This paired test waschosen, because each method was evaluated using identical training/testingsets. Comparisons of SCNN risk values across grade were performed using theWilcoxon rank sum test. Cox univariable and multivariable regression analyseswere performed using predicted SCNN risk values for all training and testingsamples in randomized training/testing set 1. Analyses of the correlation ofgrade, molecular subtype, and SCNN risk predictions were performed bypooling predicted risks for testing samples across all experiments. SCNN riskswere normalized within each experiment by z score before pooling. Gradeanalysis was performed by determining “digital”-grade thresholds for SCNNrisks in each subtype. Thresholds were objectively selected to match the pro-portions of samples in each histologic grade in each subtype. Statistical analysisof Kaplan–Meier plots was performed using the log rank test.
Hardware and Software. Prediction models were trained using TensorFlow(v0.12.0) on servers equipped with dual Intel(R) Xeon(R) CPU E5-2630L v2 @2.40 GHz CPUs, 128 GB RAM, and dual NVIDIA K80 graphics cards. Image datawere extracted from Aperio .svs whole-slide image formats using OpenSlide(openslide.org/). Basic image analysis operations were performed usingHistomicsTK (https://github.com/DigitalSlideArchive/HistomicsTK), a Pythonpackage for histology image analysis.
Data Availability. This paper was produced using large volumes of publiclyavailable genomic and imaging data. The authors have made every effort tomake available links to these resources as well as make publicly available thesoftware methods and information used to produce the datasets, analyses,and summary information.
E2978 | www.pnas.org/cgi/doi/10.1073/pnas.1717139115 Mobadersany et al.
ACKNOWLEDGMENTS. This work was supported by US NIH National Li-brary of Medicine Career Development Award K22LM011576 and Na-
tional Cancer Institute Grant U24CA194362 and by the National BrainTumor Society.
1. Kong J, et al. (2008) Computer-assisted grading of neuroblastic differentiation. ArchPathol Lab Med 132:903–904, author reply 904.
2. Niazi MKK, et al. (2017) Visually meaningful histopathological features for automaticgrading of prostate cancer. IEEE J Biomed Health Inform 21:1027–1038.
3. Naik S, et al. (2008) Automated gland and nuclei segmentation for grading of pros-tate and breast cancer histopathology. Proceedings of the 2008 5th IEEE InternationalSymposium on Biomedical Imaging: From Nano to Macro (IEEE, Piscataway, NJ), pp284–287.
4. Ren J, et al. (2015) Computer aided analysis of prostate histopathology imagesGleason grading especially for Gleason score 7. Conf Proc IEEE Eng Med Biol Soc 2015:3013–3016.
5. Kothari S, Phan JH, Young AN, Wang MD (2013) Histological image classificationusing biologically interpretable shape-based features. BMC Med Imaging 13:9.
6. Sertel O, et al. (2009) Computer-aided prognosis of neuroblastoma on whole-slideimages: Classification of stromal development. Pattern Recognit 42:1093–1103.
7. Fauzi MF, et al. (2015) Classification of follicular lymphoma: the effect of computeraid on pathologists grading. BMC Med Inform Decis Mak 15:115.
8. Dundar MM, et al. (2011) Computerized classification of intraductal breast lesionsusing histopathological images. IEEE Trans Biomed Eng 58:1977–1984.
9. Hou L, et al. (2016) Patch-based convolutional neural network for whole slide tissueimage classification. Proceedings of the 2016 IEEE Conference on Computer Visionand Pattern Recognition (CVPR) (IEEE, Piscataway, NJ), pp 2424–2433.
10. Kong J, et al. (2013) Machine-based morphologic analysis of glioblastoma usingwhole-slide pathology images uncovers clinically relevant molecular correlates. PLoSOne 8:e81049.
11. Wang D, Khosla A, Gargeya R, Irshad H, Beck AH (2016) Deep learning for identifyingmetastatic breast cancer. arXiv:1606.05718.
12. LeCun Y, Bengio Y, Hinton G (2015) Deep learning. Nature 521:436–444.13. Greenspan H, van Ginneken B, Summers RM (2016) Guest editorial deep learning in
medical imaging: Overview and future promise of an exciting new technique. IEEETrans Med Imaging 35:1153–1159.
14. Janowczyk A, Madabhushi A (2016) Deep learning for digital pathology imageanalysis: A comprehensive tutorial with selected use cases. J Pathol Inform 7:29.
15. Litjens G, et al. (2016) Deep learning as a tool for increased accuracy and efficiency ofhistopathological diagnosis. Sci Rep 6:26286.
16. Chen T, Chefd’hotel C (2014) Deep learning based automatic immune cell detectionfor immunohistochemistry images. Machine Learning in Medical Imaging (Springer,Berlin), pp 17–24.
17. Cruz-Roa A, et al. (2017) Accurate and reproducible invasive breast cancer detectionin whole-slide images: A Deep Learning approach for quantifying tumor extent. SciRep 7:46450.
18. Pereira S, Pinto A, Alves V, Silva CA (2016) Brain tumor segmentation using con-volutional neural networks in MRI images. IEEE Trans Med Imaging 35:1240–1251.
19. Sirinukunwattana K, et al. (2016) Locality sensitive deep learning for detection andclassification of nuclei in routine colon cancer histology images. IEEE Trans MedImaging 35:1196–1206.
20. Esteva A, et al. (2017) Dermatologist-level classification of skin cancer with deepneural networks. Nature 542:115–118.
21. Gulshan V, et al. (2016) Development and validation of a deep learning algorithm fordetection of diabetic retinopathy in retinal fundus photographs. JAMA 316:2402–2410.
22. Havaei M, et al. (2017) Brain tumor segmentation with deep neural networks. MedImage Anal 35:18–31.
23. Huynh BQ, Li H, Giger ML (2016) Digital mammographic tumor classification usingtransfer learning from deep convolutional neural networks. J Med Imaging(Bellingham) 3:034501.
24. Kamnitsas K, et al. (2017) Efficient multi-scale 3D CNN with fully connected CRF foraccurate brain lesion segmentation. Med Image Anal 36:61–78.
25. Turkki R, Linder N, Kovanen PE, Pellinen T, Lundin J (2016) Antibody-supervised deeplearning for quantification of tumor-infiltrating immune cells in hematoxylin andeosin stained breast cancer samples. J Pathol Inform 7:38.
26. Bychkov D, Turkki R, Haglund C, Linder N, Lundin J (2016) Deep learning for tissuemicroarray image-based outcome prediction in patients with colorectal cancer. SPIEMedical Imaging, eds Gurcan MN, Madabhushi A (International Society for Optics andPhotonics, Bellingham, WA), p 6.
27. Kourou K, Exarchos TP, Exarchos KP, Karamouzis MV, Fotiadis DI (2014) Machinelearning applications in cancer prognosis and prediction. Comput Struct Biotechnol J13:8–17.
28. Xiang A, Lapuerta P, Ryutov A, Buckley J, Azen S (2000) Comparison of the perfor-mance of neural network methods and Cox regression for censored survival data.Comput Stat Data Anal 34:243–257.
29. Yousefi S, et al. (2017) Predicting clinical outcomes from large scale cancer genomicprofiles with deep survival models. Sci Rep 7:11707.
30. Yousefi S, Congzheng S, Nelson N, Cooper LAD (2016) Learning genomic represen-tations to predict clinical outcomes in cancer. arXiv:1609.08663.
31. Katzman J, et al. (2016) DeepSurv: Personalized treatment recommender system us-ing A Cox proportional hazards deep neural network. arXiv:1606.00931.
32. Zhu X, Yao J, Huang J (2016) Deep convolutional neural network for survival analysiswith pathological images. Proceedings of the 2016 IEEE International Conference onBioinformatics and Biomedicine (IEEE, Piscataway, NJ), pp 544–547.
33. Krizhevsky A, Sutskever I, Hinton GE (2012) Imagenet classification with deep con-volutional neural networks. Advances in Neural Information Processing Systems, edsPereira F, Burges CJC, Bottou L, Weinberger KQ (Neural Information Processing Sys-tems Foundation, Inc., La Jolla, CA), pp 1097–1105.
34. Gutman DA, et al. (2013) Cancer Digital Slide Archive: an informatics resource tosupport integrated in silico analysis of TCGA pathology data. J Am Med Inform Assoc20:1091–1098.
35. Gutman DA, et al. (2017) The digital slide archive: A software platform for man-agement, integration, and analysis of histology for cancer research. Cancer Res 77:e75–e78.
36. Harrell FE, Jr, Califf RM, Pryor DB, Lee KL, Rosati RA (1982) Evaluating the yield ofmedical tests. JAMA 247:2543–2546.
37. Brat DJ, et al.; Cancer Genome Atlas Research Network (2015) Comprehensive, in-tegrative genomic analysis of diffuse lower-grade gliomas. N Engl J Med 372:2481–2498.
38. Reuss DE, et al. (2015) IDH mutant diffuse and anaplastic astrocytomas have similarage at presentation and little difference in survival: a grading problem for WHO. ActaNeuropathol 129:867–873.
39. Leeper HE, et al. (2015) IDH mutation, 1p19q codeletion and ATRX loss in WHO gradeII gliomas. Oncotarget 6:30295–30305.
40. Nguyen DN, et al. (2013) Molecular and morphologic correlates of the alternativelengthening of telomeres phenotype in high-grade astrocytomas. Brain Pathol 23:237–243.
41. Wijnenga MMJ, et al. (2018) The impact of surgery in molecularly defined low-gradeglioma: an integrated clinical, radiological, and molecular analysis. Neuro-oncol 20:103–112.
42. van den Bent MJ (2010) Interobserver variation of the histopathological diagnosis inclinical trials on glioma: a clinician’s perspective. Acta Neuropathol 120:297–304.
43. Pope WB, et al. (2005) MR imaging correlates of survival in patients with high-gradegliomas. AJNR Am J Neuroradiol 26:2466–2474.
44. Simonyan K, Zisserman A (2014) Very deep convolutional networks for large-scaleimage recognition. arXiv:1409.1556.
45. Duchi J, Hazan E, Singer Y (2011) Adaptive subgradient methods for online learningand stochastic optimization. J Mach Learn Res 12:2121–2159.
46. He K, Zhang X, Ren S, Sun J (2015) Delving deep into rectifiers: Surpassing human-level performance on imagenet classification. IEEE International Conference onComputer Vision (IEEE, Piscataway, NJ), pp 1026–1034.
Mobadersany et al. PNAS | vol. 115 | no. 13 | E2979
MED
ICALSC
IENCE
SBIOPH
YSICSAND
COMPU
TATIONALBIOLO
GY
PNASPL
US


