Predicting application run times with historical information
10
Available online at www.sciencedirect.com J. Parallel Distrib. Comput. 64 (2004) 1007 – 1016 www.elsevier.com/locate/jpdc Predicting application run times with historical information Warren Smith a , Ian Foster b , Valerie Taylor c , ∗ a Computer Sciences Corporation, NASA Advanced Supercomputing Division, NASA Ames Research Center, Moffett Field, CA 94035, USA b Department of Computer Science, University of Chicago, Chicago, IL 60637, USA c Department of Computer Science, Texas A&M University, College Station, Texas 77843, USA Received 29 September 1998; received in revised form 10 May 2004 Abstract We present a technique for predicting the run times of parallel applications based upon the run times of “similar” applications that have executed in the past. The novel aspect of our work is the use of search techniques to determine those application characteristics that yield the best definition of similarity for the purpose of making predictions. We use four workloads recorded from parallel computers at Argonne National Laboratory, the Cornell Theory Center, and the San Diego Supercomputer Center to evaluate the effectiveness of our approach. We show that on these workloads our techniques achieve predictions that are between 21 and 64 percent better than those achieved by other techniques; our approach achieves mean prediction errors that are between 29 and 59 percent of mean application run times. © 2004 Published by Elsevier Inc. 1. Introduction Predictions of application run time can be used to im- prove the performance of scheduling algorithms [7,10–12] and to predict how long a request will wait for resources [3,10–12]. We believe that the key to making more ac- curate predictions is to be more careful about which past jobs are used to make predictions. Accordingly, we apply greedy and genetic algorithm search techniques to iden- tify templates that perform well when partitioning jobs into categories within which jobs are judged to be similar. We also examine and evaluate a number of variants of our ba- sic prediction strategy. We look at whether it is useful to use regression techniques to exploit node count information when jobs in a category have different node counts. We also look at the effect of varying the amount of past informa- tion used to make predictions, and we consider the impact of using user-supplied maximum run times on prediction accuracy. ∗ Corresponding author. Fax: +1-979-845-1420. E-mail addresses: [email protected] (W. Smith), [email protected] (I. Foster), [email protected] (V. Taylor). 0743-7315/$ - see front matter © 2004 Published by Elsevier Inc. doi:10.1016/j.jpdc.2004.06.008 We evaluate our techniques using four workloads recorded from supercomputers. This study shows that the use of search techniques makes a significant improvement in prediction accuracy: our prediction algorithm achieves prediction errors that are 21–61 percent lower than those achieved by Gib- bons, depending on the workload, and 41–64 percent lower than those achieved by Downey. The templates found by the genetic algorithm search outperform the templates found by the greedy search. The rest of the paper is structured as follows. Section 2 describes how we define application similarity, perform pre- dictions, and use search techniques to identify good tem- plates. Section 3 describes the results when our algorithm is applied to supercomputer workloads. Section 4 compares our techniques and results with those of other researchers. Section 5 presents our conclusions and notes directions for further work. An appendix provides details of the statistical methods used in our work. 2. Prediction techniques Both intuition and previous work [3,4,7] indicate that “similar” applications are more likely to have similar run
-
Upload
warren-smith -
Category
Documents
-
view
213 -
download
1
Transcript of Predicting application run times with historical information
Available online at www.sciencedirect.com
J. Parallel Distrib. Comput. 64 (2004) 1007–1016www.elsevier.com/locate/jpdc
Predicting application run times with historical information
Warren Smitha, Ian Fosterb, Valerie Taylorc,∗aComputer Sciences Corporation, NASA Advanced Supercomputing Division, NASA Ames Research Center, Moffett Field, CA 94035, USA
bDepartment of Computer Science, University of Chicago, Chicago, IL 60637, USAcDepartment of Computer Science, Texas A&M University, College Station, Texas 77843, USA
Received 29 September 1998; received in revised form 10 May 2004
Abstract
We present a technique for predicting the run times of parallel applications based upon the run times of “similar” applications that haveexecuted in the past. The novel aspect of our work is the use of search techniques to determine those application characteristics that yieldthe best definition of similarity for the purpose of making predictions. We use four workloads recorded from parallel computers at ArgonneNational Laboratory, the Cornell Theory Center, and the San Diego Supercomputer Center to evaluate the effectiveness of our approach.We show that on these workloads our techniques achieve predictions that are between 21 and 64 percent better than those achieved byother techniques; our approach achieves mean prediction errors that are between 29 and 59 percent of mean application run times.© 2004 Published by Elsevier Inc.
1. Introduction
Predictions of application run time can be used to im-prove the performance of scheduling algorithms[7,10–12]and to predict how long a request will wait for resources[3,10–12]. We believe that the key to making more ac-curate predictions is to be more careful about which pastjobs are used to make predictions. Accordingly, we applygreedy and genetic algorithm search techniques to iden-tify templates that perform well when partitioning jobs intocategories within which jobs are judged to be similar. Wealso examine and evaluate a number of variants of our ba-sic prediction strategy. We look at whether it is useful touse regression techniques to exploit node count informationwhen jobs in a category have different node counts. We alsolook at the effect of varying the amount of past informa-tion used to make predictions, and we consider the impactof using user-supplied maximum run times on predictionaccuracy.
∗ Corresponding author. Fax: +1-979-845-1420.E-mail addresses:[email protected](W. Smith),
[email protected](I. Foster),[email protected](V. Taylor).
0743-7315/$ - see front matter © 2004 Published by Elsevier Inc.doi:10.1016/j.jpdc.2004.06.008
We evaluate our techniques using four workloads recordedfrom supercomputers. This study shows that the use of searchtechniques makes a significant improvement in predictionaccuracy: our prediction algorithm achieves prediction errorsthat are 21–61 percent lower than those achieved by Gib-bons, depending on the workload, and 41–64 percent lowerthan those achieved by Downey. The templates found by thegenetic algorithm search outperform the templates found bythe greedy search.
The rest of the paper is structured as follows. Section 2describes how we define application similarity, perform pre-dictions, and use search techniques to identify good tem-plates. Section 3 describes the results when our algorithmis applied to supercomputer workloads. Section 4 comparesour techniques and results with those of other researchers.Section 5 presents our conclusions and notes directions forfurther work. An appendix provides details of the statisticalmethods used in our work.
2. Prediction techniques
Both intuition and previous work[3,4,7] indicate that“similar” applications are more likely to have similar run
1008 W. Smith et al. / J. Parallel Distrib. Comput. 64 (2004) 1007–1016
Table 1Characteristics of the workloads used in our studies
Workload name System Number of nodes Location When Number of requests Mean run time (min)
ANLa IBM SP2 80 ANL 3 months of 1996 7994 97.40CTC IBM SP2 512 CTC 11 months of 1996 79302 182.18SDSC95 Intel Paragon 400 SDSC 12 months of 1995 22885 107.76SDSC96 Intel Paragon 400 SDSC 12 months of 1996 22337 166.48
aBecause of an error when the trace was recorded, the ANL trace does not include one-third of the requests actually made to the system.
times than applications that have nothing in common. Thisobservation is the basis for our approach to the predictionproblem, which is to derive run-time predictions from his-torical information of previous similar runs.
To translate this general approach into a specific predic-tion method, we need to address two issues: (1) how to de-fine “similar” and (2) how to generate predictions. Theseissues are addressed in the following sections.
2.1. Defining similarity
In previous work, Downey[3] and Gibbons[7] demon-strated the value of using historical run-time information toidentify “similar” jobs to predict run times for the purposeof improving scheduling performance and predicting waittimes in queues. However, both Downey and Gibbons re-stricted themselves to fixed definitions of similarity. A majorcontribution of the present work is to show that searchingfor the most appropriate definitions of similarity can lead tosignificant improvements in prediction accuracy.
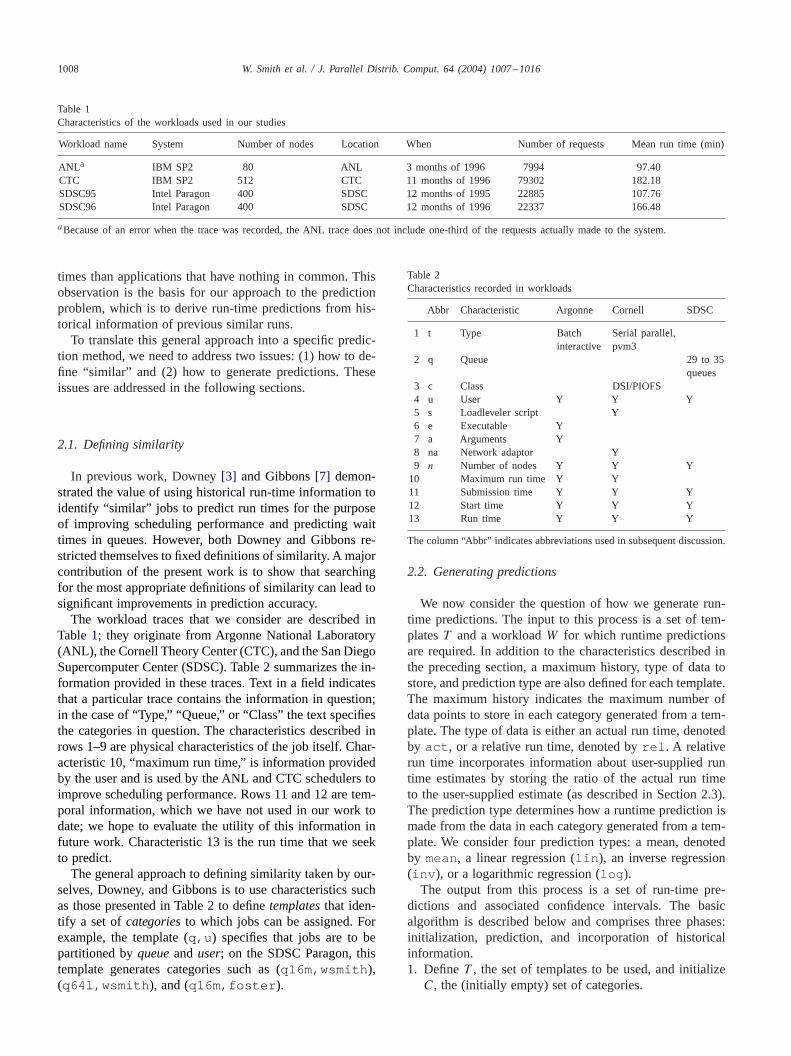
The workload traces that we consider are described inTable1; they originate from Argonne National Laboratory(ANL), the Cornell Theory Center (CTC), and the San DiegoSupercomputer Center (SDSC). Table2 summarizes the in-formation provided in these traces. Text in a field indicatesthat a particular trace contains the information in question;in the case of “Type,” “Queue,” or “Class” the text specifiesthe categories in question. The characteristics described inrows 1–9 are physical characteristics of the job itself. Char-acteristic 10, “maximum run time,” is information providedby the user and is used by the ANL and CTC schedulers toimprove scheduling performance. Rows 11 and 12 are tem-poral information, which we have not used in our work todate; we hope to evaluate the utility of this information infuture work. Characteristic 13 is the run time that we seekto predict.
The general approach to defining similarity taken by our-selves, Downey, and Gibbons is to use characteristics suchas those presented in Table2 to definetemplatesthat iden-tify a set ofcategoriesto which jobs can be assigned. Forexample, the template (q,u ) specifies that jobs are to bepartitioned byqueueanduser; on the SDSC Paragon, thistemplate generates categories such as (q16m,wsmith ),(q64l,wsmith ), and (q16m,foster ).
Table 2Characteristics recorded in workloads
Abbr Characteristic Argonne Cornell SDSC
1 t Type Batch Serial parallel,interactive pvm3
2 q Queue 29 to 35queues
3 c Class DSI/PIOFS4 u User Y Y Y5 s Loadleveler script Y6 e Executable Y7 a Arguments Y8 na Network adaptor Y9 n Number of nodes Y Y Y
10 Maximum run time Y Y11 Submission time Y Y Y12 Start time Y Y Y13 Run time Y Y Y
The column “Abbr” indicates abbreviations used in subsequent discussion.
2.2. Generating predictions
We now consider the question of how we generate run-time predictions. The input to this process is a set of tem-platesT and a workloadW for which runtime predictionsare required. In addition to the characteristics described inthe preceding section, a maximum history, type of data tostore, and prediction type are also defined for each template.The maximum history indicates the maximum number ofdata points to store in each category generated from a tem-plate. The type of data is either an actual run time, denotedby act , or a relative run time, denoted byrel . A relativerun time incorporates information about user-supplied runtime estimates by storing the ratio of the actual run timeto the user-supplied estimate (as described in Section 2.3).The prediction type determines how a runtime prediction ismade from the data in each category generated from a tem-plate. We consider four prediction types: a mean, denotedby mean, a linear regression (lin ), an inverse regression(inv ), or a logarithmic regression (log ).
The output from this process is a set of run-time pre-dictions and associated confidence intervals. The basicalgorithm is described below and comprises three phases:initialization, prediction, and incorporation of historicalinformation.1. DefineT , the set of templates to be used, and initialize
C, the (initially empty) set of categories.
W. Smith et al. / J. Parallel Distrib. Comput. 64 (2004) 1007–1016 1009
2. At the time each applicationa begins to execute:(a) Apply the templates inT to the characteristics ofa to
identify the categoriesCa into which the applicationmay fall.
(b) Eliminate fromCa all categories that are not inCor that cannot provide a valid prediction (i.e., donot have enough data points as described in the ap-pendix).
(c) For each category remaining inCa , compute a run-time estimate and a confidence interval for the esti-mate.
(d) If Ca is not empty, select the estimate with the small-est confidence interval as the run-time prediction forthe application.
3. At the time each applicationa completes execution:(a) Identify the setCa of categories into which the ap-
plication falls. These categories may or may not ex-ist in C.
(b) For each categoryci ∈ Ca
i. If ci �∈ C, createci in C.ii. If |ci | = maximum history(ci), remove the old-
est point inci .iii. Insert a into ci .
Note that steps 2 and 3 operate asynchronously, sincehistorical information for a job cannot be incorporated untilthe job finishes. Hence, our algorithm suffers from an initialramp-up phase during which there is insufficient informationin C to make predictions. This deficiency can be correctedby using a training set to initializeC.
We now discuss how a prediction is generated from thecontents of a category in step 2(c) of our algorithm. We con-sider two techniques in this paper. The first simply computesthe mean of the run times contained in the category. The sec-ond attempts to exploit the additional information providedby the node counts associated with previous run times byperforming regressions to compute coefficientsa andb forthe equationsR = aN+b, R = N
a+b, andR = a log N+b
for linear, inverse and logarithmic regressions, respectively.N is the number of nodes requested by the jobs, andR isthe run time. The techniques used to compute confidenceintervals for these predictors, are described in the appendix.
The use of maximum histories, denoted bymh, in step3(b) of our algorithm allows us to control the amount of his-torical information used when making predictions and theamount of storage space needed to store historical informa-tion. A small maximum history means that less historicalinformation is stored, and hence only more recent events areused to make predictions.
2.3. User guidance
One possible way to improve prediction accuracy is to in-corporate run time estimates provided by users at the timeof application submission. This approach may be viewedas complementary to the prediction techniques discussed
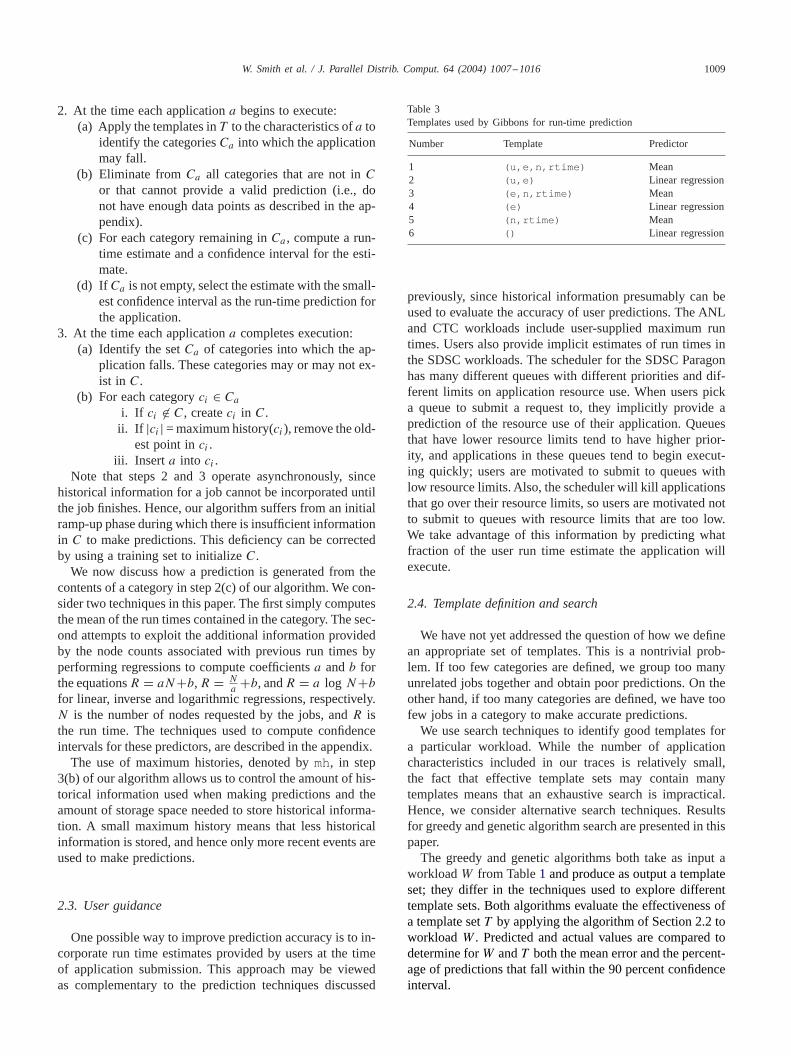
Table 3Templates used by Gibbons for run-time prediction
Number Template Predictor
1 (u,e,n,rtime) Mean2 (u,e) Linear regression3 (e,n,rtime) Mean4 (e) Linear regression5 (n,rtime) Mean6 () Linear regression
previously, since historical information presumably can beused to evaluate the accuracy of user predictions. The ANLand CTC workloads include user-supplied maximum runtimes. Users also provide implicit estimates of run times inthe SDSC workloads. The scheduler for the SDSC Paragonhas many different queues with different priorities and dif-ferent limits on application resource use. When users picka queue to submit a request to, they implicitly provide aprediction of the resource use of their application. Queuesthat have lower resource limits tend to have higher prior-ity, and applications in these queues tend to begin execut-ing quickly; users are motivated to submit to queues withlow resource limits. Also, the scheduler will kill applicationsthat go over their resource limits, so users are motivated notto submit to queues with resource limits that are too low.We take advantage of this information by predicting whatfraction of the user run time estimate the application willexecute.
2.4. Template definition and search
We have not yet addressed the question of how we definean appropriate set of templates. This is a nontrivial prob-lem. If too few categories are defined, we group too manyunrelated jobs together and obtain poor predictions. On theother hand, if too many categories are defined, we have toofew jobs in a category to make accurate predictions.
We use search techniques to identify good templates fora particular workload. While the number of applicationcharacteristics included in our traces is relatively small,the fact that effective template sets may contain manytemplates means that an exhaustive search is impractical.Hence, we consider alternative search techniques. Resultsfor greedy and genetic algorithm search are presented in thispaper.
The greedy and genetic algorithms both take as input aworkloadW from Table1 and produce as output a templateset; they differ in the techniques used to explore differenttemplate sets. Both algorithms evaluate the effectiveness ofa template setT by applying the algorithm of Section 2.2 toworkloadW . Predicted and actual values are compared todetermine forW andT both the mean error and the percent-age of predictions that fall within the 90 percent confidenceinterval.
1010 W. Smith et al. / J. Parallel Distrib. Comput. 64 (2004) 1007–1016
2.4.1. Greedy algorithmThe greedy algorithm proceeds iteratively to con-
struct a template setT = {ti} with each ti of the form{ () (h1,1) (h2,1, h2,2), . . . , (hi,1, hi,2, . . . , hi,i ) }, where ev-ery hj,k is one of then characteristicsh1, h2, . . . , hn fromwhich templates can be constructed for the workload inquestion. The search over workloadW is performed withthe following algorithm:1. Set the template setT = {()}.2. For i = 1− > n
(a) SetTc to contain the( ni) different templates that
containi characteristics.(b) For each templatetc in Tc
i. Create a candidate template setXc = T ∪ {tc}.ii. Apply the algorithm of Section 2.2 toW andXc,
and determine mean error.(c) Select theXc with the lowest mean error, and add
the associated templatetc to T .Our greedy algorithm can search over any set of character-istics.
2.4.2. Genetic algorithmThe second search algorithm that we consider uses ge-
netic algorithm techniques[9] to achieve a more detailedexploration of the search space. A genetic algorithm evolvesindividuals over a series of generations. The process for eachgeneration consists of evaluating the fitness of each individ-ual in the population, selecting which individuals will bemated to produce the next generation, mating the individ-uals, and mutating the resulting individuals to produce thenext generation. The process then repeats until a stoppingcondition is met. The stopping condition we use is that afixed number of generations have been processed.
Our individuals represent template sets. Each template setconsists of between 1 and 10 templates, and we encode thefollowing information in binary form for each template: thetype of regression to use, whether to use absolute or relativerun times, which characteristics to enable, the node range touse, and the amount of history to store in each category.
A fitness function is used to compute the fitness of eachindividual and therefore its chance to reproduce. In our ge-netic algorithm, we wish to minimize the prediction errorand maintain a range of individual fitnesses regardless ofwhether the range in errors is large or small. The fitness func-tion we use to accomplish this goal isFmin + Emax−E
Emax−Emin×
(Fmax − Fmin), whereE is the error of the individual (tem-plate set),Emin andEmax are the minimum and maximumerrors of individuals in the generation, andFmin andFmaxare the desired minimum and maximum fitnesses desired.We choseFmax = 4Fmin.
We use a common technique called stochastic samplingwith replacement to select which individuals will mate toproduce the next generation. In this technique, each parent isselected from the individuals by selecting individuali withprobability Fi∑
F.
The mating or crossover process is accomplished by ran-domly selecting pairs of individuals to mate and replac-ing each pair by their children in the new population. Thecrossover of two individuals proceeds in a slightly nonstan-dard way because our chromosomes are not fixed lengthbut a multiple of the number of bits used to represent eachtemplate. Two children are produced from each crossoverby randomly selecting a templatei and a positionp inthe template from the first individualT1 = t1,1, . . . , t1,n
and randomly selecting a templatej in the second indi-vidual T2 = t2,1, . . . , t2,m so that the resulting individualswill not have more than 10 templates. The new individualsare thenT̃1 = t1,1, . . . , t1,i−1, n1, t2,j+1, . . . , t2,m andT̃2 =t2,1, . . . , t2,j−1, n2, t1,i+1, . . . , ti,n. If there areb bits usedto represent each template,n1 is the firstp bits of t1,i con-catenated with the lastb − p bits of t2,j , andn2 is the firstp bits of t2,j concatenated with the lastb − p bits of t1,i .
In addition to using crossover to produce the individualsof the next generation, we also use a process called elitismwhereby the best individuals in each generation survive un-mutated to the next generation. We use crossover to pro-duce all but 2 individuals for each new generation and useelitism to select the last 2 individuals for each new genera-tion. The individuals resulting from the crossover process aremutated to help maintain a diversity in the population. Eachbit representing the individuals is flipped with a probabilityof 0.01.
3. Experimental results
In the rest of this paper, we discuss experimental stud-ies that we have performed to evaluate the effectiveness ofour techniques and the significance of the refinements justnoted.
3.1. Greedy search
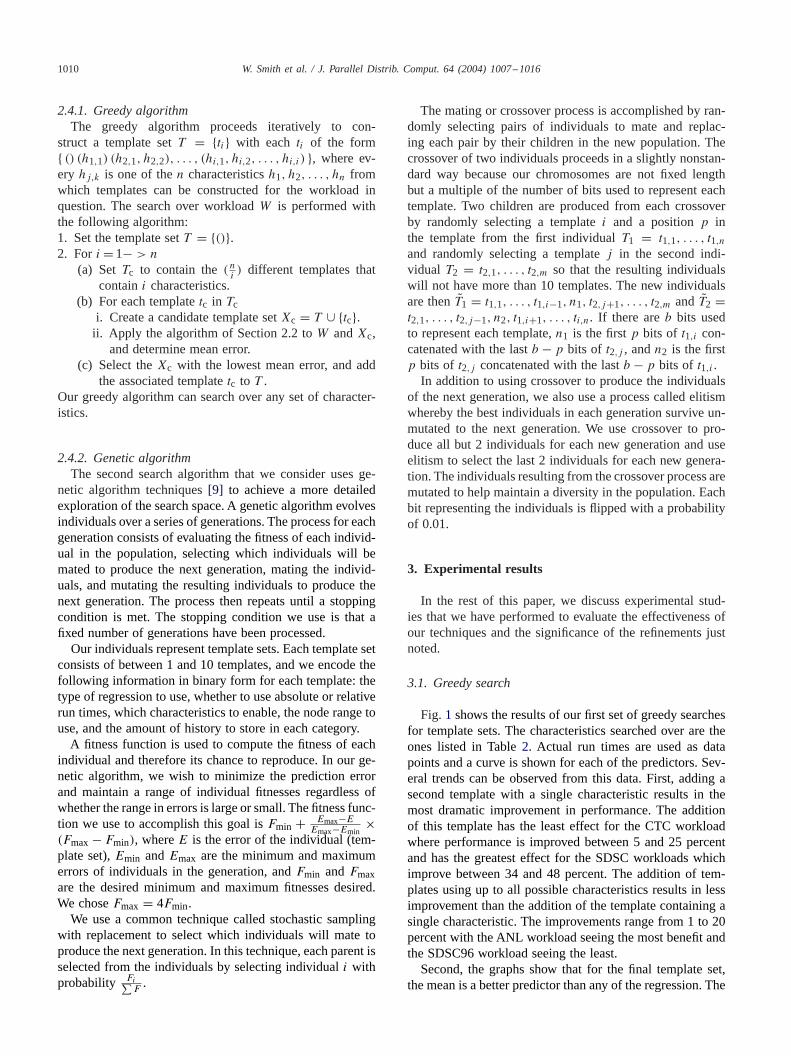
Fig. 1 shows the results of our first set of greedy searchesfor template sets. The characteristics searched over are theones listed in Table2. Actual run times are used as datapoints and a curve is shown for each of the predictors. Sev-eral trends can be observed from this data. First, adding asecond template with a single characteristic results in themost dramatic improvement in performance. The additionof this template has the least effect for the CTC workloadwhere performance is improved between 5 and 25 percentand has the greatest effect for the SDSC workloads whichimprove between 34 and 48 percent. The addition of tem-plates using up to all possible characteristics results in lessimprovement than the addition of the template containing asingle characteristic. The improvements range from 1 to 20percent with the ANL workload seeing the most benefit andthe SDSC96 workload seeing the least.
Second, the graphs show that for the final template set,the mean is a better predictor than any of the regression. The
W. Smith et al. / J. Parallel Distrib. Comput. 64 (2004) 1007–1016 1011
70
80
90
100
110
120
130
140
1 2 3 4 5
Mea
n E
rror
(m
inut
es)
Number of Templates
Workload ANL
Linear RegressionLogarithmic Regression
Inverse RegressionMean
150
160
170
180
190
200
210
220
230
1 2 3 4 5 6
Mea
n E
rror
(m
inut
es)
Number of Templates
Workload CTC
Linear RegressionLogarithmic Regression
Inverse RegressionMean
70
80
90
100
110
120
130
140
150
1 2 3
Mea
n E
rror
(m
inut
es)
Number of Templates
Workload SDSC95
Linear RegressionLogarithmic Regression
Inverse RegressionMean
70
80
90
100
110
120
130
140
150
1 2 3
Mea
n E
rror
(m
inut
es)
Number of Templates
Workload SDSC96
Linear RegressionLogarithmic Regression
Inverse RegressionMean
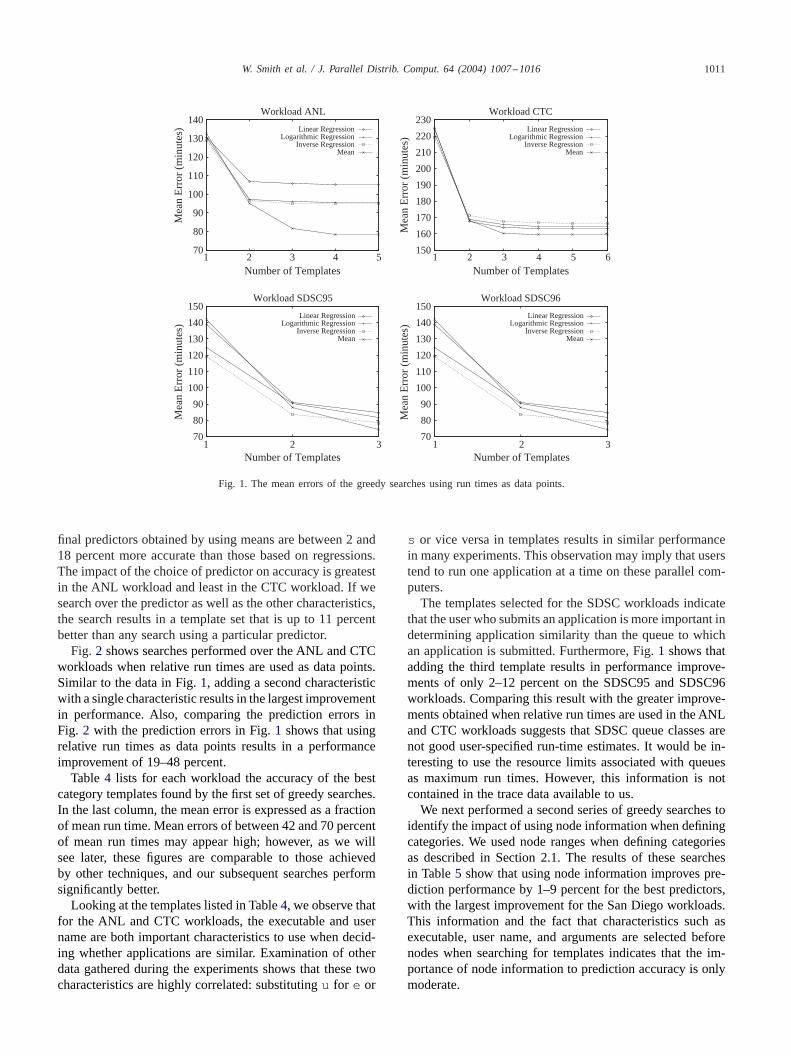
Fig. 1. The mean errors of the greedy searches using run times as data points.
final predictors obtained by using means are between 2 and18 percent more accurate than those based on regressions.The impact of the choice of predictor on accuracy is greatestin the ANL workload and least in the CTC workload. If wesearch over the predictor as well as the other characteristics,the search results in a template set that is up to 11 percentbetter than any search using a particular predictor.
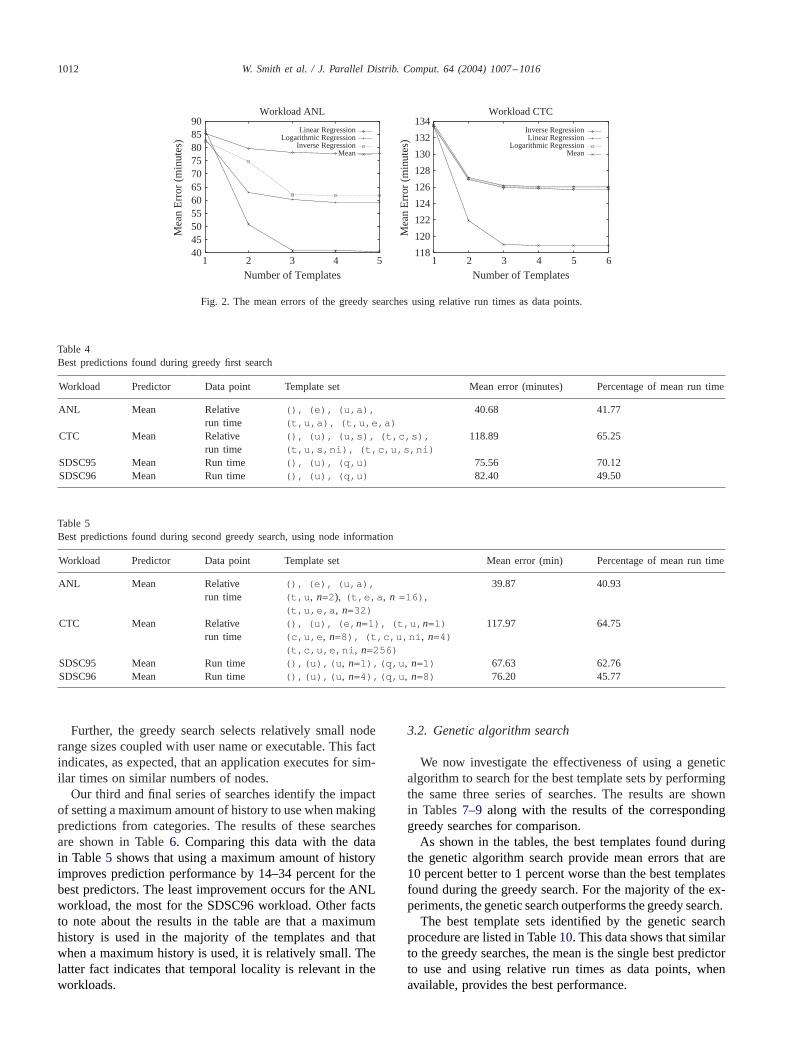
Fig. 2 shows searches performed over the ANL and CTCworkloads when relative run times are used as data points.Similar to the data in Fig.1, adding a second characteristicwith a single characteristic results in the largest improvementin performance. Also, comparing the prediction errors inFig. 2 with the prediction errors in Fig.1 shows that usingrelative run times as data points results in a performanceimprovement of 19–48 percent.
Table4 lists for each workload the accuracy of the bestcategory templates found by the first set of greedy searches.In the last column, the mean error is expressed as a fractionof mean run time. Mean errors of between 42 and 70 percentof mean run times may appear high; however, as we willsee later, these figures are comparable to those achievedby other techniques, and our subsequent searches performsignificantly better.
Looking at the templates listed in Table4, we observe thatfor the ANL and CTC workloads, the executable and username are both important characteristics to use when decid-ing whether applications are similar. Examination of otherdata gathered during the experiments shows that these twocharacteristics are highly correlated: substitutingu for e or
s or vice versa in templates results in similar performancein many experiments. This observation may imply that userstend to run one application at a time on these parallel com-puters.
The templates selected for the SDSC workloads indicatethat the user who submits an application is more important indetermining application similarity than the queue to whichan application is submitted. Furthermore, Fig.1 shows thatadding the third template results in performance improve-ments of only 2–12 percent on the SDSC95 and SDSC96workloads. Comparing this result with the greater improve-ments obtained when relative run times are used in the ANLand CTC workloads suggests that SDSC queue classes arenot good user-specified run-time estimates. It would be in-teresting to use the resource limits associated with queuesas maximum run times. However, this information is notcontained in the trace data available to us.
We next performed a second series of greedy searches toidentify the impact of using node information when definingcategories. We used node ranges when defining categoriesas described in Section 2.1. The results of these searchesin Table5 show that using node information improves pre-diction performance by 1–9 percent for the best predictors,with the largest improvement for the San Diego workloads.This information and the fact that characteristics such asexecutable, user name, and arguments are selected beforenodes when searching for templates indicates that the im-portance of node information to prediction accuracy is onlymoderate.
1012 W. Smith et al. / J. Parallel Distrib. Comput. 64 (2004) 1007–1016
4045505560657075808590
1 2 3 4 5
Mea
n E
rror
(m
inut
es)
Number of Templates
Workload ANL
Linear RegressionLogarithmic Regression
Inverse RegressionMean
118
120
122
124
126
128
130
132
134
1 2 3 4 5 6
Mea
n E
rror
(m
inut
es)
Number of Templates
Workload CTC
Inverse RegressionLinear Regression
Logarithmic RegressionMean
Fig. 2. The mean errors of the greedy searches using relative run times as data points.
Table 4Best predictions found during greedy first search
Workload Predictor Data point Template set Mean error (minutes) Percentage of mean run time
ANL Mean Relative (), (e), (u,a), 40.68 41.77run time (t,u,a), (t,u,e,a)
CTC Mean Relative (), (u), (u,s), (t,c,s), 118.89 65.25run time (t,u,s,ni), (t,c,u,s,ni)
SDSC95 Mean Run time (), (u), (q,u) 75.56 70.12SDSC96 Mean Run time (), (u), (q,u) 82.40 49.50
Table 5Best predictions found during second greedy search, using node information
Workload Predictor Data point Template set Mean error (min) Percentage of mean run time
ANL Mean Relative (), (e), (u,a), 39.87 40.93run time (t,u , n=2), (t,e,a , n =16) ,
(t,u,e,a , n=32)CTC Mean Relative (), (u), (e, n=1), (t,u, n=1) 117.97 64.75
run time (c,u,e , n=8), (t,c,u,ni , n=4)(t,c,u,e,ni , n=256)
SDSC95 Mean Run time (),(u),(u , n=1),(q,u , n=1) 67.63 62.76SDSC96 Mean Run time (),(u),(u , n=4),(q,u , n=8) 76.20 45.77
Further, the greedy search selects relatively small noderange sizes coupled with user name or executable. This factindicates, as expected, that an application executes for sim-ilar times on similar numbers of nodes.
Our third and final series of searches identify the impactof setting a maximum amount of history to use when makingpredictions from categories. The results of these searchesare shown in Table6. Comparing this data with the datain Table5 shows that using a maximum amount of historyimproves prediction performance by 14–34 percent for thebest predictors. The least improvement occurs for the ANLworkload, the most for the SDSC96 workload. Other factsto note about the results in the table are that a maximumhistory is used in the majority of the templates and thatwhen a maximum history is used, it is relatively small. Thelatter fact indicates that temporal locality is relevant in theworkloads.
3.2. Genetic algorithm search
We now investigate the effectiveness of using a geneticalgorithm to search for the best template sets by performingthe same three series of searches. The results are shownin Tables7–9 along with the results of the correspondinggreedy searches for comparison.
As shown in the tables, the best templates found duringthe genetic algorithm search provide mean errors that are10 percent better to 1 percent worse than the best templatesfound during the greedy search. For the majority of the ex-periments, the genetic search outperforms the greedy search.
The best template sets identified by the genetic searchprocedure are listed in Table10. This data shows that similarto the greedy searches, the mean is the single best predictorto use and using relative run times as data points, whenavailable, provides the best performance.
W. Smith et al. / J. Parallel Distrib. Comput. 64 (2004) 1007–1016 1013
Table 6Best predictions found during third greedy search
Workload Predictor Data point Template set Mean error (min) Percentage of mean run time
ANL Mean Relative (),(e),(u,mh=4), 34.28 35.20run time (t,u,mh=16),
(e,a, n=64,mh=4),(t,e,a, n=1,mh=8),(t,u,e,a, n=16,mh=8)
SDSC95 Mean Run time (),(u),(q,mh=4), 48.33 45.16(u, n=8,mh=8),(q,u, n=1,mh=32)
SDSC96 Mean Run time (),(u),(q,mh=4), 50.14 30.12(u, n=4,mh=4)(q,u, n=1,mh=16)
Table 7Performance of the best templates found during first genetic algorithmsearch
Workload Genetic algorithm Greedy
Mean error Percentage of Mean error Percentage of(min) mean run time (min) mean run time
ANL 39.32 40.37 40.68 41.77CTC 107.02 58.74 118.89 65.25SDSC95 65.27 60.57 75.56 70.12SDSC96 80.37 48.28 82.40 49.50
Table 8Performance of the best templates found during second genetic algorithmsearch
Workload Genetic algorithm Greedy
Mean error Percentage of Mean error Percentage of(min) mean run time (min) mean run time
ANL 38.79 39.83 39.87 40.93CTC 106.25 58.32 118.05 64.80SDSC95 60.03 55.71 67.63 62.76SDSC96 74.75 44.90 76.20 45.77
Table 9Performance of the best templates found during third genetic algorithmsearch
Workload Genetic algorithm Greedy
Mean error Percentage of Mean error Percentage of(min) mean run time (min) mean run time
ANL 34.52 35.44 34.28 35.20CTC 98.28 53.95 No data No dataSDSC95 43.20 40.09 48.33 45.16SDSC96 47.47 28.51 50.14 30.12
Another observation is that node information and a max-imum history are used throughout the best templates foundduring the genetic search. This confirms the observation
Table 10The best templates found during genetic algorithm search
Workload Predictor Data point Template set
ANL Mean Relative (u,e, n=128,mh=16384),run time (u,e, n=16,mh=4),
(t,e, n=16,mh=128),(t,u, n=4,mh=inf),(t,u,a, n=4,mh=4),(t,u,a, n=64,mh=4),(t,u,e,a, n=64,mh=32)
CTC Mean Relative (u, n=64,mh=8),run time (c,s, n=32,mh=128),
(c,s, n=32,mh=256),(c,u,ni, n=256,mh=128),(t,u,s, n=1,mh=16),(t,c,u,ni, n=256,mh=32),(t,c,u,ni, n=4,mh=16384),(t,c,u,s,ni, n=1,mh=4)
SDSC95 Mean Run time (q,u, n=4,mh=4),(q,u, n=4,mh=64),(q,u, n=4,mh=8)(q,u, n=16,mh=1024),(q,u, n=2,mh=4),
SDSC96 Mean Run time (q,u, n=4,mh=1024),(q,u, n=4,mh=2048),(q,u, n=4,mh=4096),(q,u, n=4,mh=65536),(q,u, n=4,mh=8)
made during the greedy search that using this informationwhen defining templates results in improved prediction per-formance.
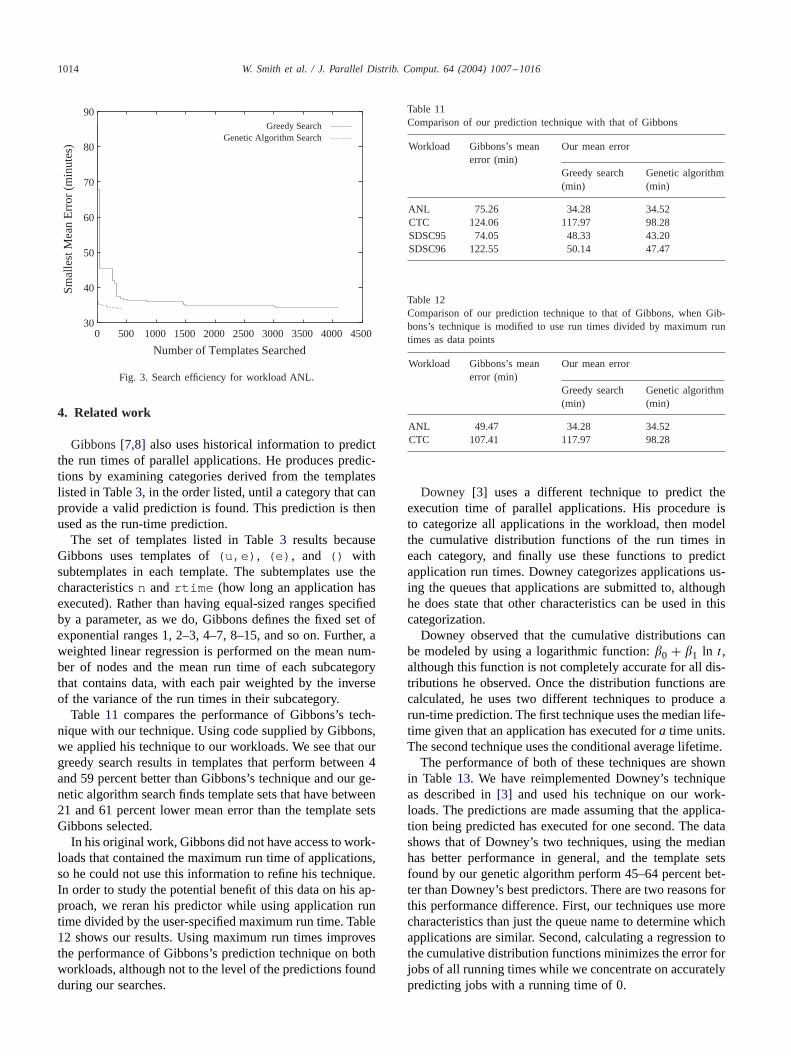
Fig. 3 shows the progress of the two different search al-gorithms for a search of template sets for the ANL workloadthat use the number of nodes requested, limit the maximumhistory, either actual or relative run times, and use any ofthe predictors. The graph shows that while both searches re-sult in template sets that have nearly the same accuracy, thegenetic algorithm search does so much more quickly. Thisfact is important because a simulation that takes minutes orhours is performed to evaluate each template set.
1014 W. Smith et al. / J. Parallel Distrib. Comput. 64 (2004) 1007–1016
30
40
50
60
70
80
90
0 500 1000 1500 2000 2500 3000 3500 4000 4500
Sm
alle
st M
ean
Err
or (
min
utes
)
Number of Templates Searched
Greedy SearchGenetic Algorithm Search
Fig. 3. Search efficiency for workload ANL.
4. Related work
Gibbons[7,8] also uses historical information to predictthe run times of parallel applications. He produces predic-tions by examining categories derived from the templateslisted in Table3, in the order listed, until a category that canprovide a valid prediction is found. This prediction is thenused as the run-time prediction.
The set of templates listed in Table3 results becauseGibbons uses templates of(u,e) , (e) , and () withsubtemplates in each template. The subtemplates use thecharacteristicsn and rtime (how long an application hasexecuted). Rather than having equal-sized ranges specifiedby a parameter, as we do, Gibbons defines the fixed set ofexponential ranges 1, 2–3, 4–7, 8–15, and so on. Further, aweighted linear regression is performed on the mean num-ber of nodes and the mean run time of each subcategorythat contains data, with each pair weighted by the inverseof the variance of the run times in their subcategory.
Table 11 compares the performance of Gibbons’s tech-nique with our technique. Using code supplied by Gibbons,we applied his technique to our workloads. We see that ourgreedy search results in templates that perform between 4and 59 percent better than Gibbons’s technique and our ge-netic algorithm search finds template sets that have between21 and 61 percent lower mean error than the template setsGibbons selected.
In his original work, Gibbons did not have access to work-loads that contained the maximum run time of applications,so he could not use this information to refine his technique.In order to study the potential benefit of this data on his ap-proach, we reran his predictor while using application runtime divided by the user-specified maximum run time. Table12 shows our results. Using maximum run times improvesthe performance of Gibbons’s prediction technique on bothworkloads, although not to the level of the predictions foundduring our searches.
Table 11Comparison of our prediction technique with that of Gibbons
Workload Gibbons’s mean Our mean errorerror (min)
Greedy search Genetic algorithm(min) (min)
ANL 75.26 34.28 34.52CTC 124.06 117.97 98.28SDSC95 74.05 48.33 43.20SDSC96 122.55 50.14 47.47
Table 12Comparison of our prediction technique to that of Gibbons, when Gib-bons’s technique is modified to use run times divided by maximum runtimes as data points
Workload Gibbons’s mean Our mean errorerror (min)
Greedy search Genetic algorithm(min) (min)
ANL 49.47 34.28 34.52CTC 107.41 117.97 98.28
Downey [3] uses a different technique to predict theexecution time of parallel applications. His procedure isto categorize all applications in the workload, then modelthe cumulative distribution functions of the run times ineach category, and finally use these functions to predictapplication run times. Downey categorizes applications us-ing the queues that applications are submitted to, althoughhe does state that other characteristics can be used in thiscategorization.
Downey observed that the cumulative distributions canbe modeled by using a logarithmic function:�0 + �1 ln t ,although this function is not completely accurate for all dis-tributions he observed. Once the distribution functions arecalculated, he uses two different techniques to produce arun-time prediction. The first technique uses the median life-time given that an application has executed fora time units.The second technique uses the conditional average lifetime.
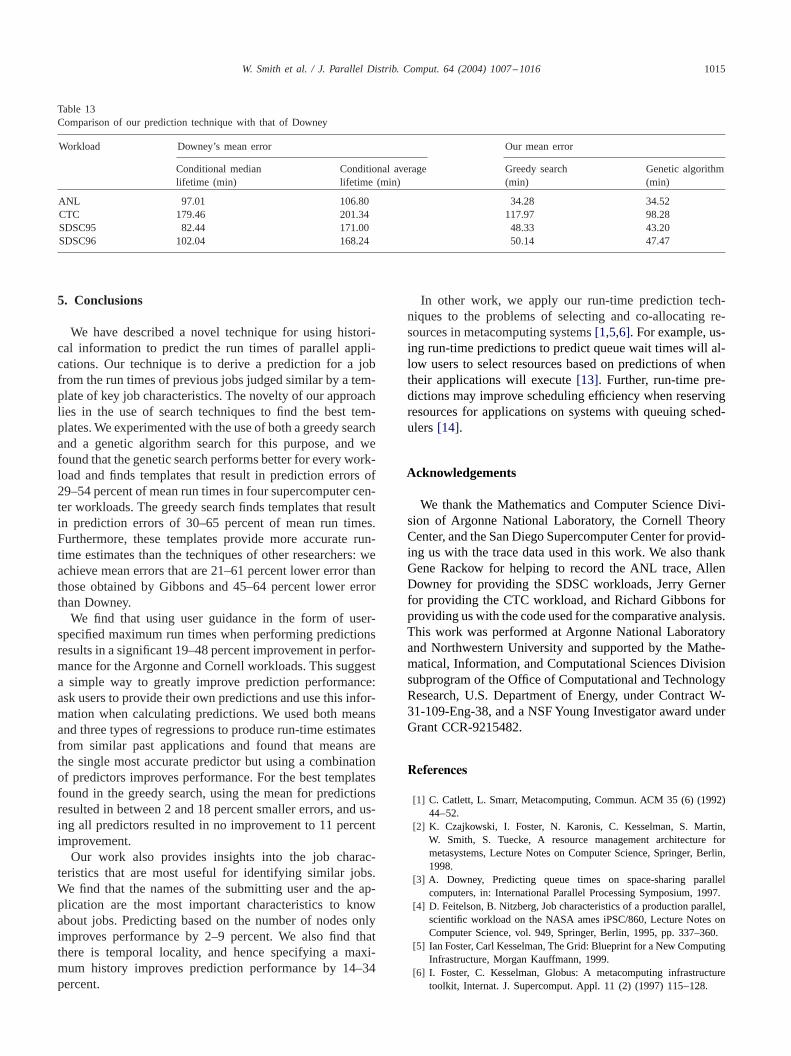
The performance of both of these techniques are shownin Table 13. We have reimplemented Downey’s techniqueas described in[3] and used his technique on our work-loads. The predictions are made assuming that the applica-tion being predicted has executed for one second. The datashows that of Downey’s two techniques, using the medianhas better performance in general, and the template setsfound by our genetic algorithm perform 45–64 percent bet-ter than Downey’s best predictors. There are two reasons forthis performance difference. First, our techniques use morecharacteristics than just the queue name to determine whichapplications are similar. Second, calculating a regression tothe cumulative distribution functions minimizes the error forjobs of all running times while we concentrate on accuratelypredicting jobs with a running time of 0.
W. Smith et al. / J. Parallel Distrib. Comput. 64 (2004) 1007–1016 1015
Table 13Comparison of our prediction technique with that of Downey
Workload Downey’s mean error Our mean error
Conditional median Conditional average Greedy search Genetic algorithmlifetime (min) lifetime (min) (min) (min)
ANL 97.01 106.80 34.28 34.52CTC 179.46 201.34 117.97 98.28SDSC95 82.44 171.00 48.33 43.20SDSC96 102.04 168.24 50.14 47.47
5. Conclusions
We have described a novel technique for using histori-cal information to predict the run times of parallel appli-cations. Our technique is to derive a prediction for a jobfrom the run times of previous jobs judged similar by a tem-plate of key job characteristics. The novelty of our approachlies in the use of search techniques to find the best tem-plates. We experimented with the use of both a greedy searchand a genetic algorithm search for this purpose, and wefound that the genetic search performs better for every work-load and finds templates that result in prediction errors of29–54 percent of mean run times in four supercomputer cen-ter workloads. The greedy search finds templates that resultin prediction errors of 30–65 percent of mean run times.Furthermore, these templates provide more accurate run-time estimates than the techniques of other researchers: weachieve mean errors that are 21–61 percent lower error thanthose obtained by Gibbons and 45–64 percent lower errorthan Downey.
We find that using user guidance in the form of user-specified maximum run times when performing predictionsresults in a significant 19–48 percent improvement in perfor-mance for the Argonne and Cornell workloads. This suggesta simple way to greatly improve prediction performance:ask users to provide their own predictions and use this infor-mation when calculating predictions. We used both meansand three types of regressions to produce run-time estimatesfrom similar past applications and found that means arethe single most accurate predictor but using a combinationof predictors improves performance. For the best templatesfound in the greedy search, using the mean for predictionsresulted in between 2 and 18 percent smaller errors, and us-ing all predictors resulted in no improvement to 11 percentimprovement.
Our work also provides insights into the job charac-teristics that are most useful for identifying similar jobs.We find that the names of the submitting user and the ap-plication are the most important characteristics to knowabout jobs. Predicting based on the number of nodes onlyimproves performance by 2–9 percent. We also find thatthere is temporal locality, and hence specifying a maxi-mum history improves prediction performance by 14–34percent.
In other work, we apply our run-time prediction tech-niques to the problems of selecting and co-allocating re-sources in metacomputing systems[1,5,6]. For example, us-ing run-time predictions to predict queue wait times will al-low users to select resources based on predictions of whentheir applications will execute[13]. Further, run-time pre-dictions may improve scheduling efficiency when reservingresources for applications on systems with queuing sched-ulers[14].
Acknowledgements
We thank the Mathematics and Computer Science Divi-sion of Argonne National Laboratory, the Cornell TheoryCenter, and the San Diego Supercomputer Center for provid-ing us with the trace data used in this work. We also thankGene Rackow for helping to record the ANL trace, AllenDowney for providing the SDSC workloads, Jerry Gernerfor providing the CTC workload, and Richard Gibbons forproviding us with the code used for the comparative analysis.This work was performed at Argonne National Laboratoryand Northwestern University and supported by the Mathe-matical, Information, and Computational Sciences Divisionsubprogram of the Office of Computational and TechnologyResearch, U.S. Department of Energy, under Contract W-31-109-Eng-38, and a NSF Young Investigator award underGrant CCR-9215482.
References
[1] C. Catlett, L. Smarr, Metacomputing, Commun. ACM 35 (6) (1992)44–52.
[2] K. Czajkowski, I. Foster, N. Karonis, C. Kesselman, S. Martin,W. Smith, S. Tuecke, A resource management architecture formetasystems, Lecture Notes on Computer Science, Springer, Berlin,1998.
[3] A. Downey, Predicting queue times on space-sharing parallelcomputers, in: International Parallel Processing Symposium, 1997.
[4] D. Feitelson, B. Nitzberg, Job characteristics of a production parallel,scientific workload on the NASA ames iPSC/860, Lecture Notes onComputer Science, vol. 949, Springer, Berlin, 1995, pp. 337–360.
[5] Ian Foster, Carl Kesselman, The Grid: Blueprint for a New ComputingInfrastructure, Morgan Kauffmann, 1999.
[6] I. Foster, C. Kesselman, Globus: A metacomputing infrastructuretoolkit, Internat. J. Supercomput. Appl. 11 (2) (1997) 115–128.

1016 W. Smith et al. / J. Parallel Distrib. Comput. 64 (2004) 1007–1016
[7] R. Gibbons, A historical application profiler for use by parallelschedulers, Lecture Notes on Comput. Science, vol. 1297, Springer,Berlin, 1997, pp. 58–75.
[8] R. Gibbons, A historical profiler for use by parallel schedulers,Master’s Thesis, University of Toronto, 1997.
[9] D.E. Goldberg, Genetic Algorithms in Search, Optimization, andMachine Learning, Addison-Wesley, Reading, MA, 1989.
[10] W. Smith, Resource management in metacomputing environments,Ph.D. Thesis, Northwestern University, December 1999.
[11] W. Smith, I. Foster, V. Taylor, Scheduling with advanced reservations,in: Proceedings of the 2000 International Parallel and DistributedProcessing Symposium, May 2000.
[12] W. Smith, V. Taylor, I. Foster, Using run-time predictions to estimatequeue wait times and improve scheduler performance, in: Proceedingsof the IPPS/SPDP’99 Workshop on Job Scheduling Strategies forParallel Processing,1999.
[13] Warren Smith, Valerie Taylor, Ian Foster, Using Run-Time Predictionsto Estimate Queue Wait Times and Improve Scheduler Performance,in: Dror Feitelson, Larry Rudolph (Eds.), Lecture Notes on ComputerScience, vol. 1659, Springer-Verlag, 1999, pp. 202–219.
[14] Warren Smith, Ian Foster, Valerie Taylor, Scheduling with AdvancedReservations, in: Proceedings of the 2000 International parallel andDistributed Processing Symposium, May 2000.
Warren Smith is currently a senior com-puter scientist working for Computer Sci-ences Corporation in the NASA AdvancedSupercomputing Division of NASA AmesResearch Center. His research interests liein the area of distributed systems includ-ing performance prediction, scheduling, in-formation systems, and event management.He received B.S. and M.S. degrees fromthe Johns Hopkins University and M.S. andPh.D. degrees from Northwestern University.
Ian Foster holds a joint appointment asthe Associate Division Director of theMathematics and Computer Science Di-vision at Argonne National Laboratoryand Arthur Holly Compton Professor ofComputer Science at the University ofChicago. His research is focused on toolsand techniques that allow people to usehigh-performance computing technologiesto do qualitatively new things. This involvesinvestigations of parallel and distributedlanguages, algorithms, and communication;and also focused work on applications.
Ian Foster is particularly interested in using high-performance network-ing to incorporate remote compute and information resources into localcomputational environments.
Valerie E. Taylor earned her Ph.D. in Elec-trical Engineering and Computer Sciencefrom the University of California, Berke-ley, in 1991. From 1991-2002, she wasa member of the faculty of NorthwesternUniversity. Valerie Taylor has since joinedthe faculty of Texas A&M University asHead of the Texas A&M Engineering De-partment of Computer Science and holderof the Stewart & Stevenson ProfessorshipII. Her research interests are in the areasof computer architecture and high perfor-mance computing, with particular emphasis
on mesh partitioning for distributed systems and the performance ofparallel and distributed applications. She has authored or co-authored over80 publications in these areas. Valerie Taylor is a senior member of IEEEand a member of ACM.