Predicted present-day evolution patterns of ice thickness...
8
Predicted present-day evolution patterns of ice thickness and bedrock elevation over Greenland and Antarctica Philippe Huybrechts & Emmanuel Le Meur This paper discusses predicted evolution patterns of present-day changes of ice thickness, surface elevation, and bedrock elevation over the Greenland and Antarctic continents. These were obtained from calculations with dynamic 3-D ice sheet models which were coupled to a visco-elastic solid Earth model. The experiments were initialized over the last two glacial cycles and subsequently averaged over the last 200 years to obtain the current evolution. The calculations indicate that the Antarctic Ice Sheet is still adjusting to the last glacial-interglacial transition yielding a decreasing ice volume and a rising bedrock elevation of the order of several centimetres per year. The Greenland Ice Sheet was found to be close to a stationary state with a mean thickness change of only a few millimetres per year, but the calculations revealed large spatial differences. Predicted patterns over Greenland are characterized by a small thickening over the ice sheet interior and a general thinning of the ablation area. In Antarctica, almost all of the predicted changes are concentrated in the West Antarctic Ice Sheet, which is still retreating at both the Weddell and Ross Sea margins. Over most of both ice sheets, the model indicates that the surface elevation trend is dominated by ice thickness changes rather than by bedrock elevation changes. P. Huybrechts, Alfred- Wegener-lnstitut fiir Polar- und Meeresforschung, Postj$ach 120161, Columbusstrasse, 0-27515 Bremerhaven, Germany; E. Le Meur, British Antarctic Survey, High Cross, Madingley Road, CB3 OET Cambridge, UK. Introduction Despite recent advances in the understanding of polar ice sheets, their current evolution is still not known. Nevertheless, because of their long response time scales (of the order of lo3 to lo4 years), it is unlikely that the Antarctic and Greenland ice sheets have adjusted entirely to their past history of environmental boundary conditions. This inertia is caused by such processes such as isostasy, thermomechanical coupling, reaction to surface mass balance changes, and the advection of ice with different rheological properties in the basal shear layers. To correctly assess the future response of these ice sheets, it is thus necessary to be able to distinguish between the long-term "background" trend and the anthropogenically induced signal due to recent and future climatic changes (Huybrechts & de Wolde 1999). According to the Second IPCC Scientific Assessment (Wanick et al. 1996), global sea level has risen by 1&25 cm over the last century, with a best estimate of 18 cm. Half of this rise is usually accounted for by the middle estimates for thermal expansion and melting of glaciers. The remaining part, however, is largely unexplained. Because of the large dimensions of the polar ice sheets, a global sea level change of lOcm per century would correspond to only a 15% imbalance between annual mass gain (essentially snow accumulation) and mass loss (meltwater run-off and iceberg production from ice shelves or outlet glaciers) or, alternatively, a combined Antarctic and Greenland volume change of only 0.15%. None of the presently available measuring tech- niques to assess the imbalance of the polar ice sheets (e.g. mass budget studies, satellite altinie- try) is currently precise enough to constrain the present evolution of the polar ice sheets to even better than the total range of observed sea level rise (Warrick et al. 1996). Huybrechts & Le Meur 1999: Polar Research lt1(2), 299-306 299
Transcript of Predicted present-day evolution patterns of ice thickness...
Predicted present-day evolution patterns of ice thickness and bedrock elevation over Greenland and Antarctica
Philippe Huybrechts & Emmanuel Le Meur
This paper discusses predicted evolution patterns of present-day changes of ice thickness, surface elevation, and bedrock elevation over the Greenland and Antarctic continents. These were obtained from calculations with dynamic 3-D ice sheet models which were coupled to a visco-elastic solid Earth model. The experiments were initialized over the last two glacial cycles and subsequently averaged over the last 200 years to obtain the current evolution. The calculations indicate that the Antarctic Ice Sheet is still adjusting to the last glacial-interglacial transition yielding a decreasing ice volume and a rising bedrock elevation of the order of several centimetres per year. The Greenland Ice Sheet was found to be close to a stationary state with a mean thickness change of only a few millimetres per year, but the calculations revealed large spatial differences. Predicted patterns over Greenland are characterized by a small thickening over the ice sheet interior and a general thinning of the ablation area. In Antarctica, almost all of the predicted changes are concentrated in the West Antarctic Ice Sheet, which is still retreating at both the Weddell and Ross Sea margins. Over most of both ice sheets, the model indicates that the surface elevation trend is dominated by ice thickness changes rather than by bedrock elevation changes.
P. Huybrechts, Alfred- Wegener-lnstitut fiir Polar- und Meeresforschung, Postj$ach 120161, Columbusstrasse, 0-27515 Bremerhaven, Germany; E. Le Meur, British Antarctic Survey, High Cross, Madingley Road, CB3 OET Cambridge, UK.
Introduction
Despite recent advances in the understanding of polar ice sheets, their current evolution is still not known. Nevertheless, because of their long response time scales (of the order of lo3 to lo4 years), it is unlikely that the Antarctic and Greenland ice sheets have adjusted entirely to their past history of environmental boundary conditions. This inertia is caused by such processes such as isostasy, thermomechanical coupling, reaction to surface mass balance changes, and the advection of ice with different rheological properties in the basal shear layers. To correctly assess the future response of these ice sheets, it is thus necessary to be able to distinguish between the long-term "background" trend and the anthropogenically induced signal due to recent and future climatic changes (Huybrechts & de Wolde 1999).
According to the Second IPCC Scientific
Assessment (Wanick et al. 1996), global sea level has risen by 1&25 cm over the last century, with a best estimate of 18 cm. Half of this rise is usually accounted for by the middle estimates for thermal expansion and melting of glaciers. The remaining part, however, is largely unexplained. Because of the large dimensions of the polar ice sheets, a global sea level change of lOcm per century would correspond to only a 15% imbalance between annual mass gain (essentially snow accumulation) and mass loss (meltwater run-off and iceberg production from ice shelves or outlet glaciers) or, alternatively, a combined Antarctic and Greenland volume change of only 0.15%. None of the presently available measuring tech- niques to assess the imbalance of the polar ice sheets (e.g. mass budget studies, satellite altinie- try) is currently precise enough to constrain the present evolution of the polar ice sheets to even better than the total range of observed sea level rise (Warrick et al. 1996).
Huybrechts & Le Meur 1999: Polar Research lt1(2), 299-306 299
* * * I . . *
____------
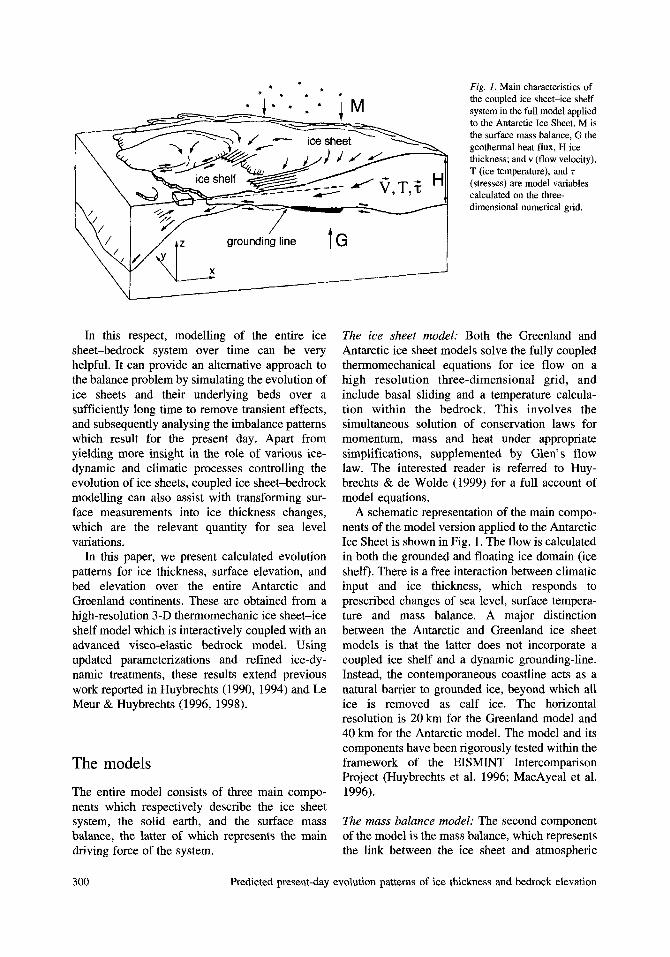
Fig. I . Main characteristics of the coupled ice sheet-ice shelf system in the full model applied to the Antarctic Ice Sheet. M is the surface mass balance, G the geothermal heat flux, H ice thickness: and v (flow velocity), T (ice temperature), and z (stresses) are model variables calculated on the three- dimensional numerical grid.
In this respect, modelling of the entire ice sheet-bedrock system over time can be very helpful. It can provide an alternative approach to the balance problem by simulating the evolution of ice sheets and their underlying beds over a sufficiently long time to remove transient effects, and subsequently analysing the imbalance patterns which result for the present day. Apart from yielding more insight in the role of various ice- dynamic and climatic processes controlling the evolution of ice sheets, coupled ice sheet-bedrock modelling can also assist with transforming sur- face measurements into ice thickness changes, which are the relevant quantity for sea level variations.
In this paper, we present calculated evolution patterns for ice thickness, surface elevation, and bed elevation over the entire Antarctic and Greenland continents. These are obtained from a high-resolution 3-D thermomechanic ice sheet-ice shelf model which is interactively coupled with an advanced visco-elastic bedrock model. Using updated parameterizations and refined ice-dy- namic treatments, these results extend previous work reported in Huybrechts (1990, 1994) and Le Meur & Huybrechts (1996, 1998).
The models
The entire model consists of three main compo- nents which respectively describe the ice sheet system, the solid earth, and the surface mass balance, the latter of which represents the main driving force of the system.
The ice sheet model: Both the Greenland and Antarctic ice sheet models solve the fully coupled thermomechanical equations for ice flow on a high resolution three-dimensional grid, and include basal sliding and a temperature calcula- tion within the bedrock. This involves the simultaneous solution of conservation laws for momentum, mass and heat under appropriate simplifications, supplemented by Glen’s flow law. The interested reader is referred to Huy- brechts & de Wolde (1999) for a full account of model equations.
A schematic representation of the main compo- nents of the model version applied to the Antarctic Ice Sheet is shown in Fig. 1. The flow is calculated in both the grounded and floating ice domain (ice shelf). There is a free interaction between climatic input and ice thickness, which responds to prescribed changes of sea level, surface tempera- ture and mass balance. A major distinction between the Antarctic and Greenland ice sheet models is that the latter does not incorporate a coupled ice shelf and a dynamic grounding-line. Instead, the contemporaneous coastline acts as a natural barrier to grounded ice, beyond which all ice is removed as calf ice. The horizontal resolution is 20km for the Greenland model and 40 km for the Antarctic model. The model and its components have been rigorously tested within the framework of the EISMINT Intercomparison Project (Huybrechts et al. 1996; MacAyeal et al. 1996).
The mass balance model: The second component of the model is the mass balance, which represents the link between the ice sheet and atmospheric
300 Predicted present-day evolution patterns of ice thickness and bedrock elevation
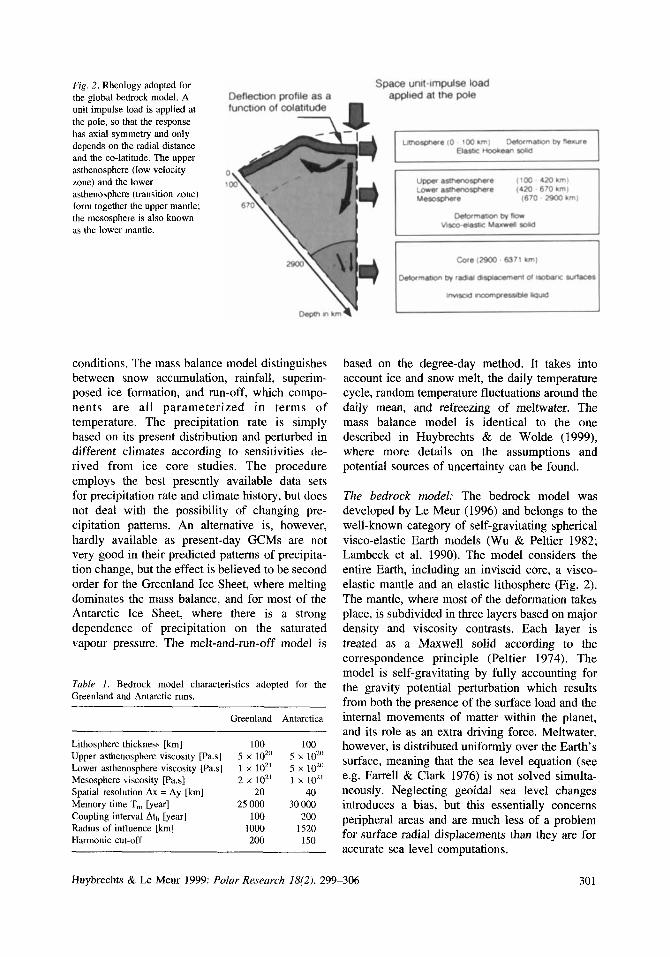
Fig. 2. Rheology adopted for the global bedrock model. A unit impulse load is applied at the pole, so that the response has axial symmetry and only depends on the radial distance and the co-latitude. The upper asthenosphere (low velocity zone) and the lower asthenosphere (transition zone) form together the upper mantle; the mesosphere is also known as the lower mantle.
conditions. The mass balance model distinguishes between snow accumulation, rainfall, superim- posed ice formation, and run-off, which compo- nents are all parameterized in terms of temperature. The precipitation rate is simply based on its present distribution and perturbed in different climates according to sensitivities de- rived from ice core studies. The procedure employs the best presently available data sets for precipitation rate and climate history, but does not deal with the possibility of changing pre- cipitation patterns. An alternative is, however, hardly available as present-day GCMs are not very good in their predicted patterns of precipita- tion change, but the effect is believed to be second order for the Greenland Ice Sheet, where melting dominates the mass balance, and for most of the Antarctic Ice Sheet, where there is a strong dependence of precipitation on the saturated vapour pressure. The melt-and-run-off model is
Table 1. Bedrock model characteristics adopted for the Greenland and Antarctic runs.
Lithosphere thickness [km] Upper asthenosphere viscosity [Pas] Lower asthenosphere viscosity [Pa.s] Mesosphere viscosity [Pas] Spatial resolution Ax = Ay [!a] Memory time T, [year] Coupling interval Atb [year] Radius of influence [km] Harmonic cut-off
Greenland Antarctica
100 5 x lozo 1 x 1O2l
2 x 10²' 20
25 000 100
1000 200
100 5 x lozo 5 x loz0 1 x lo2'
40 30 000
200 1520 150
based on the degree-day method. It takes into account ice and snow melt, the daily temperature cycle, random temperature fluctuations around the daily mean, and refreezing of meltwater. The mass balance model is identical to the one described in Huybrechts & de Wolde (1999), where more details on the assumptions and potential sources of uncertainty can be found.
The bedrock model: The bedrock model was developed by Le Meur (1996) and belongs to the well-known category of self-gravitating spherical visco-elastic Earth models (Wu & Peltier 1982; Lambeck et al. 1990). The model considers the entire Earth, including an inviscid core, a visco- elastic mantle and an elastic lithosphere (Fig. 2). The mantle, where most of the deformation takes place, is subdivided in three layers based on major density and viscosity contrasts. Each layer is treated as a Maxwell solid according to the correspondence principle (Peltier 1974). The model is self-gravitating by fully accounting for the gravity potential perturbation which results from both the presence of the surface load and the internal movements of matter within the planet, and its role as an extra driving force. Meltwater, however, is distributed uniformly over the Earth's surface, meaning that the sea level equation (see e.g. Farrell & Clark 1976) is not solved simulta- neously. Neglecting geoidal sea level changes introduces a bias, but this essentially concerns peripheral areas and are much less of a problem for surface radial displacements than they are for accurate sea level computations.
Huybrechts & Le Meur 1999: Polar Research 18(2). 299-306 301
The model is forced by a unit impulse load, giving rise to a set of surface displacement Love numbers which only depend on the Earth parameters such as the density and the Lame parameter profiles, the mantle viscosity, and the lithospheric thickness. The latter parameters are the major unknowns and can be inferred from optimizing a best fit between rebound data and isostatic models. Table 1 shows their values adopted for the present study. In particular the viscosity profile is subject to considerable debate (King 1995; Mitrovica & Forte 1997), but values used in this study are within the range presented in the literature.
Numerically, the isostatic response to a speci- fied loading scenario is obtained from a double space-time convolution of the resulting Green's function with the load within a predefined domain over the memory time T,, as explained in more detail in Le Meur & Huybrechts (1996, 1998).
The coupling of sub-models: The ice sheet model is interactively coupled with the atmosphere and the underlying bedrock. Mass balance and surface temperature are updated every 20 years to closely follow the effects of changing surface elevations. The coupling with the bedrock model is effec- tuated by feeding the isostasy model at intervals Atb with a window that contains the ice loading history over the preceding memory time T,, cf. Table 1. The latter period illustrates the memory effect, which means that all the loading events that occurred during these past T, years sig- nificantly contribute to the final deformation. This period has been chosen in accordance with the characteristic viscous time scales such that more than 99% of the total response is accounted for. The new bedrock profile obtained every At, years is then reinserted in the glaciological model so that the effects of bedrock changes on the ice dynamics can be fully accounted for.
The spatial convolution is restricted to within a distance around the central loading point given by the radius of influence (Table 1). This value was chosen to reach a satisfactory compromise be- tween the accuracy of the calculated response and the computational cost of the spatial convolution. Although the result still lacks part of the far-field response, the errors associated with the respective radii of influence are minute compared to the uncertainties arising from the rheological law or that from the Earth structure adopted. Compared to the usual two-level isostasy models employed in
ice sheet models (Le Meur & Huybrechts 1996), the approach adopted for this paper requires about ten times more memory and CPU time.
Calculation over the glacial cycles
The ice sheet and bedrock models were first initialized with calculations over the last one (Antarctica) or two (Greenland) glacial cycles. As starting conditions served output from a similar glacial cycle run at the present time, so that in total two, or four, glacial cycles were calculated. Such a period is more than sufficient for the models to forget their initial start-up conditions. It was assumed that the observed present-day bedrock is in isostatic equilibrium with the observed present- day ice and water loading.
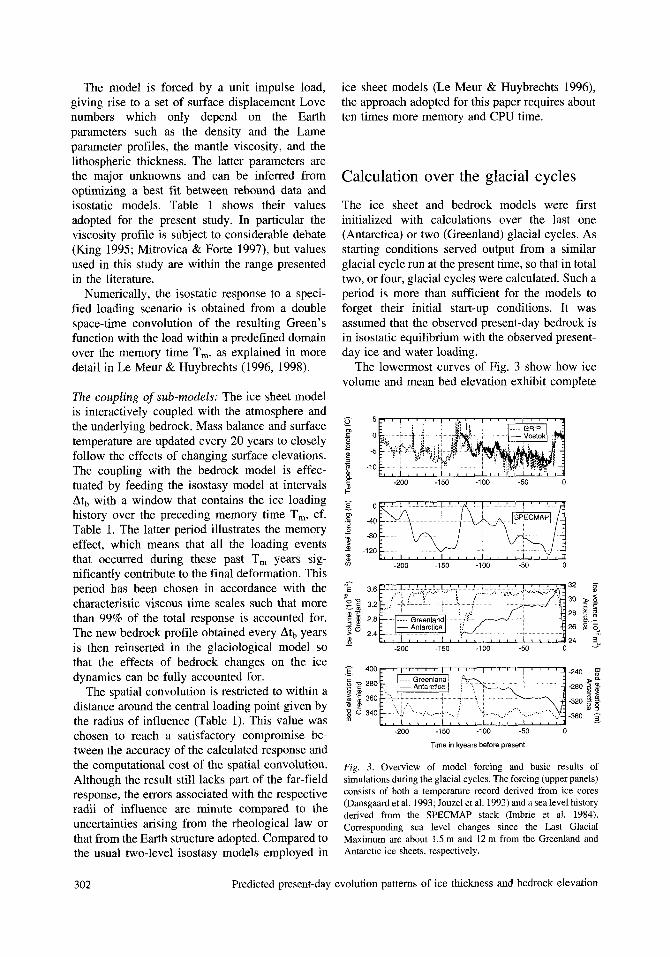
The lowermost curves of Fig. 3 show how ice volume and mean bed elevation exhibit complete
F
= -80 9 2 -120 I (0 -200 -150 -100 -50 0
32
30
28
26
24 -200 150 100 -50 0
-200 -150 -100 -50 0
Time in kyears before present
Fig. 3 . Overview of model forcing and basic results of simulations during the glacial cycles. The forcing (upper panels) consists of both a temperature record derived from ice cores (Dansgaard et al. 1993; Jouzel et al. 1993) and a sea level history derived from the SPECMAP stack (Imbrie et al. 1984). Corresponding sea level changes since the Last Glacial Maximum are about 1.5 m and 12 m from the Greenland and Antarctic ice sheets, respectively.
302 Predicted present-day evolution patterns of ice thickness and bedrock elevation
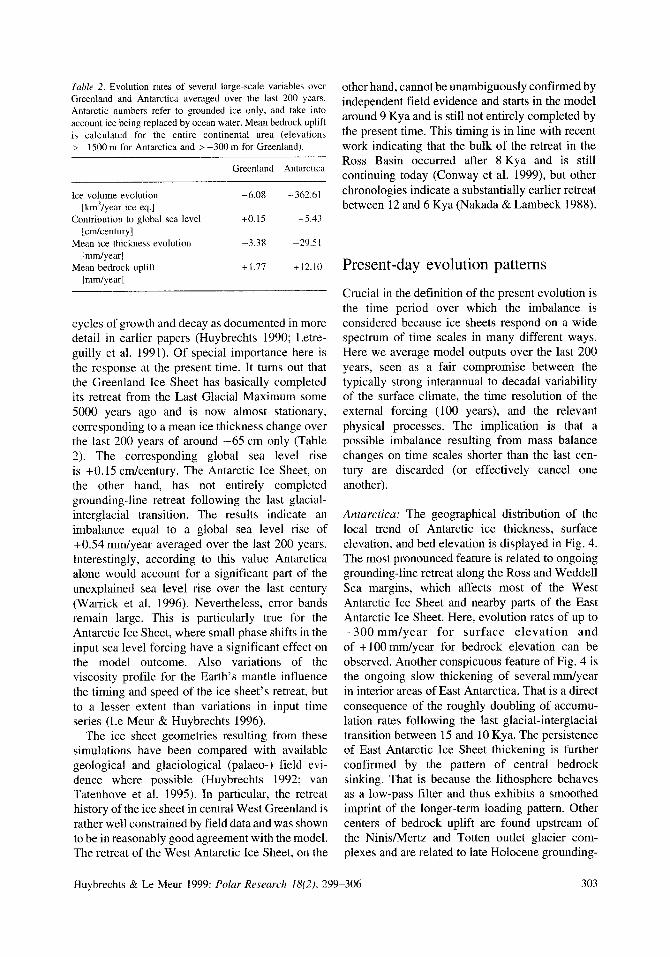
Table 2. Evolution rates of several large-scale variables over Greenland and Antarctica averaged over the last 200 years. Antarctic numbers refer to grounded ice only, and take into account ice being replaced by ocean water. Mean bedrock uplift is calculated for the entire continental area (elevations > - 1500 m for Antarctica and > -300 m for Greenland).
Greenland Antarctica
Ice volume evolution -6.08 -362.61 [km’/year ice eq.]
[cm/century]
[ mm/year]
[mm/year]
Contribution to global sea level +0.15 +5.43
Mean ice thickness evolution -3.38 --?O.S I
Mean bedrock uplift +1.77 +12.10
cycles of growth and decay as documented in more detail in earlier papers (Huybrechts 1990; Letre- guilly et al. 1991). Of special importance here is the response at the present time. It turns out that the Greenland Ice Sheet has basically completed its retreat from the Last Glacial Maximum some SO00 years ago and is now almost stationary, corresponding to a mean ice thickness change over the last 200 years of around -65 cm only (Table 2). The corresponding global sea level rise is +0.15 cdcentury. The Antarctic Ice Sheet, on the other hand, has not entirely completed grounding-line retreat following the last glacial- interglacial transition. The results indicate an imbalance equal to a global sea level rise of +OS4 mdyear averaged over the last 200 years. Interestingly, according to this value Antarctica alone would account for a significant part of the unexplained sea level rise over the last century (Warrick et al. 1996). Nevertheless, error bands remain large. This is particularly true for the Antarctic Ice Sheet, where small phase shifts in the input sea level forcing have a significant effect on the model outcome. Also variations of the viscosity profile for the Earth’s mantle influence the timing and speed of the ice sheet’s retreat, but to a lesser extent than variations in input time series (Le Meur & Huybrechts 1996).
The ice sheet geometries resulting from these simulations have been compared with available geological and glaciological (palaeo-) field evi- dence where possible (Huybrechts 1992; van Tatenhove et al. 1995). In particular, the retreat history of the ice sheet in central West Greenland is rather well constrained by field data and was shown to be in reasonably good agreement with the model. The retreat of the West Antarctic Ice Sheet, on the
other hand, cannot be unambiguously confirmed by independent field evidence and starts in the model around 9 Kya and is still not entirely completed by the present time. This timing is in line with recent work indicating that the bulk of the retreat in the Ross Basin occurred after 8 Kya and is still continuing today (Conway et al. 1999), but other chronologies indicate a substantially earlier retreat between 12 and 6 Kya (Nakada & Lambeck 1988).
Present-day evolution patterns
Crucial in the definition of the present evolution is the time period over which the imbalance is considered because ice sheets respond on a wide spectrum of time scales in many different ways. Here we average model outputs over the last 200 years, seen as a fair compromise between the typically strong interannual to decadal variability of the surface climate, the time resolution of the external forcing (100 years), and the relevant physical processes. The implication is that a possible imbalance resulting from mass balance changes on time scales shorter than the last cen- tury are discarded (or effectively cancel one another).
Antarctica: The geographical distribution of the local trend of Antarctic ice thickness, surface elevation, and bed elevation is displayed in Fig. 4. The most pronounced feature is related to ongoing grounding-line retreat along the Ross and Weddell Sea margins, which affects most of the West Antarctic Ice Sheet and nearby parts of the East Antarctic Ice Sheet. Here, evolution rates of up to -300 mm/year for surface elevation and of + 100 mdyear for bedrock elevation can be observed. Another conspicuous feature of Fig. 4 is the ongoing slow thickening of several mdyear in interior areas of East Antarctica. That is a direct consequence of the roughly doubling of accumu- lation rates following the last glacial-interglacial transition between 15 and 10 Kya. The persistence of East Antarctic Ice Sheet thickening is further confirmed by the pattern of central bedrock sinking. That is because the lithosphere behaves as a low-pass filter and thus exhibits a smoothed imprint of the longer-term loading pattern. Other centers of bedrock uplift are found upstream of the NinisNertz and Totten outlet glacier com- plexes and are related to late Holocene grounding-
Huybrechts & Le Meur 1999: Polar Research 18(2), 299-306 303
line retreat, which has by now come to an end as far as ice thickness changes are concerned. Unlike most of the ice sheet, in these areas the total surface elevation trend is dominated by bedrock uplift rather than by ice thickness changes.
Unfortunately, there exist few independent observations to evaluate the patterns presented in Fig. 4. Wingham et al. (1998) report satellite radar altimetry data for the period 1992-96. Their surface elevation changes exhibit remarkable similarities for the area north of 81.5"S, such as the small thickening over the East Antarctic plateau and the thinning by up to 100 &year in parts of West Antarctica, but the record is too short for firm conclusions and gives no data south of 8 1 S " S . Alternative predictions of crustal uplift based on prescribed ice mass histories have also been made (Wahr et al. 1995; James & Ivins 1998). These are consistent with uplift centers in West Antarctica and little vertical motion in East Antarctica, as found in this paper, but with significantly lower uplift rates of maximally 20-30Wyear. The latter may indicate that our result is biased by a too late deglaciation in West Antarctica. Also, our result was obtained from a coupled ice sheet-bedrock model. That might be the cause for substantial differences in the ice loading history required to infer the isostatic response, but this was not investigated further within the framework of this paper.
Greenland: Over Greenland, the surface evolution trend is clearly dominated by ice thickness changes, which absolute values are generally 3-10 times larger than the corresponding bedrock uplift rates (Fig. 5) . Despite a near overall equilibrium of the entire ice sheet, the geographi- cal pattern shows a clear distinction between a thickening of the accumulation area and a thinning of the ablation area. The surface eleva- tion change is highest over the southern half of the Greenland Ice Sheet with rates in excess of 20 mdyear, whereas thinning rates locally go up to -100mm/year, especially in the south- western and north-eastern parts of the ice sheet. The single most important explanation for this pattern is the recovery of the ice sheet from the Little Ice Age cooling which ended about 200 years ago, leading to both higher accumulation and run-off rates. Superimposed on this pattern are the effects of basal warming following the last glacial-interglacial transition, the downward pro- pagation of the harder Holocene ice, and heat
conduction in the bedrock, as discussed in more detail in Huybrechts (1994).
Incidentally, the broad picture of a small thickening in the interior and a mixed pattern of a substantially larger thinning in the ablation area is corroborated by recent mass budget studies (Thomas et al. 1998), as well as by results from satellite radar altimetry in the 1980s (Davis et al. 1998) and aircraft laser altimetry between 1993 and 1998 (Krabill et al. 1999). Whether this proves the validity of our model calculations cannot be answered at this stage, because the observational data refer to much shorter periods.
The pattern of bedrock uplift, on the other hand, is mainly determined by marginal ice sheet retreat and central ice sheet thickening since the Last Glacial Maximum. According to the model, this retreat is most pronounced in the south-western part, but occurs more recently in the north-east, as reflected in the resulting uplift rates. This pattern is dominated by the viscous response due to past loading events rather than by the elastic response due to the present-day ice thickness evolution (Huybrechts & Le Meur 1998).
Concluding remarks
This study has demonstrated the role coupled ice sheet-bedrock modelling can play to infer infor- mation about the present evolution of polar ice sheets. The strength of this approach is that it can generalize over the entire ice sheet and is able to yield both temporal and spatial trends. However, the results should also be interpreted with care. The ice thickness and surface elevation patterns depend significantly on the time period over which the imbalance is averaged and can only be as good as the models can deal with ice and bedrock dynamics and on how good past mass balance changes can be described. Both the ice sheet and the solid Earth model rely on rheologies with in part uncertain parameters that can have an appreciable effect on the model predictions. Additional sensitivity tests for crucial parameters within their ranges of uncertainty are required to properly evaluate the associated error bars. Also, recent climatic fluctuations on time scales shorter than the forcing and the time-averaging period would certainly produce a different pattern, although that the meaning of such a short-term imbalance can be questioned. It also implies that it
304 Predicted present-day evolution patterns of ice thickness and bedrock elevation

2 $ 5
Fig.
4. E
volu
tion
patte
rns
for t
he A
ntar
ctic
Ice
Shee
t whi
ch re
sult
for t
he p
rese
nt ti
me.
(a) I
ce th
ickn
ess e
volu
tion;
(b) s
urfa
ce el
evat
ion
evol
utio
n; (c
) bed
rock
ele
vatio
n ev
olut
ion.
All
valu
es a
re in
m
m/y
ear.
The
colo
ur le
gend
is
the
sam
e fo
r ic
e th
ickn
ess
and
surf
ace
elev
atio
n.
2
Fig.
5. E
volu
tion
patte
rns f
or
the
Gre
enla
nd I
ce S
heet
w
hich
res
ult
for t
he p
rese
nt
time.
(a)
Ice
thic
knes
s ev
olut
ion;
@)
surf
ace
elev
atio
n ev
olut
ion;
(c)
bedr
ock
elev
atio
n ev
olut
ion.
A
ll va
lues
are
in rn
m/y
ear.
The
col
our
lege
nd is
the
sam
e fo
r ic
e th
ickn
ess
and
surf
ace
elev
atio
n.
w
0
VI

is difficult to compare the ice evolution patterns discussed in this paper with direct measurements of surface elevation changes taken over only a few years. This restriction is, however, less crucial for the predicted bedrock uplift rates, which are mainly controlled by past loading events and display a spatially smoothed and temporally more stable longer-term trend. Here, verification with independent measurements can be expected to provide a useful source of information, not only concerning crustal deformations, but possibly also concerning short-term ice mass changes (Dietrich et al. 1998).
Acknowledgenreiits. - P. Huybrechts should like to thank the Fund for Scientific Research-Flanders (FWO). the Belgian Federal Office for Scientific, Technical and Cultural Affairs (Prime Minister's Services, Programme Global Change and Sustainable Development. Contract No. CG/DD/09), and the EU Framework IV project "Climate Change and Sea Level" (ENV4-CT095-0124) for their support during the preparation of the manuscript. Careful reviews by Hans-Peter Plag and Reinhard Dietrich helped to improve the text and were much appreciated. This is AWI Contribution no. 1688.
References Conway, H.. Hall, B. L., Denton, G. H., Gades, A. M. &
Waddington, E. D. 1999: Past and future grounding-line retreat of the West Antarctic ice sheet. Science 286, 280-283.
Dansgaard. W. & 10 others. 1993: Evidence for general instability of past climate from a 250-kyr ice-core record. Nature 364. 218-220.
Davis, C. H., Kluever, C. A. & Haines, B. J. 1998: Elevation change of the southern Greenland Ice Sheet. Scierzce 279, 2086-2088.
Dietrich. R., Scheinert, M. & Korth. W. 1998: The verification of the solid earth response on changing ice loads: a geodetic project in West Greenland. In P. Wu (ed.): Dynarnics of the Ice Age: a modern perspective. Pp. 509-522. Zurich: TransTech Publications.
Farrell. W. E. & Clark, J. A. 1976: On postglacial sea level. Geophys. J. R. Astrori. SOC. 46. 647-667.
Huybrechts, P. 1990: The Antarctic Ice Sheet during the last glacial-interglacial cycle: a three-dimensional experiment, A n n Glaciol. 14, 115-1 19.
Huyhrechts. P. 1992: The Antarctic Ice Sheet and environmental change: a three-dimensional modeling study. Ber. Polar- forschrrrig 99. 241 pp.
Huybrechts, P. 1994: The present evolution of the Greenland Ice Sheet: an assessment by modelling. Glob. Plarzet. Change 9, 39-5 1.
Huybrechts, P., Payne, A. J. & the EISMINT Intercomparison Group. 1996: The EISMINT benchmarks for testing ice-sheet models. Arm. Glaciol. 23, 1-12.
Huyhrechts, P. & de Wolde, J. 1999: The dynamic response of the Greenland and Antarctic ice sheets to multiple-century climatic warming. J. Clini. 12(8), 2169-2188.
Imhrie, J . , Hays, J. H., Martinson, D. G.. MacIntyre, A,, Mix, A.
C.. Morely, J. J., Pisias, N. G., Prell, W. L. & Shackleton. N. J. 1984: The orbital theory of Pleistocene climate: support from a revised chronology of the marine 6I8O record. In A. Berger et al. (eds.): Milankovitch arid climate. NATO AS1 Series C126. Pp. 269-305. Rotterdam: D. Reidel.
James, T. S. & Ivins. E. R. 1998: Predictions of Antarctic crustal motions driven by present-day ice sheet evolution and isostatic memory of the Last Glacial Maximum. J. Geophys. Res. 103(B3), 4993-5017.
Jouzel, J. & 16 others. 1993: Extending the Vostok ice-core record of palaeoclimate to the penultimate glacial period. Nature 364. 407-412.
King, S. D. 1995: The viscosity structure of the mantle. Rev. Geophys. 33, 11-17.
Krabill, W., Frederick, E., Manizade, S.. Martin, C., Sonntag, J., Swift, R., Thomas, R., Wright, W. & Yungel. J. 1999: Rapid thinning of parts of the southern Greenland Ice Sheet. Science 283, 1522-1524.
Lambeck. K., Johnston, P. & Nakada, M. 1990: Holocene glacial rebound and sea-level change in NW Europe. Geophys. J. Int. 103. 451468.
Le M a r . E. 1996: Isostatic post-glacial rebound over Fennoscandia with a self gravitating spherical visco-elastic Earth model. Anti. Glaciol. 23. 318-327.
Le Meur, E. & Huybrechts, P. 1996: A comparison of different ways of dealing with isostasy: examples from modeling the Antarctic ice sheet during the last glacial cycle. Ann. Glaciol. -73, 309-317.
Le Meur, E. & Huybrechts, P. 1998: Present-day uplift patterns over Greenland from a coupled ice-sheethisco-elastic bed- rock model. Geophys. Res. Lett. 25(21). 395 1-3954.
Letreguilly, A,, Reeh, N. & Huybrechts. P. 1991: The Greenland Ice Sheet through the last glacial-interglacial cycle. Pulaeo- geogr. Pdaeoecol. Palaeoclirn. (Global rind Planetar>) Change section) 90, 385-394.
MacAyeal, D. R.. Rommelaere. V., Huybrechts. P., Hulbe, C. L.. Determann, J. & Ritz, C. 1996: An ice-shelf model test based on the Ross Ice Shelf. Ann. Glaciol. 23, 46-51.
Mitrovica. J. X. & Forte, A. M. 1997: Radial profile of mantle viscosity: results from the joint inversion of convection and postglacial rebound observables. J. Geophys. Res. 102(S2). 2752-2769.
Nakada. M. & Lambeck. K. 1988: The melting history of the late Pleistocene Antarctic Ice Sheet. Nature 333, 3 6 4 0 .
Peltier, W. R. 1974: The impulse response of a Maxwell Earth. Rev. Geophys. Space Pliys. 12.649-669.
Thomas. R. H., Csatho. B. M., Gogineni, S., Jezek, K. C. & Kuivinenm, K. 1998: Thickening of the western part of the Greenland Ice Sheet. J. Glaciol. 44(148), 653-658.
van Tatenhove, F. G. M., Van der Meer, J. J. M. & Huybrechts, P. 1995: Glacial geological/geomorphological research in west Greenland used to test an ice-sheet model. Qnat. Res. -14, 317-327.
Warrick. R. A. & 23 others. 1996: Changes in sea level. In J. T. Houghton et al. (eds.): Clirnate change 1995. Pp. 359405. Cambridge: Cambridge University Press.
Wahr, J., DaZhong. H. & Trupin, A. 1995: Predictions of vertical uplift caused by changing polar ice volumes on a viscoelastic earth. Geophys. Res. Lett. 22, 977-980.
Wingham, D., Ridout. A. J., Scharroo. R.. Arthern, R. J. & Shum, C. K. 1998: Antarctic elevation change from 1992 to 1996. Science 282, 456-458.
Wu, P. & Peltier, W. R. 1982: Viscous gravitational relaxation. Geophys. J. R. Astroii. Soc. 70, 435485.
306 Predicted present-day evolution patterns of ice thickness and bedrock elevation