Neighborhood Impact of Subprime Lending, Predatory Lending and

PREDATORY LENDING IN NEW JERSEY:
THE RISING THREAT TO LOW-INCOME HOMEOWNERS
By Ken Zimmerman, Elvin Wyly, and Hilary Botein
February 2002
The New Jersey Institute for Social Justice, Inc., is a non-partisan urban research and advocacy organization established in 1999 by the Amy and Alan V. Lowenstein Foundation. Based in Newark, New Jersey, the Institute works at the state and local level to promote the development of economically healthy and vibrant urban communities and to challenge practices and policies that prevent urban New Jersey from achieving its full potential. The Institute, often in partnership with others, undertakes policy-related research and analysis, develops and implements model programs, and engages in advocacy, including litigation when appropriate, to further its mission

ACKNOWLEDGEMENTS The authors wish to thank the following individuals, organizations, and agencies for their assistance in producing this report: Jeannette Page-Hawkins and Rosemary Akins of Newark Emergency Services for Families, Mike Farley and Patricia Anthony of Unified Vailsberg Services Organization, Joyce Harley previously a private consultant and currently the executive director of the Multi-City LISC, Roland Anglin of the New Jersey Public Policy Research Institute and his students from the Urban Practicuum class at the Bloustein School, Dennis Gale of the Cornwall Center at Rutgers-Newark, Bob Holmes and the Community Law Clinic at Rutgers Law School, Sharon Hermanson of the AARP Public Policy Research Institute, David McMillin of Legal Services of New Jersey, and Alan Fishbein of the Center for Community Change. Our particular thanks for the thoughtful contributions of Ellen Brown and Nancy Fishman and the invaluable assistance of Sally Weissman and Rita Simmons.
NEW JERSEY INSTITUTE FOR SOCIAL JUSTICE BOARD OF TRUSTEES
Thomas Ashley John H. Lowenstein Robert Curvin Roger A. Lowenstein Dickinson R. Debevoise, Vice President Melville D. Miller, Jr. John J. Degnan Mark Murphy Jon Dubin Richard W. Roper Douglas S. Eakeley, Treasurer Theodore V. Wells, Jr., Secretary Zulima V. Farber Maria Vizcarrondo-DeSoto Nicholas deB. Katzenbach, President
Founder and Board Member Emeritus Alan V. Lowenstein
TABLE OF CONTENTS
I. Executive Summary……………………………………………………… i
II. Introduction……………………………………………………………… 1
III. Predatory Lending: the National Perspective…………………………… 2
A. What is Predatory Lending?………………………………………… 2 B. The Dramatic Increase in Subprime Lending………………………. 3 C. The Link Between Subprime and Predatory Lending……………… 4
IV. Predatory Lending in New Jersey: the Cause for Concern…………….. 5
V. Tools to Address Predatory Lending in New Jersey…………………… 10
A. Statutory and Regulatory Protections……………………………… 10 B. State Level Enforcement and Examination………………………… 12 C. Market-Based Measures and Industry Initiated Reforms………….. 13 D. Legal Assistance and Private Enforcement………………………… 14 E. Financial Literacy and Housing Counseling……………………….. 14 F. Data Collection and Research……………………………………… 15
VI. Recommendations………………………………………………………. 16
APPENDICES
A. Maps Reflecting Distribution of Subprime Loans, Foreclosures, and Demographics………………………………………………………. 18
B. Background on New Jersey HMDA/Foreclosure Analysis………… 25 C. State Law Comparison Chart………………………………………. 31
ENDNOTES…………………………………………………………… 33
ABOUT THE AUTHORS……………………………………………. 38

i
I. EXECUTIVE SUMMARY Homeownership matters. For families, it is a source of stability and the way most of us save for our futures and those of our children. For communities, homeowners provide continuity, civic investment, and a source of communal wealth. Over the past decade, a significant threat to New Jersey homeowners has emerged in the form of a new wave of unscrupulous mortgage finance activities. Collectively referred to as “predatory lending,” these practices disproportionately affect homeowners who are minority, low income, elderly, and urban. These practices are more than old wine in a new bottle. They stem from the explosion of a new lending market that concentrates upon home improvement and refinance loans for borrowers who have (or are perceived to have) poor credit. Known as subprime lending, this market has expanded ten-fold in New Jersey between 1993 and 2000, now accounting for almost 42% of all home improvement loans made in the state and 27% of all refinancings. Subprime lending is not synonymous with predatory lending. When undertaken responsibly, it offers needed capital to credit-impaired borrowers. Unfortunately, however, the subprime market is regulated inadequately and permeated by practices that can lead to widespread abuses. As the following report makes clear, the state has not yet responded to the new risks posed by the unprecedented growth of subprime lending with appropriate legislation, enforcement, and data collection. These risks are particularly prominent at the moment because of the economic downturn, an unprecedented level of consumer debt, and a historic level of mortgage delinquencies for higher-risk loans. They also have special ramifications for New Jersey’s cities where subprime lending practices are concentrated geographically. In the following report, the New Jersey Institute for Social Justice examines national and state level data to assess the dimensions of predatory lending practices in New Jersey, and sets forth a range of recommendations necessary to combat the problem. While data on specific predatory practices are not reported currently, considerable information about the subprime lending market is available and provides the basis for much of the Institute’s statistical analysis. In addition to data regarding the overall increase in subprime lending, highlights of the report include the following:
• Geographic concentration: Subprime lending is concentrated geographically in low income and minority areas, comprising in northern New Jersey almost two-thirds of the home improvement and refinance market in predominantly minority areas compared to less than thirty percent in predominantly white neighborhoods. Mortgage delinquencies are similarly concentrated geographically.
• Unnecessary costs: Nationally, the leading secondary mortgage market institutions
estimate that up to one-third to one-half of all subprime borrowers could qualify for prime loans, and that borrowers receiving subprime loans are charged significantly higher interest rates than similarly creditworthy borrowers receiving prime loans.
• Racial disparity: African-American borrowers in New Jersey are more than two and
one half times more likely than white borrowers to seek subprime loans for home

ii
improvements or refinancing, even after controlling for income and certain other objective factors.
• More foreclosures: Mortgage foreclosures in Essex County are increasingly the result
of subprime lending, with subprime lenders in 2000 responsible for almost 30% of all foreclosures as opposed to less than 19% in 1995, and are occurring more quickly, with the average length of time between loan and foreclosure having dropped to 4.0 years in 2000 as opposed to 6.7 years in 1995.
• High cost statewide: According to one analysis based upon the best available data, the
estimated cost of predatory practices to borrowers in New Jersey is $291 million.
• Insufficient tracking: Neither the federal government nor the state regulatory agencies collect data that would allow systematic evaluation of the full degree of predatory lending or other abusive practices.
The report includes two central recommendations directed toward the new Governor and Administration:
• Enact legislation that protects homeowners from predatory practices by prohibiting certain practices and expanding protections for loans that exceed certain costs and fees. Following the lead set by progressive legislation and regulatory changes in North Carolina, among dozens of state and local governments, New Jersey should prohibit financing of single premium credit insurance, loan “flipping,” and other predatory practices. The state should ensure also that expanded consumer protections for high cost or high fee loans are triggered for loans that exceed a specified threshold. In addition, New Jersey should act to delineate the responsibilities of mortgage brokers and join in efforts to regain regulatory control over predatory practices by pressing federal legislators to amend the federal Alternative Mortgage Transaction Parity Act.
• Undertake concentrated and aggressive enforcement and examination activity
against predatory lenders and practices. To date, there has been insufficient state enforcement activity, attributable at least in part to the lack of strong state leadership on the issue and the lack of close, coordinated working relationships between the State Department of Banking and Insurance (DOBI) and the Attorney General’s office, most notably the Division of Consumer Affairs and the Division of Civil Rights. This shortfall can be overcome through establishment of a high level task force with representatives committed to addressing the issue. Similarly, the DOBI must retool its examinations of licensed lenders and brokers to evaluate potential involvement in predatory practices.
In addition, the report recommends other areas for action and improvement:
• Data Collection: The state should collect for mortgage transactions data regarding credit insurance and similar products, among other information.
• Access to Information: New Jersey regulatory entities should make information
accessible to the public, through a web site or other similarly available forum, detailing fines and other actions taken against lending institutions for violations of consumer and lending laws and regulations.
iii
• Educational Counseling: The state should expand current partnership efforts with
community-based and faith-based groups to conduct outreach, education, and counseling around housing finance issues, focusing on existing homeowners as well as first time buyers.
• Engaging Mainstream Lenders: State policymakers should ensure that mainstream
lending institutions are full partners in the fight against predatory lending, both by facilitating appropriate self-regulation and standards to guard against predatory activities, and by promoting development of competitive and lower cost housing finance products in impacted areas, as a strategy to drive out predatory lenders.
• Access to Legal Remedies: Legislation and program development should assure victims
adequate access to legal redress, by removing barriers to the courts, as exemplified by unfair mandatory arbitration clauses, and by providing low-income homeowners with sufficient legal services and non-profit sources of refinance capital.

1
II. INTRODUCTION The housing finance system in the United States today is arguably the most efficient and sophisticated in the world—for some. For most middle- and upper-income Americans, the financial services industry has developed a complex range of private and public-sponsored financial intermediaries, instruments, and techniques to lower the costs of financing homeownership and to increase housing finance options. The situation is starkly different, however, for lower-income and minority communities and borrowers. As the Fannie Mae Foundation stated in a recent report about financial services in these neighborhoods:
There, the language of finance is increasingly pawnshops, check-cashing outlets, payday lenders, and rent-to-own stores…. This concentrated negative impact on households translates into increased financial distress at the community level as households already living on the margin are forced to navigate a minefield of high-cost, unscrupulous, and often fraudulent financial services providers.1
Residents of these communities have little access to mainstream financial institutions, and thus lack the credit alternatives that are available to other Americans. The set of finance practices described in this report, collectively referred to as predatory lending, are an outgrowth of this dual finance system.2
Hard-fought efforts to promote homeownership as a means of increasing stability and expanding wealth are undermined without an equally vigorous effort to protect low-income, minority, elderly, and urban homeowners from predatory practices.
Over the past two decades, substantial public and private resources and energies have focused on enabling low-income, minority, and urban renters to overcome the legacy of redlining and become homeowners for the first time. While much work remains to be done, and homeownership rates for African-Americans and Hispanics still lag significantly behind those for whites, the work of federal and state policy makers, mainstream lending institutions, and community-based institutions, among many others, has led to the highest homeownership rate in the nation’s history, with a substantial increase in numbers of new minority homeowners.3 For all the promise inherent in this result, however, there has been virtually no concentrated attention paid to the consequences of the dual finance system on existing homeowners. Many new homeowners remain poor, threatened by pressing financial needs, and unaware or locked out of the conventional lending market for refinancing or home equity lending. Ultimately, hard-fought efforts to promote homeownership as a means of increasing stability and expanding wealth are undermined without an equivalently focused effort to protect low-income, minority, elderly, and urban homeowners from predatory practices. Major shifts in the mortgage lending market place low-income and credit needy homeowners increasingly at risk of predatory practices. Due to increased securitizations by Wall Street, changes in the tax laws, and technological advances in targeting existing homeowners as potential borrowers, the past decade has seen the explosion of the subprime lending industry. Subprime lending focuses upon those who are, or are perceived to be, credit-impaired and thus provides credit at higher costs to these borrowers. While this industry is not synonymous with

2
predatory lending and offers needed capital to credit-impaired borrowers, it is inadequately regulated and is pervaded by practices that can lead to widespread abuses. As a result, particularly in conjunction with the increase in new and unsophisticated homeowners, predatory lending poses a rising threat. The economic downturn is worsening the situation, as cash-strapped homeowners become susceptible to predatory loans, and borrowers with such loans are locked out of the refinance boom as the result of prepayment penalties.4 This report seeks to identify some of the building blocks that are necessary to halt the destructive impact of predatory lending in New Jersey. It reviews the rise in predatory lending from national and New Jersey perspectives and presents new evidence that begins to quantify the inroads that predatory lending has established in New Jersey communities. It evaluates tools available to challenge predatory practices and concludes with a series of concrete recommendations. The destructive impact of predatory lending can be stopped only by a coordinated response that involves all key stakeholders, and this report is intended as an initial blueprint to guide such action. III. PREDATORY LENDING: THE NATIONAL PERSPECTIVE A. What is Predatory Lending?
Predatory lending refers to a wide array of practices that disproportionately affect low-income, elderly, and minority homeowners and result in unjustified increased payments, inability to refinance loans, and, in too many cases, equity stripping and foreclosure. This report focuses upon loans made to existing homeowners, most often through refinancing or home equity loans, although predatory practices also occur in the home purchase context.5 Three features, alone or in combination, define predatory practices: (1) targeted marketing to households on the basis of borrowers’ race, ethnicity, gender, or age or other personal characteristics unrelated to creditworthiness; (2) unreasonable and unjustifiable loan terms; and (3) outright fraudulent behavior that maximizes the destructive financial impact on consumers of the targeted marketing and lending provisions.6 Among predatory lending practices, the most harmful include:
• Lending based on the value of the home without regard to a borrower’s ability to pay; • Excessive interest rates and fees that are not justified by the borrower’s credit profile; • Multiple and repeated refinancings that cause the borrower to pay significant transaction
costs and reduce equity without a corresponding benefit (frequently referred to as “flipping”);
• The imposition of prepayment fees that provide no benefit to borrowers but penalize them by precluding them from refinancing a high-cost loan at lower rates;
• The practice of having borrowers finance the purchase of credit insurance (“single premium credit insurance”), immediately reducing the homeowner’s equity without any corresponding benefit; and
• Mandatory arbitration clauses and other obstacles that prevent borrowers from obtaining meaningful legal redress.7

3
B. The Recent Rise in Subprime Lending Predatory lending almost always is a subset of subprime lending. Subprime lending is designed to offer credit to borrowers who do not meet standard underwriting criteria as a result of impaired credit.8 The credit is provided at a higher cost, which should be intended to compensate for the increased risk assumed by the lender. Subprime lending fills a necessary niche in today’s credit market – as long as it is provided only to those who are unable to qualify for conventional loans, and as long as its higher costs reflect only the risk associated with lending to the borrower. Subprime lending becomes predatory when it includes costs and fees that exceed reasonable compensation for credit risk or otherwise erects barriers that limit borrowers from accessing the lower-priced conventional market. This occurs all too often. Studies by Fannie Mae and Freddie Mac, for example, suggest that up to one-third to one-half of subprime borrowers could have qualified for conventional loans.9 The explosion of the subprime lending industry reflects a radical transformation in the provision of refinance and home equity lending to low-income and credit-impaired homeowners during the past decade. Between 1993 and 1998, subprime mortgage lending increased eight-fold, from a total of $20 billion to $160 billion. In 1999, the subprime market share represented nearly 13% of all mortgage originations, up from less than 5% in 1994.10 Substantial evidence indicates that the subprime industry has continued to expand even during the recent recession. In the fourth quarter of 2001, for example, Standard and Poor's rated a total of 33 issues of subprime mortgage backed securities, totaling $34.83 billion.11 The dramatic increase in the subprime industry during the past decade results from at least three related trends. First, the supply of funds for subprime lending has increased dramatically with the expansion of the mortgage-backed security market. Between 1994 and 1998, the value of asset-backed securities issued for home equity loans grew from $10 billion to more than $80 billion.12 As reflected by recent securitizations, the market for subprime mortgage backed securities continues to expand. This growth has been facilitated by changes in federal tax laws that retained the deduction for mortgage interest but eliminated deductions for other forms of debt payments. Second, mortgage brokers have become more prevalent in recent years. In 1987 mortgage brokers were involved in 20% of residential mortgage transactions; in 2000, brokers were estimated to account for 65% of residential mortgages.13 While brokers are involved in both prime and subprime loans, a subset of brokers and other intermediaries, such as home repair contractors, have focused upon minority, elderly, and low-income homeowners and thus played a pivotal role in the expansion of the subprime market. Technological developments allow access to detailed information regarding the credit status and needs of particular households, enabling brokers to target specific homeowners. Many borrowers, particularly less sophisticated ones, do not understand that brokers and others involved in arranging refinance or home equity loans do not represent them and frequently have conflicting financial interests.14 Third, the past decade witnessed an increase in low-income homeowners with equity in their homes. Contrary to popular perception, large numbers of low-income people own their own homes. Nationwide, more than 52% of low-income households are homeowners,15 with the figure rising to more than two-thirds—68%--for the low-income elderly. Many of these homeowners have substantial equity in their homes, particularly after the twenty percent

4
nationwide increase in real estate values during the past decade.16 According to an AARP Public Policy Institute report, for example, eighty percent of elderly homeowners in 1995 did not have any mortgage debt.17 Many of these homeowners, nonetheless, remain in precarious financial circumstances; an unanticipated event, such as job loss or health emergency, can trigger a desperate need for cash and thus vulnerability to predatory loans. C. The Link Between Subprime and Predatory Lending While responsible subprime lending benefits some consumers, the explosive growth of the subprime lending industry is a source of concern, and is linked to the rise in predatory practices, for several reasons. First, the subprime lending industry is less regulated and standardized than the prime or conventional market, and thus provides greater opportunities for abuse. The vast majority of subprime loans are made by finance companies, frequently facilitated by mortgage brokers, as opposed to depository financial institutions such as banks or thrifts. As a result, they are not subject to a host of federal requirements, such as loan loss reserve or capitalization reserve rules, and have less stringent reporting requirements than banks and thrifts.18 While banks and thrifts are subject to regulation and examination by federal bank regulators, state agencies, which are typically less well-funded and staffed, tend to serve as the primary regulators of subprime entities.19 The underregulation of the subprime industry is exacerbated by the minimal level of regulation nationally of mortgage brokers and other intermediaries, particularly those who go door-to-door or otherwise engage in high pressure sales tactics in low-income and minority areas. Second, in part due to the lack of regulation and standardization, a set of practices common in the subprime market reflect powerful incentives for abusive practices. These practices include the following:
• Yield spread premiums are payments made by a lending institution to a broker or other intermediary for closing a loan in which the borrower pays more than the lending institution would otherwise require. Typically, the more a borrower pays over the rate or fee the lender sets as appropriate, the higher the bonus or premium provided to the broker. Borrowers are frequently unaware of these payments or that the broker or intermediary has a significant financial interest in steering the borrower to a higher priced loan. Yield spread premiums are currently the subject of Congressional hearings and extended litigation.20
• Single premium credit insurance refers to the practice of having a borrower finance credit insurance by including that amount in the total borrowed. While credit insurance may on occasion be a value to the borrower, there is no advantage to the consumer in adding its cost to the total amount of the debt and paying interest on this amount as well as the loan.
• Prepayment penalties are agreed-upon sums that a borrower commits to pay in the event he or she wishes to refinance the loan. While prepayment penalties are involved in fewer than 2% of conventional loans, approximately three-quarters of subprime loans include them.21 As a result, consumers are locked into the subprime market even if they demonstrate improved creditworthiness and are doubly hurt because they cannot reduce housing costs by refinancing at the current low interest rates.

5
Finally, subprime borrowers are more likely to be minority, elderly, and/or financially unsophisticated. In a comprehensive study jointly authored by the Department of Treasury and the Department of Housing and Urban Development, federal researchers found that subprime loans are five time more likely in African-American neighborhoods than in white neighborhoods, accounting for 51% of home loans in black neighborhoods in 1998 compared to 9% in white areas. Even higher income minority areas are disproportionately served by subprime rather than conventional lenders.22 There are equally marked differences between borrowers in the subprime and conventional markets related to age, level of education, and familiarity with the mortgage process.23 Overall, the national picture presents reasons for concern at the explosion of an under-regulated (and at times unregulated) lending market that focuses disproportionately on elderly, minority, and unsophisticated borrowers and is pervaded by aggressive mortgage brokers, home repair contractors, and other intermediaries with financial interests in increasing the cost of credit beyond that supported by the borrowers’ credit profile. This focus is reflected in the disproportionate share of foreclosures that stem from subprime loans.24 As the Federal Deposit Insurance Corporation (FDIC) recently noted, mortgage delinquencies for higher-risk loans have reached historic highs.25 IV. PREDATORY LENDING IN NEW JERSEY: REASON FOR CONCERN To date, other than basic analysis of data under the Home Mortgage Disclosure Act (HMDA),26 no comprehensive evaluation of the extent of predatory lending in New Jersey has been published. In conjunction with researchers from the Rutgers University’s Edward J. Bloustein School for Planning and Public Policy, the Institute for Social Justice has evaluated available data and other sources regarding the prevalence of these practices. The conditions and forces that have given rise to predatory lending practices are chiefly national in nature. Thus, there is no reason to believe that national trends related to predatory lending would not also be observed here in New Jersey or in any of its local jurisdictions. The multiple influences that have given rise to predatory lending practices—the securitization of subprime loans and technological advances that have enabled brokers and lenders to target homeowners, to cite but two—are at least as prevalent in this state as they are on the national level. Moreover, New Jersey is at greater risk than some other states given its degree of residential racial segregation. A more detailed review of HMDA data and foreclosure information in Essex County and throughout the state, as well as other sources, confirm this preliminary hypothesis with the following findings. Subprime lending has expanded dramatically in New Jersey, especially in low-income, minority, and urban areas. 27 The number of conventional single-family28 loans made by subprime lenders in New Jersey increased almost ten-fold between 1993 and 2000. In 1993, subprime lenders made 2,693 loans on single-family properties, just over 1 percent of the total; by 2000, they accounted for 25,403

6
loans, or 14.6 percent of all loans made in the state. Between 1993 and 2000, subprime lenders' market share of approved loans increased from 0.5 percent to 5.5 percent for home purchases; from 25.3 to 41.8 percent in the home improvement market; and from 1.14 to 26.6 percent for refinance loans.29 In 2000, subprime lenders in the state made 5,958 home-purchase loans, 4,899 home improvement loans, and 14,546 refinance loans. This expansion is disproportionately concentrated in low-income, minority, and urban areas. Subprime institutions accounted for a majority of all refinance loans granted in the 1993-2000 period in large parts of Newark, Jersey City, East Orange, Paterson, Camden, Trenton, and several other New Jersey cities.
Table 1. Subprime Mortgage Lending in New Jersey, 1993-2000. Home Purchase Home Improvement Refinance Subprime Market Subprime Market Subprime Market lenders share All others lenders share All others lenders share All others 1993 363 0.49 73,059 424 25.33 1,250 1,906 1.14 165,257 1994 1,390 1.71 79,920 575 22.79 1,948 5,255 7.04 69,383 1995 1,845 2.51 71,685 2,678 61.69 1,663 4,702 12.84 31,904 1996 3,416 4.32 75,672 2,689 53.53 2,334 8,827 15.01 49,989 1997 4,368 5.19 79,861 3,625 46.59 4,155 11,936 21.15 44,507 1998 5,710 5.61 96,142 2,134 31.36 4,670 17,356 11.42 134,592 1999 6,525 5.99 102,419 3,770 40.68 5,498 18,663 16.52 94,318 2000 5,958 5.52 101,962 4,899 41.85 6,808 14,546 26.65 40,039
Note: All figures refer to conventional loans on 1- to 4-family units that were approved and originated.
Source: Federal Financial Institutions Examination Council (1994-2001); Scheesselle (2001). A more detailed analysis of home improvement and refinance lending in Northern New Jersey in 1999 revealed that:
subprime lenders control almost two-thirds of the home improvement and refinance market in predominantly minority neighborhoods, compared to less than thirty percent in predominantly white neighborhoods. Subprime lenders hold three-fifths of the market in low-income communities,
compared to less than a quarter in high-income areas.30 In predominantly minority neighborhoods, eight of the top ten lending institutions
were subprime; in predominantly white neighborhoods, only four of the top ten were subprime.
The maps included as Figures 1, 2, and 3 in Appendix A at pages 19-21 and 26 illustrate visually these concentrations and disparities. These maps show subprime refinance loans in New Jersey originated between 1993 and 2000, depicting them as a share of all refinance originations by dollar volume. They are accompanied by a map depicting African-American residents as a share of the total population. As reflected in the maps, subprime market share has been related closely to where African-Americans live, although as the housing boom continued throughout the 1990s, subprime lenders began to make significant inroads into moderate-income, racially diverse neighborhoods throughout the state. The link between African-American residential

7
concentration and subprime lending is further illustrated in Figure 6 (included in Appendix A). A regression analysis based upon the data presented in this scatterplot indicates that African-American population concentration can explain almost 65 percent of the neighborhood variation in subprime share in the refinance market. Inequalities in lending cannot be explained completely by applicant income and other relevant factors. Despite limitations in the HMDA data, it is possible through regression analysis to assess lending patterns and determine whether differing levels of income or certain other objective differences account for subprime lending’s disproportionate presence in communities that are low-income or minority.31 The HMDA data demonstrate that, even after controlling for borrower income, loan amount, and several other variables:
In the home improvement market, African-American borrowers are more than three times more likely to obtain financing through subprime lenders than non-Hispanic whites, even after accounting for differences between approved and rejected applications. African-American borrowers seeking refinancing are 1.4 times more likely to end
up at a subprime institution after accounting for differences between approved and rejected applications. They are two and one-half times more likely to enter the subprime market than similarly situated non-Hispanic white borrowers without accounting for such differences.
Based on a more detailed analysis of mortgage applications filed between 1993 and 1999 in the Newark Metropolitan area, models were designed to account for a variety of borrower characteristics, including income, loan amount, and (to account for lenders' judgments of applicant creditworthiness) variables coded for applications that were denied, withdrawn, or closed as incomplete. The results demonstrate that:
It is more than two-and-a-half times as likely that someone seeking to buy a house in Newark will apply for a mortgage with a subprime lender than it is that someone in the remainder of the Newark Metropolitan Statistical Area will do business with such a lender. This ratio is even higher for homebuyers in East Orange and Irvington.
Overall, this analysis demonstrates that there are no variables in the data collected pursuant to HMDA that can account for the disproportionate concentration of subprime loans in minority and low-income communities. Subprime lenders are responsible for an increasing percentage and number of foreclosures. As another means of assessing the impact of subprime lending on New Jersey homeowners, researchers evaluated records reflecting subprime lending and foreclosures in Essex County. 32 The information obtained substantially understates the foreclosures attributable to subprime lenders since it does not include subprime loans subsequently sold or assigned to non-subprime lenders—estimated to occur in approximately half of all subprime loans. Nonetheless, as noted in the following chart, subprime lenders are increasingly responsible for foreclosures in Essex County.

8
ESSEX COUNTY FORECLOSURES AND SUBPRIME LENDING 1995 2000 Total Number of Essex County Foreclosures
1,701 2,516
% of Foreclosures Involving Subprime Lenders
18.8% 29.6%
Average Duration between Loan Inception and Foreclosure
6.7 years 4.0 years
Further, these data raise concerns given the overall increase in foreclosure case filings in New Jersey over the past seven years. Foreclosure filings rose from 16,825 in 1994 to 21,230 in 2000, and the number of foreclosures increased an additional 15% in the first half of 2001.33 The distribution of properties threatened with foreclosures tracks that of subprime loans. As an additional means to assess the threat to low-income homeowners, Bloustein School researchers analyzed loans for which preforeclosures had been filed in Essex County. The analysis involved two steps: 1) an examination of the spatial distribution of preforeclosures between August, 2000 and August, 2001 (showing conditions in the uncertain early stages of the current recession); and 2) an analysis of the percentage of single-family loans originated between 1993 and 1998 that subsequently went into preforeclosure sometime during 1999. The results are shown in Figures 4 and 5 in Appendix A at pages 22 & 23. The analysis reveals:34
• Defaults are concentrated heavily in Newark and the surrounding distressed suburbs, with very few notices filed in the western half of the county.
• The most severe problems in Newark appear in the city’s southern and western sections, and in Vailsburg, a finger of the city extending to the west. These African-American areas are among the most stable of Newark’s neighborhoods and therefore any threat to them places the entire city at risk. Severe concentrations of defaults also are evident in Irvington and East Orange.
• The areas with relatively few defaults are those where there are few homeowners and in Newark’s Ironbound district.
Overall, the pattern of preforeclosure filings suggests a close correlation with the geographical distribution of African American homeowners. Other sources of information strongly suggest the prevalence of predatory lending in New Jersey. While the limitations of HMDA and foreclosure data preclude definitive conclusions regarding the extent of predatory lending based exclusively on existing statistical sources,35 other bases of information reinforce that the patterns of predatory lending observed nationally are prevalent here in New Jersey as well. These sources of information include litigation records from cases filed in New Jersey and reports from community-based organizations.
9
Litigation: Several significant cases illustrate the nature of the problem. In Aiello v. First Alliance, (D.N.J. 1999 C.A. 98-5486), a nationwide class action filed in Newark in February 1999, an array of homeowners alleged that First Alliance Mortgage Company, a California-based subprime lender, pressured or mislead them into entering into home equity or refinance loans with origination fees exceeding 25% of the total loan amount, based on a scripted, high-intensity sales technique borrowed from the used car industry.36 This lender also has been the subject of legal action in Washington, Minnesota, Massachusetts, and California. The named plaintiffs initially sought to refinance their mortgage of $25,500, but ended up with a mortgage of $55,000 at a higher interest rate, including payment of $19,000 in origination fees (35%). As detailed in a comprehensive series by the New York Times and ABC News, First Alliance’s major expansion in New Jersey, as in other parts of the country, is linked directly to its ability to securitize its mortgages through Wall Street investment firms. After this lawsuit was filed, First Alliance filed bankruptcy and the matter is being pursued in bankruptcy court in California. In Associates Home Equity v. Troup, Ms. Troup, a seventy-four year old African-American resident of Newark who owned her home free and clear, was targeted by a home repair contractor who, in close cooperation with a subprime lender, ultimately convinced her to take out a $46,500 home equity loan. Despite her good credit, the loan had an adjustable interest rate that started at 11.65%, required her to pay four points, and left her with a balloon payment of $41,604 after fifteen years. Ms. Troup obtained a landmark ruling in Associates Home Equity v. Troup, 343 N.J. Super. 254 (App. Div. 2001), in which the court stated that the Troups provided facts in support of their claim that the lender “participated in the targeting of inner-city borrowers who lack access to traditional lending institutions, charged them a discriminatory interest rate, and imposed unreasonable terms.” Following this decision, in which NJISJ participated as amicus, the parties settled the case. In Cammarano v. Associates, (N.J. Superior Court, Chancery Division, Hudson No. F-13509-97), Ms. Cammarano, a single woman in her fifties who lives in North Bergen, borrowed approximately $28,000 from the Associates, one of the nation’s largest subprime lenders, recently purchased by Citigroup. After Ms. Cammarano became ill and unable to work, the Associates initiated contacts that led to three refinancings between September 1992 and February 1994. Through these refinancings, her indebtedness increased by more than $28,000 to over $56,000 total, with virtually all of the debt in the form of charges for points and the financings of credit disability and life insurance. Experiences of Community-Based Organizations Experiences of community-based organizations in Newark point similarly to the increasing threat to neighborhood stability posed by predatory practices. According to the Unified Vailsburg Services Organization (UVSO), the Vailsburg section of Newark has been negatively affected by focused marketing efforts by home repair contractors and finance companies. Based on research conducted by Seton Hall University’s Community Assistance Program, foreclosures in Vailsburg increased from 51 to 127 between 1999 and 2000—a rise of 149%-- with a further rise to 149 in 2001.37 UVSO believes that unfair refinancing and home improvement lending practices are a major factor in the rising rates of foreclosure. According to Mike Farley, the Executive Director of UVSO, “the local evidence of predatory lending and contracting practices is constant and widespread. Examples range from
10
incessant phone messages about government insured loans for homeowners to sad personal stories of seniors who are saddled with high interest loans for shoddy work on their properties. Further research into the recent foreclosure rates will very likely show a strong correlation to predatory lending.”38 Similarly, Newark Emergency Services for Families (NESF) reports that exorbitant refinancing rates and terms are the most unexpected and prevalent problem it has identified among middle-income senior homeowners it is attempting to assist through its widely respected Senior Links Program. Focused upon elderly in Newark and the surrounding inner ring suburbs, NESF has been working with senior citizen clients who, after refinancing their homes, have mortgage payments that exceed 80% of their fixed incomes. Jeannette Page-Hawkins, NESF’s Executive Director, states, “Most of the seniors served by NESF have limited financial resources. The practice of predatory lending threatens their financial security and jeopardizes their quality of life.” While it is not possible to determine the extent to which the problems experienced by the clients of these agencies are due exclusively to predatory lending, their experiences reinforce the potential scope of the problem in the greater Newark area. In combination with the available statistical information, this record strongly suggests the need for further research that looks at these impacts in more depth and over broader geographic areas and time periods, and attempts to evaluate responsibly claims about borrowers’ lack of creditworthiness – as well as claims about strategies used by lenders, brokers, and home improvement contractors. The very nature of predatory and subprime lending, however, means that its impact on neighborhoods and individuals never will be uncovered with uncontroverted clarity. At the same time, however, initial assessments based on available data indicate the potential scale of the harms caused by predatory lending. In a recently released study by Self-Help, one of the nation’s largest community development financial institution, it was estimated that predatory lending practices cost low-income homeowners over $9 billion nationally and more than $291 million in New Jersey.39 As the authors of that study acknowledge, the data used to generate these figures are limited and cannot be finely calibrated. At a minimum, though, these figures suggest the possible scope of the problem and reinforce that a robust public policy response to predatory lending is fully justified by the weight of the evidence gathered to date. V. TOOLS TO ADDRESS PREDATORY LENDING IN NEW JERSEY The complex set of issues presented by predatory lending demand a similarly multifaceted response. This section discusses the range of measures that can form a comprehensive approach, including statutory prohibitions of predatory activities, increased enforcement, industry self-regulation, counseling and education targeted to those who are most vulnerable, and increased data collection and research. A. Statutory and Regulatory Protections Both federal and state laws touch upon predatory lending practices. One increasingly recognized issue is that a number of the most problematic practices have not been addressed at any level. Similarly, to the extent that states have barred some of them, these prohibitions have been preempted by federal law intended to address other issues.

11
On a federal level, the most significant effort to address specifically predatory practices was the 1994 enactment of the Home Ownership Equity Protection Act (HOEPA).40 After extensive Congressional hearings directed at the range of practices now known as predatory lending, Congress enacted special protections for consumers who enter into so-called “high cost” loans with interest rates or fees that exceed specified triggers.41 For loans that exceed these triggers, additional disclosures are required, certain practices are curtailed, and liability for improprieties may be asserted in some circumstances against assignees or purchasers of such loans.42 HOEPA has been of limited utility in combating predatory lending, however, because lenders have increasingly made loans just below the law’s triggers and because it does not cover a number of problematic practices, such as flipping or single premium credit insurance. The Federal Reserve Board determined, for example, that more than one-third of all subprime loans charged interest rates within two percentage points of the HOEPA trigger.43 The other major federal enactment that implicates predatory lending practices, although in a negative fashion, is the Alternative Mortgage Transactions Parity Act (AMTPA).44 Enacted in 1982 at a time of high mortgage interest rates, this law resulted in the preemption of state consumer law protections, even when applied to state-licensed, non-depository lenders who have been identified as the leading potential source of predatory activity. As former New Jersey Commissioner of Banking and Insurance Geoffrey M. Connor has written, “One reason the federal agencies are so interested in predatory lending is that they’ve finally realized that their record of pre-empting state law for years may actually be assisting predatory lenders and hurting consumers.” 45 Against this federal backdrop, North Carolina, New York, Illinois, California, and a number of other jurisdictions have enacted legislation or issued regulations that have addressed gaps in the current statutory regime. These activities are important not only because they provide substantive protections not otherwise available, but because they have bearing on the state-licensed non-depository lenders that form such a significant part of the predatory lending market. As former Commissioner Connor notes, “[s]tate regulation of predatory lending potentially therefore will have a more significant impact on [predatory lending] than federal regulation.”46 North Carolina represents the most forceful example of state-level activity to restrict predatory lending.47 In legislation enacted in July 1999, North Carolina expanded on HOEPA by undertaking borrower protections of two kinds: (1) outright prohibition of certain predatory practices, such as single premium credit insurance, for all loans; and (2) increased protections for borrowers of high-cost loans, including definitions which significantly expand the number and type of covered loans. In addition, North Carolina recently enacted legislation regarding mortgage brokers, most notably specifying that mortgage brokers have a duty to make reasonable efforts to ensure that the loans they are facilitating are “reasonably advantageous” to the borrower.48 As demonstrated by the chart contained in Appendix C, New Jersey does not have measures to combat predatory lending equivalent to what now exist in North Carolina and New York.49 Among the protections offered in those jurisdictions but not in New Jersey are: (1) prohibitions against multiple and rapid loan refinancings (loan “flipping”); (2) prohibitions on lending without any regard to the borrower’s ability to pay; (3) prohibitions on single premium credit insurance; (4) special protections for borrowers of high-cost loans; and (5) measures designed to limit unreasonable prepayment penalties, such as by including them in the trigger for high-cost loans. As former Commissioner Connor has stated, “[r]eputable lenders have nothing to fear from the regulation or out-and-out prohibition of predatory practices. Indeed, these

12
developments should be healthy for the marketplace and should improve consumer confidence in lending.”50 B. State Level Enforcement and Examination A second component necessary to curb predatory lending is a proactive enforcement and examination commitment from state government. Enforcement requires aggressive and coordinated action to target, investigate, and, when appropriate, prosecute those lenders and mortgage intermediaries that engage in predatory practices. A number of these practices violate current state and federal law, but continue due to insufficient enforcement. In this area, it is important to note that efforts must be directed not only towards lenders and those making or purchasing loans but also towards brokers, home repair contractors, and other intermediaries who facilitate the transactions. Regarding enforcement activity directed towards lenders, state government in New Jersey has significant power both through traditional enforcement and through its regulatory and examination authority.51 Although recent enforcement action on loan flipping pursued by the Attorney General’s office is a positive sign, the overall record of enforcement is limited. Enforcement requires close cooperation between the Department of Banking and Insurance (DOBI) and the Attorney General’s office. While the DOBI’s focus on consumer education and financial literacy is laudable, it can and should be a major partner in the effort to root out unscrupulous lenders that tarnish the entire industry’s credibility. Particularly given ongoing resource constraints, improved coordination and referrals are critical to maximizing meaningful enforcement activity. The goal can also be realized through appropriate use of the DOBI’s examination authority. The Department can examine lenders to evaluate the presence of unwarranted rates, fees, and other hallmarks of predatory lending. Examinations should be conducted proactively with the goal of identifying problem lending practices and policies that may contribute to predatory lending, rather than simply reacting to complaints from borrowers who frequently are not in a position to evaluate patterns of behavior.52 Critical to this effort is more extensive outreach to faith-based organizations, community development corporations, and consumer and civil rights organizations that have clients or experience with lending institutions that would enable DOBI to target its efforts. DOBI’s efforts are also marred by a failure to make information about its activities, including fines and other enforcement actions, easily accessible to the public. The results of enforcement and examination efforts must be shared with the public in a manner that provides confirmation that responsible lenders are acting appropriately and bad actors have been identified and dealt with. The state should report regularly on enforcement activities taken to address predatory lending, and DOBI should provide basic information in a readily available format regarding the penalties it assesses and the fines that it collects. Significant expansion of enforcement and regulation of brokers, home repair contractors, and other intermediaries is an equally important step. The Mortgage Bankers Association accurately notes that a fundamental problem in addressing predatory lending is “the absence of oversight and utter lack of enforcement of [regulations governing mortgage lending and originations] in instances of brokers and other unsupervised entities.”53 As an initial matter, critically important in this area are legislative initiatives that would create a duty for brokers to the borrowers, such as that North Carolina has put in place. As with licensed lenders, however, concentrated

13
enforcement and examination of mortgage brokers to address abuses and confirm the appropriate conduct of most brokers is also important. C. Market-Based Measures and Industry-Initiated Reforms Responsible forces in the lending industry have developed standards and practices that can root out predatory practices and reward those who act appropriately. These standards and practices can serve as potent tools in the effort to curb predatory practices. To date, noteworthy measures have been adopted by a limited number of subprime lenders, by secondary market institutions, and by public and private institutions identifying programs and products necessary to combat predatory abuses. Unfortunately, these efforts still affect a limited portion of the subprime market and even then, while positive, are insufficient to overcome the powerful financial incentives for abuse. As a starting point, a number of major subprime lenders have taken action in response to public pressure to halt certain practices, most notably the financing of single premium credit insurance.54 More significant than such pressure-induced measures are farther-reaching and more comprehensive efforts, such as those initiated by Ameriquest, one of the nation’s largest subprime lenders, suggesting certain minimum standards of responsible subprime lending behavior. While it is too early to assess their impact, Ameriquest’s written materials and public presentations represent that, among other steps, it: (1) provides borrowers with one week, rather than the mandated three day period, to cancel a loan after closing; (2) does not offer loans with mandatory arbitration clauses, balloon payments, or negative amortization, as well as prohibiting single premium credit insurance; (3) does not allow refinancing of a loan within twenty-four months of origination; and (4) does not pay brokers or other intermediaries yield-spread premiums.55 Particularly for those lenders that offer both prime and subprime products, reported best practices include comprehensive statistical and qualitative comparison of borrowers in both areas. Among the private sector, the entities with perhaps the most influence are those that purchase subprime loans: the government-sponsored enterprises (GSEs, which refer to Fannie Mae and Freddie Mac), major investment firms on Wall Street, and the largest financial institutions. Through the policies they set regarding what loans they will buy and under what terms, they dictate how major subprime lenders will conduct their business. Both Fannie Mae and Freddie Mac have established basic minimum standards to ensure that they do not purchase the most blatantly predatory loans. These minimum standards include: (1) setting a 5% cap on points and fees (except for small loan balances); (2) prohibiting equity only lending; and (3) rejecting any loan that includes single premium credit insurance.56 Given that the GSEs purchase only a small portion of the subprime loans, even these minimal standards will not significantly influence industry behavior unless unregulated financial institutions also follow suit. Innovations within the industry and by private and public entities have sought to develop products and programs to drive out predatory practices. With support from the GSEs, special loan products now can be offered to borrowers with blemished credit histories that reward those who make timely payments with automatic interest rate reductions over the life of the loan.57 Loan pools have been created to refinance sub-prime loans with predatory features, such as repeated refinancings within a short period of time or defective or unfinished home improvement repairs. Leading efforts include the Neighborhood Ownership Recovery Mortgage Assistance Loan Program (NORMAL) started by Neighborhood Housing Services of Chicago and a group of banks, and the Parodneck Foundation’s efforts in New York City.58 Although informal efforts

14
have been initiated around particular abusive situations in New Jersey, no equivalent program has been undertaken in the state to address borrowers victimized by predatory refinance or home improvement loans. D. Legal Assistance and Private Enforcement Nationally, private advocacy and litigation has brought to light many predatory lending abuses, and has afforded predatory lending victims much-needed relief. Particularly given limitations in public enforcement resources, non-profit organizations can provide vital counseling and legal assistance. Unfortunately, victims face a dire lack of legal resources. While Legal Services programs and other not-for-profit legal offices in New Jersey provide assistance to some borrowers, demand has outstripped their resources, although Legal Services of New Jersey’s new Predatory Lending/Home Defense program seeks to increase the availability of Legal Services representation in predatory lending cases. According to LSNJ, LSNJ and statewide legal services offices handled over 590 cases and inquiries in 1999 from eligible clients regarding nonbankruptcy homeownership-related legal issues. Victims face legal barriers to vindicating their available rights, moreover, even if counsel is available. Subprime loans increasingly include mandatory arbitration clauses that preclude victims from seeking judicial relief and effectively make it impossible for victims to even challenge illegal loan terms.59 Similarly, since most borrowers are unaware of problematic loan terms until they face foreclosure actions, statutes of limitations frequently limit the ability of borrowers to challenge illegal transactions.60 E. Financial Literacy and Housing Counseling Increased financial literacy features prominently in discussions regarding how to curb predatory lending. While quality housing counseling programs have proven effective in the home purchase context,61 a tailored and concentrated effort will be needed to make public education around financial matters relevant in the effort to root out predatory lending practices. Housing counseling programs in New Jersey, as in the rest of the country, have focused primarily on new homeowners, and those groups that are developing affordable housing frequently lack resources to follow up with clients after they have moved in. Similarly, the efforts initiated by the Department of Banking and Insurance, including publication of pamphlets, financial education for schools, and presentations to senior citizen groups, are only effective if they reach groups likely to be affected. To supplement the state’s current efforts and to make housing counseling effective in the specialized context of predatory lending, the state should:
• Convene a group of existing housing counseling agencies to focus upon how best to reach existing homeowners vulnerable to predatory practices;
• Provide specialized funding to housing counseling agencies to focus on existing homeowners, probably requiring partnerships with faith-based institutions or other organizations with ties to neighborhoods with vulnerable homeowners;
• Ensure that such programs, which are likely to be more expensive than other programs, are adequately funded; and
• Develop programs for those who have already entered into predatory transactions.
15
In addition, financial literacy efforts must be recognized as a fundamental part of every New Jersey resident’s education and steps taken to expand their inclusion into secondary education. F. Increased Data Collection and Research A vital tool to address predatory lending is appropriate governmental data collection that would allow regulators to monitor lender practices and enable self-policing by responsible industry members. Tailored to avoid unnecessary burdens on lending institutions, data collection in the lending arena has led to important changes in mortgage lending practices, particularly those that contributed to increased lending to minority borrowers. Unfortunately, the lending data disclosure statute that is pivotal to the effort to improve understanding and curb abusive lending practices is limited when it comes to addressing the issues raised by predatory lending, although recent changes by the Federal Reserve Board are a promising step in the right direction. HMDA focuses primarily on whether or not a particular loan is made. Because the concerns at the heart of predatory lending deal with the terms and features of a loan as opposed to an unjustified denial, HMDA has been of limited use for regulators and policy makers in gaining greater insight and analyzing problem areas. The Federal Reserve Board’s action in January 2001 to amend the HMDA regulations so that, for the first time, pricing data at the loan level will be collected for certain higher cost loans is a significant move to rectify this problem.62 An additional problem with HMDA has been its limited coverage. Because of the manner in which the threshold requirements for reporting under HMDA are defined, certain finance companies and others that are significant participants in the subprime market are not required to report. Finally, HMDA’s utility is decreasing as loans are made increasingly over the telephone, and therefore no data is obtained regarding borrower specifics, such as race or ethnicity. A number of steps should be taken to rectify this situation. At the federal level, measures include: (1) further expanding the data that are collected under HMDA to include information on interest rates and areas of particular concern (e.g., charges imposed by third party closing agents); and (2) expanding those entities that are required to report under HMDA by repealing the so-called 10% rule.63 The Federal Reserve Board is currently considering further changes to the regulations that govern HMDA in a manner that would contribute to both of these goals. While much data collection in this area is and should be conducted on a national level, substantial state interests can and should be advanced through data collection for state-licensed lenders and for others involved in practices that may lead to predatory activity. Specifically, the state should collect data regarding: (1) the prevalence of single-premium credit insurance in New Jersey; and (2) mortgage broker practices, including the number and geographic area in which brokers are involved in making loans, and the number of these loans which qualify as high-cost. Finally, the state should, to the extent permissible under federal law, obtain supplemental information from state-licensed lenders regarding high-cost loans. The collection of data regarding single premium credit insurance is especially appropriate in New Jersey, because the state is one of the few in which banking and insurance regulation is housed in a single agency. In obtaining this information, the state should disaggregate mortgage-related insurance from other credit products. Similarly, given reports that certain lenders are replacing credit insurance with debt cancellation contracts or other alternatives, information on these products and practices should be collected as well. As with information pertaining to state

16
enforcement activity, this information should be made publicly available, ideally through a web-site or other easily accessible method. VI. RECOMMENDATIONS FOR A COMPREHENSIVE NEW JERSEY RESPONSE TO PREDATORY
LENDING Predatory lending poses a significant risk to low-income homeowners in New Jersey—a risk that will only become more acute with the ongoing economic downturn. Given that many low- and moderate-income homeowners are already carrying significant levels of consumer debt, job loss and other disruptions can be expected to lead many into default and foreclosure. At a minimum, the state can expect that more homeowners will be susceptible to predatory practices as their needs for short-term cash assistance become more pressing. These risks are exacerbated because of the state’s historic lack of attention to the problems of predatory lending. As a result, devastating practices remain permissible, and unscrupulous finance companies and other actors continue to operate with minimal risk of detection and punishment. Accordingly, the New Jersey Institute for Social Justice makes the following recommendations:
New Jersey should develop and adopt state legislation that restricts predatory lending activity, modeled after laws passed in North Carolina. As noted above, New Jersey lags behind many other states in its legislative response to predatory lending, and must follow their lead by pursuing a range of legislative and regulatory changes to outlaw currently permissible practices (e.g., flipping, single premium credit insurance) and provide additional protections for borrowers of high-cost loans. In doing so, it is critically important that the state significantly expand on HOEPA by expanding the number of loans treated as high cost and ensure concrete protections for those entering into such loans. A number of model statutes have been developed, such as the AARP model bill, that offers promising approaches.
The Attorney General and Commissioner of Banking and Insurance must make
rooting out predatory practices a focus of their enforcement and examination activities. To combat predatory lending effectively requires focused and cooperative efforts from both the Attorney General and the New Jersey Department of Banking and Insurance. In particular, the DOBI must work in partnership with the Attorney General to identify and refer cases involving violations of consumer protection and civil rights laws. We recommend the establishment of a task force headed by the Attorney General and Commissioner of Banking and Insurance to target regulatory and enforcement actions and develop guidelines and standards in collaboration with responsible stakeholders.
New Jersey should expand data that are collected to include financed credit
insurance (and related products) and mortgage broker practices, and support more extensive data collection efforts on the federal level. In doing so, the state must make sure the data is readily available to the public.
Financial literacy and counseling programs should be targeted to address predatory
practices. As a supplement to other measures, financial literacy and housing counseling programs are a critical component to improve consumer literacy and awareness. To make such programs effective in addressing predatory lending, however, they must be targeted to existing homeowners, involve community-based and faith-based organizations, and

17
receive adequate funding and technical support. More broadly, existing efforts by DOBI to make financial literacy a component of secondary education should be expanded.
Adequate legal and mortgage assistance must be made available to assist victims of
predatory practices. To ensure that those victimized have adequate assistance, support must be provided for programs that provide legal assistance to the indigent and focus on foreclosure defense, such as LSNJ’s home defense project. Barriers to raising legal defenses must be removed, most notably the widespread use of mandatory arbitration clauses. Similarly, models for mortgage assistance programs that have been developed in other states and cities should be developed in New Jersey, with involvement from the public sector, private lenders, and community-based organizations.
New Jersey officials should work with the state’s Congressional delegation to
support a federal agenda addressing predatory practices. This federal agenda would include: (1) revision of the Home Ownership Equity Protection Act (HOEPA) to lower and better target the trigger for high-cost loans and to restrict certain predatory practices; (2) amendment or modification of the Alternative Mortgage Transaction Parity Act to allow state protections to be effective; and (3) expansion of the national data collected under the Home Mortgage Disclosure Act to require loan level reporting of interest rates, reasons for denial, any affiliation of the lender, and other information.
Key stakeholders in the financial services industry in New Jersey should develop
industry standards to police subprime lending and prevent it from becoming predatory. Since responsible lenders that do not engage in predatory practices are threatened with losing business to predatory lenders, they should adopt standards to ensure they do not engage in predatory practices, including ensuring that consumers are not wrongly relegated to the subprime market when they could qualify for credit in the prime market.
Additional research is important to refine analysis of predatory lending and other
access to capital issues in low-income and urban areas. The information presented in this report offers a starting point in the broader area of barriers to accessing capital among low-income and urban residents of the state. A more detailed research agenda should be pursued.
18
Appendix A: Maps
Figure 1 Subprime Refinance Lending, 1993-1996
Figure 2 Subprime Refinance Lending, 1997-2000
Figure 3 African American Population, 1990
Figure 4 Pre-Foreclosures in Essex County, August 2000-August 2001
Figure 5 Pre-Foreclosure Rate in Essex County, 1999 Figure 6 Subprime Market Penetration and African American
Residential Concentration


25
Appendix B: Logistic Regression Models
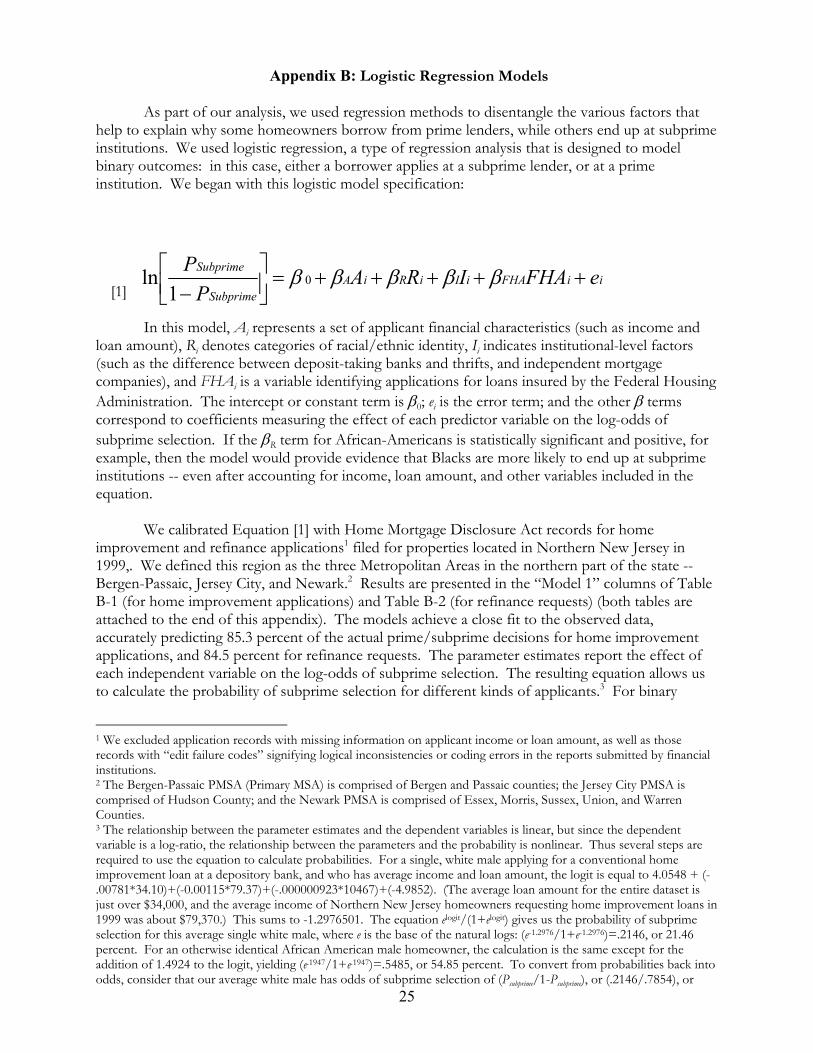
As part of our analysis, we used regression methods to disentangle the various factors that help to explain why some homeowners borrow from prime lenders, while others end up at subprime institutions. We used logistic regression, a type of regression analysis that is designed to model binary outcomes: in this case, either a borrower applies at a subprime lender, or at a prime institution. We began with this logistic model specification:
[1]
In this model, Ai represents a set of applicant financial characteristics (such as income and loan amount), Ri denotes categories of racial/ethnic identity, Ii indicates institutional-level factors (such as the difference between deposit-taking banks and thrifts, and independent mortgage companies), and FHAi is a variable identifying applications for loans insured by the Federal Housing Administration. The intercept or constant term is β0; ei is the error term; and the other β terms correspond to coefficients measuring the effect of each predictor variable on the log-odds of subprime selection. If the βR term for African-Americans is statistically significant and positive, for example, then the model would provide evidence that Blacks are more likely to end up at subprime institutions -- even after accounting for income, loan amount, and other variables included in the equation. We calibrated Equation [1] with Home Mortgage Disclosure Act records for home improvement and refinance applications1 filed for properties located in Northern New Jersey in 1999,. We defined this region as the three Metropolitan Areas in the northern part of the state -- Bergen-Passaic, Jersey City, and Newark.2 Results are presented in the “Model 1” columns of Table B-1 (for home improvement applications) and Table B-2 (for refinance requests) (both tables are attached to the end of this appendix). The models achieve a close fit to the observed data, accurately predicting 85.3 percent of the actual prime/subprime decisions for home improvement applications, and 84.5 percent for refinance requests. The parameter estimates report the effect of each independent variable on the log-odds of subprime selection. The resulting equation allows us to calculate the probability of subprime selection for different kinds of applicants.3 For binary
1 We excluded application records with missing information on applicant income or loan amount, as well as those records with “edit failure codes” signifying logical inconsistencies or coding errors in the reports submitted by financial institutions. 2 The Bergen-Passaic PMSA (Primary MSA) is comprised of Bergen and Passaic counties; the Jersey City PMSA is comprised of Hudson County; and the Newark PMSA is comprised of Essex, Morris, Sussex, Union, and Warren Counties. 3 The relationship between the parameter estimates and the dependent variables is linear, but since the dependent variable is a log-ratio, the relationship between the parameters and the probability is nonlinear. Thus several steps are required to use the equation to calculate probabilities. For a single, white male applying for a conventional home improvement loan at a depository bank, and who has average income and loan amount, the logit is equal to 4.0548 + (-.00781*34.10)+(-0.00115*79.37)+(-.000000923*10467)+(-4.9852). (The average loan amount for the entire dataset is just over $34,000, and the average income of Northern New Jersey homeowners requesting home improvement loans in 1999 was about $79,370.) This sums to -1.2976501. The equation elogit/(1+elogit) gives us the probability of subprime selection for this average single white male, where e is the base of the natural logs: (e-1.2976/1+e-1.2976)=.2146, or 21.46 percent. For an otherwise identical African American male homeowner, the calculation is the same except for the addition of 1.4924 to the logit, yielding (e.1947/1+e.1947)=.5485, or 54.85 percent. To convert from probabilities back into odds, consider that our average white male has odds of subprime selection of (Psubprime/1-Psubprime), or (.2146/.7854), or
iiFHAiIiRiASubprime
Subprime eFHAIRAP
P+++++=
−βββββ 0
1ln

26
variables (those that take on values only of zero or one), the exponentiated form of the parameter estimate -- the “odds ratio” provides an easily-interpreted measure of the effect of the variable on the likelihood of subprime selection. Among those applying for home improvement loans, the odds of subprime selection for African-Americans are 4.45 times as large as those for non-Hispanic Whites who are otherwise identical in terms of all other variables included in the model. The corresponding ratio for refinance applications is 2.48. The major shortcoming of HMDA is the absence of direct measures of applicant risk or qualification: liquid assets and credit history are two of the most important variables used by lenders and underwriters that are not included in the HMDA files. Some analysts maintain, therefore, that HMDA cannot be used to infer discrimination or “targeting,” because Blacks may be more likely to choose subprime credit because they are unable to qualify for the more stringent requirements of prime lenders. One way of testing this argument is to add a series of variables for the different decisions (Di) taken on each loan application.
An application may be approved by the lender, and “originated” or granted; but it may also be denied by the institution, it may be approved then declined by the borrower, withdrawn by the borrower, or closed as incomplete; our database also includes loans reported by institutions that purchased the loans from another institution. When we code these different categories and re-
estimate the model, it has
the effect of accounting for the credit and asset limitations that lead underwriters to reject applications, as well as other processes in the local credit market (such as comparison-shopping by homeowners who file applications at several lenders, and leave one incomplete while accepting the other). The results of this re-estimated model are reported in the “Model 2” columns of Tables B-1 and B-2. Note that the models fit better, with 87.8 percent of home improvement applications correctly predicted, and 89.2 percent for refinance applications. After accounting for decisions rendered on different loans, the effect of race/ethnicity on subprime selection is reduced, but not eliminated. For home improvement applications, the odds ratio for African-Americans declines from 4.45 (Model 1) to 3.13 (Model 2), and for refinance requests the corresponding figures are 2.48 to 1.40. Note that declined, withdrawn, and incomplete applications are much more likely to be filed at subprime lenders than are otherwise identical requests that are approved and originated.
For a more detailed understanding of geographical variations in subprime lending patterns,
we calibrated a series of logistic regression models for the Newark metropolitan area. For this analysis, we included all types of single-family loan applications -- for purchase, home improvement, and refinancings -- filed between 1993 and 1999. We excluded loan requests exceeding the “conforming limits” established by Fannie Mae and Freddie Mac, the dominant secondary market purchasers, but we included those with edit failure codes (adding a specific variable to identify these records).4 We used the same approach as that described for Equations [1] and [2], but we included a much more detailed set of control variables. We included variables for the different years in which applications were filed (compared to 1993, the reference category), and the different regulatory
0.2732 to 1. An otherwise identical Black man has odds of (.5485/.4515), or 1.2148 to 1. The ratio 1.2148/0.2732 reduces to 4.45, which is the simple odds ratio reported for the African American coefficient in the Model 1 column of Table A-1. 4 It is not possible to identify jumbo loans in the HMDA files with absolute precision. The conforming limits vary depending on the number of dwelling units in the structure, while HMDA records do not distinguish among these categories, so long as a structure has four or fewer dwelling units. We excluded applications exceeding the conforming limit for 1-family units in each year (which was $203,150 in 1993, and increased each year, to $240,000 in 1999).
iiDiFHAiIiRiASubprime
Subprime eDFHAIRAP
P++++++=
−ββββββ 0
1ln

27
agencies to which different institutions report (HUD, where independent mortgage companies submit their reports, is the reference category.) We also developed a “payment ratio,” calculated as the ratio of the amortized amount required to pay the reported loan amount -- assuming a thirty-year amortization at prevailing interest rates for the year in which the application was reported -- divided by the applicant’s reported income. Finally, we coded a series of variables for each of the municipalities in Essex County, to determine whether applications filed in particular places are more (or less) likely to wind up at subprime lenders when compared with otherwise identical applications filed in the remainder of the Newark metropolitan area.
Model results are presented in Table B-3. The final database includes 181,132 home
purchase applications; 73,950 home improvement applications; and 233,071 refinance requests. The parameter estimates and odds ratios are interpreted as described for the Northern New Jersey Models described above. To aid interpretation of the many different independent variables, however, we calculated “standardized coefficients,” which are designed to control for the varied measurement units of different independent variables:
100 × eβ iσ i( )−1[ ]
where βi is the unstandardized parameter estimate for independent variable i, and σi is the standard deviation of variable i. For continuous variables, the standardized coefficient portrays the percent change in odds with a one-standard deviation change in the respective predictor variable. For binary variables, the standardized coefficients have the effect of accounting for the prevalence of different characteristics in the sample.
Note that the odds of subprime choice for African American home-buyers are 2.10 times
that for non-Hispanic Whites after accounting for all other variables. The corresponding ratio for refinance applications is 1.86, but there is no statistically significant racial difference for home improvement applications. Unfortunately, these ratios are also affected by the rise of non-reporting of racial information in the HMDA files, and thus we may be underestimating racial differences if minorities are more likely to have no reported racial information; racially “unknown” home improvement applications have subprime selection odds 7.8 times those for otherwise identical non-Hispanic whites.
Geographical divisions are measured by the odds ratios for the municipality variables. The odds of subprime selection for a home-buyer in Newark are 2.68 times those of an otherwise identical borrower in the remainder of the metropolitan area; the corresponding ratios are 1.28 for home improvement applications, and 1.95 for refinance requests.

28
Table B-1. Subprime Home Improvement Loan Models, Northern New Jersey, 1999.Model 1 Model 2
Parameter Significance Odds Parameter Significance OddsVariable Estimate Level Ratio Estimate Level Ratio
Intercept 4.0548 **** . 3.7995 **** .Loan amount (x $1,000) -0.00781 **** 0.99 -0.00744 **** 0.99Applicant income (x $1,000) -0.00115 1.00 0.00222 *** 1.00Applicant income squared -9.23E-07 1.00 -5.43E-06 *** 1.00Female applicant -0.115 * 0.89 -0.0368 0.96White couple (see note 1) -0.8444 **** 0.43 -0.708 **** 0.49African American (see note 2) 1.4924 **** 4.45 1.1418 **** 3.13Hispanic 0.6524 **** 1.92 0.4004 **** 1.49Other race -0.0898 0.91 -0.2278 * 0.80Race unreported -0.2847 **** 0.75 -0.5062 **** 0.60Depository institution (see note 3) -4.9852 **** 0.01 -4.8813 **** 0.01FHA-insured loan 0.8067 **** 2.24 0.6771 **** 1.97Approved but not accepted by applicant (see note 4) 1.316 **** 3.73Denied by lender 0.6712 **** 1.96Withdrawn by applicant 1.7054 **** 5.50Closed incomplete -1.4924 **** 0.23Purchased by lender 1.3881 **** 4.01Tract income as percentage of area median -0.00587 **** 0.99Minorities as percentage of tract population 0.00373 **** 1.00
Number of observations 20,590 20,590 Percentage correctly classified 85.3% 87.8%
1. Defined as white male applicant, white female coapplicant.
2. Racial groups are compared with non-hispanic white applicants.
3. Depository institutions are compared with independent mortgage companies that do not take deposits and are not subsidiaries of banks.
4. Actions by lenders are compared with applications that are approved and originated.
*Statistically significant at the 5% level; **at the 1% level; ***at the 0.1% level; ****at the 0.01% level.
Data Source: Federal Financial Institutions Examination Council (2000); Scheeselle (2000).

29
Table B-2. Subprime Refinance Loan Models, Northern New Jersey, 1999.Model 1 Model 2
Parameter Significance Odds Parameter Significance OddsVariable Estimate Level Ratio Estimate Level Ratio
Intercept 1.4558 **** . 0.5577 **** .Loan amount (x $1,000) -0.00099 **** 1.00 -0.00046 *** 1.00Applicant income (x $1,000) -0.0115 **** 0.99 -0.00778 **** 0.99Applicant income squared 0.000013 **** 1.00 8.475E-06 **** 1.00Female applicant 0.0785 *** 1.08 0.1447 **** 1.16White couple (see note 1) -0.5173 **** 0.60 -0.4614 **** 0.63African American (see note 2) 0.9069 **** 2.48 0.3361 **** 1.40Hispanic 0.267 **** 1.31 -0.2308 **** 0.79Other race -0.0906 * 0.91 -0.3918 **** 0.68Race unreported 0.884 **** 2.42 0.6235 **** 1.87Depository institution (see note 3) -2.3009 **** 0.10 -2.1594 **** 0.12FHA-insured loan -3.5459 **** 0.03 -3.879 **** 0.02Approved but not accepted by applicant (see note 4) 1.3536 **** 3.87Denied by lender 1.6186 **** 5.05Withdrawn by applicant 2.5026 **** 12.22Closed incomplete 2.2247 **** 9.25Purchased by lender 0.3439 **** 1.41Tract income as percentage of area median -0.00511 **** 1.00Minorities as percentage of tract population 0.00547 **** 1.01
Number of observations 88,957 88,957 Percentage correctly classified 84.5% 89.2
1. Defined as white male applicant, white female coapplicant.
2. Racial groups are compared with non-hispanic white applicants.
3. Depository institutions are compared with independent mortgage companies that do not take deposits and are not subsidiaries of banks.
4. Actions by lenders are compared with applications that are approved and originated.
*Statistically significant at the 5% level; **at the 1% level; ***at the 0.1% level; ****at the 0.01% level.
Data Source: Federal Financial Institutions Examination Council (2000); Scheeselle (2000).

30
Table B-3. Subprime Loan Segmentation Models, Newark Metropolitan Area, 1993-1999.Home Purchase Home Improvement Refinance
Parameter Odds Std. Parameter Odds Std. Parameter Odds Std.Variable Estimate Ratio Coeff. Estimate Ratio Coeff. Estimate Ratio Coeff.Intercept -3.492 *** . -0.3745 *** . -3.4166 *** .Applicant income ($1,000) -0.00171 *** 1.00 -14.8 -0.0013 *** 1.00 -10.2 -0.00366 *** 1.00 -30.7Loan amount ($1,000) -0.00821 *** 0.99 -32.5 -0.00276 *** 1.00 -7.4 -0.00363 *** 1.00 -17.6Amortized payment ratio -0.00499 *** 1.00 -11.7 0.019 *** 1.02 18.7 0.00523 *** 1.01 12.9Payment ratio squared 0.0000005029 1.00 1.2 -0.00006 *** 1.00 -34.8 -0.00001 *** 1.00 -21.7FHA-insured loan -2.1629 *** 0.12 -56.8 -0.1259 ** 0.88 -4.0 -3.0113 *** 0.05 -31.7Owner-occupied -0.3247 *** 0.72 -6.3 0.00239 1.00 0.0 0.0437 1.05 0.9Traditional white family couple -0.2373 *** 0.79 -10.7 -0.3457 *** 0.71 -13.7 -0.3691 *** 0.69 -16.1Female applicant -0.0661 * 0.94 -2.7 -0.1673 *** 0.85 -6.6 0.016 1.02 0.6Applicant sex unreported -0.7709 *** 0.46 -17.7 -0.0419 0.96 -1.8 -0.4464 *** 0.64 -16.2Native American / Alaska Native 0.6707 *** 1.96 3.9 -1.2348 *** 0.29 -7.7 -0.0552 0.95 -0.3Asian or Pacific Islander -0.3247 *** 0.72 -5.9 -1.4258 *** 0.24 -17.2 -0.7991 *** 0.45 -12.1Black 0.7429 *** 2.10 29.4 -0.0444 0.96 -1.4 0.619 *** 1.86 19.2Hispanic 0.3673 *** 1.44 10.4 -0.2119 *** 0.81 -5.1 0.1646 *** 1.18 3.1Other 0.997 *** 2.71 12.1 0.0484 1.05 0.7 0.7204 *** 2.06 8.8Race unreported 1.4393 *** 4.22 55.9 0.2929 *** 1.34 14.8 1.3401 *** 3.82 84.9Race not applicable 1.9084 *** 6.74 15.3 2.0522 *** 7.79 22.3 2.5501 *** 12.81 32.5Edit failure code 1.9131 *** 6.77 75.3 0.4373 *** 1.55 14.7 1.475 *** 4.37 60.41994 1.5304 *** 4.62 67.3 0.3459 *** 1.41 12.6 2.1505 *** 8.59 91.91995 1.7571 *** 5.80 76.7 1.7355 *** 5.67 80.6 2.6196 *** 13.73 84.81996 2.205 *** 9.07 112.4 1.8646 *** 6.45 89.7 2.7794 *** 16.11 127.41997 2.669 *** 14.43 154.5 2.0429 *** 7.71 111.6 3.5911 *** 36.27 208.11998 2.8355 *** 17.04 193.1 2.6998 *** 14.88 176.0 3.2362 *** 25.44 295.11999 2.8441 *** 17.19 208.0 3.6005 *** 36.62 302.8 3.6404 *** 38.11 361.1Application denied 1.1063 *** 3.02 36.9 0.7037 *** 2.02 39.7 1.256 *** 3.51 62.8Approved, declined by applicant 1.4334 *** 4.19 35.1 0.9962 *** 2.71 37.6 1.2669 *** 3.55 41.9Withdrawn 1.0623 *** 2.89 32.0 1.1682 *** 3.22 35.0 1.4113 *** 4.10 54.5Application closed incomplete 1.1063 *** 3.02 13.5 -0.571 *** 0.57 -6.0 1.3568 *** 3.88 27.3Denied for bad credit 0.4234 *** 1.53 6.5 -0.1288 ** 0.88 -4.0 -0.6074 *** 0.55 -12.1OCC-regulated lender -3.6028 *** 0.03 -76.4 -4.3664 *** 0.01 -88.3 -2.725 *** 0.07 -68.3FRB-regulated lender -2.1752 *** 0.11 -53.7 -4.0426 *** 0.02 -71.8 -1.665 *** 0.19 -44.4FDIC-regulated lender -1.941 *** 0.14 -43.7 -9.7454 *** 0.00 -93.4 -3.4045 *** 0.03 -59.6OTS-regulated lender -2.6468 *** 0.07 -61.3 -5.1984 *** 0.01 -84.1 -2.6707 *** 0.07 -59.6Newark 0.986 *** 2.68 27.1 0.2454 *** 1.28 7.7 0.6674 *** 1.95 19.1East Orange 1.2161 *** 3.37 18.0 0.4447 *** 1.56 9.2 0.7058 *** 2.03 12.7Irvington 1.0741 *** 2.93 17.3 0.4425 *** 1.56 8.5 0.5618 *** 1.75 9.8Nutley -0.1215 0.89 -1.2 -0.11 0.90 -1.2 0.0612 1.06 0.7Belleview 0.275 ** 1.32 3.4 0.5527 *** 1.74 7.6 0.2755 *** 1.32 3.5Bloomfield 0.3457 *** 1.41 5.4 0.5405 *** 1.72 8.1 0.2853 *** 1.33 4.3Glen Ridge 0.0405 1.04 0.3 -0.0647 0.94 -0.4 -0.1693 0.84 -1.2Montclair 0.3289 *** 1.39 4.4 0.2215 * 1.25 2.8 0.1429 ** 1.15 2.0West Orange 0.2399 *** 1.27 4.4 0.232 ** 1.26 3.5 -0.0606 0.94 -0.9Orange 1.0208 *** 2.78 10.7 0.6669 *** 1.95 8.6 0.6482 *** 1.91 7.3South Orange 0.2692 ** 1.31 2.7 -0.0249 0.98 -0.2 0.1161 1.12 1.1Maplewood 0.1334 1.14 1.8 0.5505 *** 1.73 7.3 -0.0428 0.96 -0.5Millburn -0.3284 0.72 -2.3 -0.5313 ** 0.59 -4.5 -0.5813 *** 0.56 -5.0Livingston 0.2366 * 1.27 2.8 -0.3935 ** 0.68 -4.5 -0.205 *** 0.82 -2.6Essex Fells -1.1159 0.33 -2.8 -1.1169 * 0.33 -3.4 -0.6913 * 0.50 -2.1Roseland -0.1529 0.86 -0.9 0.21 1.23 1.0 -0.3549 * 0.70 -1.9Verona -0.2449 0.78 -2.3 -0.0894 0.92 -0.7 -0.154 * 0.86 -1.4Cedar Grove -0.1029 0.90 -0.7 -0.3964 * 0.67 -3.0 -0.2087 * 0.81 -1.7Fairfield 0.016 1.02 0.1 -0.2707 0.76 -1.8 -0.019 0.98 -0.1North Caldwell -0.0855 0.92 -0.4 0.2383 1.27 1.2 -0.2475 0.78 -1.4Caldwell -0.4147 0.66 -2.6 -0.4445 0.64 -2.5 -0.1399 0.87 -0.8West Caldwell 0.1823 1.20 1.4 -0.4245 * 0.65 -3.0 -0.1778 * 0.84 -1.5
Percent correctly classified 90.2 93.0 91.1
Data Source: FFIEC (1994-2000), Scheeselle (2000).

31
Appendix C: ANTI-PREDATORY LENDING MEASURES IN SELECTED JURISDICTIONS5 State law measures to curb predatory lending occur against the backdrop of the Home Ownership Equity Protection Act (HOEPA), 15 U.S.C. 1602(aa). Enacted in 1994, HOEPA provides certain protections for consumers who enter into so-called “high cost” loans with interest rates or fees that exceed specified triggers. As reflected below, the leading state efforts expand upon these protections both by prohibiting certain practices regardless of whether the loan is classified as high cost and by increasing the protections for borrowers of high cost loans. Typically this is done by lowering the triggers (thus increasing the number of loans that are considered high cost) and increasing the protections beyond those provided by the federal law. North Carolina
Anti-Predatory Lending Law enacted and approved July 1999
New York New York Banking Department regulations issued October 2000
New Jersey
Flipping (Multiple refinancings in close proximity)
Prohibited on all loans if no “reasonable tangible benefit” to consumer. G.S. s. 24-10.2(c)
Prohibited to refinance any loan into a high cost loan if, considering all circumstances, unconscionable. S41.5(b)(4)
NOT REGULATED
Financing of Credit Insurance (Single Premium Credit Insurance)
Prohibited for all loans. G.S. s 24-10.2(b)
Prohibited on any high cost loan to finance credit insurance if insufficient ability to repay and, in other cases, amounts limited. S41.3c. 2
PERMITTED but cannot be required. N.J.S.A. 17:11C-21
Additional Consumer Protections for High Cost Loans
YES YES NO
1This chart necessarily summarizes detailed and complicated provisions to demonstrate the significant differences between the legal provisions afforded in the jurisdictions. The statutes and regulations themselves should be referred to for complete coverage. 2 Selling credit insurance without informed consent is also prima facie evidence that lender lacks fitness to be licensed. S41.5(b)(5).

32
Threshold for High Cost Loan3
Alternate triggers: (1) interest rate: APR exceeds comparable treasury by 10%; (2) fees exceed 5% of total loan amount, not counting limited discount and prepayment penalties, and (3) prepayment penalty applies for more than thirty months or costs more than 2% of amount prepaid. G.S. 24-1.1E
Alternate triggers: (1) interest rate: for first, APR exceeds comparable treasury by 8%, and for junior by 9%; and (2) fees exceed 5% of total loan amount, not counting bona fide discount points.
NONE
Protections Provided Borrowers of High Cost Loans (examples)
Prohibits financing of points and fees, lending without demonstrated ability to repay, call provisions, balloon payments, negative amortization; and Requires loan counseling.G.S. 24-1.1E(b).
Prohibits call provisions, balloon payments less than seven years, negative amortization, and Requires recommendation to loan counseling, lender belief in ability to repay, and no financing requirement. S41.3
NONE
Mandatory Arbitration
NOT REGULATED Prohibited in high cost loans when mandatory arbitration clause oppressive and unfair. S41.2
NOT REGULATED
Prepayment Penalties
Prohibited in loans up to $150,000, G.S. s24-1.1A, and, Triggers coverage as high cost loan (see above).
Prohibited to finance payment of penalties if original lender. S41.3c.
Prohibited, N.J.S.A. 46A:10B-2, but preempted as to “alternative mortgages” by AMPTA per Schinn v. Encore Mortgage Services, 96 F.S.2d 419 (D.N.J. 2000)
3 The definition of “fees” for purposes of the threshold calculation is complicated and differs significantly between North Carolina and New York.

33
ENDNOTES
1 James Carr and Jenny Schuetz, Financial Services in Distressed Communities: Framing the Issue, Finding Solutions (Fannie Mae Foundation, August 2001), 3. 2 As many as twelve million households in the United States either have no relationship to traditional financial institutions or depend upon fringe lenders for financial services. These households are disproportionately poor and minority. According to a 1995 study, 25% of lower-income families were unbanked. Sixty percent of African-American households have zero or negative net financial assets. Carr and Schuetz, Financial Services in Distressed Communities, 7. 3 Overall, the homeownership rate rose to 67.4% among all Americans in 2000. While the homeownership rate for whites stands at 73.8%, only 47.6 of African-Americans and 46.3% of Hispanics own their homes. Nonetheless, between 1994 and 2000, the increase in homeownership for minorities significantly outstripped that for whites. During this period, African-American homeownership increased by 24%, and Hispanic homeownership rose by 39%, compared to 9% for whites. Joint Center for Housing Studies of Harvard University, The State of the Nation’s Housing 2001 (2001), 13-14. 4 Because an estimated 80% of subprime loans have penalties for closing out and refinancing them at lower rates, many low-income New Jerseyans are unable to benefit from record low interest rates. James H. Carr and Lopa Kolluri, Predatory Lending: An Overview (Fannie Mae Foundation 2001), 33. The record high level of consumer debt, coupled with an economic downturn, strongly suggests that even more individuals will become susceptible to predatory lending practices. Debt levels are particularly severe for households with annual incomes under $50,000. Arthur B. Kennickell, Martha Starr-McCluer, and Brian Surette, “Recent Changes in U.S. Family Finances: Results from the 1998 Survey of Consumer Finances,” Federal Reserve Bulletin (January 2000), 26. 5 Predatory lending practices in the home purchase context formed the basis of a prominent series of newspaper articles in the Star-Ledger. See, e.g., Roberts, “Real Estate ‘Flipping’ Woes Could Involve Close to 300 Homes,” Star-Ledger, August 17, 2001. Other credit procedures involving low-income consumers, such as payday loans, can also be considered predatory. Paul Beckett, “Exploiting a Loophole, Banks Skirt State Laws on High Interest Rates,” Wall Street Journal, May 25, 2001, A1. 6 Carr and Kolluri, Predatory Lending: An Overview at 32. An interesting alternative definition defines predatory lending “as a syndrome of abusive loan terms or practices that involve one or more of the following: (1) loans that violate common loan underwriting norms to the detriments of borrowers; (2) loans that result in no net benefit to the borrower; (3) loan terms designed to earn supranormal profits; (4) loans involving fraud or deceptive practices; (5) loans involving other misleading nondisclosures that are nevertheless legal; and (6) loans that require borrowers to waive meaningful legal redress.” Kathleen C. Engel and Patricia A. McCoy, A Tale of Three Markets: The Law and Economics of Predatory Lending (September 1, 2001) (available at http://www.law.csuohio.edu/handbook/predatorylending.pdf), 5. 7 For a discussion of thirty predatory lending practices, see statement of William J. Brennan, Jr., Director of the Home Defense Program of the Atlanta Legal Aid Society, to the U.S. Senate Special Committee on Aging (March 16, 1998). 8 The Interagency Guidance on Subprime Lending defines subprime lending as credit extensions “to borrowers who exhibit characteristics indicating a significantly higher risk of default than traditional bank lending customers.” Board of Governors of the Federal Reserve System, Federal Deposit Insurance Corporation, Office of the Comptroller of the Currency, Office of Thrift Supervision, Interagency Guidance on Subprime Lending (March 1, 1999), 1. 9 Freddie Mac, Automated Underwriting: Making Mortgage Lending Simpler and Fairer for America’s Families (September 1996), Chapter 5 (reporting that 10 to 35 percent of subprime borrowers could qualify for prime loans); Fannie Mae Press Release, March 2, 2000 (reporting that half of subprime borrowers could qualify for conventional financing). Freddie Mac researchers compared interest rates on “A-minus” loans originated by subprime lenders with rates on “A-minus” prime loans purchased and rated by Freddie Mac, and found that the subprime loans on average had interest rates that were 2.15% higher than the prime loans, with no apparent justification for the higher rates. Howard Lax, Michael Manti, Paul Raca, and Peter Zorn, Subprime Lending: An Investigation of Economic Efficiency (Freddie Mac, Feb. 25, 2000). Lower-income consumers who receive mainstream credit perform roughly the same as middle and upper income households receiving similar credit, so subprime lending to low-income borrowers cannot be justified by perceived differences in credit quality between different income groups. Carr and Kolluri, Predatory Lending: An Overview, 36-7. 10 United States Department of Housing and Urban Development (HUD), Unequal Burden: Income and Racial Disparities in Subprime Lending in America (April 2000); HUD-Treasury Task Force on Predatory Lending, Curbing Predatory Home Mortgage Lending (2000). These numbers present a conservative estimate of the increase in both subprime and predatory lending; one consumer advocacy group calculates that 66% of subprime mortgage

34
and finance company loans are not reported under the Home Mortgage Disclosure Act, the vehicle through which most data on lending patterns are collected. Community Reinvestment Association of North Carolina, Introduction to Predatory Lending Policy. 11This was an increase from the third quarter of 2001, when S&P rated 22 transactions totaling $13.3 billion. MortgageDaily.com. "S&P Releases 4Q2001 RMBS Mortgage Trends Report." MortgageDaily.com, January 25, 2002. World Wide Web page, available at http://www.mortgagedaily.com/RmbsTrndsS&p012502.html, accessed 31 January 2002. 12 Woodstock Institute, Two Steps Back: The Dual Mortgage Market, Predatory Lending, and the Undoing of Community Development (1999), 12. 13 Mortgage brokers arrange, but do not provide the financing for, mortgage transactions typically in return for a fee from the lender. Edwin McDowell, “A Booming Business in Selling Money,” New York Times, December 2, 2001, Section 11, 1. 14 The hearings and research of the HUD-Treasury Task Force revealed implication of mortgage brokers in most cases, and demonstrated the disturbing consequences of this involvement. HUD-Treasury Task Force, Curbing Predatory Home Mortgage Lending, 79-83. 15 Joint Center for Housing Studies of Harvard University, The State of the Nation’s Housing 2001 (2001), 14. 16 Kathleen C. Engel and Patricia A. McCoy, A Tale of Three Markets: The Law and Economics of Predatory Lending (September 1, 2001; forthcoming in Texas Law Review; currently available at http://www.law.csuohio.edu/handbook/engel.html), 26. 17 AARP Public Policy Institute, Progress in the Housing of Older Persons: A Chartbook (August 1999), 24. 18 Engel and McCoy, A Tale of Three Markets, 39, n.119. 19 HUD-Treasury Task Force, Curbing Predatory Home Mortgage Lending, 18. The president of the National Association of Affordable Housing Lenders recently reported that only thirty percent of subprime loans are made by depository institutions subject to periodic exams. “Better Laws, Rules, Stepped-Up Enforcement Seen as Keys to Curbing Predatory Lending,” Housing and Development Reporter, August 20, 2001, 239. Further, in contrast to the standards set by Fannie Mae or Freddie Mac in the conventional lending market, there are no general standards for subprime underwriting or servicing. 20Courts have not determined conclusively whether yield spread premiums are per se unlawful under the provisions of the Real Estate Settlement Practices Act (RESPA). In Culpepper v. Island Mortgage Corp., 132 F.3d 692 (11th Cir. 1998) and Moses v. Citicorp Mortgage, Inc., 982 F. Supp. 897 (E.D.N.Y. 1997), courts found that yield spread premiums were prohibited as kickbacks; in Barbosa v. Target Mortgage Corp., 968 F. Supp. 1548 (S.D. Fla. 1997), by contrast, the court held that a yield spread premium could be considered to be a legitimate payment for goods and services. The Senate Banking committee has been holding a series of hearings on yield-spread premiums, most recently in January 2002. See, for example, http://www.senate.gov/~banking/02_01hrg/010802/jackson.htm. 21 Carr and Kolluri, Predatory Lending: An Overview, 33 (80%). The figure cited by mortgage-backed securities analysts is slightly lower, at 70%. HUD-Treasury Task Force, Curbing Predatory Home Mortgage Lending, 93. 22 Eighteen percent of high-income minority homeowners refinance with subprime lenders. This is the same percentage as low-income white homeowners who refinance with subprime lenders. Joint Center for Housing Studies of Harvard University, The State of the Nation’s Housing, 17. As a result, subprime lenders disproportionately dominate refinancing activity in minority areas. Further, Carr and Kolluri note that according to a 1999 Freddie Mac study black households have twice the credit problems of non-Hispanic whites, but rely on the subprime market four times as much for mortgage credit. Carr and Kolurri, Predatory Lending: An Overview, 37. 23 According to a 1997 Gallup study undertaken by Freddie Mac, 35% of subprime borrowers were fifty-five or older compared to 21% in the prime market; only 38% of subprime borrowers had college educations compared to 60% of prime borrowers; and 33% of subprime borrowers were unfamiliar with mortgages and 42% were unlikely to search for the best rate, compared to 21% of prime borrowers who stated that they were unfamiliar with them, and 25% who were unlikely to search for the best rate. Faith Schwartz, Director of Alternative Markets for Freddie Mac, paper prepared for American Conference Institute conference (June 28, 2001), 5-7. 24 The HUD-Treasury report found, for example, that 45% of all foreclosure petitions in Baltimore County resulted from subprime loans, while just 21% of originations were subprime. HUD-Treasury Task Force, Curbing Predatory Home Mortgage Lending, 50, n.67-8. An analysis of one subprime lender revealed that one-quarter of all loans were at or near foreclosure two years after origination; the figure for FHA loans at or near foreclosure is .5%. Eric Stein, Quantifying the Economic Cost of Predatory Lending (Coalition for Responsible Lending, July 25, 2001), 11, n.38. 25 Using loans insured by the Federal Housing Administration (FHA) as a proxy for subprime loans since the necessary data for subprime loans is not separately collected, the FDIC found that the delinquency rate on FHA-insured mortgages rose 2.3 percentage points to 11.4 percent in the year ending September 2001. In contrast, the national delinquency rate on conventional mortgages as reported by the Mortgage Bankers Association rose by only 0.6 points over the same period. http://www.fdic.gov/bank/analytical/fyi/fyi020702.html

35
26 12 U.S.C. § 2801. HMDA requires federally regulated depository institutions to supply annual data on race, gender, and income of loan applicants, census tracts in which homes are located, and amounts, purposes, and acceptance or rejection of loan applications. It does not require reporting of aspects of loans that would identify them as subprime or predatory, such as interest rates or other loan terms. Instead, researchers traditionally rely upon HUD designations of lenders as subprime. 27See appendix B for an explanation of the statistical analysis of HMDA data performed by Prof. Elvin Wyly of the Bloustein School that forms the basis for the discussion. 28 HMDA defines a structure as "single family" if it has four or fewer dwelling units. 29 Some of the expansion of the subprime market share results from increased HMDA reporting by subprime lending institutions. HMDA covers most, but not all, prime and subprime lenders, and there is debate on the level of non-disclosure in the subprime market. Correspondent banking relationships and other factors add further complications to the debate over HMDA coverage. HUD estimates that its national subprime lender list, matched to annual HMDA releases, covered only 38 percent of all subprime single-family originations in 1993, and 48 percent in 1998. As a result, this analysis of subprime market share probably substantially underestimates the true subprime market penetration. Randall M. Scheessele, 1998 HMDA Highlights, Housing Finance Working Paper No. 9 (U.S. Department of Housing and Urban Development, Office of Policy Development and Research, 1999); Randall M. Scheessele, HMDA Coverage of the Mortgage Market, Housing Finance Working Paper No. 7 (U.S. Department of Housing and Urban Development, Office of Policy Development and Research, 1998). 30 In this analysis, low-income neighborhoods are defined as census tracts with median household income less than 80 percent of the metropolitan median (according to the 1990 Census), while high-income neighborhoods are defined as tracts with median incomes 120 percent or more of the metropolitan median. 31 For a description of the method by which the regression analyses were conducted, see Appendix B. 32 Performed by graduate students from the Bloustein School, this analysis reviewed foreclosure documents maintained by the Clerk of the Superior Court, Foreclosure Division office in Trenton. The review entailed 833 case files involving foreclosures from Essex County in 1995 and 2000, and gathered data on ten variables: lending institution; defendant; loan origination date; foreclosure date; original loan amount; original interest rate; municipality of foreclosed property; census tract; loan duration; and whether the lending institution was identified as subprime. This analysis necessarily understates the connection between subprime lenders and foreclosures because it was only able to identify the lender seeking foreclosure. Thus, it would not include any loan which was made by a subprime lender but sold or assigned prior to foreclosure. Given that less than half of all subprime loans are kept in portfolio rather than sold, it is reasonable to assume that the foreclosure rate is significantly larger than what is reflected here. 33 See Jordan, George, “New Jersey foreclosures jump 15%” Star-Ledger, August 29, 2001, at 49. 34 The analysis used lis pendens notices to track troubled loans. Lis pendens notices are filed on public record to provide warning that title to a particular property is in litigation; a mortgage lender, therefore, files a lis pendens after the borrower has defaulted, and before a court judgment of foreclosure has been rendered. These loans are in “preforeclosure” status. Figure 4 in appendix A presents the location of properties for which lis pendens were filed in Essex County between August 2000 and August 2001. Figure 5 in appendix B standardizes the magnitude of preforeclosure activity according to overall levels of mortgage demand. The map is constructed by calculating, for each census tract in the county, a ratio between a) the number of lis pendens filings during calendar year 1999, and b) the number of single-family loans approved and originated (as reported in HMDA files) between the beginning of 1993 and the end of 1998. Figure 5 is thus an estimate of the default rate for a particular cohort of loans made during the comparatively favorable economic climate of the 1990s. 35In August 2000, the state Department of Banking and Insurance conducted three hearings, one purpose of which was to evaluate the prevalence of predatory lending in the state. Unfortunately, the Department of Banking and Insurance never followed up on these hearings with the publication of a report. In a subsequent speech, the former Commissioner of Banking stated: “There was evidence that some individuals had been injured by practices that may fairly be called ‘predatory.’ However, no statistical evidence of widespread predatory financial practices in New Jersey was provided.” Comments of Commissioner Suter to League of Municipalities, October 12, 2000 (written version distributed by Department of Banking and Insurance). Given the lack of a published report, it is difficult to assess the basis for this statement. Due to the limitations in the available data, statistical evidence cannot be obtained which establishes definitively either the existence or lack of existence of predatory lending. The detailed presentation provided in the text, however, demonstrates the strong basis, statistical and otherwise, for concluding that this is a critical problem demanding an immediate public policy response. 36 See Diana B. Henriques with Lowell Bergman, “Mortgaged Lives: Profiting From Fine Print with Wall Street’s Help,” New York Times, March 15, 2000, A1; Bruce Lambert, “New York Planning Crackdown on Excessive Home Loan Fees,” New York Times, March 16, 2000, A1.

36
37 These data were collected from the Superior Information Services (SIS) and are reported in “Vailsburg Housing in Distress,” a report of the Student Community Assistance Program Project (December 15, 2001), 39-40. 38 Interview with Mike Farley, February 6, 2001. 39 Eric Stein, Quantifying the Economic Cost of Predatory Lending (Coalition for Responsible Lending, July 25, 2001), 18. See http://www.responsiblelending.org/Quant10-01.PDF. Self-Help arrived at these figures by focusing upon three areas: (1) excessive fees and penalties provided as part of the loan, including single-premium credit insurance and prepayment penalties, (2) rate-risk disparities (when borrowers are charged more than the credit profile warrants), and (3)excessive foreclosures. Acknowledging that much necessary data in these areas is not collected, Self-Help drew upon a broad array of studies and analyses to arrive at its figures and provides detailed explanation to set forth how it did so. The New Jersey figures were arrived at simply by dividing the overall cost nationally by the percentage of 2000 U.S. loan volume occurring in the state. Id. at 19. 40 15 U.S.C. 1602(aa). Implementing regulations are 12 C.F.R. 226.32. 41 Until Federal Reserve Board action in December 2001, HOEPA applied to any loan that provided for an annual percentage rate exceeding by more than 10 percentage points the comparable treasury yield or one with points and fees in excess of the greater than eight percent or $545. 12 C.F.R. 226.32. Using authority provided for in the law, the Federal Reserve Board recently lowered the interest rate trigger by 2 percentage points. Press Release, Federal Reserve Board (December 12, 2001). The details of the so-called fee trigger are also significant since what is included and excluded from the fee trigger significantly affects the extent of protection it affords. 42HOEPA eliminates the protection of the holder-in-due-course doctrine for purchasers and assignees of HOEPA mortgages. 15 U.S.C. §§ 1641(d)(1). 43The Federal Reserve Board analysis in support of its reduction of the interest rate trigger found that 37.6% of subprime loans charged interest rates within 2 percentage points of the prior interest rate trigger. Memorandum to Board of Governors re: Regulatory Analysis of Proposed Revisions to Regulation Z Concerning Predatory Lending Practices, November 28, 2001, 4. . 44 12 U.S.C. 3801 et seq. 45 Geoffrey M. Connor, “How To Be a Predatory Lender: And How Banks Can Begin to Put an End to the Practice,” New Jersey Law Journal, August 28, 2000, 28. In New Jersey and other jurisdictions, federal courts have found that AMTPA preempts state law prohibitions on prepayment penalties and other important protections against predatory practices. Shinn v. Encore Mortgage Services, Inc. 2000 WL 558635 (D.N.J. 2001); NHEMA v. FACE, 1999 WL 704719 (E.D. Va. 1999). In April, 2000, the OTS issued a notice of proposed rule-making regarding AMTPA and its consequences for measures designed to curb predatory lending, but has not taken any further action. Former Attorney General Farmer joined with attorneys general from 43 other states in a letter supporting measures to amend AMTPA to restore state consumer law protections. 46 Connor, “How to Be a Predatory Lender,” 29. 47 North Carolina’s Predatory Lending Law, enacted in 1999, amended the state’s usury law (S. 1149, enacted as Chapter 332 of the 1999 Session Laws). A second North Carolina law, passed in August 2001, addressed licensing of mortgage lenders and brokers (S. 904, enacted as Chapter 393 of the 2001 Session Laws). 48 See North Carolina Mortgage Lending Act, Senate Bill 904. S 53-243.10(4). The law, which goes into effect on July 1, 2002, also prohibits mortgage brokers from brokering a loan of less than $150,000 which contains a prepayment penalty. S. 53-243.11(10). 49 The applicable New Jersey law is the Licensed Lender Act and is a lesser extent, Home Repair Financing Act, N.J.S.A. §§ 17:16C-62 et seq. 50 Connor, “How to Be a Predatory Lender,” 31. 51 The New Jersey Department of Banking and Insurance enforces the Licensed Lenders Act and the Home Repair Financing Act. It also investigates complaints filed by consumers, more than half of which are related to home repairs, and examines its licensees every eighteen months to two years. The Commissioner of Banking and Insurance has the authority to refuse to issue, suspend, or revoke a license, or to impose a penalty, if she or he finds that a licensee or applicant has violated provisions of these laws or otherwise misrepresented him or herself or engaged in destructive conduct. New Jersey’s Attorney General enforces the Consumer Fraud Act through the state’s Division of Consumer Affairs, and civil rights law through the Division on Civil Rights. 52 This can be done by expanding the exclusive focus on safety and soundness concerns, which must remain a central component of state examinations. Federal regulators have provided increased guidance on how this can be accomplished. See, for example, http://www.fdic.gov/regulations/compliance/manual especially at Fair Lending compliance pages 79-81. 53Answers from the Mortgage Bankers Association Responding to Questions from Senator Zell Miller (D-GA) at 2. 54 Citigroup, Household International, American General, Bank of America, Chase, SunTrust, Option One, First Union and Wachovia all have determined to limit or no longer offer single-premium credit insurance. Eric Stein and Martin Eakes, Single Premium Credit Insurance Should be Banned Outright (Coalition for Responsible Lending, August 2, 2001), 2; Jathon Sapsford, “Citigroup Will Halt Home-Loan Product Criticized by Some as Predatory

37
Lending, Wall Street Journal, June 29, 2001, A3; Anitha Reddy, “Household Alters Loan Policy; Lender Joins Citigroup in Dropping Controversial Insurance,” Washington Post, July 12, 2001, E3; Patrick McGeehan, “Third Insurer to Stop Selling Single-Premium Credit Life Policies,” New York Times, July 21, 2001, C3. 55 Ameriquest’s Mortgage Companies Retail Best Practices (2001), 7. Other notable practices include a commitment to report promptly positive payment histories to credit bureaus, analysis of ability to repay the loan for all borrowers, recommendation of credit counseling, and extensive and mandatory fair lending training to all personnel. 56 Fannie Mae Lender Letter 3-00, Eligibility of Mortgages to Borrowers with Blemished Credit Records (April 11, 2000). 57 Fannie Mae’s program is called Timely Payment Rewards and offers a 2% lower note rate, and an automatic 1% rate reduction after 24 consecutive timely payments in the first four years. 58 Begun in June 2000, NORMAL closed eighteen loans totaling $1.1 million as of August 2001. Lending institution commitments total $2.2 million. The Parodneck Foundation’s efforts are more recent, but appear promising, and have received foundation support in addition to support from Fannie Mae. 59Mandatory arbitration clauses have been restricted by legislation in other states and in model legislation proposed by state and national advocacy groups. A recent decision in the Appellate Division upheld arbitration agreements accompanying mortgage loan agreements. 60 In July of 2001, the New Jersey Appellate Division issued an important decision in Associates Home Equity Services v. Troup, No. A-3410-00T1F (N.J. Super. Ct. App. Div. 7/25/01) and permitted a civil rights defense in a predatory lending case despite the expiration of a statute of limitations for affirmative relief based on equitable recoupment grounds. 61A recent empirical study by Freddie Mac, for example, found that borrowers receiving individual pre-purchase homeownership counseling experienced a 34 percent reduction in 90-day delinquency rates. Abdighani Hirad and Peter M. Zorn, A Little Knowledge is a Good Thing: Empirical Evidence of the Effectiveness of Pre-Purchase Homeownership Counseling (Freddie Mac, May 22, 2001). 62 See http://www.federalreserve.gov/boarddocs/press/boardacts/2002/20020207/attachment2.pdf. For a more detailed discussion of ways to improve HMDA to address predatory lending concerns, see HUD-Treasury Task Force, Curbing Predatory Home Mortgage Lending, 99-103. 63 See HUD-Treasury Task Force, Curbing Predatory Home Mortgage Lending, 101-102.

38
About The Authors Ken Zimmerman is the Executive Director of the New Jersey Institute for Social Justice. Previously, he served as Deputy Assistant Secretary in HUD’s Office of Fair Housing and Equal Opportunity and as a Senior Trial Attorney with the United States Department of Justice’s Civil Rights Division, focusing on housing and lending discrimination cases. He has taught as an adjunct law professor at American University’s Washington College of Law, as an instructor at the Attorney General’s Advocacy Institute, and in Stanford University’s Washington, D.C. program. He has also served as a Wasserstein Public Interest Fellow from Harvard Law School and received from that law school the Ferguson Human Rights and Development Fellowship. He is a graduate of Yale College and Harvard Law School. Elvin Wyly , Ph.D., is an Assistant Professor in the Department of Geography and the Center for Urban Policy Research at Rutgers University. His research and teaching focuses on housing and labor market processes and public policy in U.S. cities. His published work has appeared in many different outlets, including Housing Policy Debate, Urban Affairs Review, the Journal of Urban Affairs, Economic Geography, the Professional Geographer, and the Journal of Housing Research. His research has been sponsored by the U.S. Department of Housing and Urban Development, the Fannie Mae Foundation, and the Ford Foundation. Hillary Botein is a doctoral student in the division of Urban Planning at Columbia University, where she is working on a dissertation examining the relationship between labor unions and housing policies in New York City. In 2001-2, she is a Public Policy Fellow at Columbia. Previously, Ms. Botein worked for more than a decade in a variety of settings as a lawyer and policy analyst on issues involving low-income housing, economic justice, and community-based economic development. Ms. Botein received her J.D. from Northeastern University School of Law and her B.A. from Swarthmore College.