Predation & Herbivory Photo of acorns & weevil grub from .
21
Predation & Herbivory acorns & weevil grub from http://www.insectimages.org/browse/detail.cfm?imgnum=0014201
-
Upload
dorcas-park -
Category
Documents
-
view
214 -
download
0
Transcript of Predation & Herbivory Photo of acorns & weevil grub from .

Predation & Herbivory
Photo of acorns & weevil grub from http://www.insectimages.org/browse/detail.cfm?imgnum=0014201
Predators (active foragers, ambush predators, sit-and-wait predators, etc.)
generally kill and consume prey
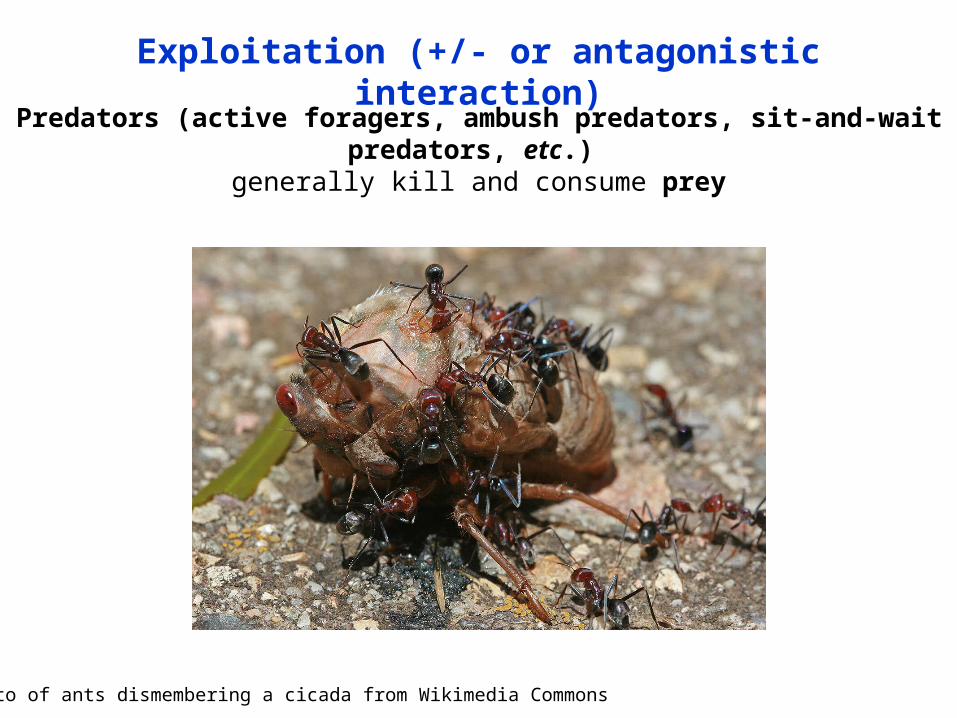
Exploitation (+/- or antagonistic interaction)
Photo of ants dismembering a cicada from Wikimedia Commons
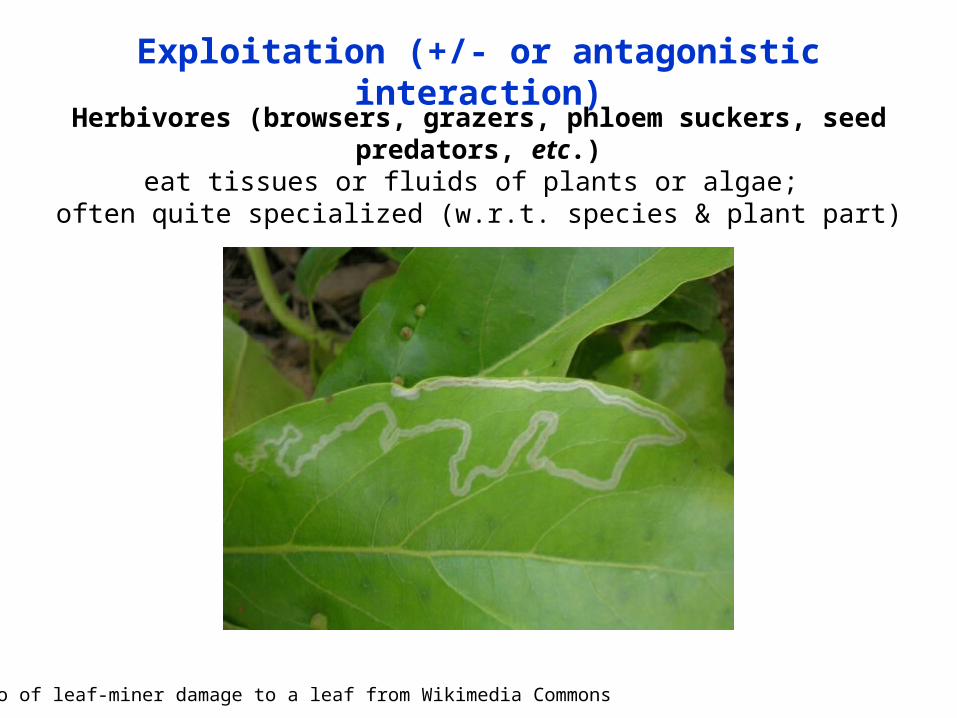
Exploitation (+/- or antagonistic interaction)
Herbivores (browsers, grazers, phloem suckers, seed predators, etc.)eat tissues or fluids of plants or algae;
often quite specialized (w.r.t. species & plant part)
Photo of leaf-miner damage to a leaf from Wikimedia Commons
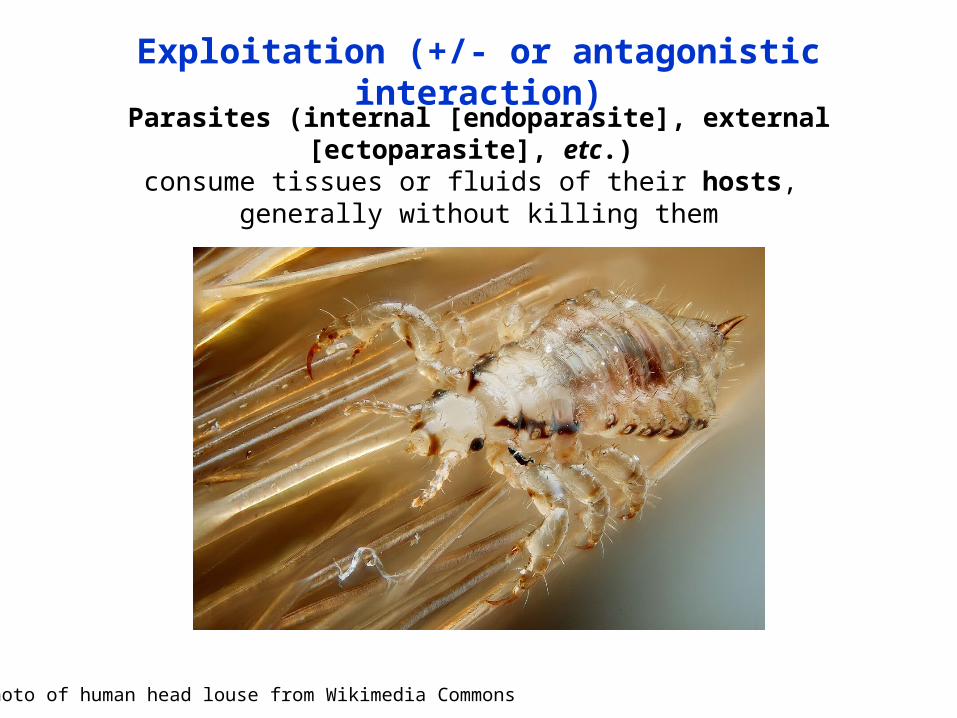
Exploitation (+/- or antagonistic interaction)
Parasites (internal [endoparasite], external [ectoparasite], etc.) consume tissues or fluids of their hosts,
generally without killing them
Photo of human head louse from Wikimedia Commons
Exploitation (+/- or antagonistic interaction)
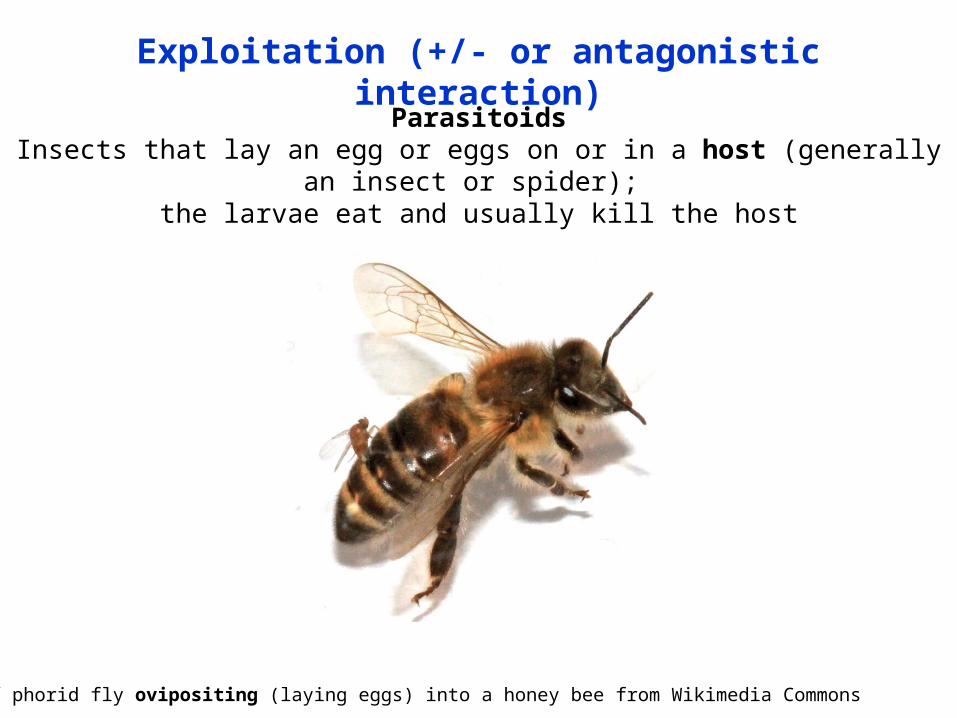
ParasitoidsInsects that lay an egg or eggs on or in a host (generally an insect or spider);
the larvae eat and usually kill the host
Photo of phorid fly ovipositing (laying eggs) into a honey bee from Wikimedia Commons

Exploitation (+/- or antagonistic interaction)
PathogensParasites that cause disease
(which manifests as pain, dysfunction or death)
Photomicrograph of an Ebola virion (a complete virus particle) from Wikimedia Commons
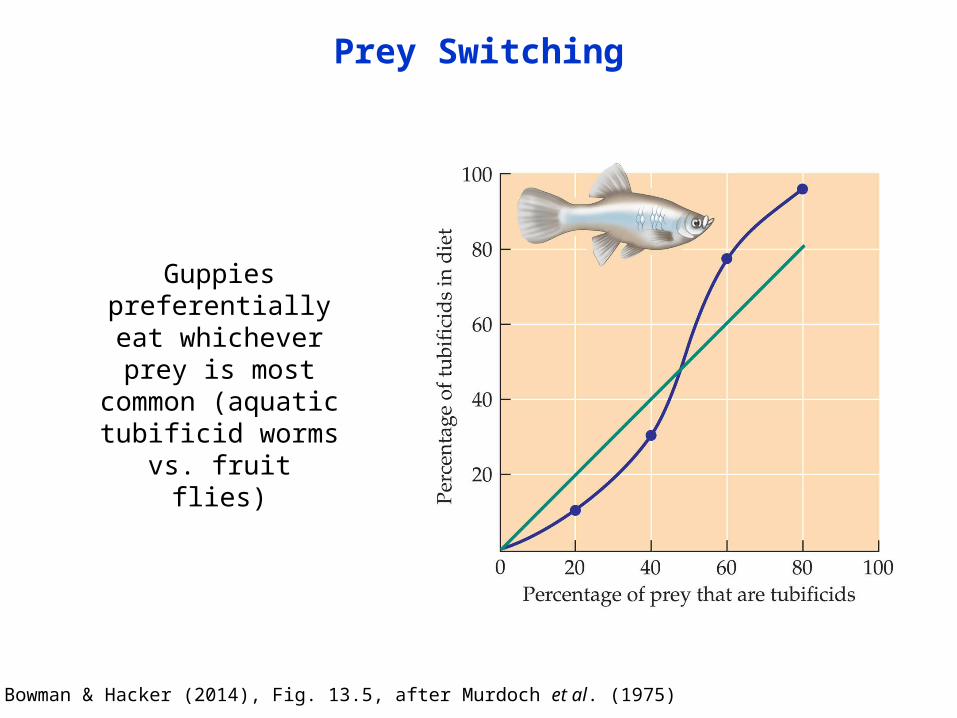
Prey Switching
Cain, Bowman & Hacker (2014), Fig. 13.5, after Murdoch et al. (1975)
Guppies preferentially eat whichever prey is
most common (aquatic tubificid
worms vs. fruit flies)

P
H
-
P
Solid arrows indicate direct effects, dotted arrows indicate indirect effects
-++
-
Original idea from Holt (1977); figure redrawn from Menge (1995) & Morin (1999); photo of Holt from http://people.biology.ufl.edu/rdholt/
Robert Holt
Apparent Competition
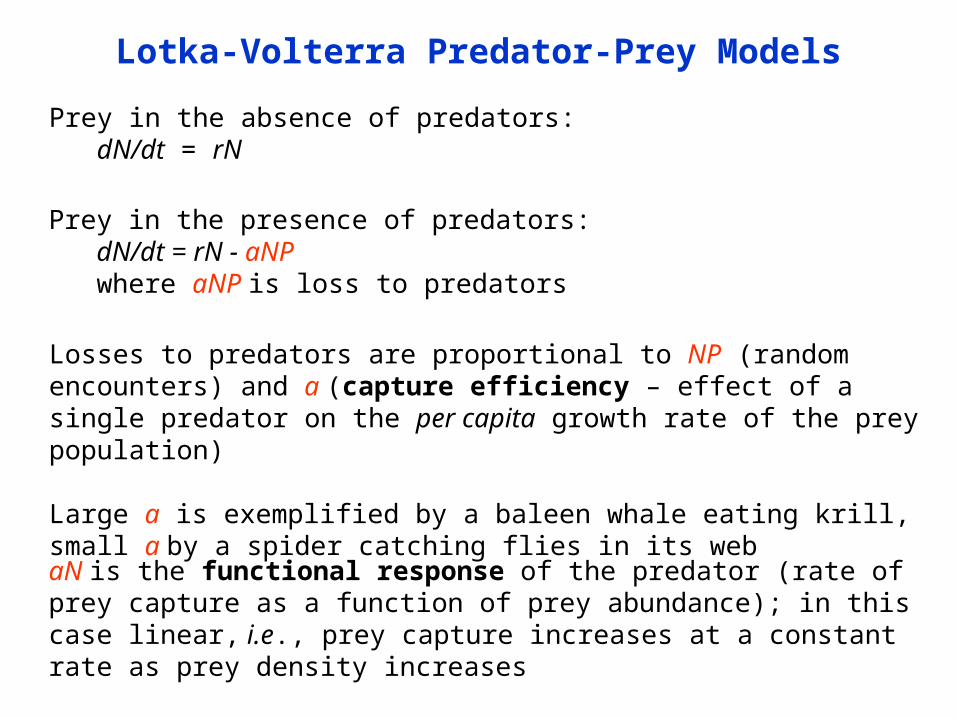
Prey in the absence of predators:dN/dt = rN
Losses to predators are proportional to NP (random encounters) and a (capture efficiency – effect of a single predator on the per capita growth rate of the prey population)
Large a is exemplified by a baleen whale eating krill, small a by a spider catching flies in its web
Prey in the presence of predators:dN/dt = rN - aNPwhere aNP is loss to predators
aN is the functional response of the predator (rate of prey capture as a function of prey abundance); in this case linear, i.e., prey capture increases at a constant rate as prey density increases
Lotka-Volterra Predator-Prey Models

Satiation
Host-switching, developing a search image, etc.
Why might functional responses have these shapes?
R
ate
of p
rey
capt
ure
Victim abundance (V)
Figure from Gotelli (2001), after Holling (1959)
Functional Response Curves
Prey abundance (N)
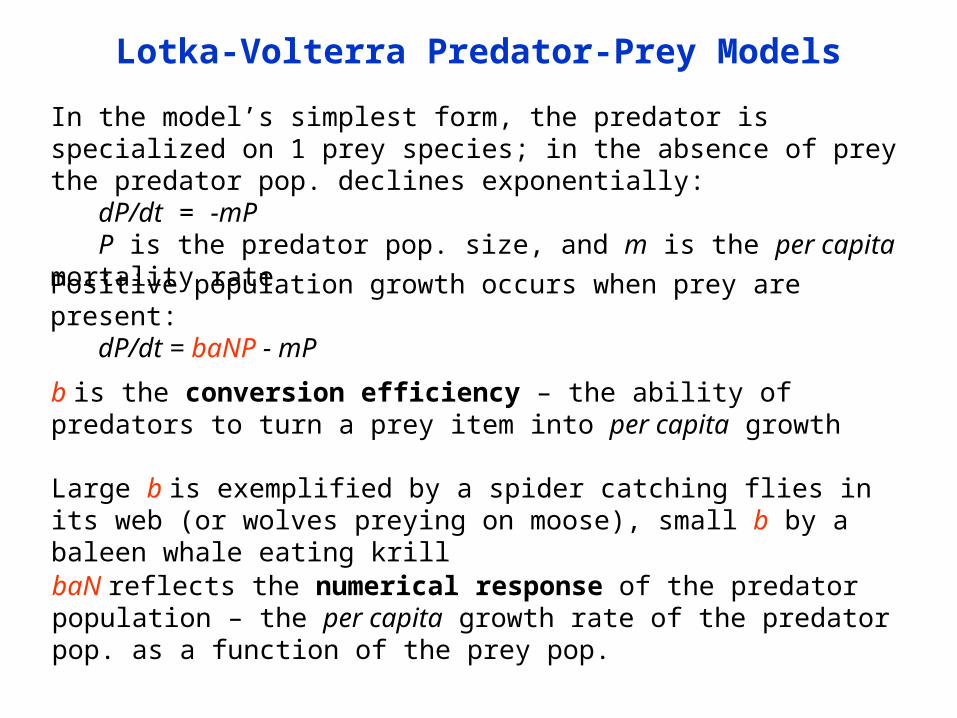
In the model’s simplest form, the predator is specialized on 1 prey species; in the absence of prey the predator pop. declines exponentially:
dP/dt = -mP P is the predator pop. size, and m is the per capita mortality rate
Positive population growth occurs when prey are present:dP/dt = baNP - mP
b is the conversion efficiency – the ability of predators to turn a prey item into per capita growth
Large b is exemplified by a spider catching flies in its web (or wolves preying on moose), small b by a baleen whale eating krill
baN reflects the numerical response of the predator population – the per capita growth rate of the predator pop. as a function of the prey pop.
Lotka-Volterra Predator-Prey Models
dN/dt > 0
dN/dt < 0
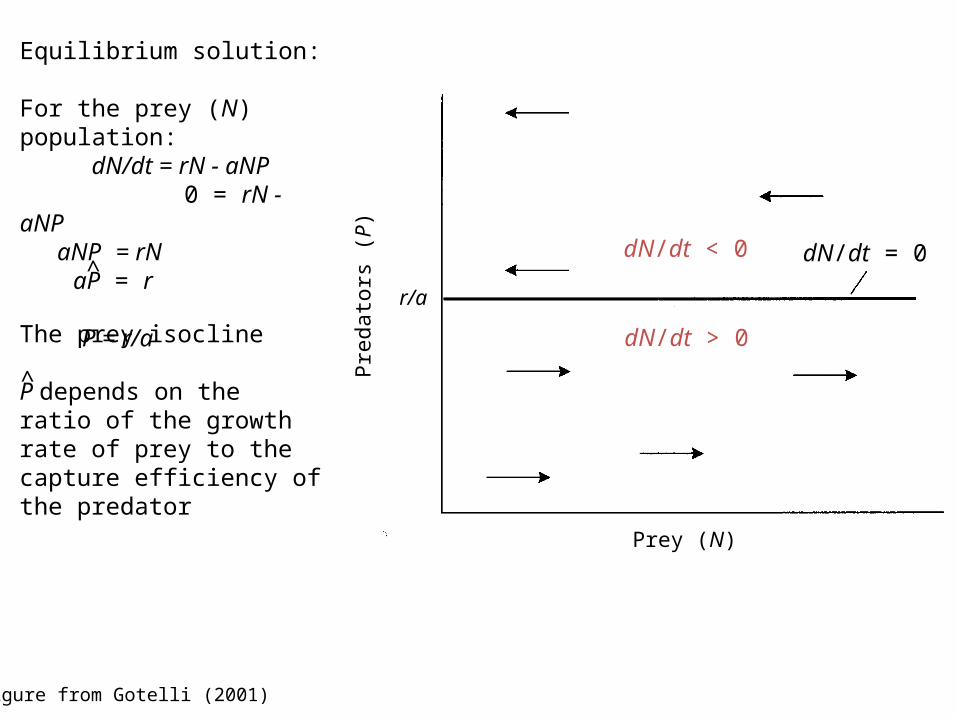
Equilibrium solution:
For the prey (N) population: dN/dt = rN - aNP 0 = rN - aNP aNP = rN aP = r
P = r/a
The prey isocline
P depends on the ratio of the growth rate of prey to the capture efficiency of the predator
^
Figure from Gotelli (2001)
Prey (N)
Pre
dato
rs (
P)
r/a
dN/dt = 0^
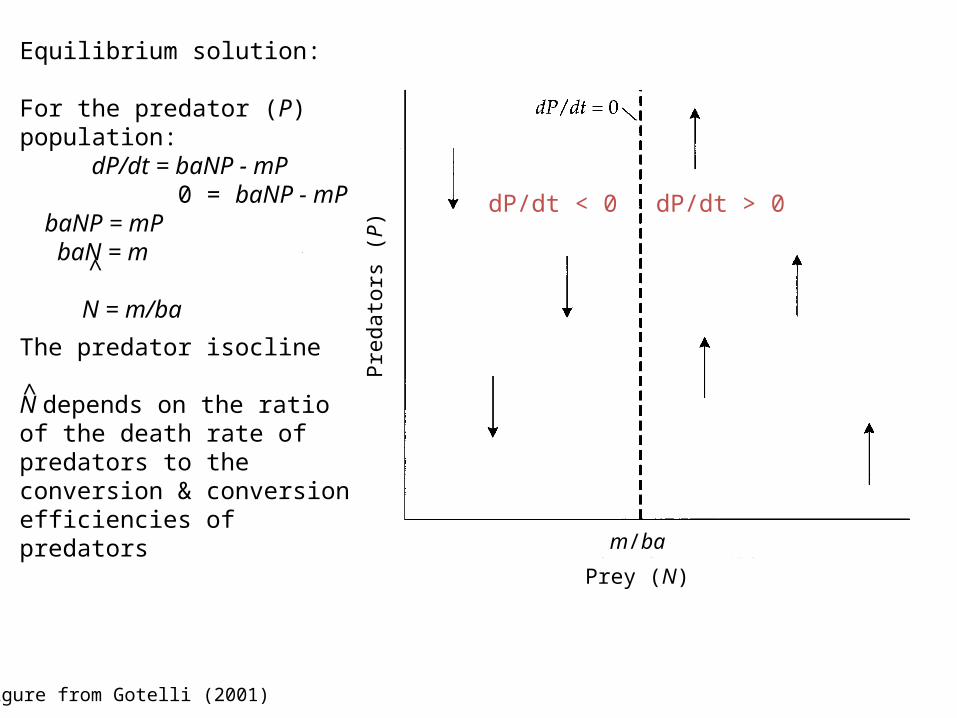
The predator isocline
N depends on the ratio of the death rate of predators to the conversion & conversion efficiencies of predators
Equilibrium solution:
For the predator (P) population: dP/dt = baNP - mP 0 = baNP - mP baNP = mP baN = m
N = m/ba
dP/dt > 0dP/dt < 0
^
Figure from Gotelli (2001)
Prey (N)
Pre
dato
rs (
P)
^
m/ba
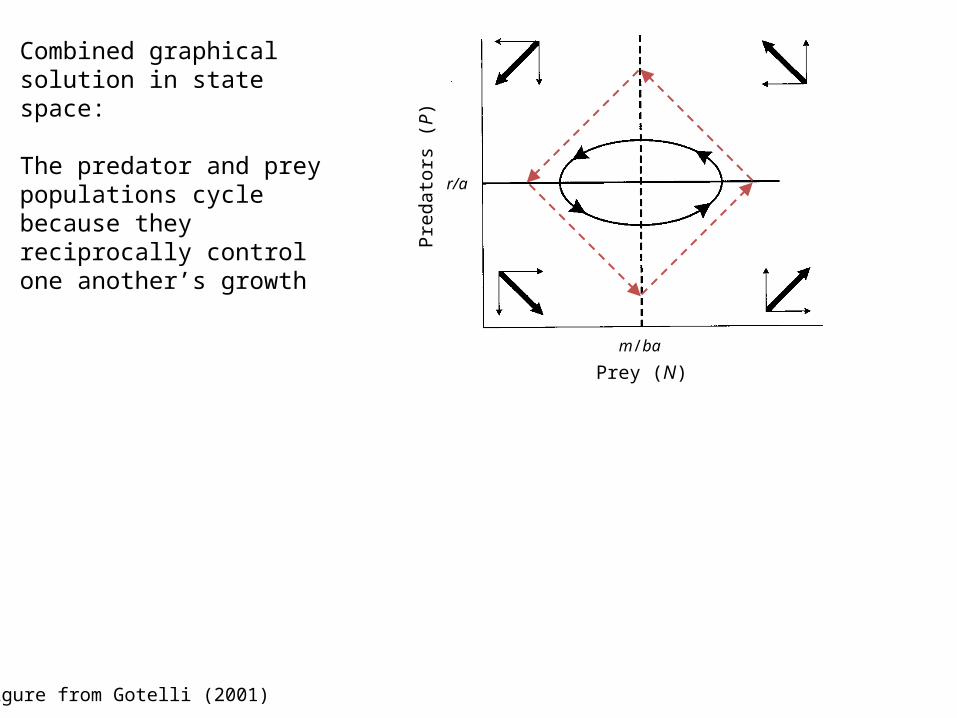
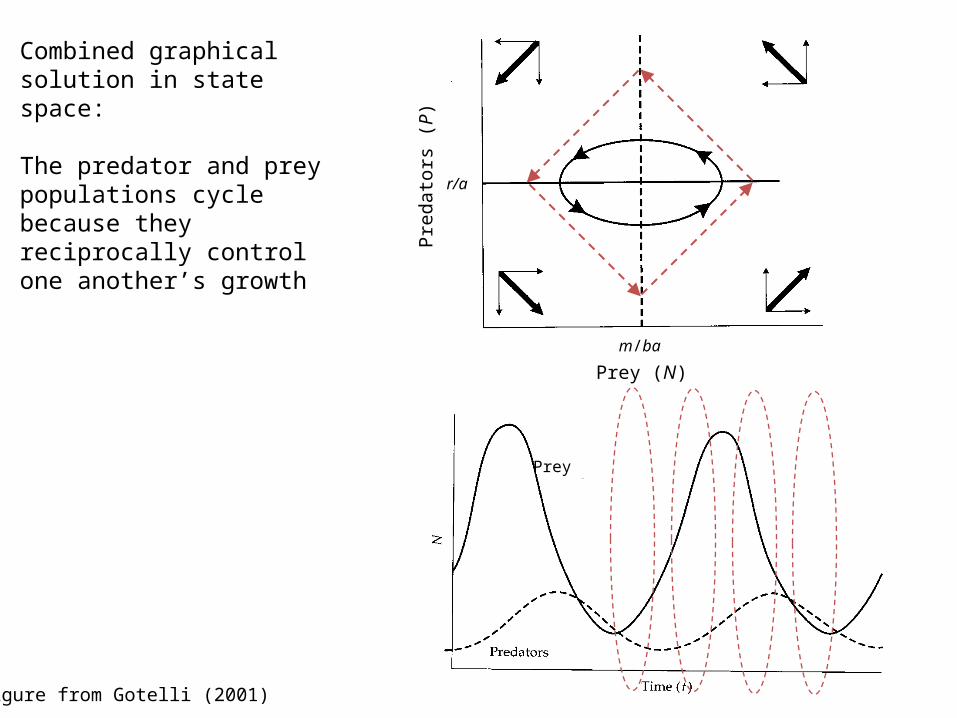
Combined graphical solution in state space:
The predator and prey populations cycle because they reciprocally control one another’s growth
Figure from Gotelli (2001)
Prey (N)
Pre
dat
ors
(P)
m/ba
r/a
Combined graphical solution in state space:
The predator and prey populations cycle because they reciprocally control one another’s growth
Figure from Gotelli (2001)
Prey (N)
Pre
dat
ors
(P)
m/ba
r/a
Prey
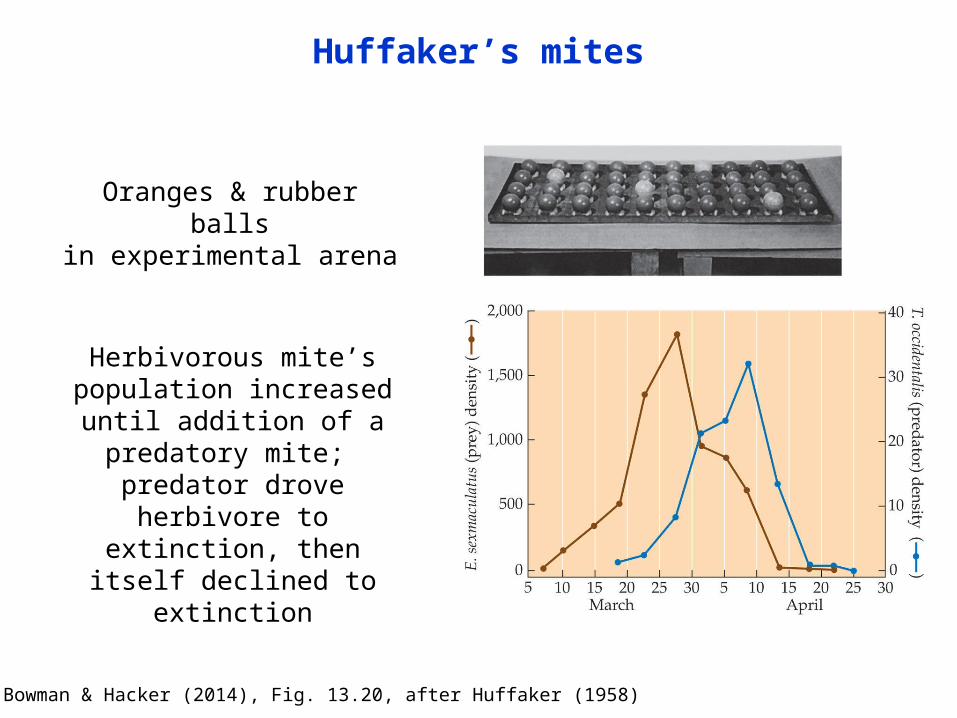
Huffaker’s mites
Cain, Bowman & Hacker (2014), Fig. 13.20, after Huffaker (1958)
Oranges & rubber ballsin experimental arena
Herbivorous mite’s population increased until addition of a
predatory mite; predator drove herbivore to
extinction, then itself declined to extinction
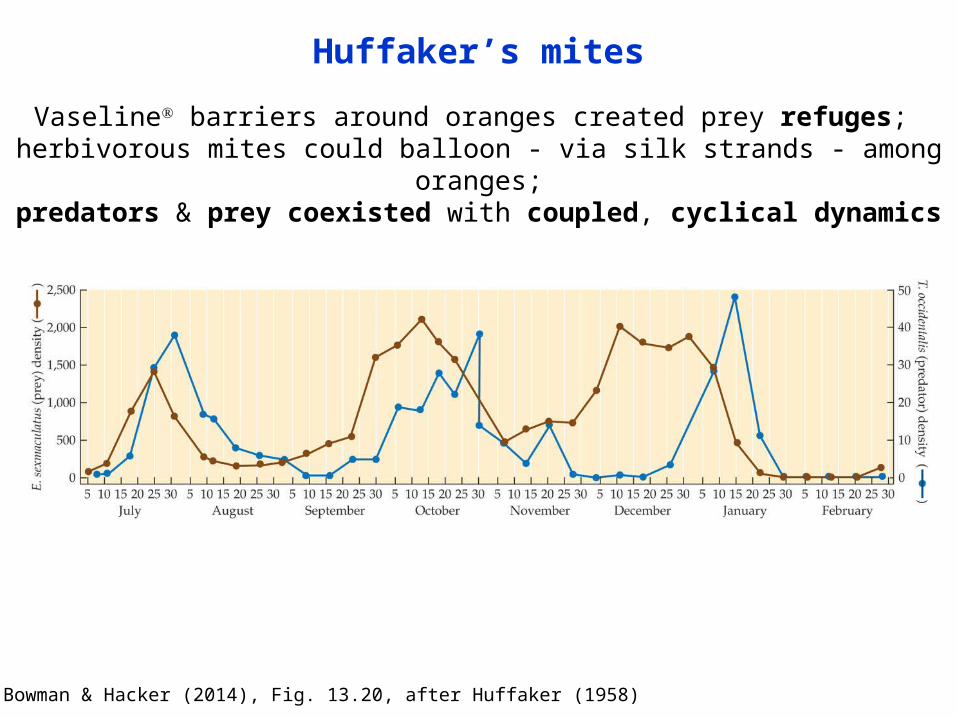
Huffaker’s mites
Cain, Bowman & Hacker (2014), Fig. 13.20, after Huffaker (1958)
Vaseline barriers around oranges created prey refuges; herbivorous mites could balloon - via silk strands - among oranges;
predators & prey coexisted with coupled, cyclical dynamics
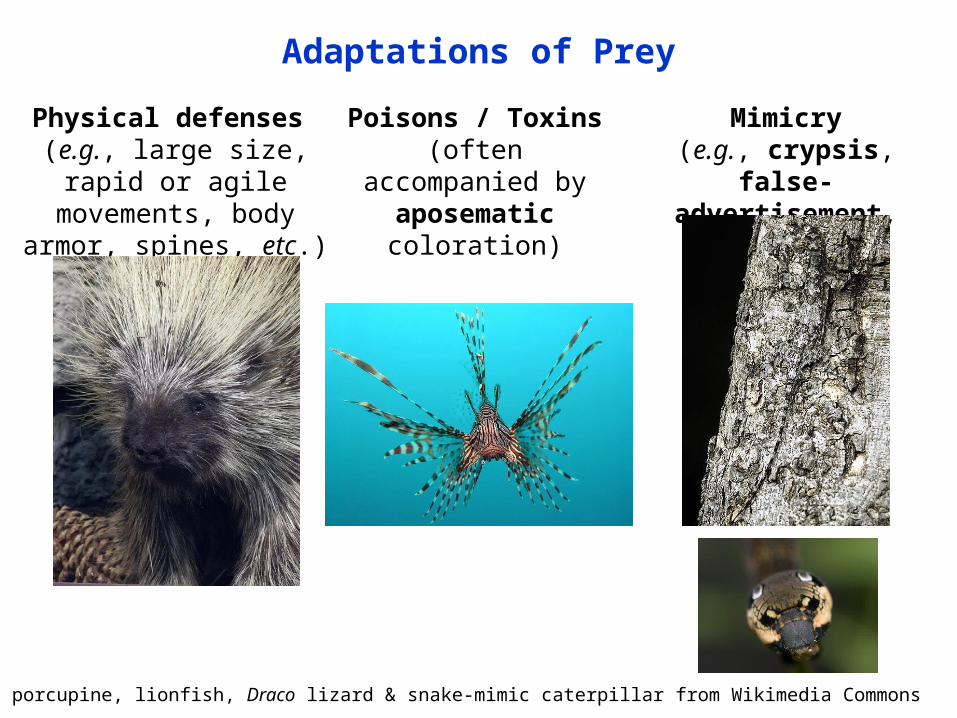
Adaptations of Prey
Physical defenses (e.g., large size, rapid or agile movements, body
armor, spines, etc.)
Poisons / Toxins(often accompanied
by aposematic coloration)
Mimicry(e.g., crypsis, false-advertisement, etc.)
Photos of porcupine, lionfish, Draco lizard & snake-mimic caterpillar from Wikimedia Commons
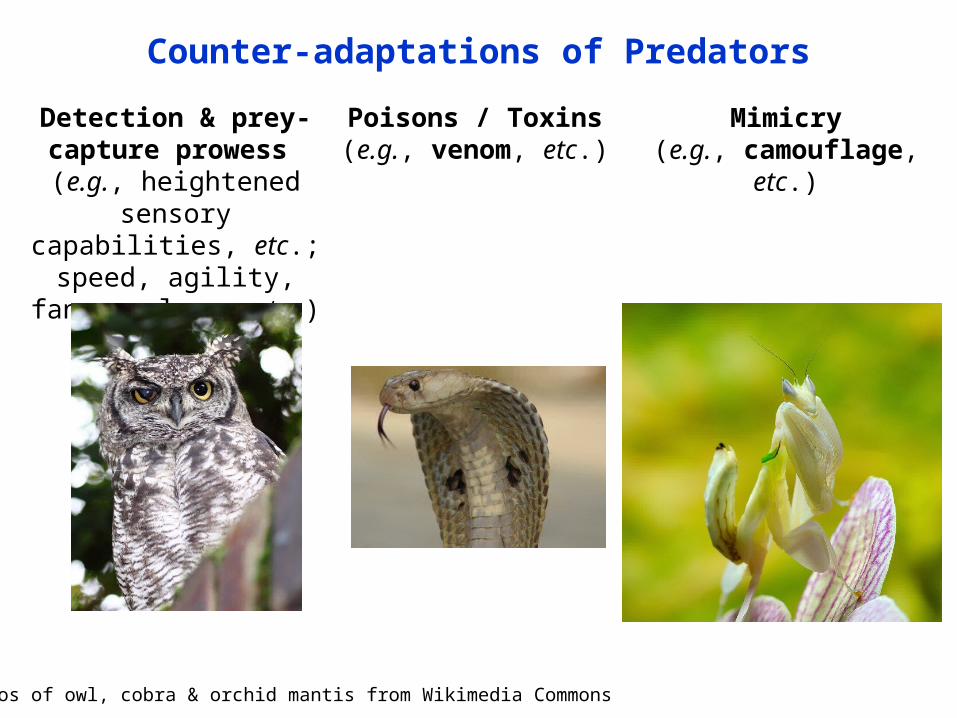
Detection & prey-capture prowess
(e.g., heightened sensory capabilities, etc.; speed, agility, fangs, claws, etc.)
Poisons / Toxins(e.g., venom, etc.)
Mimicry(e.g., camouflage, etc.)
Photos of owl, cobra & orchid mantis from Wikimedia Commons
Counter-adaptations of Predators
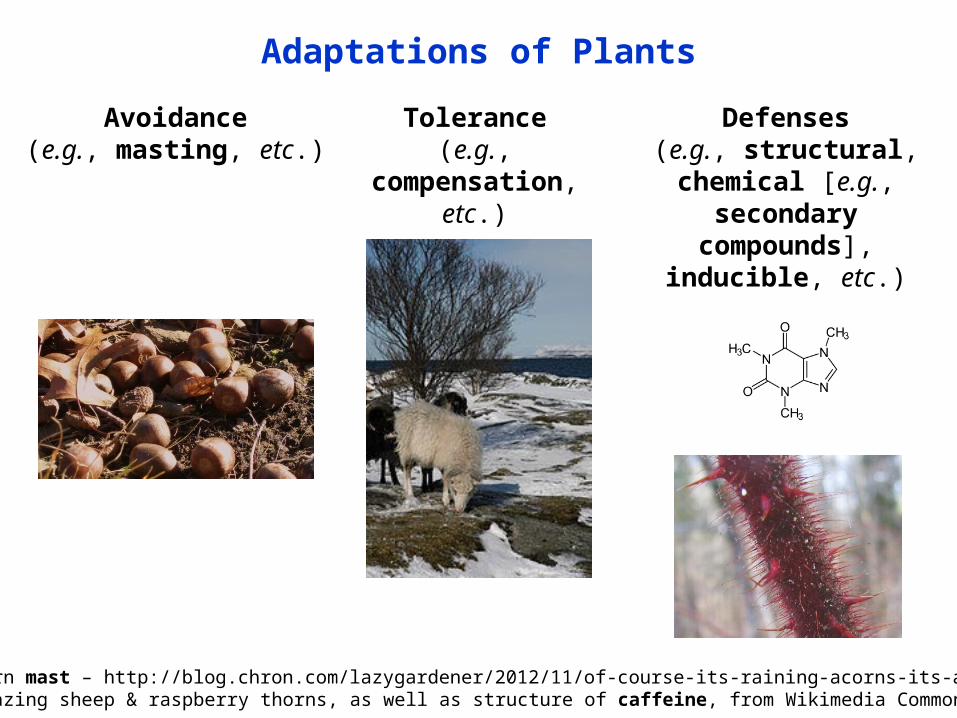
Avoidance(e.g., masting, etc.)
Tolerance(e.g., compensation,
etc.)
Defenses(e.g., structural, chemical [e.g.,
secondary compounds],
inducible, etc.)
Photo of acorn mast – http://blog.chron.com/lazygardener/2012/11/of-course-its-raining-acorns-its-a-masting-year;photos of grazing sheep & raspberry thorns, as well as structure of caffeine, from Wikimedia Commons
Adaptations of Plants
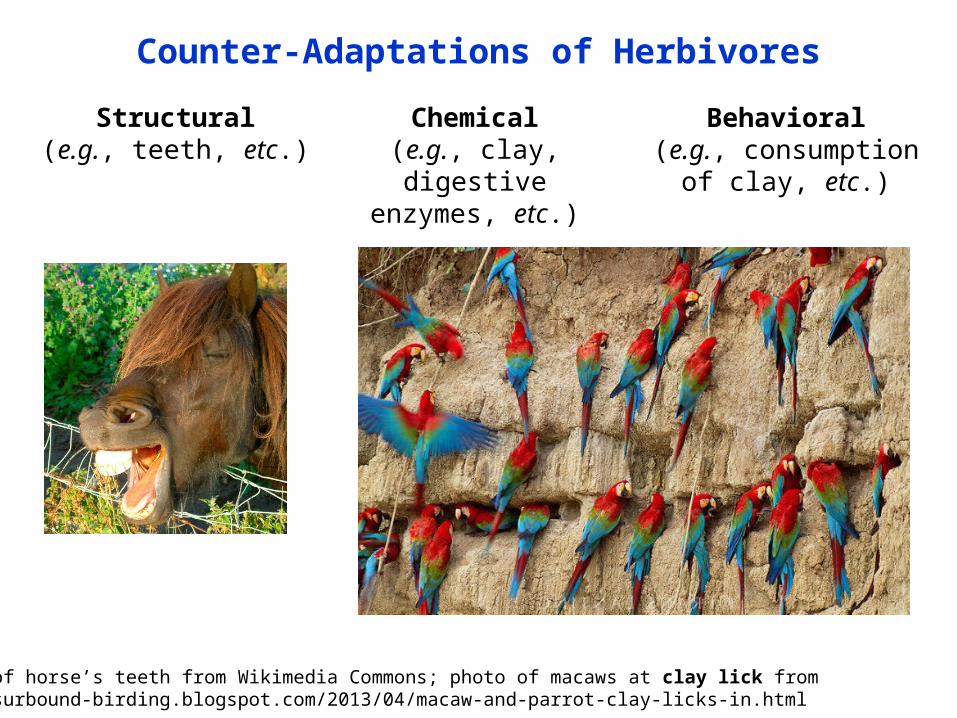
Structural(e.g., teeth, etc.)
Chemical(e.g., clay, digestive
enzymes, etc.)
Behavioral(e.g., consumption of
clay, etc.)
Photos of horse’s teeth from Wikimedia Commons; photo of macaws at clay lick from http://surbound-birding.blogspot.com/2013/04/macaw-and-parrot-clay-licks-in.html
Counter-Adaptations of Herbivores


![ACORNS Mobile Application User Manual [A][C]quisition [O]f ...cs.sou.edu/~harveyd/acorns/Acorns8_0/AndroidMobileApp.pdf · ACORNS Mobile Application Version 1.0 4 Section 2 The ACORNS](https://static.fdocuments.us/doc/165x107/5f33d83c39828c360c6a4621/acorns-mobile-application-user-manual-acquisition-of-cssoueduharveydacornsacorns80.jpg)