Preclinical Strategies to Support the Clinical...
35
Preclinical Strategies to Support the Clinical Development of the Anti-PD-1 Antibody Keytruda Brian Long Tumor Models: July 22, 2015 1
Transcript of Preclinical Strategies to Support the Clinical...

Preclinical Strategies to Support
the Clinical Development of the
Anti-PD-1 Antibody Keytruda
Brian Long
Tumor Models: July 22, 2015
1

Immune Checkpoint Regulation of T cell
Activation
2
Naive
T cell
Primary
Stimulation
Activated
T cell
CD28
CD80/86
TCR
MHC CTLA-4 PD-1
TNFRSF
- - +
APC or
Tumor cell
•CD28
•OX40
•CD137
•CD27
•GITR
•Activation •Inhibition
•Homeostasis
•CTLA-4
•PD-1
•LAG3
•TIGIT
•BTLA
• Immunomodulatory receptors regulate T cell activation
• ‘Immune checkpoints’ serve to limit collateral damage from immune responses
• Immune system plays a critical role controlling tumor growth and progression
• Numerous receptors are deregulated in various human cancers
• Cancer immunotherapy: 2013 Breakthrough of the Year (Science)
• Only 3 FDA-approved immunotherapies to date
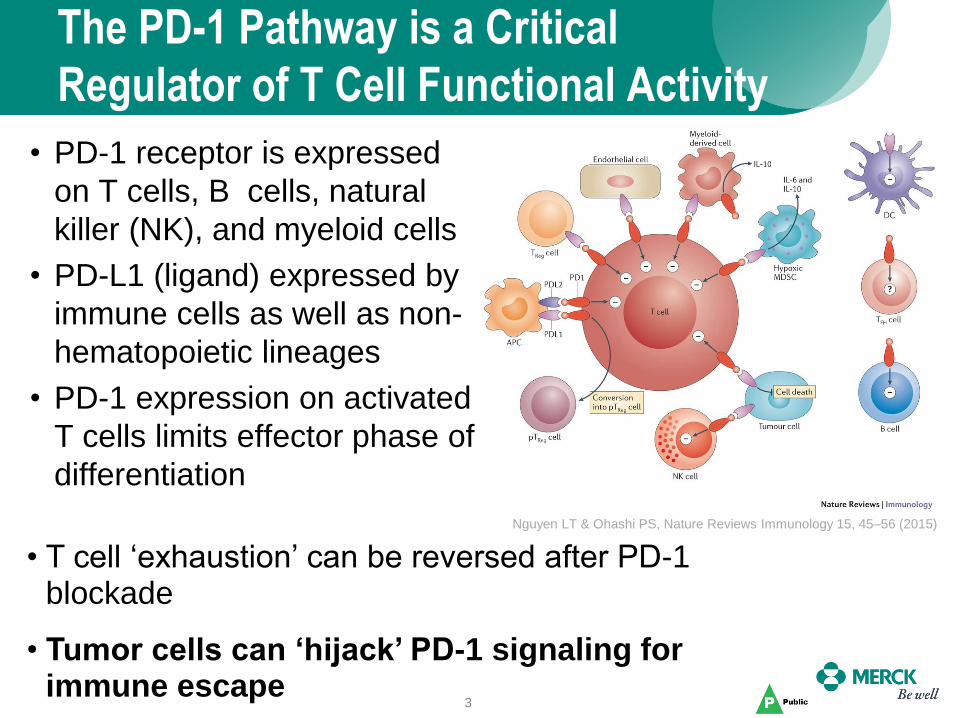
The PD-1 Pathway is a Critical
Regulator of T Cell Functional Activity
• PD-1 receptor is expressed
on T cells, B cells, natural
killer (NK), and myeloid cells
• PD-L1 (ligand) expressed by
immune cells as well as non-
hematopoietic lineages
• PD-1 expression on activated
T cells limits effector phase of
differentiation
3
Nguyen LT & Ohashi PS, Nature Reviews Immunology 15, 45–56 (2015)
• T cell ‘exhaustion’ can be reversed after PD-1 blockade
• Tumor cells can ‘hijack’ PD-1 signaling for immune escape
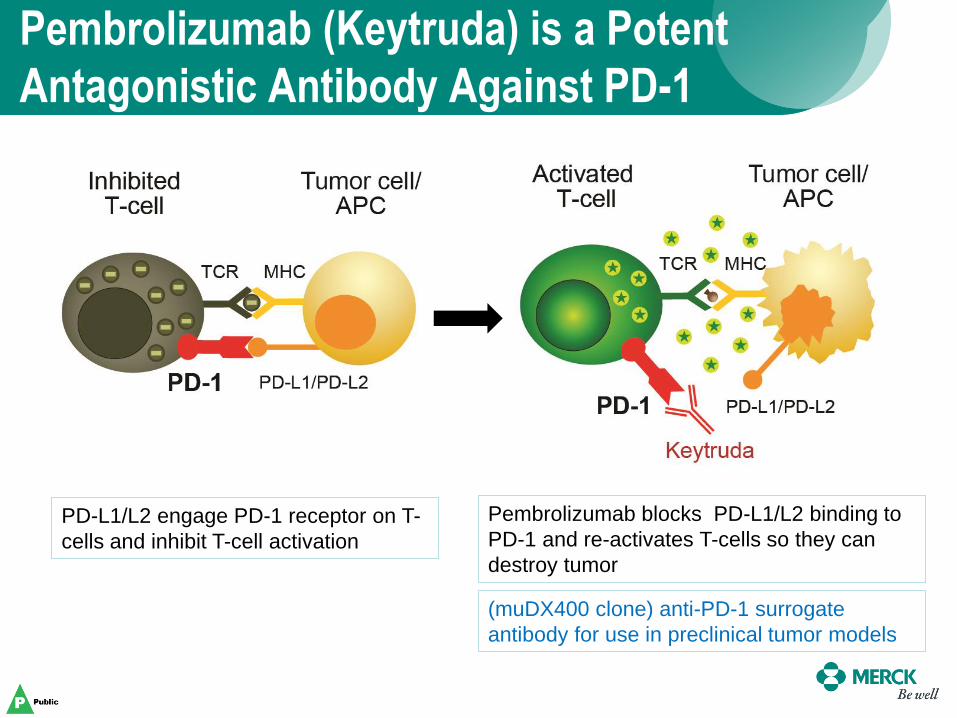
Pembrolizumab (Keytruda) is a Potent
Antagonistic Antibody Against PD-1
PD-L1/L2 engage PD-1 receptor on T-
cells and inhibit T-cell activation
Pembrolizumab blocks PD-L1/L2 binding to
PD-1 and re-activates T-cells so they can
destroy tumor
(muDX400 clone) anti-PD-1 surrogate
antibody for use in preclinical tumor models

Pembrolizumab (Keytruda) Displays Impressive Anti-Tumor
Activity in Multiple Different Cancer Indications
Keytruda is now in more than 110 clinical trials in over 30 different tumor types

Leveraging Preclinical Models to Aid in the
Understanding of Anti-PD-1 Immunotherapy
6
Tumor Models
Subcutaneous Orthotopic Metastatic
GEMMs Humanized
Mouse Models
Human Tumor
Histoculture
Syngeneic Models Model

Mouse Syngeneic Tumor Models
7
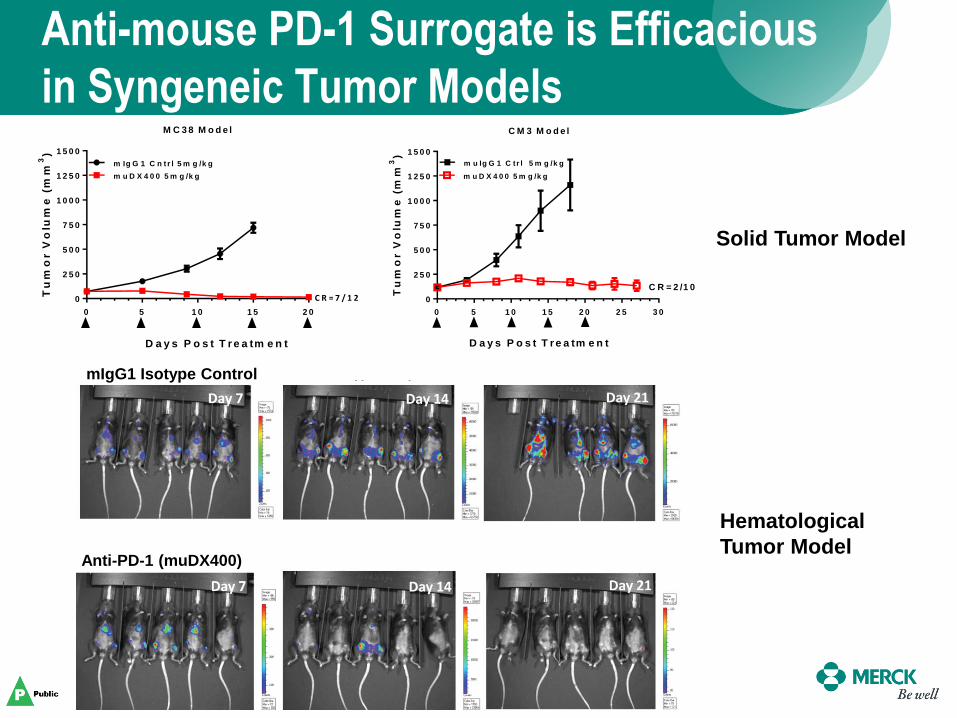
Anti-mouse PD-1 Surrogate is Efficacious
in Syngeneic Tumor Models
8
M C 3 8 M o d e l
0 5 1 0 1 5 2 0
0
2 5 0
5 0 0
7 5 0
1 0 0 0
1 2 5 0
1 5 0 0
m Ig G 1 C n t r l 5 m g /k g
m u D X 4 0 0 5 m g /k g
D a y s P o s t T r e a tm e n t
Tu
mo
r V
olu
me
(m
m3)
C R = 7 / 1 2
0 5 1 0 1 5 2 0 2 5 3 0
0
2 5 0
5 0 0
7 5 0
1 0 0 0
1 2 5 0
1 5 0 0
Tu
mo
r V
olu
me
(m
m3)
m u Ig G 1 C tr l 5 m g /k g
m u D X 4 0 0 5 m g /k g
C R = 2 /1 0
D a y s P o s t T r e a tm e n t
C M 3 M o d e l
mIgG1 Isotype Control
Anti-PD-1 (muDX400)
Solid Tumor Model
Hematological
Tumor Model

9
Differential Response to Anti-PD-1
Treatment in Syngeneic Tumor Models M C 3 8 M o d e l
0 5 1 0 1 5 2 0
0
5 0 0
1 0 0 0
1 5 0 0
2 0 0 0
m u Ig G 1 C n trl 5 m g /k g
m u D X 4 0 0 5 m g /k g
D a y s P o s t T r e a tm e n t
Tu
mo
r V
olu
me
(m
m3)
C R = 7 /1 2
B 1 6 -F 1 0 M o d e l
0 5 1 0 1 5 2 0
0
5 0 0
1 0 0 0
1 5 0 0
2 0 0 0
2 5 0 0
Tu
mo
r V
olu
me
(m
m3)
m u D X 4 0 0 5 m g /kg
m u Ig G 1 C trl 5 m g /kg
D a y s P o s t T r e a tm e n t
Tu
mo
r V
olu
me
(m
m3)
0 5 1 0 1 5 2 0
0
5 0 0
1 0 0 0
1 5 0 0
2 0 0 0m u Ig G 1 C trl 5 m g /k g
m u D X 4 0 0 5 m g /k g
D a y s o f T re a tm e n t
R E N C A M o d e l
High Response
Partial Response
Low Response
Red = Maximum Response
Black = Minimum Response
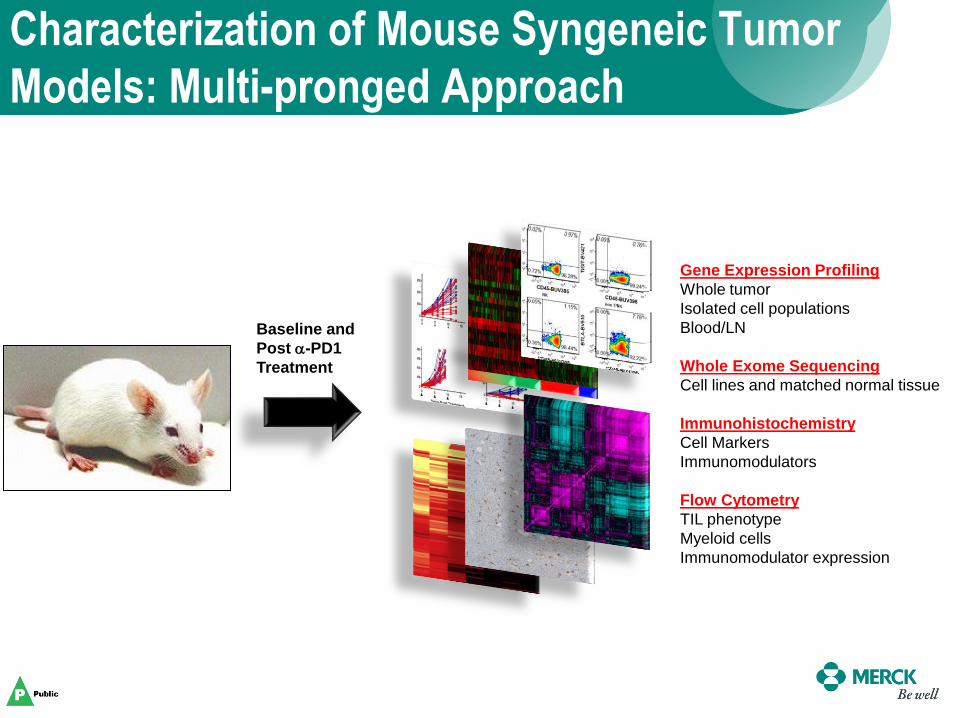
Characterization of Mouse Syngeneic Tumor
Models: Multi-pronged Approach
Baseline and
Post a-PD1
Treatment
Gene Expression Profiling
Whole tumor
Isolated cell populations
Blood/LN
Whole Exome Sequencing
Cell lines and matched normal tissue
Immunohistochemistry
Cell Markers
Immunomodulators
Flow Cytometry
TIL phenotype
Myeloid cells
Immunomodulator expression
0 4 8 1 2 1 6 2 0 2 4
0
5 0
1 0 0
A ll s e q u e n c e d tu m o r s
M o n th s
Pe
rc
en
t p
ro
gre
ss
ion
-fre
e
T ra n s v e rs io n h ig h (n = 1 6 )
T ra n s v e rs io n lo w (n = 1 8 )
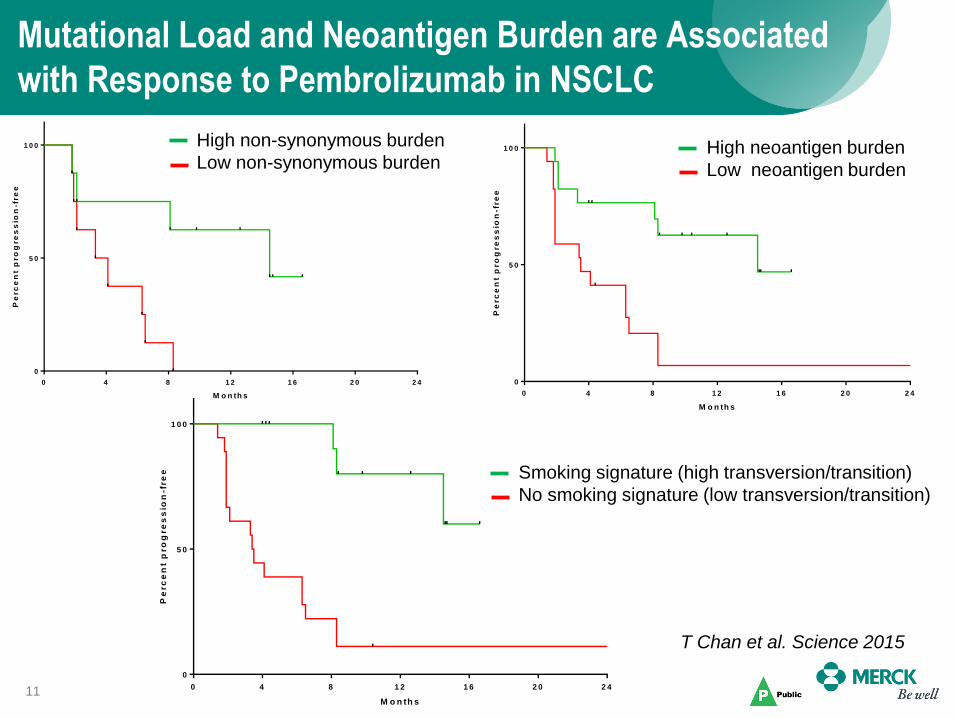
Mutational Load and Neoantigen Burden are Associated
with Response to Pembrolizumab in NSCLC
11
0 4 8 1 2 1 6 2 0 2 4
0
5 0
1 0 0
C o h o r t 1 - D is c o v e r y
M o n th s
Pe
rc
en
t p
ro
gre
ss
ion
-fre
e
H ig h n o n s y n o n y m o u s b u rd e n (n = 8 )
L o w n o n s y n o n y m o u s b u rd e n (n = 8 )
0 4 8 1 2 1 6 2 0 2 4
0
5 0
1 0 0
N e o a n t ig e n b u rd e n
M o n th s
Pe
rc
en
t p
ro
gre
ss
ion
-fre
e
H ig h n e o a n tig e n b u rd e n (n = 1 7 )
L o w n e o a n tig e n b u rd e n (n = 1 7 )High non-synonymous burden
Low non-synonymous burden High neoantigen burden
Low neoantigen burden
Smoking signature (high transversion/transition)
No smoking signature (low transversion/transition)
T Chan et al. Science 2015
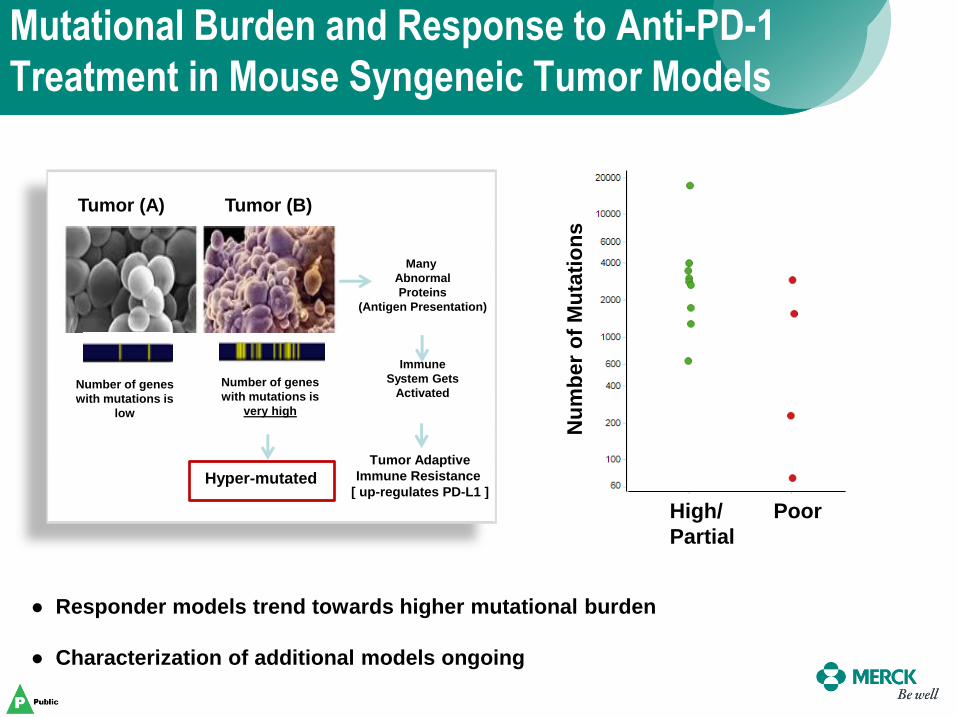
Tumor (B) Tumor (A)
Hyper-mutated
Number of genes
with mutations is
very high
Number of genes
with mutations is
low
Many
Abnormal
Proteins
(Antigen Presentation)
Immune
System Gets
Activated
Tumor Adaptive
Immune Resistance
[ up-regulates PD-L1 ]
Mutational Burden and Response to Anti-PD-1
Treatment in Mouse Syngeneic Tumor Models
Nu
mb
er
of
Mu
tati
on
s
High/
Partial
Poor
● Responder models trend towards higher mutational burden
● Characterization of additional models ongoing
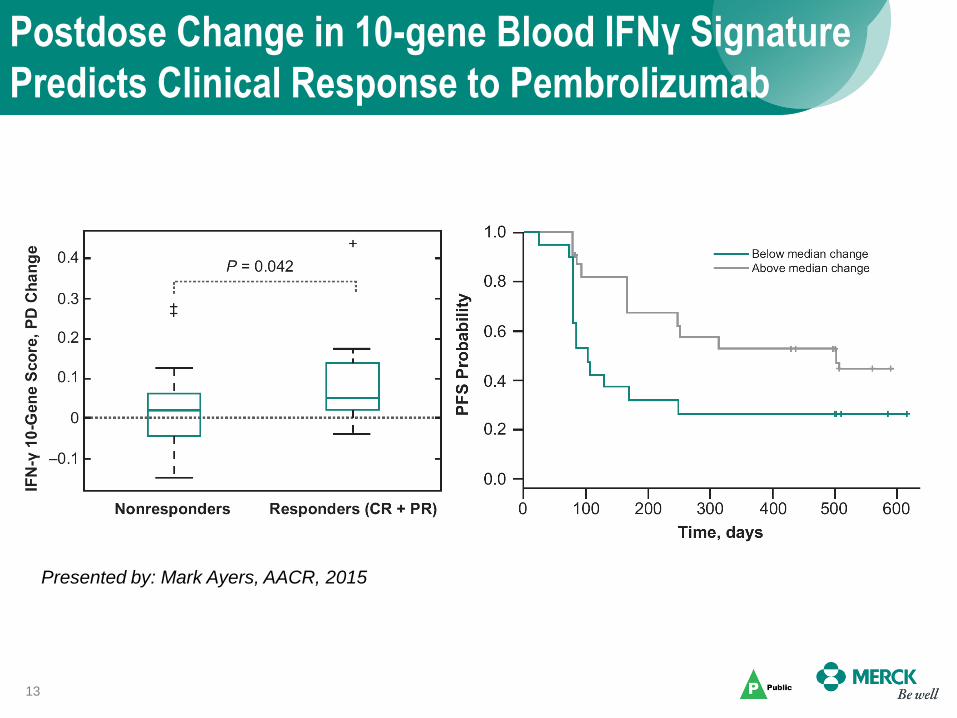
Postdose Change in 10-gene Blood IFNγ Signature
Predicts Clinical Response to Pembrolizumab
13
Presented by: Mark Ayers, AACR, 2015
14
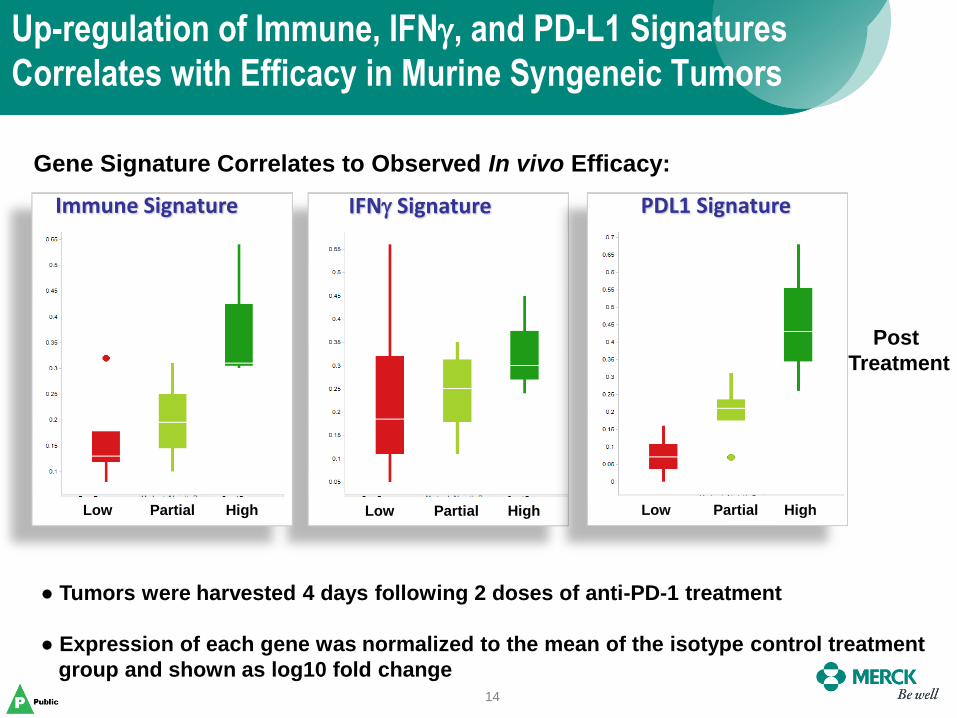
Up-regulation of Immune, IFNg, and PD-L1 Signatures
Correlates with Efficacy in Murine Syngeneic Tumors
IFNg Signature
Low Partial High Low Partial High
Immune Signature
Low Partial High
PDL1 Signature
Gene Signature Correlates to Observed In vivo Efficacy:
Post
Treatment
● Tumors were harvested 4 days following 2 doses of anti-PD-1 treatment
● Expression of each gene was normalized to the mean of the isotype control treatment
group and shown as log10 fold change

15
Graphic View of Immune Checkpoint Blocker Combinations
MK-4166

Combining Anti-PD-1 with Chemotherapies, Small Molecule
Therapies and Immunotherapies Results in Enhanced Anti-tumor
Activities
16 • Combinations were well tolerated at each of the dosing regimens shown
(Preclinical Model Data)
Model muDX400
Treatment
Response to
muDX400 Combination Partner
Response
to Partner
Therapy
Response to
Combination
CT26 10 mg/kg
(ip, q5d x 5) 46% TGI
Trametinib
( 1mg/kg, po, qd) 80% TGI
96% TGI
25% CR
MB49 10mg/kg
(ip, q5d x 5) 54% TGI
Trametinib
( 1 mg/kg, po, qd) 60% TGI 89% TGI
RENCA 5mg/kg
(ip, q5d x 5) 44% TGI
Pazopanib
( 100 mg/kg, po, bid) 60% TGI 81% TGI
RENCA 5mg/kg
(ip, q7d x 4) 59% TGI
Carboplatin
(40 mg/kg, ip, q7d x 4)
63% TGI
20% CR
98% TGI
33% CR
RENCA 5mg/kg
(ip, q7d x 4)
43% TGI
8% CR
Gemcitabine
(120 mg/kg, ip, q7d x 4)
90% TGI
17% CR
94% REG
50% CR
MC38 5mg/kg
(ip, q5d x 5)
88% TGI
33% CR
Anti-CD137
(5 mg/kg, ip, q5d x 5)
94% TGI
33% CR 100% CR
CT26 10 mg/kg
(ip, q5d x 6)
54% TGI
16% PR
Entinostat
(15 mg/kg, po, qd) 60% TGI
93% TGI
67% CR, 16% PR
CT26 10 mg/kg
(ip, q5d x 6)
54% TGI
16% PR
Vorinostat
(150 mg/kg, ip, qd) 40% TGI
87% TGI
25% CR, 16% PR
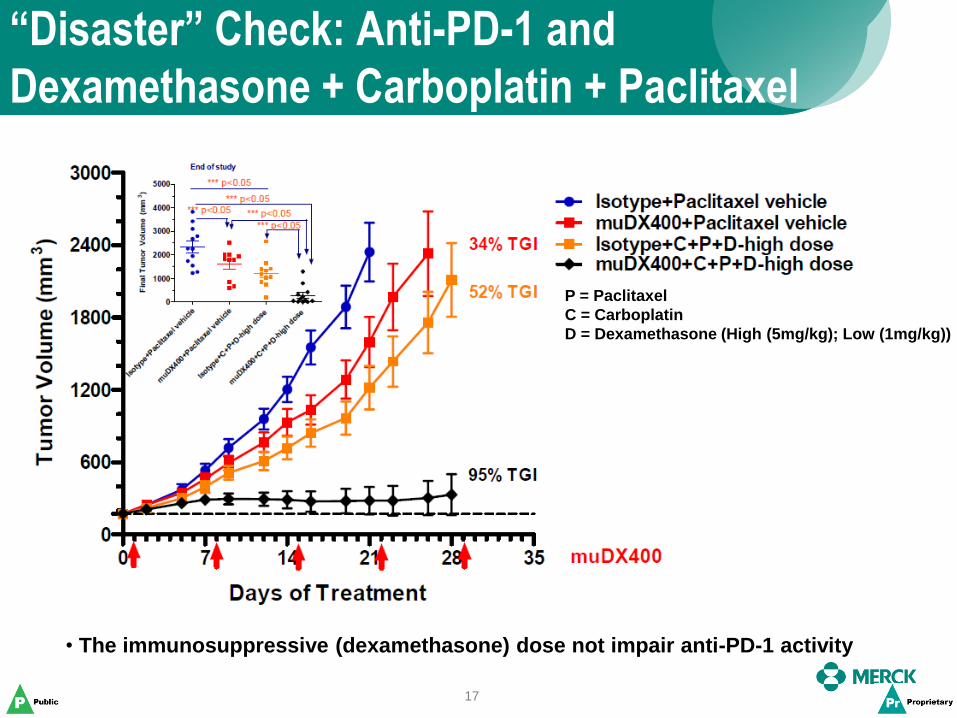
“Disaster” Check: Anti-PD-1 and
Dexamethasone + Carboplatin + Paclitaxel
17
P = Paclitaxel
C = Carboplatin
D = Dexamethasone (High (5mg/kg); Low (1mg/kg))
• The immunosuppressive (dexamethasone) dose not impair anti-PD-1 activity
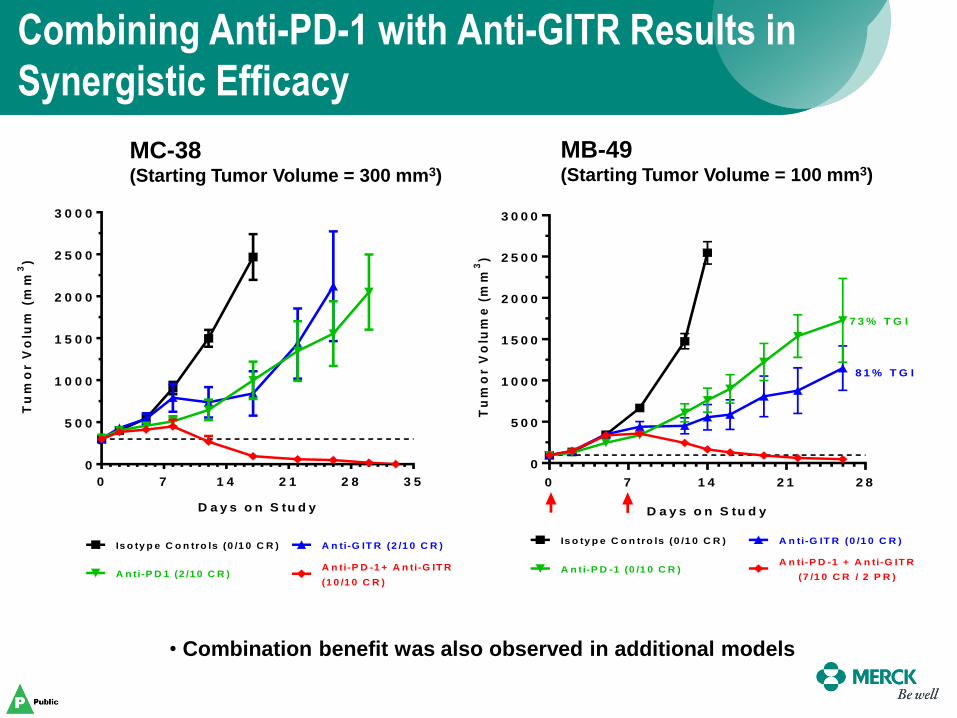
Combining Anti-PD-1 with Anti-GITR Results in
Synergistic Efficacy
18
D a y s o n S tu d y
Tu
mo
r V
olu
m (
mm
3)
0 7 1 4 2 1 2 8 3 5
0
5 0 0
1 0 0 0
1 5 0 0
2 0 0 0
2 5 0 0
3 0 0 0
Is o ty p e C o n tro ls (0 /1 0 C R )
A n ti-P D -1 + A n ti-G IT R
(1 0 /1 0 C R )
A n ti-G IT R (2 /1 0 C R )
A n ti-P D 1 (2 /1 0 C R )
0 7 1 4 2 1 2 8
0
5 0 0
1 0 0 0
1 5 0 0
2 0 0 0
2 5 0 0
3 0 0 0
A n ti-G IT R (0 /1 0 C R )Is o ty p e C o n tro ls (0 /1 0 C R )
A n ti-P D -1 (0 /1 0 C R )A n ti-P D -1 + A n ti-G IT R
(7 /1 0 C R / 2 P R )
D a y s o n S tu d y
Tu
mo
r V
olu
me
(m
m3)
7 3 % T G I
8 1 % T G I
• Combination benefit was also observed in additional models
MC-38 (Starting Tumor Volume = 300 mm3)
MB-49 (Starting Tumor Volume = 100 mm3)

Genetically Engineered Mouse
Models (GEMMs)
19

Published Data with GEMMs Have Not Reported
Complete Tumor Responses (To Date)
EGFR Del 19 NSCLC EGFR Del 19/T790M NSCLC EGFR L858R/T790M NSCLC
8 weeks 7 weeks 9 weeks
Akbay ES et al. Cancer Discovery 2013;3:1355-63
BRAFV600E
Melanoma
0 Days
Hu-Lieskovan S et al., Sci Transl Med 2015;7:279ra41 Winograd R et al. Cancer Immunol Res 2015;3:399-411
KPC (KrasG12D, Trp53R172H) Pancreatic
~5 Days
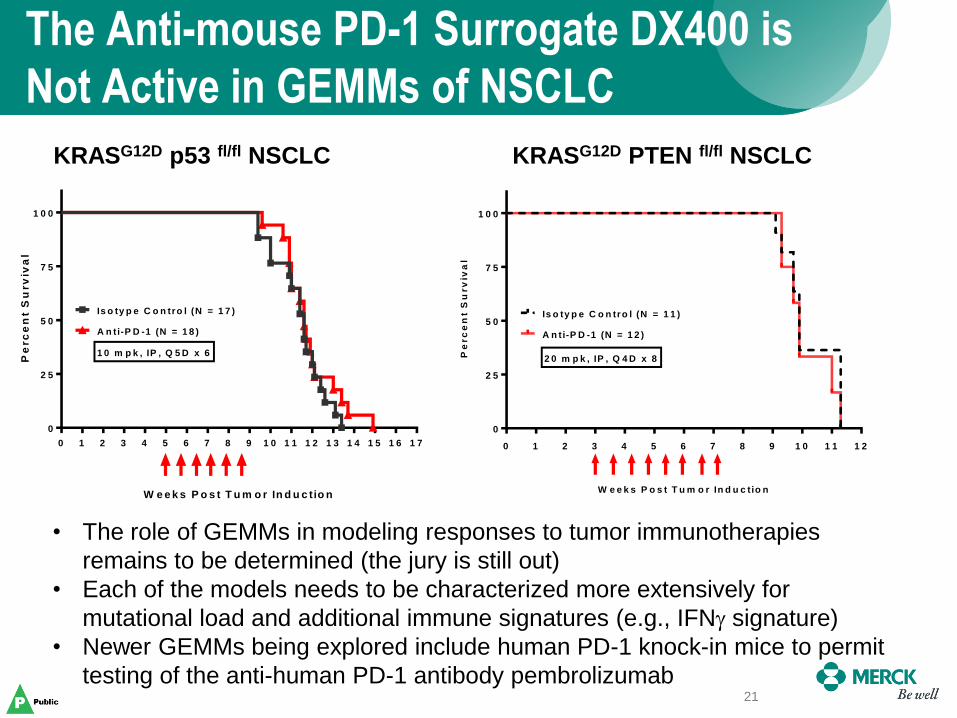
The Anti-mouse PD-1 Surrogate DX400 is
Not Active in GEMMs of NSCLC
21
0 1 2 3 4 5 6 7 8 9 1 0 1 1 1 2 1 3 1 4 1 5 1 6 1 7
0
2 5
5 0
7 5
1 0 0
Is o ty p e C o n tro l (N = 1 7 )
A n ti-P D -1 (N = 1 8 )
W e e k s P o s t T u m o r In d u c tio n
Pe
rc
en
t S
urv
iva
l
1 0 m p k , IP , Q 5 D x 6
0 1 2 3 4 5 6 7 8 9 1 0 1 1 1 2
0
2 5
5 0
7 5
1 0 0
Is o ty p e C o n tro l (N = 1 1 )
W e e k s P o s t T u m o r In d u c tio n
Pe
rc
en
t S
urv
iva
l
A n t i-P D -1 (N = 1 2 )
2 0 m p k , IP , Q 4 D x 8
KRASG12D p53 fl/fl NSCLC KRASG12D PTEN fl/fl NSCLC
• The role of GEMMs in modeling responses to tumor immunotherapies
remains to be determined (the jury is still out)
• Each of the models needs to be characterized more extensively for
mutational load and additional immune signatures (e.g., IFNg signature)
• Newer GEMMs being explored include human PD-1 knock-in mice to permit
testing of the anti-human PD-1 antibody pembrolizumab
Humanized Mice
22
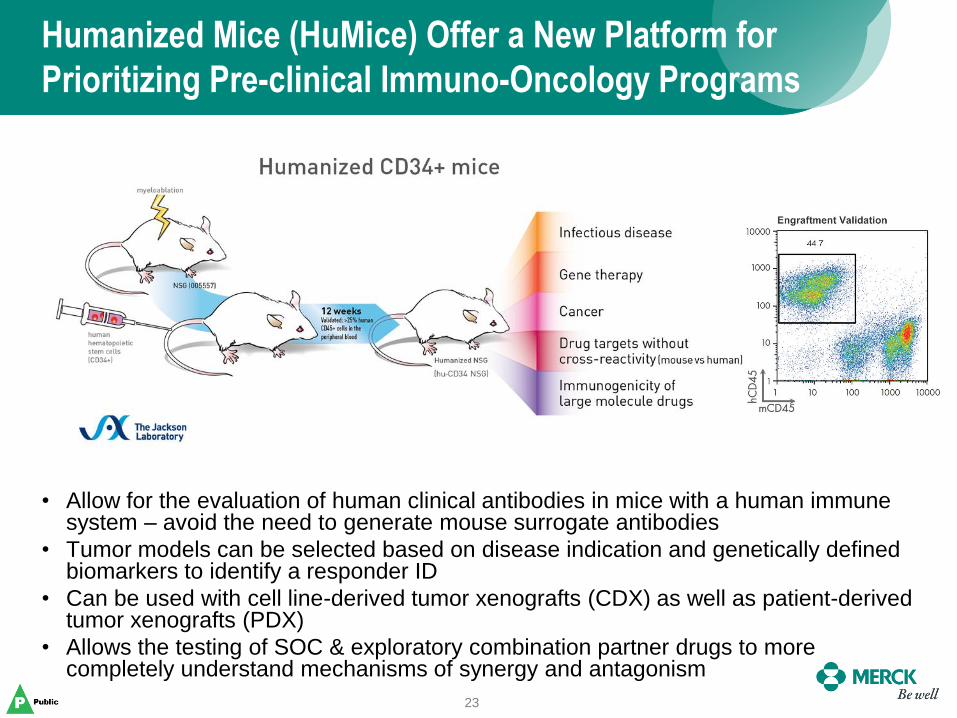
Humanized Mice (HuMice) Offer a New Platform for
Prioritizing Pre-clinical Immuno-Oncology Programs
23
• Allow for the evaluation of human clinical antibodies in mice with a human immune system – avoid the need to generate mouse surrogate antibodies
• Tumor models can be selected based on disease indication and genetically defined biomarkers to identify a responder ID
• Can be used with cell line-derived tumor xenografts (CDX) as well as patient-derived tumor xenografts (PDX)
• Allows the testing of SOC & exploratory combination partner drugs to more completely understand mechanisms of synergy and antagonism

Strategy for Selecting The Human CDX Models to
Determine the Anti-Tumor Activity of Pembrolizumab
24
• ~40 models were originally selected based on their ability to grow in immune-
deficient mice (nude mice and/or SCID mice)
• For each of the models PD-L1 expression was evaluated by gene expression
profiling, fluorescent activated cell sorting (FACS) analysis, and
immunohistochemistry
• Models expressing PD-L1 were then further prioritized based on expression
levels of MHC-I, MHC-II, and mutational load
• Prioritized models were HLA-phenotyped to help identify best cohort of mice to
inoculate
LOX Melanoma (High) A375 Melanoma (Medium) UACC-62 Melanoma (Low)

PD-L1
Co
un
t
101
102
103
104
105
106
107
0
54
108
162
216
PD-L1
Co
un
t
102
103
104
105
106
107
0
122
245
367
489
Validation of PD-L1 Expression in the Panc 08.13
Human Pancreatic Cancer Cell Line
25
FACS (cells) FACS (xenografts) IHC
HLA-ABC = A*02:01 / A*02:01
Model Tissue Latency Time
(Days)
Log10
PD-L1
Log10
MHC-I # Mutations HLA-ABC Class I
PANC-08.13 Pancreas
10 2.80 2.54 52 A*02:01 / A*02:01
ISO PD-L1
ISO -IFNg +IFNg
26
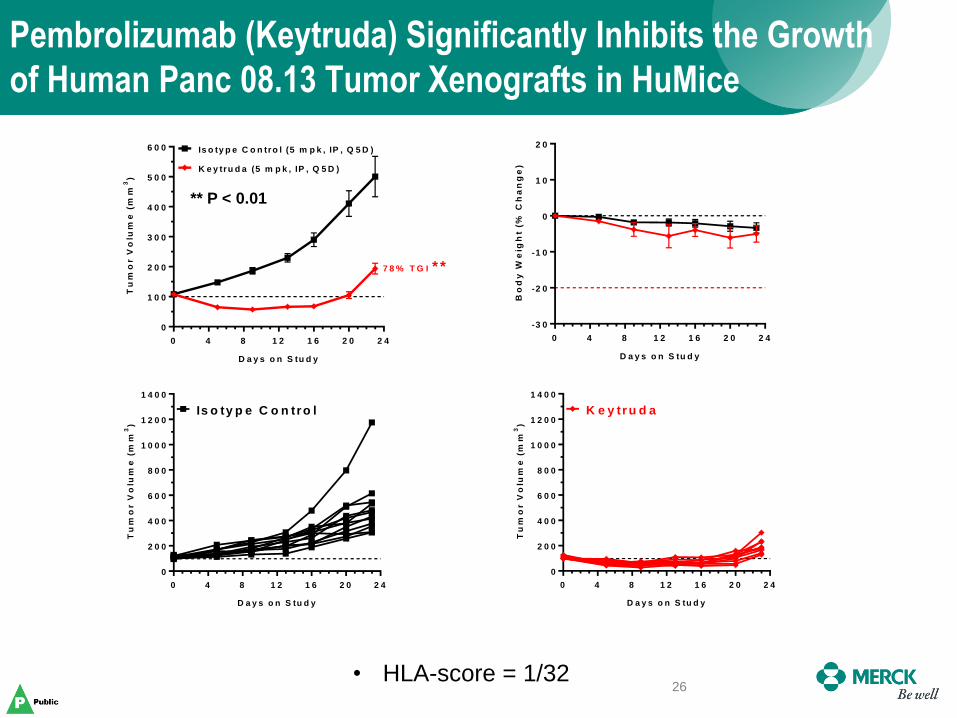
Pembrolizumab (Keytruda) Significantly Inhibits the Growth
of Human Panc 08.13 Tumor Xenografts in HuMice
• HLA-score = 1/32
0 4 8 1 2 1 6 2 0 2 4
0
1 0 0
2 0 0
3 0 0
4 0 0
5 0 0
6 0 0
K e y tru d a (5 m p k , IP , Q 5 D )
Is o ty p e C o n tro l (5 m p k , IP , Q 5 D )
7 8 % T G I * *
D a y s o n S tu d y
Tu
mo
r V
olu
me
(m
m3)
0 4 8 1 2 1 6 2 0 2 4
-3 0
-2 0
-1 0
0
1 0
2 0
D a y s o n S tu d y
Bo
dy
We
igh
t (%
Ch
an
ge
)
0 4 8 1 2 1 6 2 0 2 4
0
2 0 0
4 0 0
6 0 0
8 0 0
1 0 0 0
1 2 0 0
1 4 0 0
D a y s o n S tu d y
Tu
mo
r V
olu
me
(m
m3)
Is o ty p e C o n tro l
** P < 0.01
0 4 8 1 2 1 6 2 0 2 4
0
2 0 0
4 0 0
6 0 0
8 0 0
1 0 0 0
1 2 0 0
1 4 0 0
D a y s o n S tu d y
Tu
mo
r V
olu
me
(m
m3)
K e y tr u d a

Pembrolizumab Treatment Effectively Targets
PD-1 on Human Lymphocytes (FACS)
27 To
tal C
D45+
To
tal C
D3+
To
tal C
D4+
Th
elp
er
Tre
g
CD
8+
0
2 0
4 0
6 0
8 0
1 0 0
B lo o d
Pe
rc
en
tag
e o
f c
ell
s (
%) Is o ty p e Ig G 4
K e y tru d a
To
tal C
D45+
To
tal C
D3+
To
tal C
D4+
Th
elp
er
Tre
g
CD
8+
0
1 0
2 0
3 0
4 0
B lo o d
Pe
rc
en
tag
e o
f P
D1
+ c
ell
s (
%)
Is o ty p e Ig G 4
K e y tru d a
Little to no PD1 detectable
on lymphocyte populations
Increased lymphocyte
presence after treatment
with pembrolizumab
Panc08.13 tumor bearing HuMice

Determining the Anti-tumor Activity of Pembrolizumab in
Human PDX Tumor Models (Champions Oncology)
28
• All of Champions melanoma and NSCLC models were evaluated for their ability
to grow in immune-deficient mice
– Tumors that grew too slowly or too quickly were excluded
• Champions provided molecular profiling data to Merck Bioinformatics (RNA-seq
& WES) to analyze for expression levels of PD-L1, MHC-I, MHC-II, and
mutational load
• Champions prioritized models that were HLA-phenotyped as HLA-A*02
• Humanized NOG mice (HLA-A*02 phenotype) were supplied by Taconic
Model Tissue Doubling
Time (Days)
Log10
PD-L1
Log10
MHC-I # Mutations HLA-A Class I
CTG-0202 Melanoma 7 2.97 5.62 Not Available A*02
CTG-0743 NSCLC 8 4.53 6.1 231 A*02
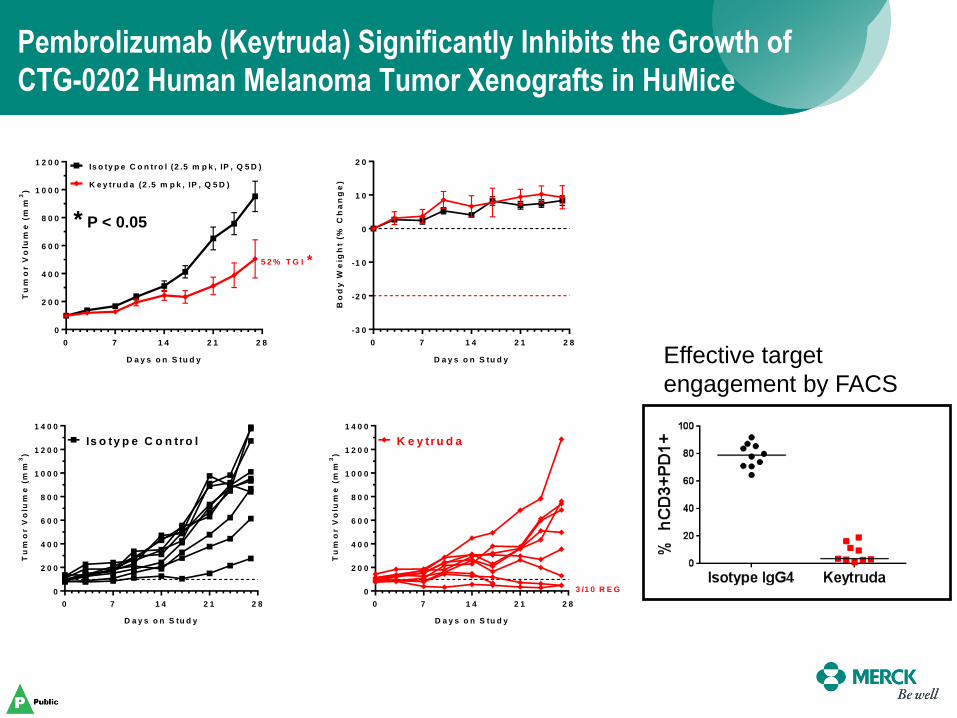
Pembrolizumab (Keytruda) Significantly Inhibits the Growth of
CTG-0202 Human Melanoma Tumor Xenografts in HuMice
0 7 1 4 2 1 2 8
0
2 0 0
4 0 0
6 0 0
8 0 0
1 0 0 0
1 2 0 0
K e y tru d a (2 .5 m p k , IP , Q 5 D )
Is o ty p e C o n tro l (2 .5 m p k , IP , Q 5 D )
5 2 % T G I *
D a y s o n S tu d y
Tu
mo
r V
olu
me
(m
m3)
0 7 1 4 2 1 2 8
-3 0
-2 0
-1 0
0
1 0
2 0
D a y s o n S tu d y
Bo
dy
We
igh
t (%
Ch
an
ge
)
* P < 0.05
0 7 1 4 2 1 2 8
0
2 0 0
4 0 0
6 0 0
8 0 0
1 0 0 0
1 2 0 0
1 4 0 0
D a y s o n S tu d y
Tu
mo
r V
olu
me
(m
m3)
Is o ty p e C o n tro l
0 7 1 4 2 1 2 8
0
2 0 0
4 0 0
6 0 0
8 0 0
1 0 0 0
1 2 0 0
1 4 0 0
D a y s o n S tu d y
Tu
mo
r V
olu
me
(m
m3)
K e y tru d a
3 /1 0 R E G
Effective target
engagement by FACS

Increased T-cell Infiltration Into CTG-0202 Tumors
Following Treatment with Pembrolizumab
30
CD3
CD8
Isotype IgG4 Keytruda

Pembrolizumab (Keytruda) Significantly Inhibits the Growth of
CTG-0743 Human NSCLC Tumor Xenografts in HuMice
** P < 0.01
0 7 1 4 2 1
0
1 0 0
2 0 0
3 0 0
4 0 0
5 0 0
K e y tru d a (5 m p k , IP , Q 5 D )
Is o ty p e C o n tro l (5 m p k , IP , Q 5 D )
6 7 % T G I * *
D a y s o n S tu d y
Tu
mo
r V
olu
me
(m
m3)
0 7 1 4 2 1
-3 0
-2 0
-1 0
0
1 0
2 0
D a y s o n S tu d y
Bo
dy
We
igh
t (%
Ch
an
ge
)
0 7 1 4 2 1
0
2 0 0
4 0 0
6 0 0
8 0 0
1 0 0 0
D a y s o n S tu d y
Tu
mo
r V
olu
me
(m
m3)
Is o ty p e C o n tro l
0 7 1 4 2 1
0
2 0 0
4 0 0
6 0 0
8 0 0
1 0 0 0
D a y s o n S tu d y
Tu
mo
r V
olu
me
(m
m3)
K e y tr u d a
Summary
• Supporting the clinical development of pembrolizumab (Keytruda) was
complex and involved development and characterization of a diverse
panel of preclinical models in immune-competent mice
• Mouse syngeneic tumors remain the primary models of choice to
interrogate the anti-tumor activities of novel cancer immunotherapies
and combinations
• The role of GEMMs to support the development of cancer
immunotherapies remains to be determined but is likely to involve the
development and characterization of a new generation of models
• The emergence of humanized mice offers a promising platform that
could allow the testing of cancer immunotherapies in an indication-
specific manner and best identify the optimal combination therapies
• A novel set of next generation biomarkers are simultaneously being
investigated in both preclinical models and ongoing clinical trials to
better understand which patients and indications are most likely to
respond to cancer immunotherapies
32

Targeting Immunomodulators: The Challenges
33 33
• What are the determinants of
responsiveness?
• What can be done to increase the
representation of tumor-reactive
T cells, and to trigger their activation?
• How do we select patients most likely
to respond to these agents?
• How do we prioritize new targets and
new combinations?
– Which mechanism is best for which
tumor?
Melero I, et al. Clin Cancer Res. 2013;19:997-1008. ©2013 by American Association for Cancer Research.
6 8 1 0 1 2 1 4 1 6 1 8 2 0 2 2 2 4 2 6 2 8 3 0 3 2
0
2 0 0
4 0 0
6 0 0
8 0 0
1 0 0 0
1 2 0 0
1 4 0 0
1 6 0 0
1 8 0 0
D a y s p o s t tu m o r im p la n ta tio n
M e an S E M
(n = 1 0 )
Tu
mo
r v
olu
me
(m
m3)
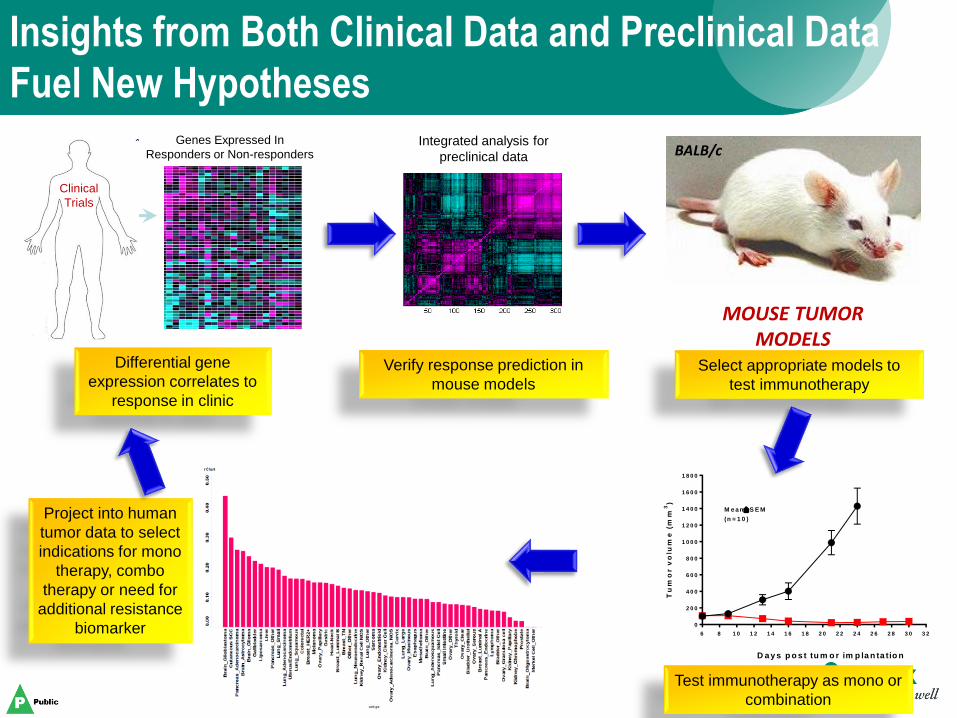
Differential gene
expression correlates to
response in clinic
Verify response prediction in
mouse models
Select appropriate models to
test immunotherapy
Test immunotherapy as mono or
combination
Project into human
tumor data to select
indications for mono
therapy, combo
therapy or need for
additional resistance
biomarker
BALB/c
MOUSE TUMOR MODELS
Genes Expressed In
Responders or Non-responders
Clinical
Trials
Integrated analysis for
preclinical data
Insights from Both Clinical Data and Preclinical Data
Fuel New Hypotheses
Clinical
Trials

Acknowledgments
35
MRL - Boston
Elaine Pinheiro
Heather Hirsch
Michael Rosenzweig
Brian Long
Yanhong Ma
Mingmei Cai
Doug Linn
Brian Haines
Jason Laskey
Marlene Hinton
Samanthi Perera
Long Cui
Nicolas Solban
Melissa Chenard
Sloan Stribling (KW)
Yaolin Wang (KW)
David Hill (WP)
Razvan Cristescu
Mark Ayers (WP)
Lily Moy
Mike Caniga
Kalyan Chakravarthy
Robert Faltus
Ray Moniz
Samik Basu
Tony Mannarino
Kallol Roy
Clinical Oncology
David Kaufman
Eric Rubin
Andrew Denker
Development Teams
MK-3475 Team
MK-4166 Team
Manufacturing - Europe
Marc Bastiaansen
Nachu Chakravarthy
Gargi Maheshwari
Manoj Sharma
Partner Companies
Champions Oncology
Charles River
CrownBio
InvivoTek
JAX
Pharmaron
Pure Transplant
Taconic
VivoPharm
Wuxi
MRL - Palo Alto
Rob Kastelein
Gary Starling
Terri McClanahan
Svetlana Sadekova
Jennifer Yearley
Laurence Fayadat-Dilman
Romina Riener
Selva Sukumar
Doug Wilson
Chris Gibson
Jerelyn Wong
Manjiri Sathe
Jeanine Mattson
Erin Murphy
Ruban Mangadu
Uyen Phan
Wendy Blumenschein
Sripriya Dhandapani
Shuli Zhang
Luis Zuniga
Barbara Joyce-Shaikh
Dan Cua
Rene De Waal Malefyt
Amy Beebe
Danling Gu
Smita Mauze
Venkataraman Sriram
Joe Phillips
Debbie Law