PRECISION DRILLING CORPORATION -...
29
1 | Investor Presentation PRECISION DRILLING CORPORATION January 2018 *Rig 576, Loving County TX, Permian Basin TSX: PD NYSE: PDS TSX: PD NYSE: PDS
Transcript of PRECISION DRILLING CORPORATION -...

1|
Investor Presentation
PRECISION DRILLING CORPORATION
January 2018
*Rig 576, Loving County TX, Permian Basin TSX: PD NYSE: PDSTSX: PD NYSE: PDS

2| 2|
Forward-looking Statements
Certain statements contained in this report, including statements that contain words such as "could", "should", "can", "anticipate", "estimate","intend", "plan", "expect", "believe", "will", "may", "continue", "project", "potential" and similar expressions and statements relating to mattersthat are not historical facts constitute "forward-looking information" within the meaning of applicable Canadian securities legislation and"forward-looking statements" within the meaning of the "safe harbor" provisions of the United States Private Securities Litigation Reform Act of1995 (collectively, "forward-looking information and statements").
In particular, forward looking information and statements include, but are not limited to, the following: our strategic priorities for 2017; ourcapital expenditure plans for 2017; anticipated activity levels in 2017 and our scheduled infrastructure projects; anticipated demand for Tier 1rigs; the average number of term contracts in place for 2017.
These forward-looking information and statements are based on certain assumptions and analysis made by Precision in light of our experienceand our perception of historical trends, current conditions, expected future developments and other factors we believe are appropriate under thecircumstances. These include, among other things: the fluctuation in oil prices may pressure customers into reducing or limiting their drillingbudgets; the status of current negotiations with our customers and vendors; customer focus on safety performance; existing term contracts areneither renewed nor terminated prematurely; our ability to deliver rigs to customers on a timely basis; and the general stability of the economicand political environments in the jurisdictions where we operate.
Undue reliance should not be placed on forward-looking information and statements. Whether actual results, performance or achievements willconform to our expectations and predictions is subject to a number of known and unknown risks and uncertainties which could cause actualresults to differ materially from our expectations. Such risks and uncertainties include, but are not limited to: volatility in the price and demandfor oil and natural gas; fluctuations in the demand for contract drilling, well servicing and ancillary oilfield services; our customers’ inability toobtain adequate credit or financing to support their drilling and production activity; changes in drilling and well servicing technology which couldreduce demand for certain rigs or put us at a competitive disadvantage; shortages, delays and interruptions in the delivery of equipment suppliesand other key inputs; the effects of seasonal and weather conditions on operations and facilities; the availability of qualified personnel andmanagement; a decline in our safety performance which could result in lower demand for our services; changes in environmental laws andregulations such as increased regulation of hydraulic fracturing or restrictions on the burning of fossil fuels and greenhouse gas emissions, whichcould have an adverse impact on the demand for oil and gas; terrorism, social, civil and political unrest in the foreign jurisdictions where weoperate; fluctuations in foreign exchange, interest rates and tax rates; and other unforeseen conditions which could impact the use of servicessupplied by Precision and Precision’s ability to respond to such conditions.
Readers are cautioned that the forgoing list of risk factors is not exhaustive. Additional information on these and other factors that could affectour business, operations or financial results are included in reports on file with applicable securities regulatory authorities, including but notlimited to Precision’s Annual Information Form for the year ended December 31, 2016, which may be accessed on Precision’s SEDAR profile atwww.sedar.com or under Precision’s EDGAR profile at www.sec.gov. The forward-looking information and statements contained in this newsrelease are made as of the date hereof and Precision undertakes no obligation to update publicly or revise any forward-looking statements orinformation, whether as a results of new information, future events or otherwise, except as required by law.

3| 33|
PRECISION AT A GLANCE
High Performance Land Driller
*Dots on map representative of areas where Precision has had drilling operations in 2015, 2016 & 2017 (09/2017)
256 Drilling Rigs:Canada (136)U.S. (103) International (17)
210 Service Rigs:Canada (202)U.S. (8)
Complementary Services:Camps & Catering, Rentals and Water Treatment

4| 44|
0
100
200
300
400
500
600
700
800
Jan
uar
y
Feb
ruar
y
Mar
ch
Ap
ril
May
Jun
e
July
Au
gust
Sep
tem
be
r
Oct
ob
er
No
vem
be
r
De
cem
ber
2012-2017 Range
2014
2016
2017
2018
HISTORICAL NORTH AMERICAN DRILLING ACTIVITY
IMPROVING IN 2018
U.S. LAND RIG COUNT10 YEAR HISTORY
CANADIAN LAND RIG COUNT5 YEAR HISTORY
Source: Baker Hughes land rig count as of 1/12/2018
1282016 Average
Active Rigs
3782014 Average
Active Rigs
2052017 Average
Active Rigs
200
400
600
800
1,000
1,200
1,400
1,600
1,800
2,000
20
18
20
17
20
11
20
10
20
09
20
16
20
07
20
08
20
12
20
14
20
19
20
13
20
15
1,8042014 Average
Active Rigs
8562017 Average
Active Rigs
9432015 Average
Active Rigs
4862016 Average
Active Rigs
5| 5|
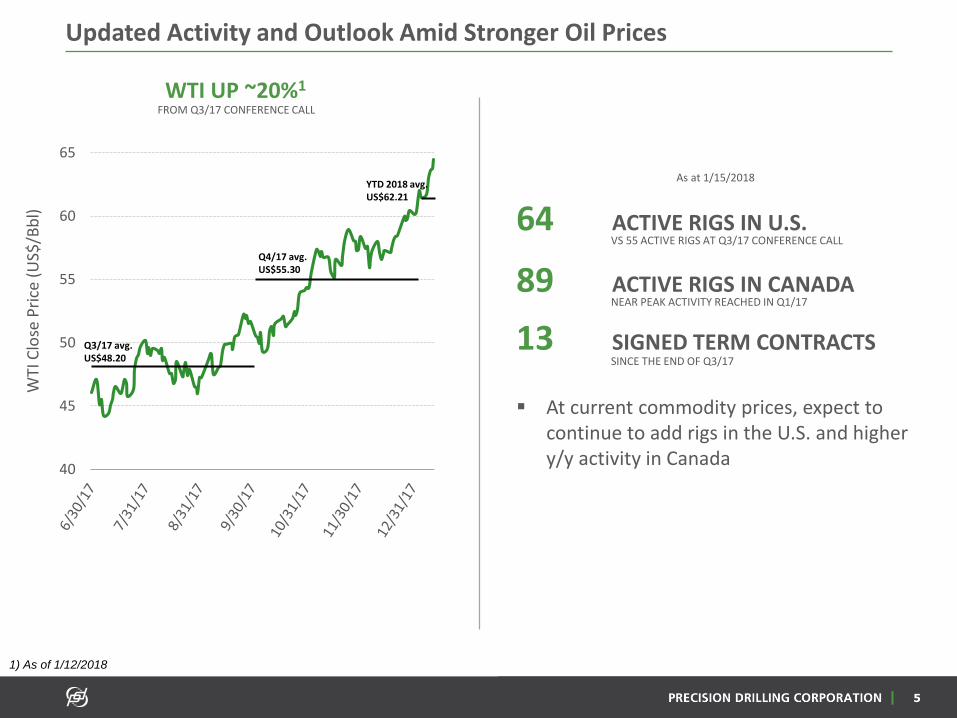
Updated Activity and Outlook Amid Stronger Oil Prices
1) As of 1/12/2018
40
45
50
55
60
65
WTI
Clo
se P
rice
(U
S$/B
bl)
Q3/17 avg. US$48.20
Q4/17 avg. US$55.30
YTD 2018 avg. US$62.21
89 ACTIVE RIGS IN CANADA
13 SIGNED TERM CONTRACTSSINCE THE END OF Q3/17
NEAR PEAK ACTIVITY REACHED IN Q1/17
64 ACTIVE RIGS IN U.S.VS 55 ACTIVE RIGS AT Q3/17 CONFERENCE CALL
▪ At current commodity prices, expect to continue to add rigs in the U.S. and higher y/y activity in Canada
WTI UP ~20%1
FROM Q3/17 CONFERENCE CALL
As at 1/15/2018

6|
FIXED COST LEVERAGE
Deliver High Performance, High Value service offerings in an
improving demand environment while
demonstrating fixed cost leverage
FINANCIAL DISCIPLINE COMMERCIALIZE RIG AUTOMATION
Commercialize rig automation and efficiency-driven
technologies across our Super Series fleet
Maintain strict financial discipline in pursuing growth opportunities with a focus on
free cash flow and debt reduction
Precision’s 2017 Strategic Priorities

7|
FIXED COST LEVERAGE
Deliver High Performance, High Value service offerings in an improving demand environment while demonstrating fixed cost leverage
▪ Reduced general and administrative costs by ~12% y/y1
▪ Stable corporate headcount while North American activity increased ~84% y/y1
▪ Sustained High Performance, High Value service offering
▪ Achieved near record low operating cost per day in the U.S. in Q3/17
1) Year-to-date as at 9/30/2017

8| 8|
Precision’s High Performance Foundation
PRECISION SYSTEMS PRECISION CREWS SUPER SERIES RIGS
9| 99|
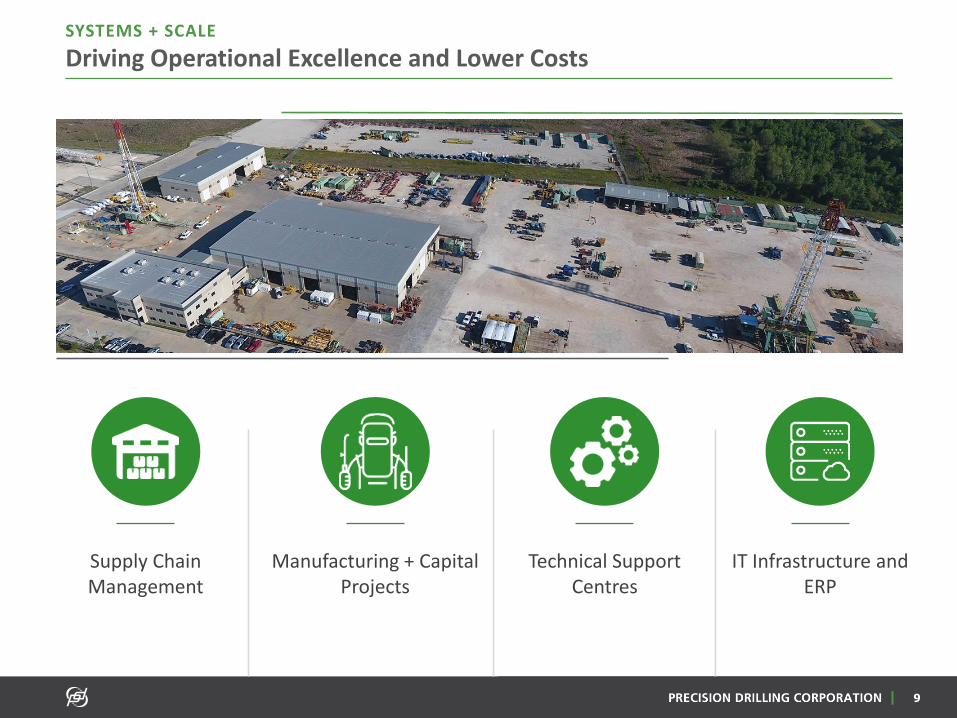
SYSTEMS + SCALE
Driving Operational Excellence and Lower Costs
Technical Support Centres
Supply Chain Management
IT Infrastructure and ERP
Manufacturing + Capital Projects

10| 10|
Precision’s Employee Recruiting and Development Program
1,200 – 1,400 Screened candidates in the
system
100+ drilling rigs reactivated from Q2/16 lows, 2000+ positions filled
Leadership Development
Programs
Career Path Management Structured Promotion Programs
Long-term Compensation Programs
Field Training Investments
Permanent Training Facilities with Fully
Functioning Rigs
Tier 1 Assets
Structured Competency
StandardsWorld-Class Safety
Culture and Processes
127,224Applications processed
2013-2016(30,700 Applications in YTD1)
1. As of 9/30/2017
11| 11|
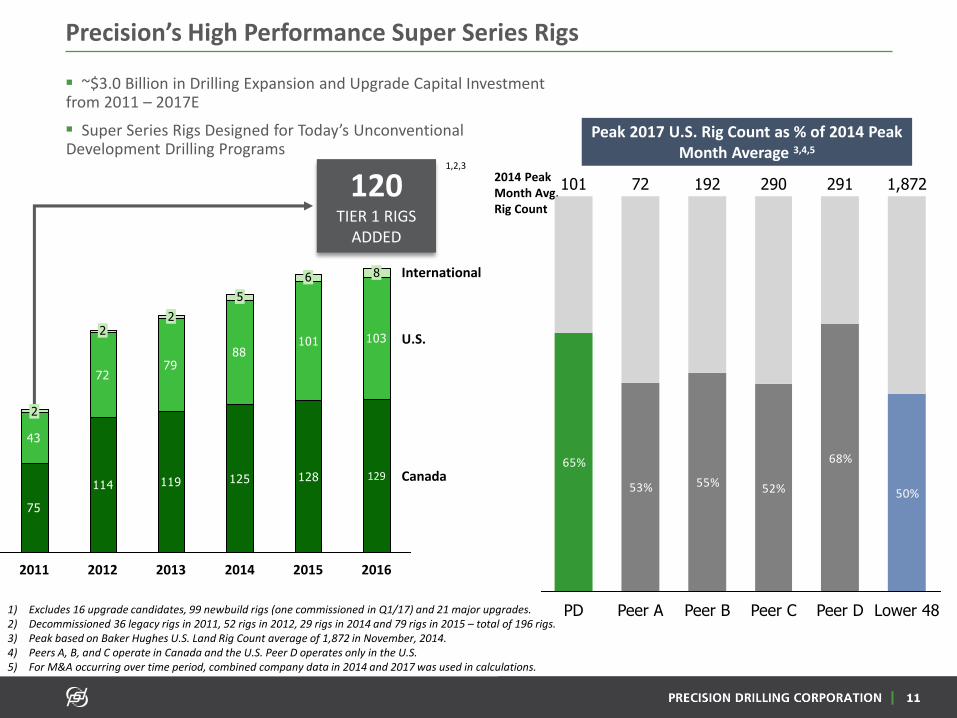
Precision’s High Performance Super Series Rigs
▪ ~$3.0 Billion in Drilling Expansion and Upgrade Capital Investment from 2011 – 2017E
▪ Super Series Rigs Designed for Today’s Unconventional Development Drilling Programs
75
114128
43
7279
88101
125119
1032
2
8
2015
International
2016
129 Canada
U.S.
6
5
2013 20142011
2
2012
1) Excludes 16 upgrade candidates, 99 newbuild rigs (one commissioned in Q1/17) and 21 major upgrades.2) Decommissioned 36 legacy rigs in 2011, 52 rigs in 2012, 29 rigs in 2014 and 79 rigs in 2015 – total of 196 rigs.3) Peak based on Baker Hughes U.S. Land Rig Count average of 1,872 in November, 2014.4) Peers A, B, and C operate in Canada and the U.S. Peer D operates only in the U.S.5) For M&A occurring over time period, combined company data in 2014 and 2017 was used in calculations.
1,2,3
75
114 119 125 128
43
7279
88103101
6
5
129
8
2
22
120TIER 1 RIGS
ADDED
2014 Peak Month Avg. Rig Count
Peak 2017 U.S. Rig Count as % of 2014 Peak Month Average 3,4,5
65%
53% 55% 52%
68%
50%
Lower 48
1,872
Peer D
291
Peer C
290
Peer B
192
Peer A
72
PD
101

12| 1212|
PRECISION SUPER TRIPLE
Consistent, Predictable and Efficient
*Rig 575, Drilling in Oklahoma (SCOOP/ STACK)
▪ Reducing well cost
▪ Improving performance and efficiency
▪ Providing value to customers – increasing
market share
* As of 8/15/2017
2013
24%
2012
12%
+46%
2017 YTD*
80%
2016
79%
2015
53%
2014
29%
U.S
. Su
pe
r Tr
iple
Pad
Rig
O
p. D
ays
as %
of
Tota
l
1.73% 1.65% 1.58%
0.90% 1.11%
2012
-8%
1H/1720162015
1.39%
20142013
U.S
. To
tal
Do
wn
tim
e

13|
FINANCIAL DISCIPLINE
Maintain strict financial discipline in pursuing growth opportunities with a focus on free cash flow and debt reduction
▪ Reinforced liquidity position through credit
facility maturity extension
▪ Extended maturity profile of senior notes
with first maturity not until December 2021
▪ Reduction of ~US$50 million in long-term
debt
▪ With existing fleet of 240 Tier 1 rigs and low
upgrade costs, maintained modest capex plan
in 2017 and reduced plan by ~$34 million
mid-year as activity growth stalled

14| 1414|
CANADA
Focused on Cash Flow, Leading Market Share
$156
$252
$269
$321
CASH FLOW 1(SINCE 2010)
1) Cash flow calculated using reported daily margins multiplied by drilling utilization days plus C&P EBITDA, less maintenance capital expenditure.2) Based on well count provided by industry sources and internal analysis (2017 average).* Dots on map representative of areas where Precision has had operations in 2015, 2016 & 2017 (09/2017)
GENERATED
$1.7BIN CASH FLOW
$765M InvestedIN GROWTH CAPITAL
70+ DeliveredNEWBUILD & UPGRADED RIGS
96% Tier 1RIGS IN FLEET
GROWTH(SINCE 2010)
LEADING MARKET POSITION(CANADA)
25% Market ShareTypically operate 25% of rigs in market with 136 drilling rig fleet
30% DuvernayLEADING MARKET SHARE2
33% Heavy OilLEADING MARKET SHARE2
26% MontneyLEADING MARKET SHARE2

15| 1515|
UNITED STATES
Focused on Market Share Growth, Cash Flow
▪ Permian and Woodford (SCOOP/STACK) – targeted growth in
most active areas
▪ DJ-Niobrara – approaching leading market position
▪ Eagle Ford – activity outlook improving
▪ Upside for other regions with higher commodity prices
▪ Proven Super Series fleet of 103 rigs
▪ Ability to respond to customer demand across U.S.
▪ Established and growing premium customer base
1) Market share calculated based on drilling days * Dots on map representative of areas where Precision has had operations in 2015, 2016 & 2017 (09/2017)
MARKET SHARE1
MARKET SHARE GROWTH IN KEY PLAYS SINCE 2010GROWTH
PRECISION DRILLING U.S.
COMPLETE GEOGRAPHICAL COVERAGEREPUTATION & SCALETOTAL REACH
DRIVES GROWTH
0%
2%
4%
6%
8%
10%
12%
14%
16%
18%
20%
22%
24%
DJ-NiobraraPermianWoodford
2010
2017

16| 1616|
INTERNATIONAL
Stable Cash Flow in Low Cost Region
ESTABLISHED SCALEIN THE MIDDLE EAST REGION
▪ Ability to leverage fixed costs with additional deployments
▪ Targeting IOC’s and NOC’s that value Safety and Performance
8 RIGSCURRENTLY UNDER CONTRACT
6 NEWBUILD RIGSDEPLOYED SINCE 2014 INCLUDING TWO IN Q4/16
17 TOTAL RIGSDEPLOYED INTERNATIONALLY (12 ME REGION, 5 MEXICO)

17| 17|
Revenue and Cash Flow Visibility and Stability
TOP 50 CUSTOMERS12017
PUBLIC
70%
CONTRACT BOOK22018
CUSTOMER BASE
▪ Primarily public, large private and national oil companies
▪ Average market capitalization of ~$51 billion (median ~$16 billion)3
1. Includes Canada, U.S. and International operations (YTD as at 9/30/2017). 2. As of 12/31/2017 3. As of 1/12/2018
▪ Proactive contract management – balancing predictable cash flow with exposure to improving price environment
▪ All contracts performed through the downturn
▪ Added 13 term contracts since end of Q3/173
PRIVATE
24%
NATIONALOIL COMPANIES
6%
8 7
28
18
8
7
3
5
44
2019Average
10
2
2018Average
32
Q1 2018 Average
US
International
Canada

18| 1818|
PRECISION WELL SERVICING
High Performance Well Service Operations – Focused on Cash Flow
Largest service rig provider in the WCSB and
established presence in the U.S.
▪ Ideally suited to address maintenance,
optimization and completion needs
210 Well Service rigs and Snubbing units
▪ Includes 2016 acquisition of Essential’s well
service rig fleet
Centralized Facility Includes:
Localized operations & management teams
Centralized technical support services
Centralized HSE support & training center
Precision Well Service Facility, Red Deer, Alberta

19| 1919|
2018 CAPITAL PLAN
Strict Financial Discipline
TOTAL:
$94M
PLANNED 2018 CAPEX
$32M
EXPANSION & UPGRADES
▪ $32M for Upgrades
▪ Plans to upgrade ~10-20 Tier 1 rigs to
industry leading rig specifications
▪ Additions of walking systems
▪ Increased pumping and racking capacities
▪ Rig automation systems
** Spending contingent on firm customer contract commitments that meet internal return thresholds
$62M
MAINTENANCE & INFRASTRUCTURE
▪ Fleet well maintained throughout the
downturn, minimal catch-up
maintenance required
▪ Remaining spend related to ERP
system upgrade
✓ Increase operating efficiencies, improve fixed cost leverage and position organization to better handle increased data flows
▪ 2017 capital spending expected to be slightly lower than $104 million planned

20| 20|
Financial Performance and Fixed Cost Leverage
▪ Aggressive cost management
▪ Rig contract performance
▪ Premium dayrates
0
20
40
60
80
100
120
140
0
20
40
60
80
100
120
140
160
180
Avg. Act
ive R
ig C
ount
TTM
SG
&A E
xpense
($m
ms)
TTM SG&A U.S. Rig Count WCSB Rig Count
▪ Reduced SG&A expenses by ~30% through downturn
▪ Stable corporate headcount from post-restructuring levels
▪ Increased U.S. rig count by ~250% from trough to peak in 2017
FIXED COST LEVERAGEWITH IMPROVED ACTIVITY
RESILIENT MARGINSTHROUGH THE DOWNTURN

21| 21|
Financial Discipline and Debt Reduction
Pro Forma Liquidity as of 09/30/2017 1
(in $ millions)
1) Calculated as undrawn portion of revolver (adjusted for LCs outstanding) and cash using CAD/USD exchange rate and balance sheet numbers as at 9/30/2017.2) Pro forma cash balance calculated as 9/30/2017 cash balance less US$50 million using CAD/USD exchange rate as at 9/30/2017
US$400US$400
US$350
US$249
202620252024202320222021202020192018
$696
$69
$765
Cash2
Revolver/ Operating Facilities1
(Matures November, 2021)
▪ Full access to revolving credit facility and available cash balance
▪ Tier 1 asset base and strong activity provide free cash flow runway
▪ Revolving Credit Facility Amended
▪ New Issue US$400 million notes due 2026
▪ Tender Offer/Redemption of 2020 notes & partial tender of 2021 notes
▪ ~US$50 million debt repayment using cash
No Maturities Until December 2021
2017 FINANCING ACTIVITIES
STRONG LIQUIDITY POSITION
SENIOR DEBT MATURITY PROFILE

22|
COMMERCIALIZE RIG AUTOMATION
Commercialize rig automation and efficiency-driven technologies across our Super Series fleet
Progress as of 1/12/18
▪ 20 rigs running with NOVOS and drilled >135 wells
▪ Drilled >130 wells and ~1.6 million feet utilizing a directional guidance system
▪ Drilled >95% of the total footage on land to date utilizing wired drill pipe
▪ Further technology updates to be provided with Q4/17 results

23| 2323|
PRECISION SUPER TRIPLE
Advanced Rig Technology
1500 HP TDS-11 TOP DRIVE
25,000’ + FT RACKING CAPACITY
PROCESS AUTOMATION CONTROL (APPS)*
DRILLING EQUIPMENT CONTROL SYSTEM*
HIGH SPEED DOWNHOLE DATA*
“OMNI-PAD” WALKING SYSTEM
TRANSFER TANK
TWO SPEED DRAWWORKS
DIRECTIONAL GUIDANCE SYSTEM*
(3) 1,600HP 7,500 PSI PUMPS
(4) CAT 3512 GENSETS
INTEGRATED POWER MANAGEMENT SYSTEM
1
1
2 3
4
5
6
7 8
9 11
10
2
3
4
5
6 825,000 LBS HOOKLOAD
7
8
9
10
11 UMBILICALLY CONNECTEDBACKYARD COMPLEX
12
1213
14
13
14
REMOTE OPERATIONS CONTROL CENTER (OPTIMIZATION*)
* Precision Technology Building Blocks

24| 24|
PRECISION TECHNOLOGY BUILDING BLOCKS
DRILLING EQUIPMENT CONTROL SYSTEM
Connects all rig components to electronically manage, control and
monitor rig equipment
PROCESS AUTOMATION CONTROL
Automates repetitive drilling activities using pre-programmed
automation routines
APPS
Open source software allows for expansive app development to
further automate drilling operations
HIGH SPEED DOWNHOLE DATA
Wired drill pipe enables instantaneous transmission of data,
saving time
RIG AUTOMATION
DIRECTIONAL GUIDANCE SYSTEM
Steering instructions generated using algorithms and real-time
downhole data to automate directional drilling
OPTIMIZATION
Using analytics and data to improve performance, drill faster
DRAWWORKS ENGINES
MUD PUMPSTOP DRIVE

25| 2525|
41% Overall Time SavingsPER CONNECTION
PROCESS AUTOMATION CONTROL
Consistent, Predictable, Repeatable
Experienced Driller
Min
ute
sProcess Automation Control
Min
ute
s
Precision data from Rig 601 field trials
26| 2626|
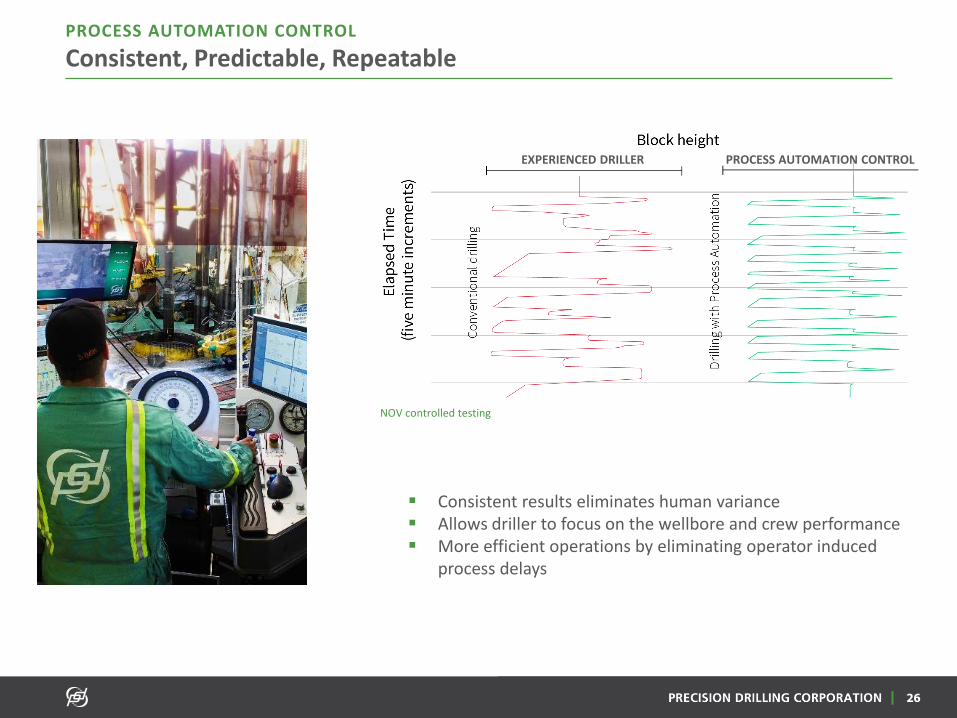
PROCESS AUTOMATION CONTROL
Consistent, Predictable, Repeatable
▪ Consistent results eliminates human variance▪ Allows driller to focus on the wellbore and crew performance▪ More efficient operations by eliminating operator induced
process delays
NOV controlled testing
EXPERIENCED DRILLER PROCESS AUTOMATION CONTROL

27| 27|
Technology Commercialization – Revenue Potential
REVENUE IMPACT
Each technology is a service sold to customers as bolt on to
our existing rigs
FLEET PULL THROUGH
Pull through on existing rigs and directional drilling service
TECHNOLOGY DAILY EBITDA IMPACT ESTIMATE AVAILABLE FLEET EST. % OF ACTIVE RIGS (2018-2019)
PAC $1,500 100+ rigs 80%-100%
DGS $1,000 256 rigs 20%-50%
High Speed Downhole Data1 $2,500 100+ rigs 20%
Apps2 $250-$1,000 100+ rigs 80%-100%
FIXED DAILY CHARGE INCREASED UTILIZATION & DAYRATE
REINFORCED COMPETITIVE ADVANTAGE
New technologies will strengthen competitive
advantage and provide a platform for future technology
revenue streams
MARKET SHARE

28|
MARKET SHARE GROWTH
North American driller with demonstrated market share growth
STRONG BALANCE SHEET
Strong balance sheet with $765 million of liquidity
SCALE
Scale supports improved service delivery and financial returns through cost leverage
TIER 1 FLEET
High Performance Tier 1 fleet and focus on automation technology commercialization to reduce drilling costs
CONTRACT POSITION
Attractive contract position and customer base
FINANCIAL DISCIPLINE
Focus on free cash flow, fixed cost leverage and capital discipline
Investment Merits
TSX: PD NYSE: PDS
* Liquidity as at 3/31/2017

29|
PRECISION DRILLING CORPORATION
800, 525-8th Avenue S.W.
Calgary, Alberta, Canada T2P 1G1
Telephone: 403.716.4500
Facsimile: 403.264.0251
www.precisiondrilling.com