
Precise Measurement of Vibrational Transition Frequency of Optically Trapped molecules NICT...
17
Precise Measurement of Vibrational Transition Frequency of Optically Trapped molecules NICT Masatoshi Kajita TMU G. Gopakumar, M. Abe, M. Hada We propose to test the variation in the proton-to-electron mass ratio, via the precise measurement of the vibrational transition freq. of ultra-cold molecules. (f/f < 10 -16 ) X 6 Li or X 23 Na molecules X: 174 Yb, 88 Sr, 40 Ca (in an optical lattice) X 2 (v,N) = (0,0)->(v u ,0) (v u = 1,2,3,4) The transition is observed by Raman transition (one
-
Upload
collin-owen -
Category
Documents
-
view
223 -
download
0
Transcript of Precise Measurement of Vibrational Transition Frequency of Optically Trapped molecules NICT...
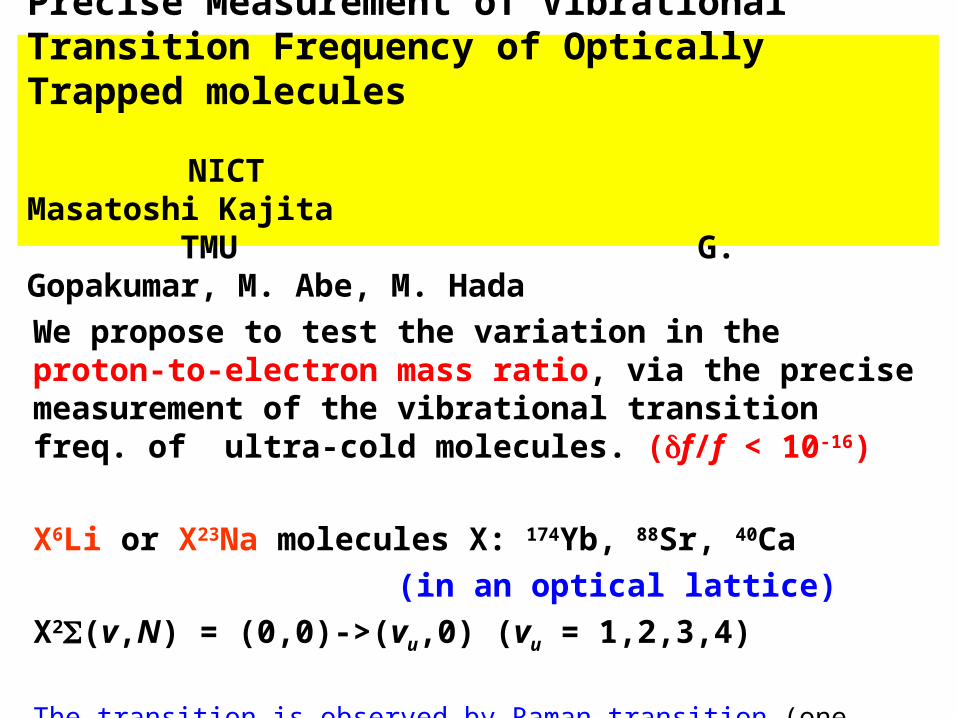
Precise Measurement of Vibrational Transition Frequency of Optically Trapped molecules NICT Masatoshi Kajita TMU G. Gopakumar, M. Abe, M. Hada
We propose to test the variation in the proton-to-electron mass ratio, via the precise measurement of the vibrational transition freq. of ultra-cold molecules. (f/f < 10-16)
X6Li or X23Na molecules X: 174Yb, 88Sr, 40Ca
(in an optical lattice)
X2(v,N) = (0,0)->(vu,0) (vu = 1,2,3,4)
The transition is observed by Raman transition (one photon forbidden).
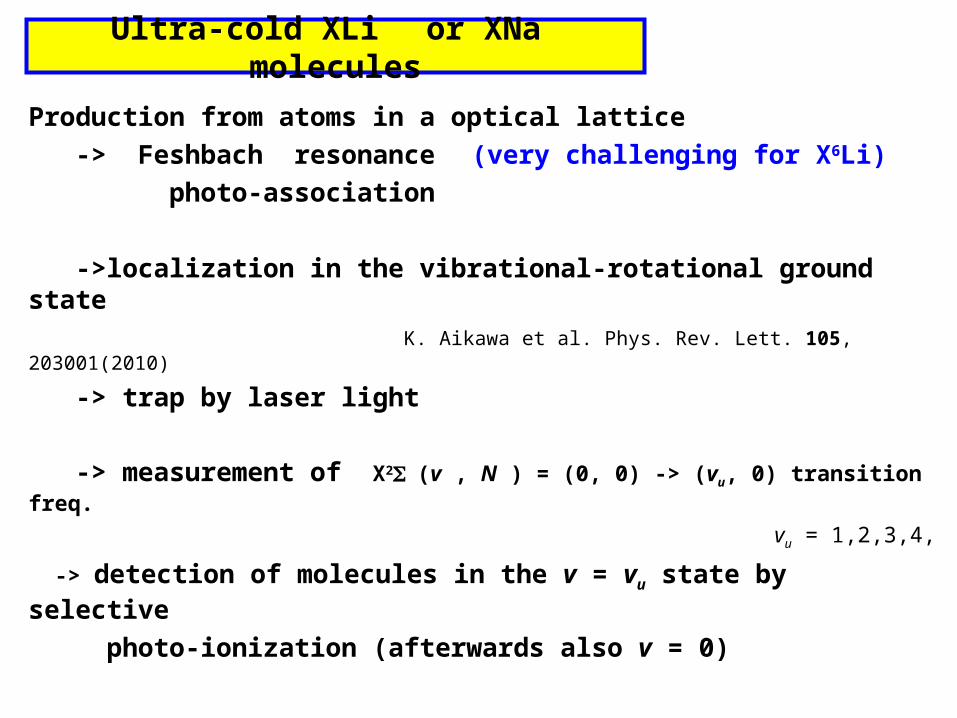
Ultra-cold XLi or XNa molecules
Production from atoms in a optical lattice
-> Feshbach resonance (very challenging for X6Li)
photo-association
->localization in the vibrational-rotational ground state K. Aikawa et al. Phys. Rev. Lett. 105, 203001(2010)
-> trap by laser light
-> measurement of X2(v , N ) = (0, 0) -> (vu, 0) transition freq.
vu = 1,2,3,4,
-> detection of molecules in the v = vu state by selective
photo-ionization (afterwards also v = 0)

Transition Frequency(THz) λ f ∝ (mp/me)-
174Yb6Li
v = 0 ->1 4.17 0.47
v = 0 ->4 15.37 0.4388Sr6Li
v = 0 ->1 5.06 0.48
v = 0 ->4 19.05 0.4540Ca6Li
v = 0 ->1 5.77 0.47
v = 0 ->4 21.46 0.43
88Sr23Na
v = 0 ->1 2.29 0.56
v = 0 ->4 8.65 0.5040Ca23Na
v = 0 ->1 2.57 0.48
v = 0 ->4 9.72 0.45
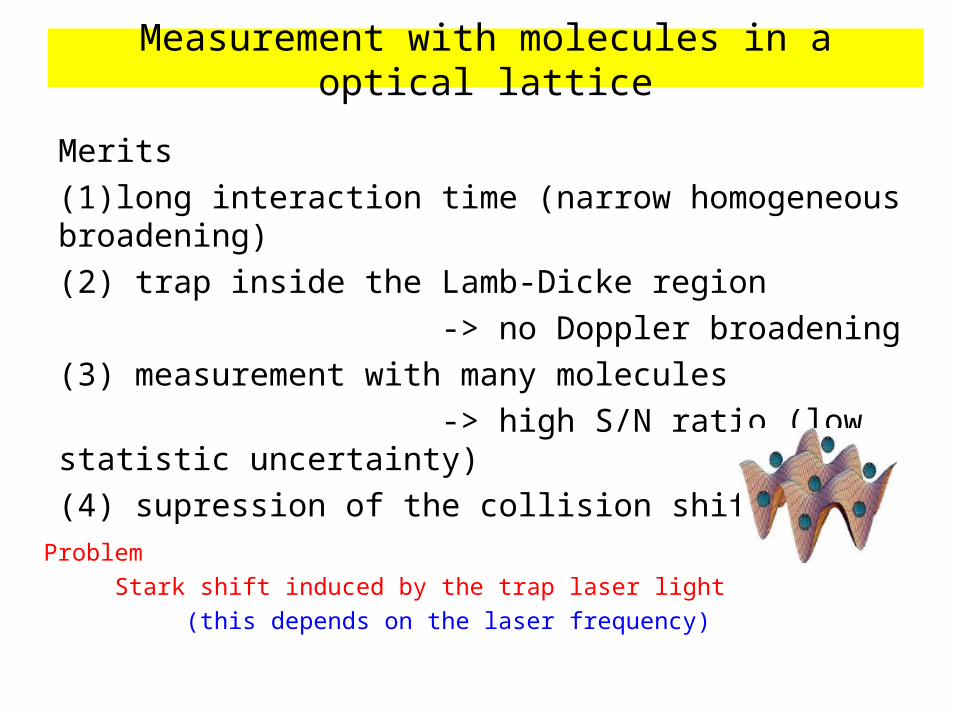
Measurement with molecules in a optical lattice
Problem
Stark shift induced by the trap laser light
(this depends on the laser frequency)
Merits
(1)long interaction time (narrow homogeneous broadening)
(2) trap inside the Lamb-Dicke region
-> no Doppler broadening
(3) measurement with many molecules
-> high S/N ratio (low statistic uncertainty)
(4) supression of the collision shift
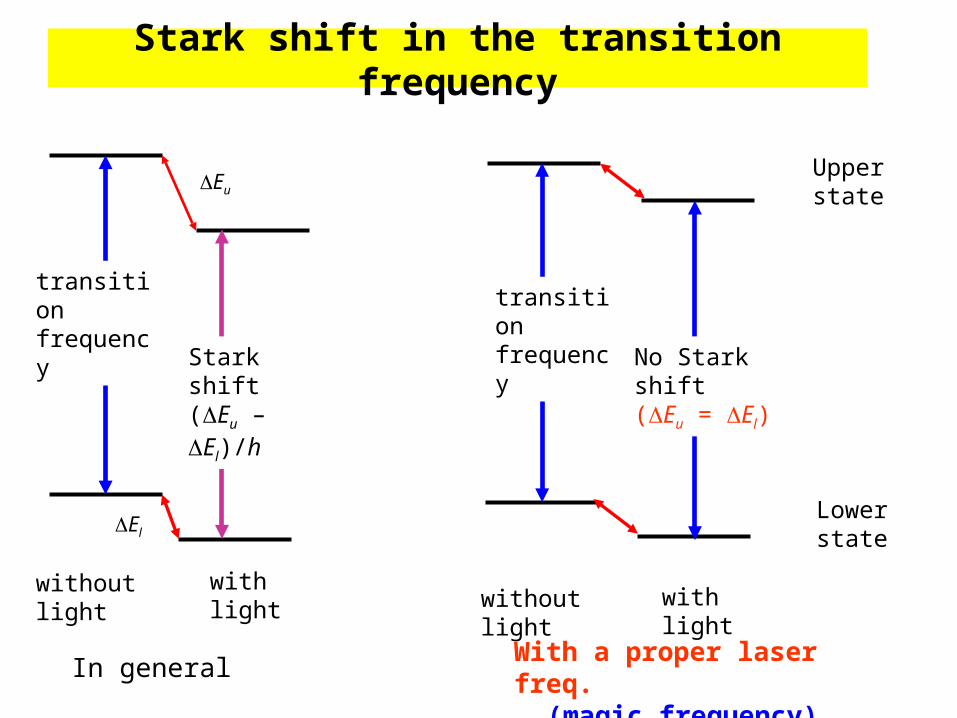
Stark shift in the transition frequency
Upper state
Lower state
without light with lightwith lightwithout light
transition frequency transition
frequency
Eu
El
Stark shift(Eu – El)/h
No Stark shift(Eu = El)
In generalWith a proper laser freq. (magic frequency)
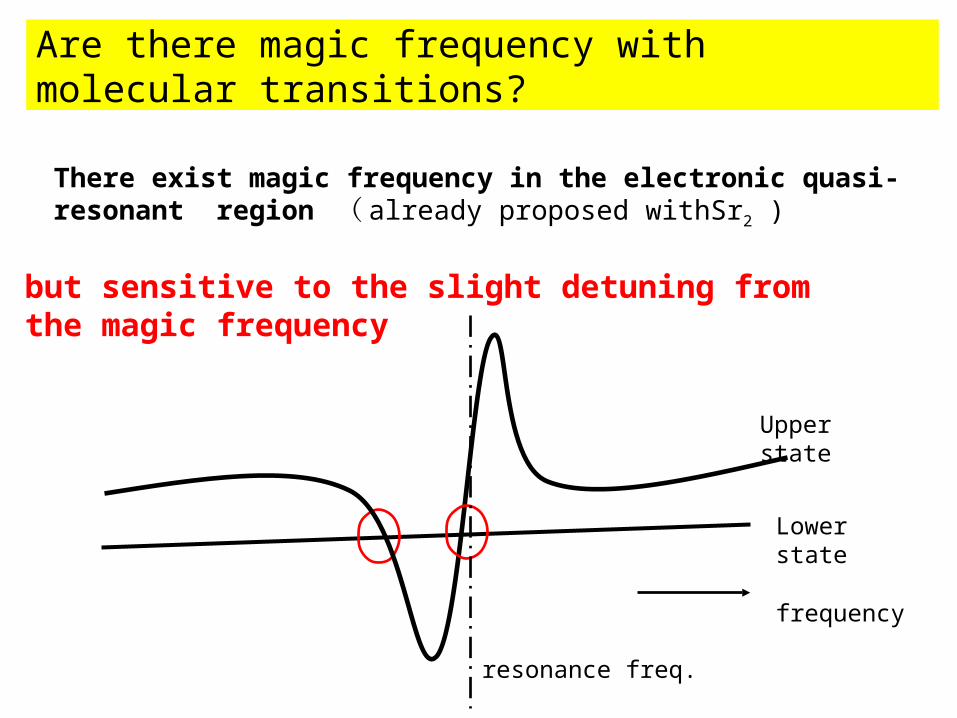
Are there magic frequency with molecular transitions?
There exist magic frequency in the electronic quasi-resonant region ( already proposed withSr2 )
Upper state
Lower state
frequency
but sensitive to the slight detuning from the magic frequency
resonance freq.
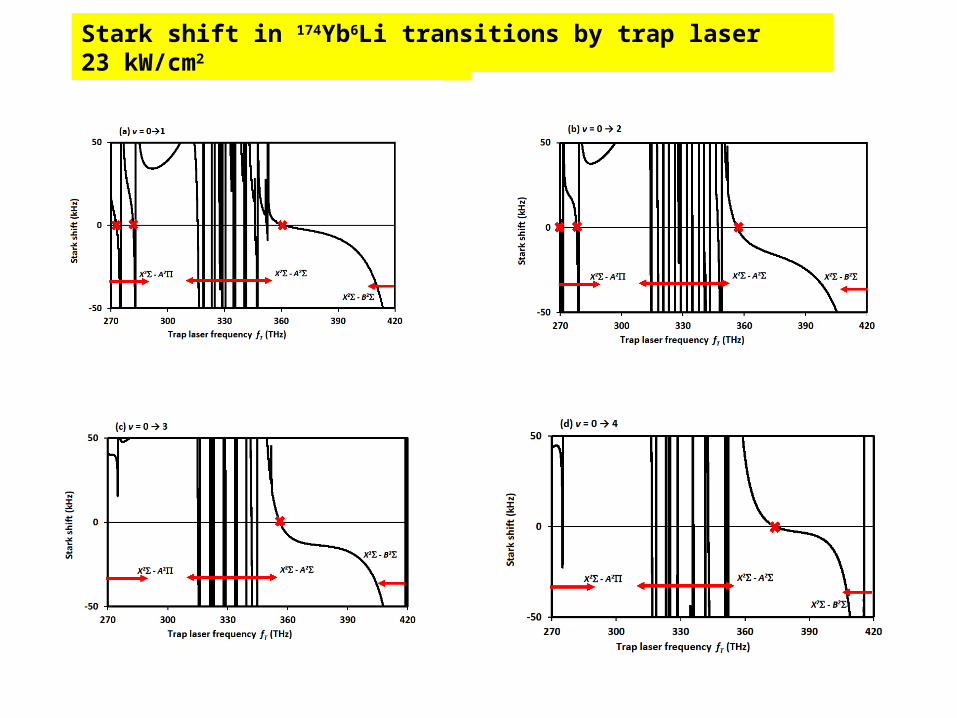
Stark shift in 174Yb6Li transitions by trap laser 23 kW/cm2

Magic frequencies (power density to get the potential depth of 10 K )
Transition Freq. (THz) power density (kW/cm2) Slope (/MHz)174Yb6Li v = 0 -> 1 361.4 17 5.8 x 10⁻¹⁷ v = 0 -> 4 374.2 12 3.2 x 10⁻¹⁷
88Sr6Li v = 0 -> 1 313.5 11 1.1 x 10⁻¹⁵ v = 0 -> 2 271.3 11 1.8 x 10⁻¹⁶
v = 0 -> 4 325.2 8 1.3 x 10⁻¹⁵
40Ca6Li v = 0 -> 1 268.9 11 1.0 x 10⁻¹⁶ v = 0 -> 2 258.3 12 1.2 x 10⁻¹⁶
v = 0 -> 3 261.6 12 1.8 x 10⁻¹⁶
88Sr23Na v = 0 -> 1 287.8 8 1.2 x 10⁻¹⁵ v = 0 -> 4 318.4 15 5.7 x 10⁻¹⁶
40Ca6Li v = 0 -> 1 335.7 25 1.2 x 10⁻¹⁵ v = 0 -> 3 340.0 21 2.6 x 10⁻¹⁶
v = 0 -> 4 344.1 20 1.5 x 10⁻¹⁶
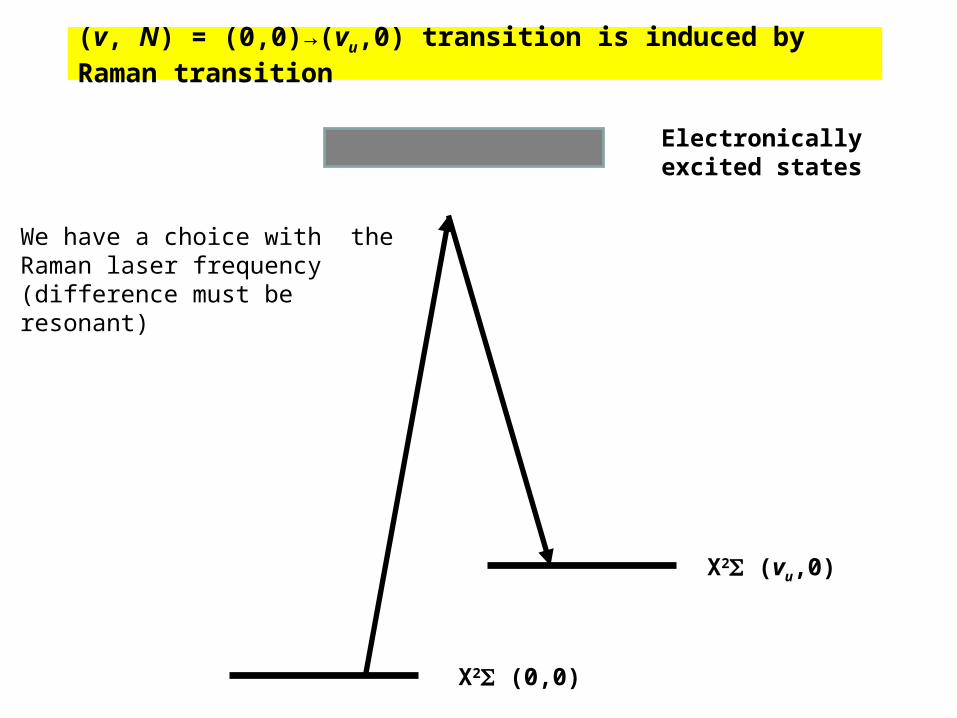
(v, N) = (0,0)→(vu,0) transition is induced by Raman transition
X2 (0,0)
X2 (vu,0)
Electronically excited states
We have a choice with the Raman laser frequency(difference must be resonant)
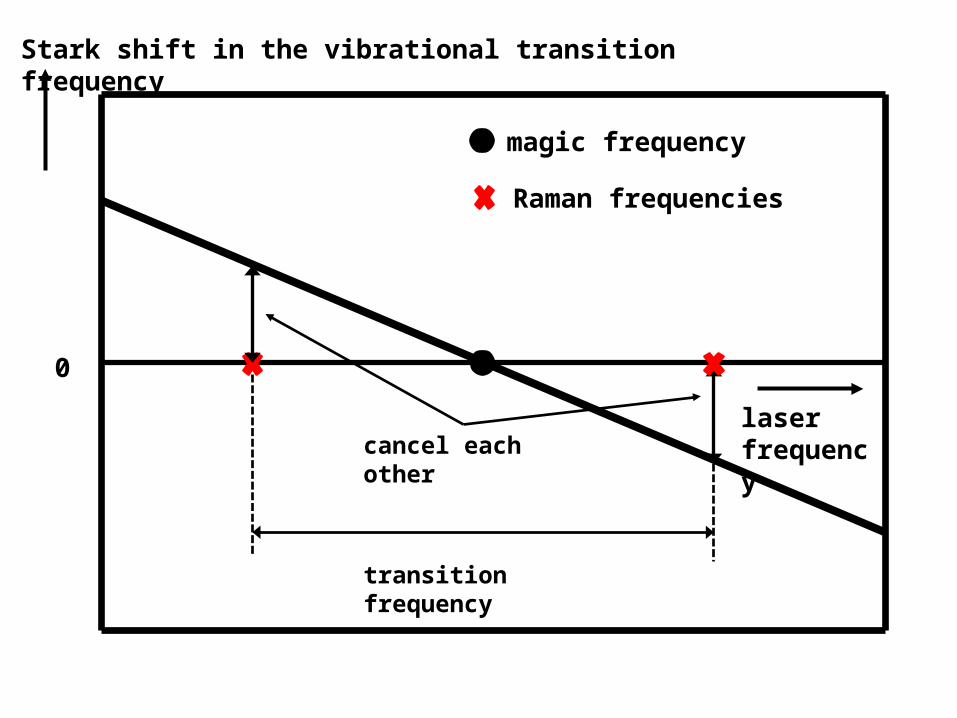
Stark shift in the vibrational transition frequency
magic frequency
0
laser frequency
Raman frequencies
transition frequency
cancel each other

Raman laser frequencies when intensities of tow Raman lasers are equal ( intensity to get Rabi frequency of 1/6 Hz)
Transition Freq. (THz) power density (mW/cm2) One laser shift 174Yb6Li v = 0 -> 1 364.3 + 360.1 100 8.0 x 10⁻¹⁶ v = 0 -> 2 277.9 + 269.8 43 1.5 x 10⁻¹⁵
v = 0 -> 4 385.8 + 370.4 112 9.5 x 10⁻¹⁶
88Sr6Liv = 0 -> 1 313.7 + 308.6 17 3.0 x 10⁻¹⁶ v = 0 -> 2 313.5 + 303.6 50 1.7 x 10⁻¹⁵
v = 0 -> 4 298.6 + 279.5 6.7 1.7 x 10⁻¹⁵
40Ca6Liv = 0 -> 1 261.8 + 256.0 75 1.3 x 10⁻¹⁵ v = 0 -> 2 291.1 + 279.9 6.7 1.7 x 10⁻¹⁵
v = 0 -> 3 298.6 + 282.1 6.7 1.3 x 10⁻¹⁵
88Sr23Nav = 0 -> 1 316.1 + 313.8 29 9.6 x 10⁻¹⁶ v = 0 -> 3 315.1 + 308.5 160 2.0 x 10⁻¹⁵
40Ca23Nav = 0 -> 1 334.1 + 331.6 27 3.0 x 10⁻¹⁶ v = 0 -> 2 340.1 + 335.1 59 1.5 x 10⁻¹⁵
v = 0 -> 4 309.7 + 300.0 5.8 5.7 x 10⁻¹⁵
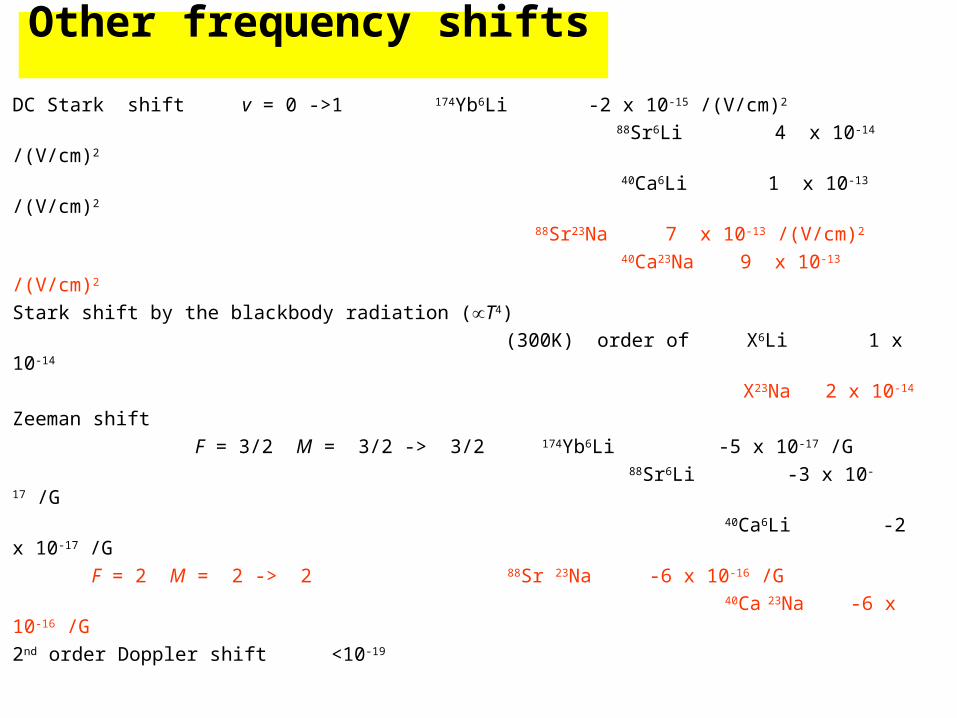
Other frequency shifts DC Stark shift v = 0 ->1 174Yb6Li -2 x 10-15 /(V/cm)2
88Sr6Li 4 x 10-14 /(V/cm)2
40Ca6Li 1 x 10-13 /(V/cm)2 88Sr23Na 7 x 10-13 /(V/cm)2
40Ca23Na 9 x 10-13 /(V/cm)2
Stark shift by the blackbody radiation (∝ T4)
(300K) order of X6Li 1 x 10-14
X23Na 2 x 10-14
Zeeman shift
F = 3/2 M = 3/2 -> 3/2 174Yb6Li -5 x 10-17 /G 88Sr6Li -3 x 10-17 /G
40Ca6Li -2 x 10-17 /G
F = 2 M = 2 -> 2 88Sr 23Na -6 x 10-16 /G
40Ca 23Na -6 x 10-16 /G
2nd order Doppler shift <10-19
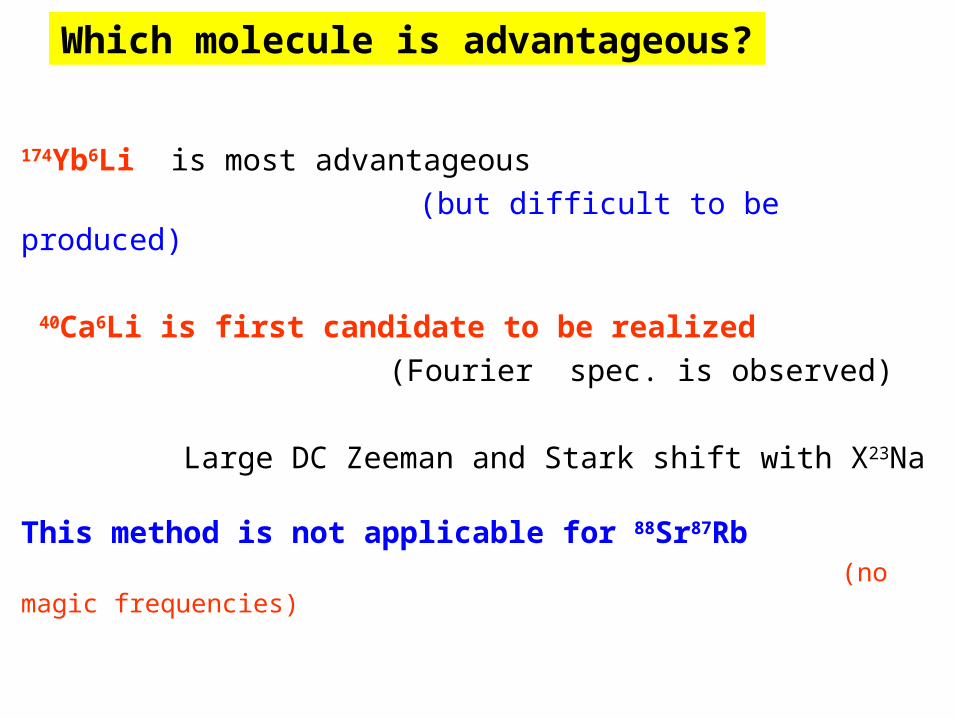
Which molecule is advantageous?
174Yb6Li is most advantageous
(but difficult to be produced)
40Ca6Li is first candidate to be realized
(Fourier spec. is observed)
Large DC Zeeman and Stark shift with X23Na
This method is not applicable for 88Sr87Rb (no magic frequencies)
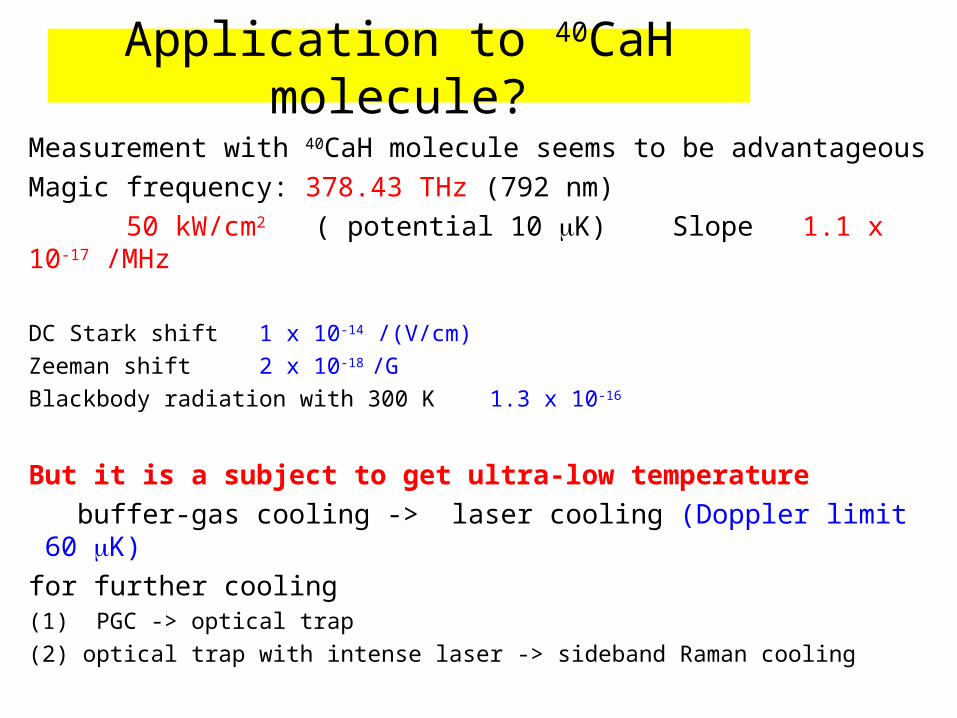
Application to 40CaH molecule?
Measurement with 40CaH molecule seems to be advantageous
Magic frequency: 378.43 THz (792 nm)
50 kW/cm2 ( potential 10 K) Slope 1.1 x 10⁻¹⁷ /MHz
DC Stark shift 1 x 10-14 /(V/cm)
Zeeman shift 2 x 10-18 /G
Blackbody radiation with 300 K 1.3 x 10⁻¹⁶
But it is a subject to get ultra-low temperature
buffer-gas cooling -> laser cooling (Doppler limit 60 K)
for further cooling(1) PGC -> optical trap
(2) optical trap with intense laser -> sideband Raman cooling
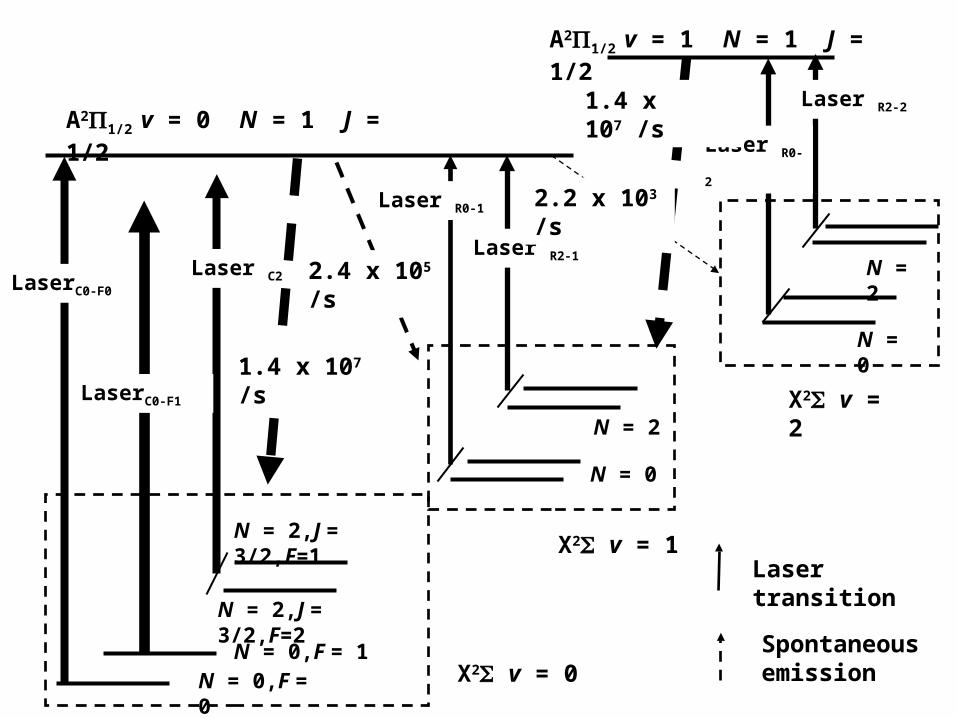
A21/2 v = 0 N = 1 J = 1/2
A21/2 v = 1 N = 1 J = 1/2
X2 v = 0N = 0,F = 1
N = 0,F = 0
N = 2,J = 3/2,F=1
N = 2,J = 3/2,F=2
LaserC0-F1
LaserC0-F0
Laser C2
X2 v = 1
X2 v = 2
N = 0
N = 0
N = 2
N = 2
Laser R0-1
Laser R2-1
Laser R0-2
Laser R2-2
Laser transition
Spontaneous emission
1.4 x 10⁷ /s
2.4 x 10⁵ /s
2.2 x 10³ /s
1.4 x 10⁷ /s
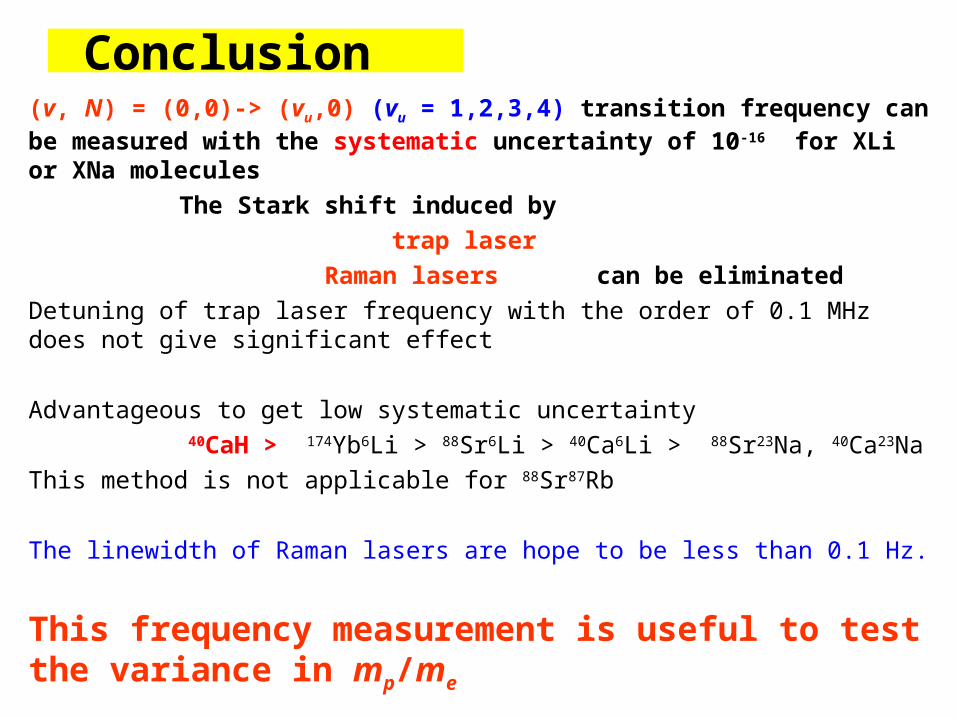
Conclusion (v, N) = (0,0)-> (vu,0) (vu = 1,2,3,4) transition frequency can be measured with the systematic uncertainty of 10-16 for XLi or XNa molecules
The Stark shift induced by
trap laser
Raman lasers can be eliminated
Detuning of trap laser frequency with the order of 0.1 MHz does not give significant effect
Advantageous to get low systematic uncertainty
40CaH > 174Yb6Li > 88Sr6Li > 40Ca6Li > 88Sr23Na, 40Ca23Na
This method is not applicable for 88Sr87Rb
The linewidth of Raman lasers are hope to be less than 0.1 Hz.
This frequency measurement is useful to test the variance in mp/me

Thank you for attention!
Danke fuer Aufmerksamkeit!
Merci pour attention!
Tante Grazie!