PRE MTAC v6 - USPS | PostalPro Webinar... · 4 ® Q2 TD Total Pieces Measured Processing On-Time...
55
1 ® PRE-MTAC Enterprise Analytics and Data Usage
Transcript of PRE MTAC v6 - USPS | PostalPro Webinar... · 4 ® Q2 TD Total Pieces Measured Processing On-Time...

1
®
PRE-MTACEnterprise Analytics and Data Usage

2
®
MTAC Visibility and Service Performance
First-Class MailLetters

3
®Commercial First-Class Mail®
Performance by Quarter
Commercial First-Class Mail® FY13 thru FY17 PerformanceBy Quarter
Note: Preliminary FY17 Q2 through 03/24/17
96.395.292.6
70
75
80
85
90
95
100
Q1 Q2 Q3 Q4 Q1 Q2 Q3 Q4 Q1 Q2 Q3 Q4 Q1 Q2 Q3 Q4 Q1 Q2
FY13 FY14 FY15 FY16 FY17
Perc
ent O
n Ti
me
Postal Quarter
Overnight Two-Day Three-to-Five-Day

4
®
Q2 TD Total Pieces Measured
Processing On-Time
Last Mile Impact
Overall Score
Target Score
SPLY Pieces Measured
Volume Change
SPLY OverallQTD Score
SPLY Change
Overnight 651,441,814 98.43% -1.99% 96.44% 96.80% 653,911,464 -0.38% 95.88% 0.56%
2-Day 1,182,126,963 97.15% -1.77% 95.38% 96.50% 1,277,667,207 -7.48% 94.25% 1.13%
3-to-5-Day 4,100,296,850 94.42% -1.66% 92.76% 95.25% 4,091,065,656 0.23% 89.67% 3.09%
3-Day 4,077,798,356 94.41% -1.67% 92.75% 95.25% 4,068,708,249 0.22% 89.66% 3.09%
4-Day 21,585,870 96.52% -1.37% 95.15% 95.25% 21,358,201 1.07% 93.98% 1.17%
5-Day 912,624 84.17% -1.62% 82.55% 95.25% 999,206 -8.67% 47.84% 34.71%
Total 5,933,865,627 93.68% 96.00% 6,022,644,327 -1.47% 91.32% 2.36%
First-Class Mail® (Letters)Score Trend
98.52% 98.91% 98.87% 98.47% 97.30%98.26%
97.09% 98.48% 97.99%97.46%
94.35% 96.68%94.87% 97.39% 95.62%
95.53% 94.09% 93.61%
0
50
100
150
200
250
300
350
400
60%
65%
70%
75%
80%
85%
90%
95%
100%
2/11/17 2/18/17 2/25/17 3/4/17 3/11/17 3/18/17
Volume in M
illionsS
core
Prio
r to
Last
Mile
SPLY Volume Overnight - Volume 2-Day - Volume 3-To-5-Day - VolumeOvernight 2-Day 3-To-5-Day

5
®
Last Mile Impact Trend
First-Class Mail® (Letters) Last Mile Impact Trend
0.0%
0.5%
1.0%
1.5%
2.0%
2.5%
3.0%
Last
Mile
Impa
ct
Postal Week
FCM Overnight FCM 2-Day FCM 3-To-5-Day

6
®
Note: Service performance results before Last Mile.
First-Class Mail® (Letters) Service Variance
All Q2TD FCM Letters scores would be above 98.50% (prior to last mile), if pieces that failed by 1 day passed
98.43%97.15%
94.42%
99.61% 99.15% 98.50%99.81% 99.66% 99.44%99.89% 99.83% 99.74%
60%
65%
70%
75%
80%
85%
90%
95%
100%
Overnight 2-Day 3-To-5-DayQTD Score If Service Variance +1 If Service Variance +2 If Service Variance +3

7
®First-Class Mail Letters
Full Service Volume In Measurement Trend
68.33% 68.98%66.13%
69.50% 69.28% 68.75% 69.50% 68.82%70.93% 72.15% 71.29%
67.92% 69.74%
-
500
1,000
1,500
2,000
2,500
3,000
0%
10%
20%
30%
40%
50%
60%
70%
80%
90%
100%
Feb 2016 Mar2016
Apr 2016 May2016
Jun 2016 Jul 2016 Aug2016
Sep 2016Oct 2016 Nov2016
Dec2016
Jan 2017Feb 2017
Volu
me
in M
illio
ns
% In
Mea
sure
men
t
Measured Volume % In Measurement

8
®
In Measurement,
70%
Long Haul
No Start-the-Clock
Incorrect Entry Facility
Other
Attributed to Mailers 17.23%Attributed to USPS / Unknown 82.77%
Exclusion Reason % of Excluded
% of Total*
Long Haul 41.65% 14.62%
No Start-the-Clock 31.78% 11.16%
Incorrect Entry Facility 6.97% 2.45%
Other 19.60% 6.87%
* Mail can be excluded due to more than one reason. As a result, the sum of individual exclusion percentages (35%) is greater than the overall percentage of mail not in measurement (30%)
In February 2017, 70% of Full-Service First-Class Letters were in measurement
First-Class Mail® (Letters)Reasons why mail is not in measurement

9
®
Approach:
Focusing on top 3 exclusion reasons for each mail class/shape
Cross-Functional team formed
Team includes stakeholders from Operations, MEPT, EA
Top opportunity pairs identified (postal sites and mailers)
Team meets and reviews performance of selected pairs weekly
Team is actively engaged in working with mailers and postal sites to identify root causes and implement sustained resolutions for excluded mail
Confirmed root causes and resolutions will be communicated for national implementation
Increase Mail In Measurement
10
®
MTAC Visibility and Service Performance
First-Class MailFlats

11
®
Q2 TD Total Pieces Measured
Processing On-Time
Last Mile Impact
Overall Score
Target Score
SPLY Pieces Measured
Volume Change
SPLY OverallQTD Score
SPLY Change
Overnight 4,810,221 91.54% -6.72% 84.82% 96.80% 4,279,330 12.41% 83.06% 1.76%
2-Day 14,526,729 91.51% -7.67% 83.84% 96.50% 14,525,549 0.01% 81.44% 2.40%
3-to-5-Day 49,779,700 86.76% -7.16% 79.60% 95.25% 59,434,472 -16.24% 76.97% 2.63%
3-Day 49,552,627 86.73% -7.16% 79.56% 95.25% 59,201,185 -16.30% 76.94% 2.62%
4-Day 221,403 93.20% -6.47% 86.73% 95.25% 227,784 -2.80% 85.39% 1.35%
5-Day 5,670 93.00% -6.17% 86.82% 95.25% 5,503 3.03% 84.70% 2.12%
Total 69,116,650 80.85% 96.00% 78,239,351 -11.66% 78.14% 2.71%
First-Class Mail® (Flats)Score Trend
92.43% 94.44% 93.06%
92.08%90.89% 92.35%
91.68%
94.50%
92.90%92.87%
86.35% 91.73%
88.04%
92.23%
87.60% 87.88%85.42% 83.71%
0
1
2
3
4
5
6
60%
65%
70%
75%
80%
85%
90%
95%
100%
2/11/17 2/18/17 2/25/17 3/4/17 3/11/17 3/18/17
Volume in M
illionsS
core
Prio
r to
Last
Mile
SPLY Volume Overnight - Volume 2-Day - Volume 3-To-5-Day - VolumeOvernight 2-Day 3-To-5-Day

12
®
Last Mile Impact Trend
First-Class Mail® (Flats) Last Mile Impact Trend
0.0%
1.0%
2.0%
3.0%
4.0%
5.0%
6.0%
7.0%
8.0%
9.0%
10.0%
9/30/14 12/31/14 3/31/15 6/30/15 9/30/15 12/31/15 3/31/16 6/30/16 9/30/16 12/31/16
Last
Mile
Impa
ct
Postal Week
FCM Overnight FCM 2-Day FCM 3-To-5-Day

13
®
Note: Service performance results before Last Mile.
First-Class Mail® (Flats) Service Variance
All Q2TD FCM Flats scores would be above 94.85% (prior to last mile), if pieces that failed by 1 day passed
91.54% 91.51%86.76%
97.67% 97.00% 94.85%98.81% 98.61% 97.59%99.28% 99.22% 98.64%
20%
30%
40%
50%
60%
70%
80%
90%
100%
Overnight 2-Day 3-To-5-DayQTD Score If Service Variance +1 If Service Variance +2 If Service Variance +3

14
®First-Class Mail Flats
Full Service Volume In Measurement Trend
72.86%70.70% 68.85%
72.45% 73.59% 72.99%75.92%
72.63%68.25% 68.76% 68.30% 66.78% 66.74%
0
5
10
15
20
25
30
35
0%
10%
20%
30%
40%
50%
60%
70%
80%
90%
100%
Feb 2016 Mar2016
Apr 2016 May2016
Jun 2016 Jul 2016 Aug 2016Sep 2016 Oct 2016 Nov2016
Dec 2016 Jan 2017 Feb 2017
Volu
me
in M
illio
ns
% In
Mea
sure
men
t
Measured Volume % In Measurement

15
®
In Measurement,
67%
No Start-the-Clock
Long Haul
Non-Unique IMb
Other
Attributed to Mailers 9.31%Attributed to USPS / Unknown 90.69%
Exclusion Reason % of Excluded
% of Total*
No Start-the-Clock 30.64% 11.84%
Long Haul 30.45% 11.77%
Non-Unique IMb 3.29% 1.27%
Other 35.62% 13.76%
* Mail can be excluded due to more than one reason. As a result, the sum of individual exclusion percentages (39%) is greater than the overall percentage of mail not in measurement (33%)
In February 2017, 67% of Full-Service First-Class Flats were in measurement
First-Class Mail® (Flats)Reasons why mail is not in measurement

16
®
Approach:
Focusing on top 3 exclusion reasons for each mail class/shape
Cross-Functional team formed
Team includes stakeholders from Operations, MEPT, EA
Top opportunity pairs identified (postal sites and mailers)
Team meets and reviews performance of selected pairs weekly
Team is actively engaged in working with mailers and postal sites to identify root causes and implement sustained resolutions for excluded mail
Confirmed root causes and resolutions will be communicated for national implementation
Increase Mail In Measurement

17
®
MTAC Visibility and Service Performance
PeriodicalsFlats

18
®
88.389.590.4
70
75
80
85
90
95
100
Q1 Q2 Q3 Q4 Q1 Q2 Q3 Q4 Q1 Q2 Q3 Q4 Q1 Q2 Q3 Q4 Q1 Q2
FY13 FY14 FY15 FY16 FY17
Perc
ent O
n Ti
me
Postal Quarter
DSCF DADC DNDC
Destination Entry IMB® Periodicals FY13 thru FY17 PerformanceBy Quarter
IMB® Periodicals Performance by Quarter
Note: Preliminary FY17 Q2 through 03/24/17.

19
®
Q2 TD Total Pieces Measured
Processing On-Time
Last Mile Impact
Overall Score
Target Score
SPLY Pieces Measured
Volume Change
SPLY OverallQTD Score
SPLY Change
SCF Flats 520,477,643 93.63% -5.38% 88.25% 91.00% 504,985,167 3.07% 82.55% 5.70%
ADC Flats 11,796,916 94.16% -4.67% 89.49% 91.00% 14,193,309 -16.88% 84.26% 5.23%
E2E Flats 100,591,284 79.58% -3.43% 76.15% 91.00% 111,942,630 -10.14% 64.52% 11.63%
2-Day N/A N/A N/A N/A N/A N/A N/A N/A N/A
3-Day 37,133,660 91.29% -3.85% 87.44% 91.00% 37,528,600 -1.05% 83.35% 4.09%
4-Day 39,673,986 76.06% -3.24% 72.82% 91.00% 44,584,406 -11.01% 57.42% 15.41%
5-Day 2,051,216 67.43% -2.16% 65.27% 91.00% 2,620,373 -21.72% 55.03% 10.24%
6+ Day 21,732,422 67.13% -3.17% 63.95% 91.00% 27,209,251 -20.13% 51.10% 12.85%
Total 632,865,843 85.34% 91.00% 631,121,106 0.28% 78.53% 6.81%
Periodicals Score Trend
94.48%95.41%
93.33%93.72% 91.68% 93.47%93.92%
97.08%
92.95%
94.66%92.70% 93.51%
76.61%
87.80% 87.10%81.56%
78.11%72.48%
0
10
20
30
40
50
60
20%
30%
40%
50%
60%
70%
80%
90%
100%
2/11/17 2/18/17 2/25/17 3/4/17 3/11/17 3/18/17
Volume in M
illionsS
core
Prio
r to
Last
Mile
SPLY Volume DSCF - Volume DADC - Volume End-to-End - VolumeDSCF DADC End-to-End
20
®
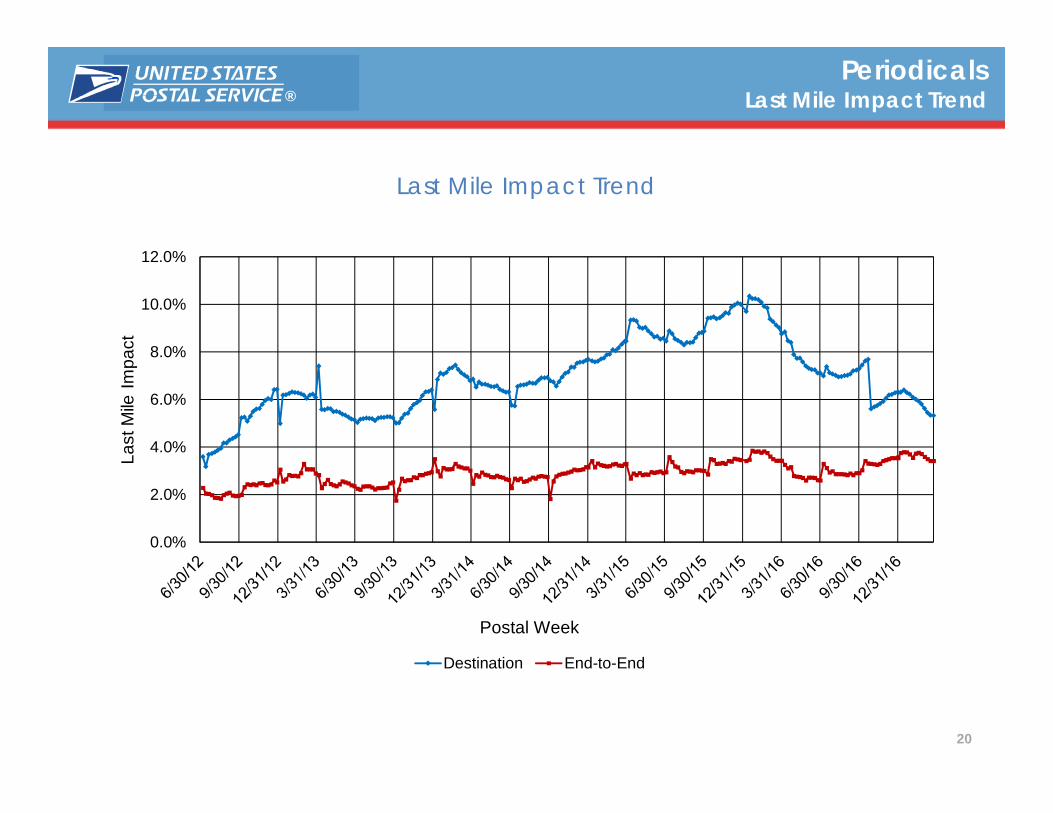
Last Mile Impact Trend
PeriodicalsLast Mile Impact Trend
0.0%
2.0%
4.0%
6.0%
8.0%
10.0%
12.0%
Last
Mile
Impa
ct
Postal Week
Destination End-to-End

21
®
91.7%93.6%
91.0%94.2%
68.0%
79.6%
97.3% 98.3%96.5% 98.0%
77.5%
87.1%
98.5% 99.2% 97.9% 98.9%
84.3%
91.6%
99.0% 99.5% 98.5% 99.2%
89.1%
94.3%
20%
30%
40%
50%
60%
70%
80%
90%
100%
SPLY Q2 TD SPLY Q2 TD SPLY Q2 TD
DSCF DADC End-to-EndQTD Score If Service Variance +1 If Service Variance +2 If Service Variance +3
Note: Service performance results before Last Mile.
PeriodicalsService Variance
Q2TD DSCF and DADC Periodicals scores would be above 98.01% (prior to last mile), if pieces that failed by 1 day passed

22
®Periodicals Flats
Full Service Volume In Measurement Trend
61.85%66.20% 64.52%
66.92% 67.36%65.24% 65.92% 67.74%
61.07% 61.97%
67.90%63.83%
66.05%
0
50
100
150
200
250
300
0%
10%
20%
30%
40%
50%
60%
70%
80%
90%
100%
Feb 2016 Mar 2016 Apr 2016 May2016
Jun 2016 Jul 2016 Aug 2016 Sep 2016 Oct 2016 Nov 2016 Dec 2016 Jan 2017 Feb 2017
Volu
me
in M
illio
ns
% In
Mea
sure
men
t
Measured Volume % In Measurement

23
®
In Measurement,
66%
No Start-the-Clock
Long Haul
Inaccurate Scheduled Ship
Date
Other
Attributed to Mailers 18.76%Attributed to USPS / Unknown 81.24%
Exclusion Reason % of Excluded
% of Total*
No Start-the-Clock 14.86% 5.75%
Long Haul 8.39% 3.25%
Inaccurate Scheduled Ship Date 3.69% 1.43%
Other 73.06% 28.27%
* Mail can be excluded due to more than one reason. As a result, the sum of individual exclusion percentages (39%) is greater than the overall percentage of mail not in measurement (34%)
In February 2017, 66% of Full-Service Periodicals Flats were in measurement
Periodicals (Flats)Reasons why mail is not in measurement

24
®
Approach:
Focusing on top 3 exclusion reasons for each mail class/shape
Cross-Functional team formed
Team includes stakeholders from Operations, MEPT, EA
Top opportunity pairs identified (postal sites and mailers)
Team meets and reviews performance of selected pairs weekly
Team is actively engaged in working with mailers and postal sites to identify root causes and implement sustained resolutions for excluded mail
Confirmed root causes and resolutions will be communicated for national implementation
Increase Mail In Measurement

25
®
MTAC Visibility and Service Performance
USPS Marketing Mail™

26
®
USPS Marketing Mail™ FY13 thru FY17 PerformanceBy Quarter
USPS Marketing Mail™Performance by Quarter
95.889.4
70.0
57.7
0
10
20
30
40
50
60
70
80
90
100
Q1 Q2 Q3 Q4 Q1 Q2 Q3 Q4 Q1 Q2 Q3 Q4 Q1 Q2 Q3 Q4 Q1 Q2
FY13 FY14 FY15 FY16 FY17
Perc
ent O
n Ti
me
Postal Quarter
Dest Letters Dest Flats Orig Letters Orig Flats
Note: Preliminary FY17 Q2 through 03/24/17.
Note: Prior to FY17 Q2, USPS Marketing Mail™ was referred to as Standard Mail®.

27
®
MTAC Visibility and Service Performance
USPS Marketing Mail™Letters

28
®
USPS Marketing Mail™ FY13 to FY17 PerformanceBy Quarter
USPS Marketing Mail™ (Letters)Performance by Quarter
95.8
70.0
0
10
20
30
40
50
60
70
80
90
100
Q1 Q2 Q3 Q4 Q1 Q2 Q3 Q4 Q1 Q2 Q3 Q4 Q1 Q2 Q3 Q4 Q1 Q2
FY13 FY14 FY15 FY16 FY17
Perc
ent O
n Ti
me
Postal Quarter
Dest Letters Orig Letters
Note: Preliminary FY17 Q2 through 03/24/17.
Note: Prior to FY17 Q2, USPS Marketing Mail™ was referred to as Standard Mail®.

29
®
Q2 TD Total Pieces Measured
Processing On-Time
Last Mile Impact
Overall Score
Target Score
SPLY Pieces Measured
Volume Change
SPLY OverallQTD Score
SPLY Change
SCF Letters 6,894,326,754 97.05% -1.23% 95.82% 91.00% 6,920,708,204 -0.38% 93.37% 2.45%
NDC Letters 914,164,912 96.30% -0.91% 95.39% 91.00% 950,468,295 -3.82% 91.98% 3.41%
E2E Letters 902,498,686 70.89% -0.88% 70.01% 91.00% 874,497,847 3.20% 63.13% 6.88%
3-Day 195,338,781 89.73% -1.00% 88.72% 91.00% 215,983,973 -9.56% 84.99% 3.73%
4-Day 6,417,870 90.43% -0.72% 89.71% 91.00% 6,503,628 -1.32% 84.30% 5.41%
5-Day 123,262,425 85.67% -0.77% 84.90% 91.00% 118,130,218 4.34% 80.54% 4.35%
6-10 Day 555,375,225 60.50% -0.85% 59.66% 91.00% 509,729,512 8.95% 49.46% 10.19%
11+ Day 22,104,385 77.19% -1.09% 76.10% 91.00% 24,150,516 -8.47% 65.13% 10.97%
Total 8,710,990,352 92.44% 91.00% 8,745,674,346 -0.40% 88.71% 3.73%
USPS Marketing Mail™ (Letters)Score Trend
97.46% 98.57% 98.20% 97.22%
95.25%
97.37%
97.39% 97.38% 97.52% 96.45%
95.81%
96.41%
72.21%79.05% 78.57%
72.05% 70.45% 71.17%
0
100
200
300
400
500
600
700
20%
30%
40%
50%
60%
70%
80%
90%
100%
2/11/17 2/18/17 2/25/17 3/4/17 3/11/17 3/18/17
Volume in M
illionsS
core
Prio
r to
Last
Mile
SPLY Volume DSCF - Volume DNDC - Volume End-to-End - VolumeDSCF DNDC End-to-End

30
®
Last Mile Impact Trend
USPS Marketing Mail™ (Letters)Last Mile Impact Trend
Note: Prior to FY17 Q2, USPS Marketing Mail™ was referred to as Standard Mail®.
0.0%
0.2%
0.4%
0.6%
0.8%
1.0%
1.2%
1.4%
1.6%
1.8%
2.0%
Last
Mile
Impa
ct
Postal WeekDestination End-to-End

31
®USPS Marketing Mail™ (Letters)
Service Variance
Q2TD DSCF and DNDC Marketing Letters scores would be above 98.70% (prior to last mile), if pieces that failed by 1 day passed
Note: Service performance results including Last Mile.
Note: Prior to FY17 Q2, USPS Marketing Mail™ was referred to as Standard Mail®.
97.05% 96.30%
70.89%
99.26% 98.70%
83.33%
99.63% 99.27%
89.96%
99.76% 99.54%93.79%
20%
30%
40%
50%
60%
70%
80%
90%
100%
DSCF DNDC End-to-EndQTD Score If Service Variance +1 If Service Variance +2 If Service Variance +3

32
®USPS Marketing Mail™ (Letters)
Full Service Volume In Measurement Trend
77.15% 78.10% 76.81% 77.81% 77.68% 75.69% 76.27% 76.86%74.71% 76.32%
80.06% 79.33% 80.90%
0
500
1,000
1,500
2,000
2,500
3,000
3,500
4,000
0%
10%
20%
30%
40%
50%
60%
70%
80%
90%
100%
Feb2016
Mar2016
Apr 2016 May2016
Jun 2016 Jul 2016 Aug2016
Sep2016
Oct 2016 Nov2016
Dec2016
Jan 2017 Feb2017
Volu
me
in M
illio
ns
% In
Mea
sure
men
t
Measured Volume % In Measurement

33
®
In Measurement,
81%
No Start-the-Clock
Invalid Entry Point for Entry Discount
(FAST MDF)
Non-Unique IMb
Other
Attributed to Mailers 25.69%Attributed to USPS / Unknown 74.31%
Exclusion Reason % of Excluded
% of Total*
No Start-the-Clock 48.87% 10.32%
Invalid Entry Point for Entry Discount (FAST MDF) 11.35% 2.40%
Non-Unique IMb 3.06% 0.65%
Other 36.72% 7.77%
* Mail can be excluded due to more than one reason. As a result, the sum of individual exclusion percentages (21%) is greater than the overall percentage of mail not in measurement (19%)
In February 2017, 81% of Full-Service USPS Marketing Mail Letters were in measurement
USPS Marketing Mail™ (Letters)Reasons why mail is not in measurement
Note: Prior to FY17 Q2, USPS Marketing Mail™ was referred to as Standard Mail®.

34
®
Approach:
Focusing on top 3 exclusion reasons for each mail class/shape
Cross-Functional team formed
Team includes stakeholders from Operations, MEPT, EA
Top opportunity pairs identified (postal sites and mailers)
Team meets and reviews performance of selected pairs weekly
Team is actively engaged in working with mailers and postal sites to identify root causes and implement sustained resolutions for excluded mail
Confirmed root causes and resolutions will be communicated for national implementation
Increase Mail In Measurement

35
®
MTAC Visibility and Service Performance
USPS Marketing Mail™Flats

36
®
USPS Marketing Mail™ FY13 to FY17 PerformanceBy Quarter
USPS Marketing Mail™ (Flats)Performance by Quarter
89.4
57.7
0
10
20
30
40
50
60
70
80
90
100
Q1 Q2 Q3 Q4 Q1 Q2 Q3 Q4 Q1 Q2 Q3 Q4 Q1 Q2 Q3 Q4 Q1 Q2
FY13 FY14 FY15 FY16 FY17
Perc
ent O
n Ti
me
Postal Quarter
Dest Flats Orig Flats
Note: Prior to FY17 Q2, USPS Marketing Mail™ was referred to as Standard Mail®.
Note: Preliminary FY17 Q2 through 03/24/17.

37
®
Q2 TD Total Pieces Measured
Processing On-Time
Last Mile Impact
Overall Score
Target Score
SPLY Pieces Measured
Volume Change
SPLY OverallQTD Score
SPLY Change
SCF Flats 1,557,102,053 96.17% -5.40% 90.77% 91.00% 1,621,745,355 -3.99% 85.19% 5.58%
NDC Flats 209,470,309 95.35% -3.87% 91.48% 91.00% 240,412,412 -12.87% 88.69% 2.79%
E2E Flats 133,287,463 61.44% -3.72% 57.72% 91.00% 125,118,304 6.53% 53.70% 4.02%
3-Day 18,094,225 78.17% -4.59% 73.58% 91.00% 20,126,273 -10.10% 72.65% 0.93%
4-Day 580,039 81.82% -3.93% 77.89% 91.00% 807,048 -28.13% 77.57% 0.32%
5-Day 14,869,671 72.84% -4.11% 68.73% 91.00% 13,903,761 6.95% 66.57% 2.16%
6-10 Day 94,819,829 54.98% -3.31% 51.67% 91.00% 86,647,778 9.43% 46.37% 5.30%
11+ Day 4,923,699 87.45% -7.28% 80.18% 91.00% 3,633,444 35.51% 68.95% 11.22%
Total 1,899,859,825 87.44% 91.00% 1,987,276,071 -4.40% 82.28% 5.16%
USPS Marketing Mail™ (Flats)Score Trend
97.53%97.22% 96.47%
95.46% 93.12% 96.08%97.11%
97.72% 97.23%
95.32%92.78%
95.42%
65.11%72.03%
69.75%63.11%
54.28% 55.68%
020406080100120140160180200
20%
30%
40%
50%
60%
70%
80%
90%
100%
2/11/17 2/18/17 2/25/17 3/4/17 3/11/17 3/18/17
Volume in M
illionsS
core
Prio
r to
Last
Mile
SPLY Volume DSCF - Volume DNDC - Volume End-to-End - VolumeDSCF DNDC End-to-End

38
®
Last Mile Impact Trend
USPS Marketing Mail™ (Flats)Last Mile Impact Trend
Note: Prior to FY17 Q2, USPS Marketing Mail™ was referred to as Standard Mail®.
0.0%
2.0%
4.0%
6.0%
8.0%
10.0%
12.0%
14.0%
16.0%
Last
Mile
Impa
ct
Postal WeekDestination End-to-End
39
®
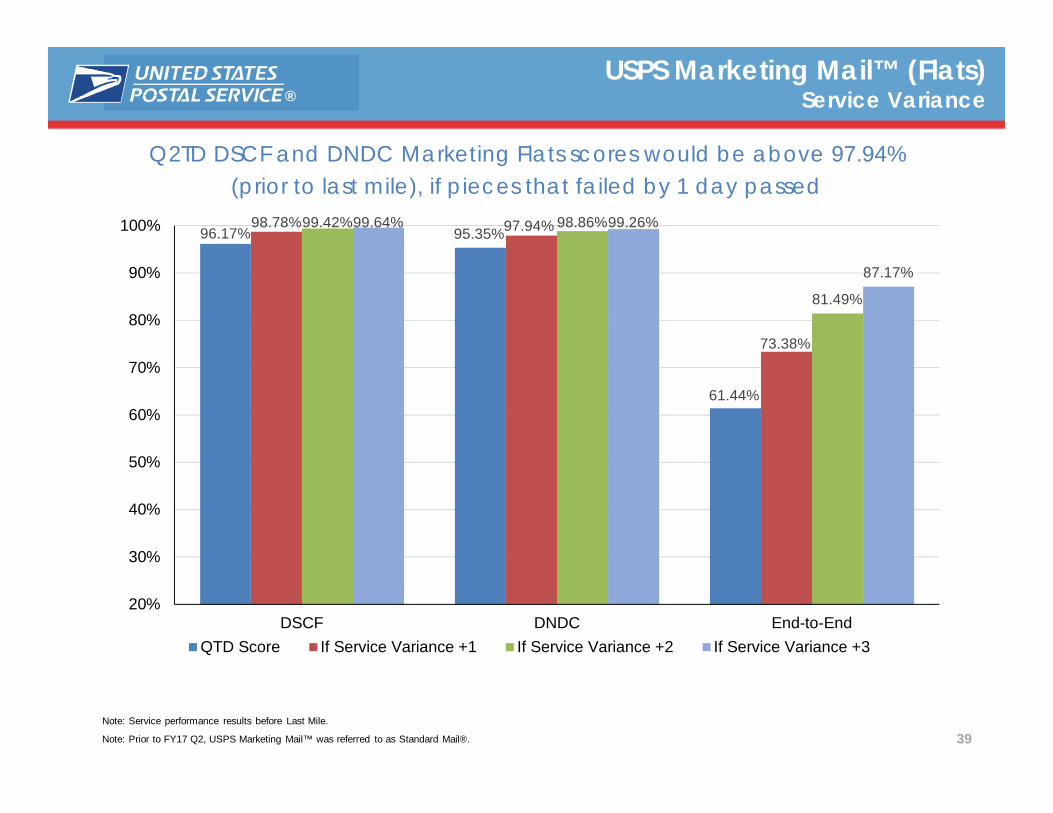
Note: Service performance results before Last Mile.
Note: Prior to FY17 Q2, USPS Marketing Mail™ was referred to as Standard Mail®.
USPS Marketing Mail™ (Flats)Service Variance
Q2TD DSCF and DNDC Marketing Flats scores would be above 97.94% (prior to last mile), if pieces that failed by 1 day passed
96.17% 95.35%
61.44%
98.78% 97.94%
73.38%
99.42% 98.86%
81.49%
99.64% 99.26%
87.17%
20%
30%
40%
50%
60%
70%
80%
90%
100%
DSCF DNDC End-to-EndQTD Score If Service Variance +1 If Service Variance +2 If Service Variance +3

40
®USPS Marketing Mail™ (Flats)
Full Service Volume In Measurement Trend
72.41% 71.17%73.77%
70.44% 71.93% 72.45%70.10% 69.42%
63.26%
70.64%73.94% 74.03% 75.92%
0
200
400
600
800
1,000
1,200
0%
10%
20%
30%
40%
50%
60%
70%
80%
90%
100%
Feb 2016 Mar 2016 Apr 2016 May2016
Jun 2016 Jul 2016 Aug 2016 Sep 2016 Oct 2016 Nov 2016 Dec 2016 Jan 2017 Feb 2017
Volu
me
in M
illio
ns
% In
Mea
sure
men
t
Measured Volume % In Measurement

41
®
In Measurement,
76%
Invalid Entry Point for Entry Discount
(FAST MDF)
No Start-the-Clock
Invalid Container Level for Entry
Other
Attributed to Mailers 33.64%Attributed to USPS / Unknown 66.36%
Exclusion Reason % of Excluded
% of Total*
Invalid Entry Point for Entry Discount (FAST MDF) 12.90% 3.62%
No Start-the-Clock 10.10% 2.83%
Invalid Container Level for Entry 8.45% 2.37%
Other 68.55% 19.20%
* Mail can be excluded due to more than one reason. As a result, the sum of individual exclusion percentages (28%) is greater than the overall percentage of mail not in measurement (24%)
In February 2017, 76% of Full-Service USPS Marketing Mail Flats were in measurement
USPS Marketing Mail™ (Flats)Reasons why mail is not in measurement
Note: Prior to FY17 Q2, USPS Marketing Mail™ was referred to as Standard Mail®.

42
®
Approach:
Focusing on top 3 exclusion reasons for each mail class/shape
Cross-Functional team formed
Team includes stakeholders from Operations, MEPT, EA
Top opportunity pairs identified (postal sites and mailers)
Team meets and reviews performance of selected pairs weekly
Team is actively engaged in working with mailers and postal sites to identify root causes and implement sustained resolutions for excluded mail
Confirmed root causes and resolutions will be communicated for national implementation
Increase Mail In Measurement

43
®
IV Status Update

44
®
Update on IV Pilot
IV Pilot Feedback and Issues Log
Updated IV Schedule
IV Industry Training Approach
Update on Policy for Non-Full Service Pieces from a Full Service Mailer
Update on IMb Tracing Stability
Mail Tracking and Reporting Update

Bundle Visibility

46
® How Full-Service Bundle Visibility Works
P&DC
Data
Entry/ContainerUnload Scan(SV/IMDAS)
APPS/APBS
Bundle toContainerSV Assign/Close Scans for Nesting
ContainerLoad Scan(SV)
Arrivedat Unit(IMDAS)
ContainerDistributed(IMDAS)
Out forDelivery
CurtailedInventory(IMDAS)
Delivery Unit
Delivered(Logical based on GPS)
Mailer VisibilityIVeDoc
IDS Piece DataBin and Time-Stamp

47
®FY17 Q2 Bundle Visibility
Metrics by Mail Preparation
• Data Analysis on visibility by entry discount
Insert Data Analysis

48
®
Enterprise Analytics Visualizations

49
®
FSS Leakage
Bundle Breakage
Predictive Workload and Inventory
Last Mile Diagnostics
Handling Unit Diagnostics

50
®
IMB planning toolIV data

51
®
The IMb Planning tool is an online tool mailers can access from the USPS web site (https://ribbs.usps.gov/imb_planning_tool) that provides data to help mailers see how mail is flowing through postal facilities and make informed decisions about their mail entry and post-mailing activities
It assists mailers in timing of drop shipments , helps manage customer expectations and facilitates collaboration with industry though transparency
IMb planning tool will source near real-time data from the Informed Visibility (IV) and will be externally available on 4/28/2017
IMb Planning tool
IMb planning tool- Informed Visibility data

52
®
IMpb Compliance

IMpb Compliance Federal Register Notice is still under Postal Service internal review
Draft Proposed Rule available on PostalPro by 4/28
Published in Federal Register by 5/14
IMpb and Address Quality
Operational use of Shipping Partner Files
D3 Visualization for Industry use
53
IMpb Compliance

54
®
Additional Industry Topics

55
®
Discussion on using Data and Analytics to identify and reduce mis-delivery
Deep Dive on No Piece Scan by Mail Flow
Operation Code for Visibility Events related to pieces worked in Manual Operations
Volume and Percentage of Mail eligible for Measurement by Class/Shape
Pallet Scan Percentages