
Effective Toastmaster club visits: Pre-visit Data Investigation

Imagine the result
New York State Department of Environmental Conservation
Pre-Design Investigation Report
Crown Dykman (NYSDEC Site no. 130054) City of Glen Cove, Nassau County, New York
October 2014
Pre-Design Investigation Report
Crown Dykman (Site #130054) City of Glen Cove, Nassau County, New York
Prepared for:
New York State Department of
Environmental Conservation
Prepared by:
Malcolm Pirnie, Inc.
855 Route 146
Suite 210
Clifton Park
New York 12065
Tel 518 250 7300
Fax 518 250 7301
Our Ref.:
00266417.0000
Date:
October 15, 2014

pilot summary report final 7-2018.docx i
Table of Contents
1. Introduction 1-1
2. Site Background and Investigation Objectives 2-1
2.1 Site Background 2-1
2.2 Investigation Objectives 2-2
2.3 Report Organization 2-3
3. Summary of Site Conditions 3-1
3.1 Surface Topography and Surface Water Features 3-1
3.2 Regional and Site Geology 3-2
3.3 Hydrogeology 3-3
3.3.1 Hydraulic Properties of Water Bearing Units 3-3
3.3.2 Groundwater Flow Direction 3-3
3.4 Distribution of Groundwater Contaminants 3-3
4. Chemical Oxidation Pilot Study 4-1
4.1 Pilot Study Objectives 4-1
4.2 Summary of Pre-Pilot Test Field Activities 4-2
4.2.1 Existing Monitoring Well Replacements 4-2
4.2.2 Additional Monitoring Well Installations 4-2
4.3 Pre-Pilot (Baseline) Groundwater Sampling and Analysis 4-4
4.4 Pilot Test Implementation 4-5
4.4.1 Injection Monitoring 4-5
4.4.2 Post-Injection Monitoring 4-6
4.5 Pilot Study Results 4-7
4.5.1 Sodium Permanganate Injection 4-7
4.5.2 Post-injection Monitoring Results 4-8
4.5.2.1 Water Quality Parameters 4-9
4.5.2.2 Chlorinated VOCs 4-9
4.5.2.3 Other Constituents 4-11

pilot summary report final 7-2018.docx ii
Table of Contents
4.5.2.4 LNAPL Occurrence and Distribution 4-11
5. Supplemental Source Investigation 5-1
5.1 Building Interior Soil Boring and Monitoring Well Installations 5-1
5.2 Monitoring Well Assessment 5-2
5.3 Groundwater Sampling and Analysis 5-2
5.4 Analytical Sampling Results 5-3
5.4.1 Soil Sampling Results 5-3
5.4.2 Groundwater Sampling Results 5-4
6. Soil Vapor Extraction System Performance Review 6-1
6.1 SVE System Overview 6-1
6.2 SVE Performance Review 6-2
6.3 Indoor Air Quality Assessment 6-2
7. Summary and Conclusions 7-1
7.1 Pre-Design Chemical Oxidation Pilot Performance 7-1
7.2 Supplemental Investigation 7-2
7.3 LNAPL Distribution and Trends 7-3
7.4 SVE System 7-3
8. Recommendations 8-1
9. References 9-1
Tables
1. Hydraulic Testing Summary
2. Summary of New Well Construction
3. Injection Well Development
4. Summary of Baseline TOC and COD Data
5. Summary of Well DO and ORP Data

pilot summary report final 7-2018.docx iii
Table of Contents
6. Groundwater Analytical Data Summary
7. LNAPL Thickness Summary
8. Soil Analytical Data Summary
9. Monitoring Well Assessment Summary
10. Sub-slab and Indoor Air Analytical Summary
Figures
1. Site Location
2. Site Plan
3. Geologic Cross Section
4. Port Washington Clay Surface
5. Groundwater Potentiometric Surface (July 2014)
6. Summary of detected Compounds is Groundwater – Baseline Sampling
(August 2013)
7. CVOC Concentrations in Groundwater (Isocontours)
8. ISCO Pilot Study Area
9. Sodium Permanganate Pilot Injection System Schematic
10. Dissolved Oxygen and Oxidation-Reduction Potential Trends in Groundwater
(ISCO Monitoring Wells)
11. Summary of Detected CVOCs in Groundwater – Baseline and Post-Injection
Sampling Rounds
12. Chlorinated VOC Trends in Groundwater (ISCO Monitoring Wells)

pilot summary report final 7-2018.docx iv
Table of Contents
13. Summary of Detected Non-CVOC Compounds in Groundwater – Baseline and
Post-Injection Sampling Rounds
14. Summary of LNAPL Thickness from 2008 to 2014
15. Summary of Detected Compounds in Soil – July 2014
16. Supplemental Investigation Groundwater Analytical Summary – July 2014
17. SVE System Piping Schematic
18. Summary of Soil Vapor and Indoor Air Analytical Results (January 2008 and
November 2013)
Appendices
A. Boring Logs and Well Construction Details
B. Well Purge Logs and Field Data
C. Laboratory Analytical Reports
D. Injection Monitoring Data

g:\project\00266417.0000\file\summary report\pilot summary report final 7-2018.docx 1-1
Pre-Design Investigation Report
Crown Dykman (Site #130054) City of Glen Cove, New York
1. Introduction
This Pre-Design Investigation Report provides a summary of the field activities, and
subsequent analysis and evaluation, completed from August 2013 to December 2013,
and supplemental investigation work completed during the Summer of 2014 in support
of the scope of work under Task 3 and 5 of the Crown Dykman Remedial Design Work
Assignment (WA) Amendment (D-007618-22.1), at the former Crown Dykman Site
(Site), located at 66 Herb Hill Road in the City of Glen Cove, Nassau County, New York
(Figure 1).
The work included field and other support activities to complete a pre-design, in-situ
chemical oxidation injection test at the site in support of the preferred site remedy, and
a supplemental assessment of a potential volatile organic compound (VOC) source
area beneath the southwest corner of the site building. The work also included
completion of a performance review of the existing site soil vapor extraction system,
and indoor air quality assessment of the site building, as summarized below.

g:\project\00266417.0000\file\summary report\pilot summary report final 7-2018.docx 2-1
Pre-Design Investigation Report
Crown Dykman (Site #130054) City of Glen Cove, New York
2. Site Background and Investigation Objectives
2.1 Site Background
During the period 1987 to 2009, several investigations to determine the environmental
conditions at the one-acre Class 2 Inactive Hazardous Waste Site were performed by
the Nassau County Department of Health, the property owner, and the New York State
Department of Environmental Conservation (NYSDEC) (EEA, 1991; 1996; 1997a;
1997b; Weston, 1997; EEA, 1999; 2000; Walden, 2006; Malcolm Pirnie, 2006; 2009a;
2009b). These investigations identified the presence of soil and groundwater
contaminated with tetrachloroethylene (PCE) and associated degradation products,
1,1,1-trichloroethane (TCA), toluene and xylene, associated with historic activities at
the Site.
Underground storage tanks (USTs) formerly containing solvents and gasoline were
removed from the Site in the early 1990s. In 2005 an Interim Remedial Measure (IRM)
was undertaken to remove and dispose of approximately 2,200 tons of contaminated
soil from beneath the southern portion of the on-site building’s floor slab (Walden
Associates, 2006). Post-removal soil samples taken from the southwestern corner of
the excavation, near the building’s footing, indicated the presence of PCE at
concentrations of 290 parts per million (ppm) (Walden Associates, 2006).
Post-IRM investigations identified residual soil and groundwater contamination,
including a plume that extended off-site to the south and southwest. A soil vapor
extraction (SVE) sub-slab piping system was installed under the on-site building during
additional IRM work in 2005 (Walden Associates, 2006). Additional IRM work in 2009
included the installation and operation of an SVE system at the site, connected to the
previous sub-slab SVE piping (Malcolm Pirnie, 2009a) to mitigate potential soil vapor
intrusion issues associated with the remaining contamination.
In March 2010, the NYSDEC developed a Record of Decision (ROD) to address the
remediation of the remaining Site contamination. The ROD required in-situ chemical
oxidation (ISCO) of the groundwater plume area with the highest concentrations of
chlorinated volatile organic compounds (CVOCs), which are present in the
southwestern portion of the Site (Figure 2). To accomplish this objective, the ROD
includes a provision for “an in-situ chemical oxidation pilot test to determine the
necessary injection parameters” to be included in the Site’s remedial design. The ROD
also includes a provision for continued operation of the existing SVE system to mitigate
the potential for soil vapor intrusion within the Site building.

g:\project\00266417.0000\file\summary report\pilot summary report final 7-2018.docx 2-2
Pre-Design Investigation Report
Crown Dykman (Site #130054) City of Glen Cove, New York
In November 2010, the NYSDEC retained ARCADIS/Malcolm Pirnie, Inc. (Malcolm
Pirnie) to develop the design for ISCO of contamination in the plume area, as well as
the other remedial elements identified in the ROD. Malcolm Pirnie evaluated the
existing data obtained from various historical Site investigations (EEA, 1991; 1996;
1997a; 1997b; Weston, 1997; EEA, 1999; 2000; Walden, 2006; Malcolm Pirnie, 2006;
2009a; 2009b) then developed and implemented an initial ISCO pilot test study in
support of the final remedial design for the Crown Dykman Site (ARCADIS/Malcolm
Pirnie, 2012a; 2012b).
The initial 2012 Pilot Study included injection of sodium permanganate into the
subsurface at the Site using a proprietary injection technology developed by Badger
Technologies, Inc. (Badger), using an alternative slotted injection nozzle method
(ARCADIS/Malcolm Pirnie, 2012a; 2012b), and through injection into an existing
monitoring well at the Site. The Pilot Study concluded that the stratigraphy in the
vicinity of the area of greatest chlorinated VOC (CVOC) concentrations limited the
applicability of Badger injection technology at the Crown Dykman Site for full-scale
implementation. The alternate delivery methods evaluated during the Pilot Test (slotted
tip injection and well injection) were generally unsuccessful at introducing
permanganate to the subsurface. Therefore, evaluation of additional techniques for
ISCO implementation, including injection through purpose-built injection wells, was
recommended by the NYSDEC.
2.2 Investigation Objectives
The objectives off the pre-design investigation activities presented herein were to
support remedial design and implementation, as specified in the Crown Dykman ROD.
These activities included:
1. Implementation of an additional pilot program to evaluate the injection of
sodium permanganate into the subsurface via purpose-built injection wells in
support of final remedy design; and,
2. A review the performance of the existing soil vapor extraction system
(including a general system inspection, radius of influence testing of the sub-
slab system, checks of other system operational components, and additional
indoor air testing) in support of ROD requirements for soil vapor intrusion
mitigation.
In addition, recent groundwater monitoring results, including post-injection monitoring
from the 2012 ISCO Pilot and subsequent site monitoring, indicate that a residual

g:\project\00266417.0000\file\summary report\pilot summary report final 7-2018.docx 2-3
Pre-Design Investigation Report
Crown Dykman (Site #130054) City of Glen Cove, New York
source of CVOC contamination may remain under the foundation of the southwest
portion of the site building. As discussed below, elevated concentrations of CVOCs
remain present over time in monitoring wells adjacent to the southwestern corner of the
site building in the vicinity of, and hydraulically down-gradient from, the 2005 soil
removal IRM. Therefore, the NYSDEC recommended a supplemental investigation to
evaluate the nature of the residual source beneath the building.
2.3 Report Organization
The specific work assignment tasks and scope of work required to meet the objectives
of the investigation are presented in the Comprehensive Scope of Work provided in
Schedule 1 of WA D-007618-22.1, and are summarized below. The remainder of this
Report is organized as follows:
■ Section 3 presents a summary of the Site characteristics, including a
description of the Site geology, hydrology, and distribution of contaminants;
■ Section 4 presents a summary of the ISCO injection well pilot program,
including the work performed and results;
■ Section 5 presents the results of the supplemental source investigation within
the site building;
■ Section 6 summarizes the review of the Site SVE system;
■ Section 7 summarizes the report findings and conclusions;
■ Section 8 provides recommendations for additional work; and
■ Section 9 provides a list of the references cited in this report.

g:\project\00266417.0000\file\summary report\pilot summary report final 7-2018.docx 3-1
Pre-Design Investigation Report
Crown Dykman (Site #130054) City of Glen Cove, New York
3. Summary of Site Conditions
The Site (Figure 2) is an approximately one-acre commercial property occupied by a
former laundry and dry-cleaning facility, which is now used as an automotive repair
shop and commercial, water-based laundry. The building consists of a single-story
brick and block structure, which is constructed on a concrete slab, with no basement or
crawl-space present beneath the building. The Site is bordered on the south and west
by Parcels A and B (respectively) of the former Li Tungsten industrial facility, which are
now vacant properties under redevelopment. The site is bordered to the north and
east by a vacant lot that was previously occupied by the former Konica-Minolta
industrial facility, which is currently undergoing redevelopment. An access road to the
former Konica-Minolta facility, now owned by the City of Glen Cove, is present along
the western boundary of the Site between the Site and the Former Li Tungsten Parcel
B (Figure 2).
3.1 Surface Topography and Surface Water Features
The ground surface of the undeveloped portions of the Crown Dykman Site exhibit a
gradual slope from north to south, with a retaining wall along the southern portion of the
site where the ground surface drops off approximately three to four feet near Herb Hill
Road. The section of Herb Hill Road in the vicinity of the site occupies a low-lying area
that frequently floods after precipitation events.
A small wetland area is present at the southern end of the former Li Tungsten Parcel B,
and a flooded drainage ditch is present along the northern side of Herb Hill Road at the
southernmost edge of the Site. A small concrete structure is present at the eastern
extent of the ditch, from which water flows throughout most of the year (Figure 2). A
small depression where water flows from is also present in the Access Road just north
of MW-21S/D, which ground-penetrating radar data (used for clearing monitoring well
locations during this Study) suggests may be from a leaking water line buried beneath
the Access Road. During the initial ISCO Pilot Investigation (ARCADIS/Malcolm Pirnie,
2012b) in 2012, the water discharging from this depression in the access road was
sampled for VOC/SVOC analyses. The analytical results indicated the presence of
trichloroethylene (TCE), cis-1,2-dichloroethylene (DCE), and trans-1,2-DCE at
estimated values of 0.91, 0.91, and 0.41 ug/l, respectively (ARCADIS/Malcolm Pirnie,
2012b).

g:\project\00266417.0000\file\summary report\pilot summary report final 7-2018.docx 3-2
Pre-Design Investigation Report
Crown Dykman (Site #130054) City of Glen Cove, New York
3.2 Regional and Site Geology
Surficial geology in the vicinity of the Site consist of deposits associated with the
Harbor Hill ground moraine, which at the Site consist predominantly of zones of fine to
medium sand, medium to coarse sand, and silty sand with silt lenses (Figure 3). The
Harbor Hill ground moraine is typically five to 10 feet thick, but can be up to 40 feet
thick. Upper Pleistocene age deposits associated with the Ronkonkoma glaciation are
deposited beneath the Harbor Hill ground moraine deposits. The Ronkonkoma layer
consists of interlayered glacial till and outwash deposits, which are not observed at the
Site. The glacial sediments associated with both layers range in thickness from less
than 10 feet to over 200 feet in the northern part of Long Island (Kilburn and Krulikas,
1987).
At the Site, the saturated thickness of the moraine units generally decreases from north
to south, with the upper sand and silty sand units generally extending to a depth of
approximately 35 feet below ground surface (bgs) at the northern portion of the Site to
approximately 15 feet bgs south of Herb Hill Road. However, in the vicinity of
monitoring well cluster MW-1/1D (boring location SB-14), the saturated aquifer
thickness increases where the moraine deposits extend to approximately 43 feet bgs
(Figure 3) into an apparent trough in the underlying clay unit. The moraine units at the
site are generally heterogeneous, with numerous fluvial channels (coarse gravel and
sand) cutting through the medium to fine moraine sands. These gravel channels
represent preferential groundwater flow paths where saturated. One such gravel layer
is present along the western edge of the site building in the vicinity of MW-13, IW-1S,
MW-26, MW-27, and MW-28 (Figure 2), generally between 18 and 20 feet bgs. The
gravel channel present in this area consists of medium to coarse gravels in a coarse
sand matrix, contrasting significantly with surrounding material that consists primarily of
medium to fine sands and occasional silty sand zones.
Beneath the moraine deposits is an extensive confining unit (Port Washington clay)
comprised of clay, silt, and a few layers of sand that correlates to the Pleistocene and
Holocene epochs (Kilburn, 1972). Figure 4 depicts elevation of the top of the Port
Washington confining unit in the vicinity of the Site, based on site boring data from the
Pilot Study and past investigation data. As shown on Figure 4, boring data from wells
intersecting the Port Washington clay unit indicates the presence of a northeast to
southwest oriented depression (trough) in the clay underlying the southern portion of
the Site (see cross-section, Figure 3).

g:\project\00266417.0000\file\summary report\pilot summary report final 7-2018.docx 3-3
Pre-Design Investigation Report
Crown Dykman (Site #130054) City of Glen Cove, New York
Underlining the moraine sediments and Port Washington clay in the vicinity of the site
are unconsolidated deposits associated with the Raritan Formation. The lower unit of
the Raritan Formation is the Lloyd Sand Member, which is up to 125 feet thick in this
portion of Long Island. The Lloyd Sand lies above the bedrock, which is encountered
at depths of up to 400 to 500 feet below mean sea level (Smolensky et al., 1989).
3.3 Hydrogeology
3.3.1 Hydraulic Properties of Water Bearing Units
During 2008 slug tests were completed to evaluate the hydraulic conductivity (K) of the
fine sand and silty sand water-bearing units in the vicinity of the Site. These tests
utilized onsite wells MW-1, MW-1D, MW-2, MW-3, MW-4, MW-7, MW-10S and MW-
10D, and offsite wells GM-9, MW-9 and MP-20 (Malcolm Pirnie, 2008). The slug tests
included rising-head tests in wells screened across the water table, and both rising-
and falling-head slug tests in wells screened below the water table. As shown in Table
1, Hydraulic conductivity values resulting from slug test analysis ranged from an
average of 82 ft/day (2.89 x 10⁻² cm/sec) in GM-9, to 0.4 ft/day (1.46 x 10⁻⁴ cm/sec) in
MW-9.
3.3.2 Groundwater Flow Direction
Groundwater levels at the Site range from approximately five to 10 feet below grade in
the vicinity of the building and at the southern Site boundary. As shown by the
potentiometric groundwater contours presented on Figure 5, groundwater generally
flows upland areas to the north of the site to the south-southwest toward Glen Cove
Creek, at the southern edge of the former Li Tungsten Parcel A. The groundwater
gradient slightly decreases beneath the southwestern portion of the building and
steepens slightly between the building and Herb Hill Road. Heads in the monitoring
well clusters at the southern edge of the site (MW-10S/D, MW-23S/D, MW-25S/D, and
the MW-1/1D/1DD cluster) indicate a downward head gradient indicating downward
groundwater flow into the clay trough (Figure 3).
3.4 Distribution of Groundwater Contaminants
Based on groundwater analytical data from previous investigations at the Site (Malcolm
Pirnie, 2009a; ARCADIS/Malcolm Pirnie, 2012b), and the pre-pilot baseline sampling in
August 2013 (summarized below and shown on Figures 6 and 7), the greatest
concentrations of PCE and its degradation products in groundwater at the Site are

g:\project\00266417.0000\file\summary report\pilot summary report final 7-2018.docx 3-4
Pre-Design Investigation Report
Crown Dykman (Site #130054) City of Glen Cove, New York
present in samples down-gradient from the southwestern corner of the Site building
extending off-site to northern portions of the former Li Tungsten Parcel A, and on the
eastern portion of the former Li Tungsten Parcel B. Concentrations of PCE and related
CVOCs in groundwater extend to a depth of up to 35 feet bgs.
Concentrations of petroleum compounds and measurable light non-aqueous phase
liquid (LNAPL) in some monitoring wells in the southwestern area of the site building
indicate a petroleum release at the Site. The presence of petroleum in groundwater at
the Site may be contributing to conditions favorable to the natural attenuation of
CVOCs present in groundwater, as data from previous investigations (Malcolm Pirnie,
2009a; ARCADIS/Malcolm Pirnie, 2012b) shows that degradation of CVOCs in the
groundwater is occurring. Concentrations of PCE and TCE in groundwater have
generally degraded over time, with site conditions generally favoring cis-1,2-DCE, with
some trans-1,2-DCE. However, site conditions have generally limited the production of
vinyl chloride.
The extent of CVOCs in groundwater has not been fully delineated to the south and
west on former Li Tungsten Parcels A and B, respectively (Figure 7). It is likely that
PCE and related CVOCs in groundwater are moving to the south and southwest,
toward Glen Cove Creek. Dewatering operations on the former Li Tungsten Parcel B
during excavation and grading activities there in 2006-2008 may have caused
migration of groundwater contaminants from the southwestern area of the Crown
Dykman property toward the former Li Tungsten Parcel B.

g:\project\00266417.0000\file\summary report\pilot summary report final 7-2018.docx 4-1
Pre-Design Investigation Report
Crown Dykman (Site #130054) City of Glen Cove, New York
4. Chemical Oxidation Pilot Study
4.1 Pilot Study Objectives
As summarized in Section 2, Malcolm Pirnie developed and implemented an initial
ISCO pilot test study in support of the final remedial design for the Crown Dykman Site
(ARCADIS/Malcolm Pirnie, 2012a; 2012b). The initial 2012 Pilot Study included
injection of sodium permanganate into the subsurface at the Site using a proprietary
injection technology developed by Badger Technologies, Inc. (Badger), and using an
alternative slotted injection nozzle method (ARCADIS/Malcolm Pirnie, 2012a; 2012b).
The work included installation of an additional monitoring well, completion of the
chemical oxidant injections, and evaluation of post-injection analytical sampling. The
results and conclusions of the pilot test are presented in the Chemical Oxidation Pilot
Study Summary Report submitted to the NYSDEC in August 2012 (ARCADIS/Malcolm
Pirnie, 2012b).
Eight direct-push injection points (DPIPs) were installed using the Badger injection
equipment within, and upgradient of, the pilot study treatment area shown on Figure 8.
In addition, an injection point was attempted in the vicinity of a Badger DPIP location
using a compressor and a slotted 4-port, direct-push injection tip (ARCADIS/ Malcolm
Pirnie, 2012b). Injection of the sodium permanganate solution into an existing
monitoring well (MW-10D) using both gravity feed and pressurization of the well were
attempted during the initial Pilot Test. The initial Pilot Study concluded that the
stratigraphy in the vicinity of the area of greatest CVOC concentrations (Figure 7)
limited the applicability of Badger injection technology at the Crown Dykman Site for
full-scale implementation. The alternate delivery methods evaluated during the Pilot
Test (slotted tip injection and well injection) were generally unsuccessful at introducing
permanganate to the subsurface.
While the initial Pilot Study results demonstrated that injection (by gravity feed or under
pressure) into existing monitoring well MW-10D was not effective, the study concluded
that this was likely due to the well construction not being suitable for such a purpose.
MW-10D was constructed and designed as a monitoring well, and was not sufficiently
developed and hydraulically connected to the aquifer to support injections. The Pilot
Study concluded that the use of temporary injection wells, specifically designed with
greater diameters and wire-wrapped screens, could potentially increase injectability of
the preferred chemical oxidant. Therefore, as part of the next phase of work, the
second pre-design Pilot Study summarized herein was implemented to assess the

g:\project\00266417.0000\file\summary report\pilot summary report final 7-2018.docx 4-2
Pre-Design Investigation Report
Crown Dykman (Site #130054) City of Glen Cove, New York
applicability of introducing sodium permanganate to the subsurface using purpose-built
injection wells.
4.2 Summary of Pre-Pilot Test Field Activities
Pre-Pilot Test activities included, groundwater monitoring well and injection well
installation, and pre-pilot groundwater analytical sampling. Prior to injection well
installation, a private utility locater was subcontracted to locate utilities by way of
Ground Penetrating Radar (GPR) and through the use of passive and active signal
locating.
4.2.1 Existing Monitoring Well Replacements
During the utility locating field work, it was discovered that an existing monitoring well
MW-18 and monitoring well cluster (MW-22S/D) had been damaged and were buried
under debris. Initial attempts to locate these wells using the GPR were unsuccessful.
The MW-18 location is located hydraulically cross-gradient from the injection wells, with
the MW-10 well cluster present between the former MW-18 and injection well IW-1D
(Figure 8). This location was not critical for injection monitoring during the Pilot Study,
and after consultation with the NYSDEC it was decided not to replace the MW-18
location.
In addition to being buried, traffic entering the site routinely cut the corner where the
existing MW-22S/D well cluster was located, causing further damage to the wellheads.
Upon consultation with the NYSDEC, and due to its importance as a site boundary well
downgradient from the injection area, it was decided to replace the MW-22 well cluster.
Therefore, two additional wells were drilled and installed at the request of the NYSDEC
(MW-22R-S and MW-22R-D) to replace the damaged monitoring well cluster. The
MW-22 well cluster replacement wells, MW-22R-S/D were installed just north of the
original well cluster, in an effort to move them from the low-lying area where heavy
truck traffic turning onto the Access Road appears to have contributed to the
destruction of the original cluster (Figure 8).
4.2.2 Additional Monitoring Well Installations
During August 2013, two injection wells and one new monitoring well cluster were
installed at the Site for the chemical oxidation pilot. The injection and monitoring wells
were installed using both rotary drilling techniques (4-¼ inch hollow-stem-augers), and
direct-push drilling. During drilling of the injection well locations, continuous split-spoon

g:\project\00266417.0000\file\summary report\pilot summary report final 7-2018.docx 4-3
Pre-Design Investigation Report
Crown Dykman (Site #130054) City of Glen Cove, New York
and/or direct-push soil sampling was performed from the surface to the total depth of
the boring and logged by a field geologist. For the monitoring well clusters, only the
deep well was logged during drilling. The boring logs and well construction details are
provided in Appendix A.
The injection wells (IW-01S/D) were installed in the vicinity of the MW-10 cluster, as
shown on Figure 8. The injection wells were constructed using a 10-foot length of 2-
inch diameter poly-vinyl chloride (PVC) wire wrapped screen, with a 2-inch schedule 40
PVC riser from the top of the screen interval to ground surface (see Table 2 and
Appendix A). The injection wells were screened over 10-foot screened intervals, with
one well screened over a shallow interval beginning at the water table, and one in a
deep interval generally screened from 20 to 30 feet bgs (see Table 2 and Appendix A).
An annular well seal consisting of neat cement was installed above the filter pack to
ground surface to reduce the potential for sodium permanganate from preferentially
moving up the annulus of the well and breaking through the ground surface during
injection (referred to as “short-circuiting”).
To supplement the existing monitoring well network, the new monitoring well cluster,
consisting of a shallow and deep screen interval (MW-25S/D) was installed in between
the MW-21 and MW-1 well clusters, within the fenced-in area at the southwestern
corner of the building (Figure 8). The monitoring well clusters were completed in two
depth intervals installed in two separate borings, similar to those of the injection wells
(see Table 2 and Appendix A).
The injection and monitoring wells were developed to improve their hydraulic properties
by removing sediment and clearing the well screen of fine particles. To assess the
effectiveness of well development in the injection wells, development was paused, and
the well was purged at a constant rate periodically throughout development. During
this time, the resultant drawdown in each well was measured to assess changes in
estimated well specific capacity (Sc). The well was pumped at the same rate during
each test, and Sc was again estimated. As shown in Tables 3a (IW-01S) and 3b (IW-
01D), an increase in Sc of the injection wells was observed during development,
indicating decreased fines in the well screen filter pack, and a better connection to the
aquifer. The Sc of injection well IW-01S increased by approximately 3.5 times from the
initial estimate at the start of development (Table 3a). The Sc of injection well IW-01D
increased by approximately 1.5 times from the initial estimate at the start of
development (Table 3b). Development was considered complete when the turbidity
was at a minimum, and no further gains in Sc were observed (Sc increased by at least
100 percent).

g:\project\00266417.0000\file\summary report\pilot summary report final 7-2018.docx 4-4
Pre-Design Investigation Report
Crown Dykman (Site #130054) City of Glen Cove, New York
4.3 Pre-Pilot (Baseline) Groundwater Sampling and Analysis
Prior to implementing the chemical oxidation pilot, ARCADIS sampled groundwater
from eight monitoring locations, including six existing monitoring wells/ well clusters
(MW-1S/D/DD cluster, MW-10S/D cluster, MW-13, MW-21S/D cluster, MW-22(R)S/D
cluster, MW-24, and MW-25S/D cluster), and the injection wells (shallow and deep)
(Figure 8). The groundwater samples were submitted to TestAmerica Laboratories,
Inc. (TestAmerica) for analysis of Target Compound List (TCL) VOCs by USEPA
Method 8260B. During the baseline sampling, all eight of the sampling locations (15
groundwater samples) were additionally analyzed for total organic carbon (TOC), and
chemical oxygen demand (COD). The TOC and COD data will be used in support of
design of the final remedy for the site. The results of the baseline sampling event and
purge logs from this event are summarized in Table 4 and Appendix B (VOCs).
To evaluate geochemical characteristics of the groundwater, and to evaluate the
effectiveness of well purging, temperature, pH, oxidation-reduction potential (ORP),
specific conductivity, turbidity, and dissolved oxygen (DO) were measured during
purging and immediately prior to groundwater sampling. Water Quality parameters
measured during the baseline sampling event included pH, which ranged from 6.21 in
monitoring well MW-10S and 6.83 in monitoring well MW-24, which generally indicate
neutral to slightly acidic conditions throughout most of the treatment area.
The ORP and DO data (Table 5) indicate Anaerobic conditions persist in areas where
petroleum products are present (see Section 4.5.2.3), including MW-8, MW-13, and
MW-14R (Figure 8). The shallow injection well (IW-1S), and areas adjacent to or
downgradient from IW-1S are predominantly oxidizing during the post-injection period,
including the MW-1/1D/1DD well cluster, the MW-10S/D well cluster, MW-12, the MW-
21S/D well cluster, the MW-23S/D well cluster and MW-24 (Figure 8). However, the
deep injection well (IW-1D) and the MW-25S/D well cluster, located approximately 15
feet downgradient of the injection wells, indicate reducing conditions.
Laboratory results for samples collected during the baseline sampling event are
included as Appendix C. These results indicated that cis-1,2-DCE, PCE, TCE, and
Vinyl Chloride were the most frequently detected compounds in groundwater samples
collected during the baseline sampling event. A majority of the groundwater samples
collected during the baseline sampling event, with the exceptions of samples from
monitoring wells MW-21S, MW-21D, and MW-22(R)D, had concentrations of all four of
these analytes exceeding NYSDEC Class GA standards. The sample from monitoring
well MW-21S only exhibited a concentration of PCE exceeding NYSDEC Class GA

g:\project\00266417.0000\file\summary report\pilot summary report final 7-2018.docx 4-5
Pre-Design Investigation Report
Crown Dykman (Site #130054) City of Glen Cove, New York
standards, and the sample from monitoring well MW-22(R)D only contained a
concentration of cis-1,2,-DCE exceeding NYSDEC Class GA standards. The sample
from groundwater monitoring well MW-21D contained concentrations of cis-1,2-DCE
and Vinyl Chloride that contained concentrations greater than the NYSDEC Class GA
standards (Figure 6).
Several groundwater samples also contained concentrations of Methylene Chloride
which exceeded NYSDEC Class GA standards. These groundwater samples were
collected from injection well IW-01S, and monitoring wells MW-1D, MW-1DD, MW-10S,
MW-13, MW-21D, MW-22(R)S, MW-24. Samples from groundwater monitoring wells
MW-10S and MW-22R-S also contained concentrations of Trans-1,2,-DCE which
exceeded corresponding NYSDEC Class GA standards. None of the remaining
monitoring or injection wells sampled contained concentrations exceeding
corresponding NYSDEC Class GA standards (Figure 6).
4.4 Pilot Test Implementation
The sodium permanganate pilot test was completed during the first two weeks of
September 2013. During the pilot injections, a stock sodium permanganate solution
was used at the site to mix a four-percent solution for injection. The solution (IW-01S
and IW-01D) was delivered to the subsurface through the use of a mobile injection skid
consisting of two 500-gallon horizontal storage tanks, one chemically compatible
double diaphragm pump, well head manifolds, and associated piping and hosing to
deliver the solution to the well heads (Figure 9).
Sodium permanganate solution was distributed over the 10-foot screen interval with a
target injection radius of influence (ROI) of up to 10 feet, with well head pressure not
exceeding five pounds per square inch (PSI). Well head manifolds were fitted with a
flow control ball valve, a pressure gauge and an overflow valve for pressure relief.
Once the system was assembled, it was tested for leaks prior to implementation of
permanganate injection using potable water.
4.4.1 Injection Monitoring
Injection performance was monitored through both visual observations, and through
measuring water quality parameters in surrounding monitoring well locations, including
the proposed monitoring well cluster, and six existing monitoring wells/ well clusters
(MW-1 cluster, MW-10 cluster, MW-13, MW-21 cluster, MW-22 cluster, MW-24). These
parameters will include turbidity, pH, DO, ORP, temperature, and conductivity

g:\project\00266417.0000\file\summary report\pilot summary report final 7-2018.docx 4-6
Pre-Design Investigation Report
Crown Dykman (Site #130054) City of Glen Cove, New York
readings, which will assist in assessing breakthrough of sodium permanganate.
Summary tables of the injection monitoring data are included in Appendix D.
During the Pilot Test, the ground surface, particularly in those areas around the
injection wells and adjacent to built physical features, were monitored to identify any
occurrence of the solution leaching through to the surface (referred to as “daylighting”)
or short-circuiting from the injection well annulus:
■ ARCADIS visually inspected the areas with penetrations through the building
floor and exterior ground surfaces adjacent to built physical features during the
Pilot Test to monitor for daylighting of the sodium permanganate.
■ In addition, ARCADIS visually monitored storm water manholes and catch
basins in the adjacent access roadway and along Herb Hill Road during the
Pilot Test to monitor them for sodium permanganate daylighting.
Water quality parameters including pH, DO, ORP, and conductivity were also
monitored at two feet screen intervals in monitoring wells MW-10S, MW-10D, MW-22S,
MW-22D, MW-25S, and MW-25D during the injection process (see Appendix D). The
results of the sodium permanganate injections are summarized in Section 4.5, below.
4.4.2 Post-Injection Monitoring
Post-Injection monitoring and groundwater sampling included three sampling rounds at
one (October 2013), two (November 2013), and four (January 2014) months following
completion of the sodium permanganate injections in September 2013. The monitoring
events included groundwater sampling in select monitoring wells to determine the
overall effectiveness and reduction of CVOCs. After discussion with, and concurrence
of, the NYSDEC, the baseline monitoring well sampling group (see section 4.3, above)
was expanded during post-injection sampling events to include sampling four additional
well locations (MW-8, MW-12, MW-14R, MW-23S/D), bringing the total number of
monitoring locations to 12 (up to 20 groundwater samples). Samples from wells MW-8,
MW-12, and MW-14R were included to evaluate VOC concentrations and the
continued presence of LNAPL in support of remedy design. The MW-23 well cluster
was sampled to further assess potential downgradient movement of the sodium
permanganate solution post-injection.
Groundwater was sampled using the USEPA low flow methodology. During the
sampling events, groundwater levels were measured in each of the monitoring wells
and recorded prior to groundwater sampling using an electronic groundwater interface

g:\project\00266417.0000\file\summary report\pilot summary report final 7-2018.docx 4-7
Pre-Design Investigation Report
Crown Dykman (Site #130054) City of Glen Cove, New York
probe, which also was used to indicate the potential presence and thickness of LNAPL
in the wells. Where LNAPL was identified, the thickness was recorded, and the water
levels were corrected accordingly. Wells where sodium permanganate was visibly
present (including the injection wells during all post-injection sampling events) were not
sampled, as discussed in Section 4.5, below.
The monitoring well samples were submitted to TestAmerica for analysis of TCL VOCs
by USEPA Method 8260B. Groundwater parameters, including turbidity, pH, ORP,
temperature, and conductivity were measured prior to sampling using a multi-
parameter water quality instrument. Laboratory analytical reports from the post-
injection rounds are included in Appendix C. The results are summarized below in
Section 4.5.
During the November post-injection sampling round, LNAPL from monitoring well MW-
8 was sampled and submitted for analysis of additional parameters (ignitability,
hydrocarbon identification, viscosity, and specific gravity/density). In addition,
groundwater samples from well MW-8 during the November post-injection sampling
round were also submitted for analysis of semi-volatile VOCs (SVOCs) using USEPA
method 8270C. The analytical laboratory reports are provided in Appendix C. The
results are summarized below in Section 4.5.
4.5 Pilot Study Results
4.5.1 Sodium Permanganate Injection
During the pilot pre-design, a mobile porosity of 10 percent was estimated for
volumetric calculations as a conservative number these soil types. Based on this
assumed mobile porosity, a total injection volume of approximately 2,350 gallons of
four-percent solution was anticipated per injection well to achieve the effective ROI,
resulting in a total of 4,700 gallons injected between the two injection points. The
injections assumed an initial flow rate of up to 1gallon per minute (gpm) per well, with
injection in both injection wells simultaneously.
However, during implementation a total of approximately 5,170 gallons of sodium
permanganate was injected in 10 batches into injection wells IW-01S and IW-01D
simultaneously:
■ Approximately 2,066 gallons of solution were injected into IW-01D with flow
rates ranging from approximately 1 to 3.3 gallons per minute (gal/min.); and,

g:\project\00266417.0000\file\summary report\pilot summary report final 7-2018.docx 4-8
Pre-Design Investigation Report
Crown Dykman (Site #130054) City of Glen Cove, New York
■ Approximately 3,104 gallons of solution were injected into IW-01S with flow
rates ranging from approximately 1.6 to 3.3 gal/min.
The injections were completed over the period of seven days. Slight pressure was
observed in injection well IW-01S that remained between 0.5 to 1.0 psi. ARCADIS
personnel did not observe day-lighting of the permanganate solution in surrounding
wells, in the interior of the building, nor in surrounding catch basins or surface water.
During the injection process, groundwater levels were monitored in several monitoring
wells to observe whether solution was entering monitoring wells, resulting in rising
water levels. However, during injection water levels remained consistent with static,
pre-injection levels and changes in water level were not observed.
Overall there were no significant changes in pH in any of the monitoring wells during
the injection process. Conductivity showed slight increases in each of the well screen
intervals in monitoring wells MW-10D, and MW-25S and no significant changes in the
remaining observed monitoring wells over time. DO showed no significant increases in
any of the observed monitoring wells during injection.
As shown on Figure 10, sodium permanganate was visibly present in both the shallow
and deep injection wells during all of the post-injection monitoring events, and during
the July 2014 synoptic sampling round (Section 5). During injection, there was no
indication of sodium permanganate in monitoring wells adjacent to the injection wells
(including MW-13, MW-10S/D, and MW-025S/D). The presence of sodium
permanganate was not observed in any of the site wells during the subsequent three
post-injection sampling rounds. Sodium permanganate was first observed in both MW-
21S and MW-21D (approximately 20 feet west of the injection wells) and well MW-25S
(approximately 15 feet south of the injection wells) during the July 2014 sampling
round.
4.5.2 Post-injection Monitoring Results
As discussed above, post-Injection monitoring and groundwater sampling included
three sampling rounds at one, two, and fourth months following completion of the
sodium permanganate injections in September 2013. The post-injection water quality
data (DO and ORP) are summarized in Table 5. The Post-injection analytical data are
summarized in Table 6. A discussion of the post-injection data is provided below.

g:\project\00266417.0000\file\summary report\pilot summary report final 7-2018.docx 4-9
Pre-Design Investigation Report
Crown Dykman (Site #130054) City of Glen Cove, New York
4.5.2.1 Water Quality Parameters
Water quality parameters (Table 5) collected at each well prior to sampling indicated
that monitoring wells MW-12, MW-13, MW-22(R)D, MW-22(R)S, MW-24, MW-25D,
and MW-25S exhibited negative ORP values. Monitoring wells MW-1, MW-1D, MW-
1DD, MW-21D, MW-21S, MW-23D, and MW-23S exhibited positive ORP values. In
general, Positive ORP values (>0.0 mV) in conjunction with elevated levels of DO may
indicate aerobic conditions and the success of oxidant addition. However, at neutral
pH values, measurements below -50 mV can suggest that strongly reducing conditions
(iron-reducing, sulphate-reducing or methanogenic) prevail in the groundwater plume.
DO measurements of less than 1 ppm suggest that anaerobic conditions may exist.
Anaerobic conditions persist in areas where petroleum products are present (see
Section 4.5.2.3), including MW-8, MW-13, and MW-14R (Figure 8), while areas
adjacent to, or, downgradient from the injection wells are predominantly oxidizing
during the post-injection period, including the MW-1/1D/1DD well cluster, the MW-
10S/D well cluster, MW-12, the MW-21S/D well cluster, the MW-23S/D well cluster and
MW-24 (Figure 8). However, monitoring of ORP and DO in the MW-25S/D well
cluster, located approximately 15 feet downgradient of the injection wells, indicate that
these wells remain reducing.
As shown in the plots provided on Figure 10, monitoring wells in the vicinity of the
injection wells (including MW-10S, MW-10D, and MW-13) show an increase in
oxygenation post-injection that may indicate response to the sodium permanganate
injections. In the case of MW-13, reducing conditions were temporarily replaced by
oxidizing conditions during the second post-sampling round. However, the presence of
petroleum-related compounds in areas upgradient from the injection wells drove
conditions anaerobic during subsequent sampling rounds.
Groundwater pH values were relatively neutral throughout the treatment area during
this time (Table 5). Values of pH ranged from 6.01 in monitoring well MW-10S to 7.68
in monitoring well MW-25S. This data indicate that changes in ORP are not likely a
result of fluctuations in pH within the groundwater plume.
4.5.2.2 Chlorinated VOCs
As shown on Figure 11 and Table 6, concentrations of CVOCs, including PCE, TCE,
cis/trans-1,2-DCE, and vinyl chloride are present in many of the injection pilot

g:\project\00266417.0000\file\summary report\pilot summary report final 7-2018.docx 4-10
Pre-Design Investigation Report
Crown Dykman (Site #130054) City of Glen Cove, New York
monitoring wells, with cis-1,2-DCE at concentrations in all of the wells sampled
exceeding the respective NYSDEC Class GA standard.
The greatest post-injection concentrations of CVOCs are present in wells located
adjacent to, or downgradient from, the southwestern corner of the Site building (Figure
11). Post-injection concentrations of PCE, TCE, and cis-1,2-DCE were greatest at
MW-13, located near the southwest corner of the building, approximately 12 feet
upgradient from the shallow injection well. MW-13 is a shallow well screened
approximately 7 to 12 feet bgs, across the water table, approximately within the
screened interval of the adjacent shallow injection well (8 to 18 feet bgs).
As shown on Figures 11 and 12, post-injection concentrations of PCE, TCE, and cis-
1,2-DCE from samples in MW-13 have remained at baseline levels, or have risen,
during the first two post-injection period following the September 2013 sodium
permanganate injections. Baseline cis-1,2-DCE concentrations of 51,000 ug/l (based
on sample dilution) rose to 140,000 ug/l during the second post sampling event
approximately two months after injection, then exhibiting a slight decrease to 120,000
ug/l in January 2014. The same time period showed an increasing trend in PCE
concentrations from a baseline concentration of 7,000 ug/l (based on sample dilution)
to 9,600 ug/l in November 2013, continuing to 34,000 ug/l in January 2014. TCE
concentrations in MW-13 exhibited a similar trend, increasing to 22,000 ug/l at MW-13
in January 2014 from a baseline concentration of 7,800 ug/l (based on sample dilution).
Vinyl chloride concentrations at MW-13 were the greatest observed in the wells
sampled during the pilot and remained relatively constant throughout the three post-
injection sampling events (ranging from a baseline of 3,000 ug/l to a maximum of 3,800
ug/l in January 2014).
However, during the period from January 2014 to July 2014, post-injection
concentrations of CVOCs detected in groundwater at MW-13 exhibited a marked
decline (Figure 12). Concentrations of PCE and TCE both declined to 4,100 ug/l during
the July 2014 synoptic sampling round (Section 5), representing an approximately 88
and 81percent decline in those compounds at MW-13, respectively. Concentrations of
cis-1,2-DCE declined to 25,000 ug/l, representing an approximately 79 percent
decrease in concentration at MW-13. Concentrations of vinyl chloride during the 2014
synoptic sampling event had declined to a value below the reporting limit (450 ug/l),
representing at least an 88 percent decline in concentration.
While CVOC concentrations in MW-13 exhibited the greatest relative declines, trends
of CVOC concentrations in other wells, including MW-10S, MW-14R, MW-25S, MW-

g:\project\00266417.0000\file\summary report\pilot summary report final 7-2018.docx 4-11
Pre-Design Investigation Report
Crown Dykman (Site #130054) City of Glen Cove, New York
23S, MW-23D, MW-24, MW-1DD, MW-22(R)S, and MW-25D, showed a relative
decline during the same period. However, other wells exhibited relatively stable CVOC
concentrations from September 2013 to July 2014, including MW-8, MW-10D, MW-1D,
and MW-22(R)D (Figure 12). While MW-21S and MW-21D had slightly increasing and
relatively stable CVOC concentrations, respectably, through January 2014, the
presence of sodium permanganate in those wells by July 2014 likely indicates the
destruction of CVOCs in the vicinity of those wells while the sodium permanganate
persists.
4.5.2.3 Other Constituents
Figure 13 provides a summary of other VOC constituents in groundwater during the
post-injection sampling rounds. Detected constituents exceeding their respective
NYSDEC class GA standards included BTEX compounds (benzene, toluene,
ethylbenzene, and m-, p-, and o- xylenes), methyl tert-butyl ether (MTBE), acetone,
methylene chloride, dichlorodifluoromethane, 1,1,1-trichloroethane (1,1,1-TCA), and
11-dichloroethane (1,1,-DCA). BTEX compounds were most prevalent in groundwater
samples from wells in areas where petroleum products are or were previously present,
including MW-8, MW-12, and MW-14R (Figure 13).
The greatest concentrations of BTEX compounds were in MW-8, with ethylbenzene
ranging from 14 to 130 ug/l, and total xylenes ranging from 120 to 1,400 ug/l in
samples from November 2013 and July 2014, respectively. As shown on Table 6, the
groundwater sample from MW-8 (November 2013) contained SVOC concentrations of
Bis(2-Ethylhexyl) Phthalate, Diethyl Phthalate, and Pentachlorophenol which exceeded
NYSDEC Class GA standards. No other SVOC analytes exceeded the NYSDEC Class
GA standards.
4.5.2.4 LNAPL Occurrence and Distribution
During this monitoring period, LNAPL was present in monitoring wells MW-6R, MW-
16R, and MW-17R with less than 0.01 feet thicknesses. LNAPL was also present in
monitoring well MW-8 at a thickness of 0.58 feet (see Table 7). During this sampling
round, a sample of the LNAPL in MW-8 was sent to TestAmerica for sample
identification and characterization (Appendix C). According to the LNAPL identification
results, the LNAPL present in well MW-8 is consistent with gasoline.

g:\project\00266417.0000\file\summary report\pilot summary report final 7-2018.docx 4-12
Pre-Design Investigation Report
Crown Dykman (Site #130054) City of Glen Cove, New York
During the second-post injection monitoring period, LNAPL was present in monitoring
well MW-6R at less than 0.01 feet in thickness MW-16R at 0.07 feet in thickness, MW-
17R at 0.08 feet in thickness, and MW-95 at 0.95 feet in thickness (see Table 7).
During the third-post injection monitoring event LNAPL was present in monitoring well
MW-8 at a thickness of 0.01 feet in thickness. LNAPL was not present in monitoring
well MW-6R, and monitoring wells MW-16R and MW-17R were not measured (see
Table 7).
The presence of LNAPL at the Site is consistent with detections of BTEX and other
petroleum-related compounds in groundwater. However, as shown on Figure 14
LNAPL trends in all of the wells indicate that measurable levels of LNAPL are no longer
present in wells at the Site.

g:\project\00266417.0000\file\summary report\pilot summary report final 7-2018.docx 5-1
Pre-Design Investigation Report
Crown Dykman (Site #130054) City of Glen Cove, New York
5. Supplemental Source Investigation
As discussed above, the post-pilot groundwater monitoring results indicated that a
residual source of CVOC contamination may remain under the foundation of the
southwest portion of the site building despite the soil removal that had been performed
previously (Walden Associates, 2006). This may be contributing to the continued high
concentration of CVOCs in the vicinity of MW-13. The continued presence of such
CVOC groundwater concentrations could adversely affect the effectiveness of the
selected remedy for the site. Therefore, to further evaluate CVOC concentrations under
the foundation and beneath the formerly excavated area of the Crown Dykman
building, four new monitoring wells were installed in the storage room located at the
southwestern corner of the building (Figure 2) during July 2014.
In addition, an additional synoptic groundwater sampling effort was completed to
include all new and existing wells at the site and adjacent properties associated with
the former Li Tungsten property, as discussed below. The supplemental investigation
included a review of all existing site wells in an effort to assess the presence and
condition of the Site wells, and their viability for use in the monitoring well network.
This included wells that were previously thought to be damaged or destroyed by Site
activities (MW-5, MW-4, MW-3, MW-18, and the MW-22S/D cluster), or by construction
or demolition activities on adjacent sites (MP-20 and GM-1 on the former Li Tungsten
Parcel A). A summary of the work performed, and the investigation results is provided
below.
5.1 Building Interior Soil Boring and Monitoring Well Installations
Four additional groundwater monitoring wells (MW-26, MW-27, MW-28, and MW-29)
were installed through the building slab using direct-push drilling techniques and were
completed at the surface with a flush-mount cover installed in the concrete slab (Figure
3). During drilling, continuous direct-push soil cores were collected and screened
using a PID from the surface to the total depth of the boring. Soil grab samples were
collected from each boring within the depth interval where the PID indicated the
presence of volatile constituents or at the water table if no PID detections are noted, as
described in the boring logs in Appendix A. The soil samples were analyzed for TCL
VOCs by USEPA Method 8260B. The analytical results from the soil samples are
summarized on Figure 15 and in Table 8 and are discussed below. The laboratory
reports are provided in Appendix C.

g:\project\00266417.0000\file\summary report\pilot summary report final 7-2018.docx 5-2
Pre-Design Investigation Report
Crown Dykman (Site #130054) City of Glen Cove, New York
Well construction details for each of the interior wells is provided on the well logs in
Appendix A and summarized in Table 2. The monitoring wells were constructed using
a 10-foot length of 2-inch diameter PVC machine-slotted screen (0.010-inch slot), with
a 2-inch schedule 40 PVC riser from the top of the screen interval to ground surface
(see Table 2 and Appendix A). The wells were screened over a 10-foot shallow interval
beginning at, or just above, the water table (see Table 2 and Appendix A), which was
generally encountered between approximately six and seven feet below grade within
the building. An annular well seal consisting of cement-bentonite grout was installed
above the filter pack to ground surface.
The monitoring wells were developed to improve their hydraulic properties by removing
sediment and clearing the well screen of fine particles through simultaneous well
surging and pumping. After completion of well development, the wells were sampled
for TCL VOCs by USEPA Method 8260B as part of the synoptic groundwater
monitoring event discussed below.
5.2 Monitoring Well Assessment
During July 2014, prior to groundwater sampling, the condition of each well at the
Crown Dykman site, and off-site wells associated with the Crown Dykman investigation
(MP-20 and GM-1 on the former Li Tungsten Parcel A south of the Site; GM-9 and
MW-9 on the former Li Tungsten Parcel B west of the Site) was assessed.
The results of the well assessment are summarized on Table 9. Of the 38 on-site wells
and four off-site wells, only two wells were not found during the assessment, due to the
presence of debris over their presumed location. These included well MW-5 at the
northern (upgradient) end of the site, and GM-1 at the northeastern corner of the
former Li Tungsten Parcel A (Table 9). However, during the well assessment,
ARCADIS field personnel were able to locate the formerly lost well cluster MW-22S/D,
which was found intact after a significant effort. MW-18 was also located. Although is
both instances the wells had been buried under debris, the field personnel were able to
locate them, and the wells were viable for use in subsequent sampling during the
synoptic event.
5.3 Groundwater Sampling and Analysis
A synoptic groundwater sampling round was completed at the Site in July 2014 during
the well installation field effort. Groundwater was sampled from the new building interior
wells, and all viable monitoring locations on the Crown Dykman Site and adjacent

g:\project\00266417.0000\file\summary report\pilot summary report final 7-2018.docx 5-3
Pre-Design Investigation Report
Crown Dykman (Site #130054) City of Glen Cove, New York
properties associated with the former Li Tungsten Facility (Li Tungsten Parcels A and
B. The groundwater samples were analyzed for TCL VOCs by USEPA Method 8260B.
A total of 34 of the 40 available wells were sampled during the July 2014 synoptic
sampling event. The injection wells (IW-01S/D), the MW-21S/D well cluster, and well
MW-25S were not sampled due to the presence of sodium permanganate at those
locations. The groundwater sampling results are summarized on Figure 16.
5.4 Analytical Sampling Results
5.4.1 Soil Sampling Results
Soil sampling results (Table 8 and Figure 15) show that significant concentrations of
PCE are present in the soil below the site building, within the area of the 2005 IRM
excavation (Walden Associates, 2006). Soil samples from the well MW-27 boring,
which was installed in the vicinity of the southwestern corner of the 2005 IRM
excavation (where post-removal soil samples indicated PCE at 290 ppm in soil),
yielded the greatest concentrations of PCE and TCE in soil, at 24,000 ppm and 300
ppm, respectively (11-12 feet bgs). Concentrations of PCE in soil at that same location
were 110 ppm at the sample interval above (6-7 feet bgs). Such concentrations of
PCE in the soil at MW-27 indicate the presence of free-phase PCE within this boring.
Concentrations of PCE at 150 ppm and 180 ppm (8-9 feet bgs and 10-11 feet bgs,
respectively) were present in soil at MW-28, within the building approximately 10 feet
west of MW-27 (Figure 15). The PCE concentrations exceed both the NYSDEC
Unrestricted Use (1.3 ppm) and Commercial (150 ppm) soil cleanup objectives (SCOs)
at both sampling intervals in MW-28, and at the deep sampling interval (11-12 feet bgs)
in MW-27.
At the other two boring locations (MW-26 and MW-29), installed north of MW-27 and
MW-28 (Figure 15), concentrations of CVOCs were significantly lower. At both
locations, only one interval was sampled above the water table in each (7-8 feet bgs).
Concentrations of PCE in soil in MW-26 were below the Unrestricted SCOs for PCE at
both boring locations.
In addition to CVOCs, BTEX compounds, including ethylbenzene and xylenes, were
present in soil samples from all four boring locations within the building (Figure 15). At
MW-26 and MW-29, both ethylbenzene and total xylene concentrations exceeded their
respective Unrestricted Use SCOs (1ppm and 0.26 ppm, respectively) in the soil
sampled at the water table (7-8 feet bgs). Total xylene concentrations were also

g:\project\00266417.0000\file\summary report\pilot summary report final 7-2018.docx 5-4
Pre-Design Investigation Report
Crown Dykman (Site #130054) City of Glen Cove, New York
present in both sample intervals at MW-27, at levels exceeding the respective
Unrestricted Use SCO (Table 8).
5.4.2 Groundwater Sampling Results
The results of the July 2014 sampling round were consistent with previous post-
injection sampling rounds; however, this round included all viable Site wells, including
the three new wells installed within the building. As shown on Figure 16 and
summarized in Table 6, concentrations of CVOCs, including PCE, TCE, cis/trans-1,2-
DCE, and vinyl chloride are present in many of the injection pilot monitoring wells, with
cis-1,2-DCE at concentrations in all of the wells sampled exceeding the respective
NYSDEC Class GA standard.
The greatest concentrations of CVOCs were present in the groundwater sample from
the new well MW-27, located within the building near the southwest corner (Figure 16),
with PCE detected at 150,000 ug/l, TCE at 130,000 ug/l, cis-1,2-DCE at 130,000 ug/l,
and vinyl chloride at 4,900 ug/l in groundwater (all based on sample dilution). The
other three new wells within the building also contained CVOCs at concentrations
greater than previously (or concurrently) observed in MW-13 (Figure 16). These
included PCE, TCE, cis-1,2-DCE, and vinyl chloride at 77,000 ug/l, 28,000 ug/l,
110,000 ug/l and 3,000 ug/l, respectively (Figure 16 and Table 6).
As discussed above (Section 4) concentrations of CVOCs in MW-13 showed a
decrease from the January 2014 sampling data, with concentrations of PCE and TCE
during July 2014 both at 4,100 ug/l, and cis-1,2-DCE at 25,000 ug/l (Figure 16 and
Table 6). These values were less than those in MW-26, located along the western
wall of the storage area within the building, just upgradient from MW-13, which yielded
concentrations of PCE, TCE, cis-1,2-DCE, and vinyl chloride of 8,100 ug/l, 5,500 ug/l,
54,000 ug/l, and 3,600 ug/l, respectively (based on sample dilution).
The distribution of CVOCs in the remaining Site wells is consistent with previous post-
injection sampling rounds. Based on the presence and distribution of CVOCs (Figure
16) in wells down-gradient from the presumed source area (in the southwestern corner
of the building), the CVOC plume in groundwater is moving to the south and southwest,
consistent with groundwater flow patterns at the Site (Figure 5). Based on the vertical
distribution of CVOCs in the downgradient area (MW-1, MW-22, and MW-22(R) well
clusters), it is apparent that the plume is increasing in depth toward the southern edge
of the property (Figure 16). This is also consistent with vertical groundwater gradients
observed at the Site.
g:\project\00266417.0000\file\summary report\pilot summary report final 7-2018.docx 5-5
Pre-Design Investigation Report
Crown Dykman (Site #130054) City of Glen Cove, New York
In addition, concentrations of CVOCs were present in the groundwater sample from
MW-11, which is present to the north of the presumed source area, at the northwestern
corner of the western half of the Site building (Figure 16). PCE and TCE were not
detected in this well, however, cis-1,2-DCE, trans-1,2-DCE, and vinyl chloride were
present at concentrations of 1,400 ug/l, 11, ug/l, and 450 ug/l, respectively. Lower
concentrations of cis-1,2-DCE and vinyl chloride were present in MW-8 (south of MW-
11, between MW-11 and the presumed source area at the southwestern corner of the
building), at 190 ug/l and 38 ug/l, respectively. PCE and TCE were not present in the
groundwater sample from MW-8. It is likely that the presence of cis-1,2-DCE and vinyl
chloride in the vicinity of these wells are remnants of a previous migration of CVOCs
into the vicinity from the source area under different hydraulic conditions.
Other constituents present in groundwater samples, exceeding their respective
NYSDEC class GA standards, included BTEX compounds (benzene, toluene,
ethylbenzene, and m-, p-, and o- xylenes), methyl tert-butyl ether (MTBE), acetone,
methylene chloride, dichlorodifluoromethane, 1,1,1-trichloroethane (1,1,1-TCA), and
11-dichloroethane (1,1,-DCA). BTEX compounds were most prevalent in groundwater
samples from wells in areas where petroleum products are or were previously present,
or within the southern portion of the Site building (including MW-8, MW-12, MW-14R,
MW-26, MW-27, MW-28, AND MW-29, as shown on Figure 16).
The greatest concentrations of BTEX compounds were in MW-8, with ethylbenzene
ranging from 14 to 130 ug/l, and total xylenes ranging from 120 to 1,400 ug/l in
samples from November 2013 and July 2014, respectively. As shown on Table 6, the
groundwater sample from MW-8 (November 2013) contained SVOC concentrations of
Bis(2-Ethylhexyl) Phthalate, Diethyl Phthalate, and Pentachlorophenol which exceeded
NYSDEC Class GA standards. No other SVOC analytes exceeded the NYSDEC Class
GA standards.
During the July 2014 sampling round, LNAPL was not observed in site wells at
measurable thicknesses. As with trends during previous sampling rounds (see Section
4.5.2.4), measurable levels of LNAPL are no longer present in wells at the Site.

g:\project\00266417.0000\file\summary report\pilot summary report final 7-2018.docx 6-1
Pre-Design Investigation Report
Crown Dykman (Site #130054) City of Glen Cove, New York
6. Soil Vapor Extraction System Performance Review
ARCADIS reviewed the performance of the existing SVE system, which included a
general system inspection, checks of other system operational components, and a
review of past system operational data. As an additional evaluation of SVE system
performance, indoor air and sub-slab vapor samples were collected in accordance with
NYSDEC DER-10 and the Final New York State Department of Health (NYSDOH)
Guidance for Evaluating Soil Vapor Intrusion in the State of New York (NYSDOH
Guidance), dated October 2006.
6.1 SVE System Overview
A limited remedial action was performed at the Site in 2004 in the southwestern corner
of the building that included excavation of some soil in the southwestern corner of the
building, and installation of sub-slab piping intended for a depressurization system to
mitigate contamination not removed during the excavation. However, subsequent
confirmation sampling of the excavation showed that not all of the contaminated soil
was removed. Based on the results of the investigation, a “sub-slab venting system”
(Walden Associates, 2006), which consisted of 2-inch perforated PVC piping was
installed prior to installing a new floor slab in the excavated area. The existing sub-slab
piping is shown on Figure 17.
Based on the results of a sub-slab piping system evaluation completed in 2008
(Malcolm Pirnie, 2008), a depressurization system that utilized the existing sub-slab
piping system was designed and installed to operate at the Site. The system was
installed in December 2008, after review and approval of the system design by the
NYSDEC. The system consists of a regenerative blower, control equipment, and a
carbon canister effluent treatment system installed on a skid-mounted platform outside
of the building adjacent to the western wall inside a fenced storage area. It is
connected to the existing sub-slab piping system by piping installed through the wall.
System operation was initiated on December 30, 2008, after completion of a pre-
startup testing phase (Malcolm Pirnie, 2008). Between 2008 and 2013, system
operation, maintenance and performance monitoring were performed by EAR.
During the 2008 investigation, ten sub-slab soil vapor monitoring points were installed
to allow sub-slab soil vapor sampling and SVE system performance monitoring via
pressure readings (Malcolm Pirnie, 2008). These points were evaluated and reviewed
for their use in monitoring and sampling during this performance review, as discussed
below.

g:\project\00266417.0000\file\summary report\pilot summary report final 7-2018.docx 6-2
Pre-Design Investigation Report
Crown Dykman (Site #130054) City of Glen Cove, New York
6.2 SVE Performance Review
Prior to evaluating current system performance, a review of system construction
(including any changes from as-built drawings) maintenance records, the system alarm
history, and overall system energy usage was completed. These included operational
records provided by EAR, the NYSDEC Callout Contractor overseeing system
operation.
On December 5, 2013, ARCADIS visited the Site to evaluate the SVE system
performance. While on site, system components were inspected for:
■ Damaged, missing, loose, or corroded components or fasteners;
■ The presence and proper installation of equipment safety guards;
■ The presence and condition of appropriate signs and warning labels
■ Integrity of piping and connections of sub-slab extraction lines and electrical
conduit.
In addition, system-critical function and system operation tests were completed, as well
as screening of pre- and post-carbon effluent using a photoionization detector (PID).
Subsequently, a qualitative analysis of the SVE system’s energy usage was
conducted.
6.3 Indoor Air Quality Assessment
During the second post-injection groundwater monitoring event in November 2013,
indoor air and sub-slab vapor was sampled while the SVE system was in operation.
The indoor air and sub-slab vapor samples were analyzed by TestAmerica for VOCs
using the United States Environmental Protection Agency (USEPA) Method TO-15.
Each canister was evacuated and certified as analyte-free by the laboratory prior to
use at the site. A flow regulator was attached to each canister to control the rate at
which the sample will be collected, and was equipped with a filter to prevent particulate
matter from entering the canister.
Six indoor air samples were collected over an 8-hour period using 6-liter Summa
canisters (Figure 18). A background (outdoor) air sample was also collected in the
same manner as the indoor air samples (Figure 18). The sub-slab vapor sampling was
performed concurrently with the indoor and ambient air sampling. Ten existing soil

g:\project\00266417.0000\file\summary report\pilot summary report final 7-2018.docx 6-3
Pre-Design Investigation Report
Crown Dykman (Site #130054) City of Glen Cove, New York
vapor monitoring points used during the 2008 remedial site investigation were
evaluated for use as sub-slab soil vapor sampling points (Figure 18).
New sub-slab vapor monitoring points were installed where the existing points could
not be located or were damaged. The new points were located within the same vicinity
of the existing locations and were installed in accordance with the methods
recommended by the NYSDOH Guidance. Each soil vapor point was sampled over a
period of up to two-hours using a 6-liter Summa canister. Prior to sampling, the seal of each sub‐slab vapor sampling point (including both existing and replacement points)
was evaluated for adequacy by means of a Helium tracer gas test, in accordance with
the methods recommended by the NYSDOH Guidance. After successful completion of tracer gas testing, the sub‐slab vapor point was properly purged prior to sampling.
The air sampling results are summarized in Table 7 and laboratory results are included
in Appendix C. As shown on Table 7, the CVOC target analytes including PCE, TCE,
Trans-1,2-DCE, Cis-1,2,-DCE, and Vinyl Chloride have decreased in the majority of
sub-slab vapor point locations since 2008. The only sub-slab vapor point that showed
an increase in CVOCs was the soil vapor sample collected from SS-7. All other soil
vapor points showed either a decrease or had very low concentrations of CVOC
compounds.
Indoor air samples also showed a decrease in CVOC target analytes since 2008. PCE
and TCE decreased in all six indoor air sampling locations. Trans-1,2-DCE and Vinyl
Chloride remained undetected. Cis-1,2-DCE also showed decreases in CVOCs in the
air samples collected at locations IA-2 and IA-3, and showed consistent very low or
non-detect concentrations in the remaining indoor air sampling locations.
g:\project\00266417.0000\file\summary report\pilot summary report final 7-2018.docx 7-1
Pre-Design Investigation Report
Crown Dykman (Site #130054) City of Glen Cove, New York
7. Summary and Conclusions
7.1 Pre-Design Chemical Oxidation Pilot Performance
During implementation a total of approximately 5,170 gallons of sodium permanganate
was injected over the period of seven days into the purpose-built injection wells, thus
establishing that this is a viable delivery system for permanganate injection at the site.
During injection, there were no immediate indications of injection response in adjacent
observation wells. However, while sodium permanganate was not observed in any of
the site wells during the subsequent three post-injection sampling rounds, it was
ultimately observed in both MW-21S and MW-21D (approximately 20 feet west of the
injection wells) and well MW-25S (approximately 15 feet south of the injection wells)
during the July 2014 sampling round.
While post-injection water quality monitoring ORP levels indicated a change from
reducing to oxidizing conditions in some portions of the treatment area, in other area
there were no indications of a change in groundwater chemistry. Groundwater pH
values were relatively neutral throughout the treatment area during monitoring,
indicating that changes in ORP were not likely a result of fluctuations in pH within the
groundwater plume. While anaerobic conditions persist in areas where petroleum
products were present, areas adjacent to, or downgradient from the injection wells
were predominantly oxidizing during the post-injection period. Monitoring wells in the
vicinity of the injection wells, including MW-10S, MW-10D, and MW-13 also showed an
increase in oxygenation post-injection that may indicate response to the sodium
permanganate injections. However, conditions in the MW-25S/D well cluster, located
approximately 15 feet downgradient of the injection wells, indicate that these wells
remained reducing through the first three post-injection monitoring events.
While post-injection concentrations of PCE, TCE, and cis-1,2-DCE from samples
generally remained at baseline levels, or rose slightly, during the first two post-injection
period following the September 2013 sodium permanganate injections, during the
period from January 2014 to July 2014, post-injection concentrations of CVOCs
detected in groundwater showed declines in a number of monitoring wells in the vicinity
of the injection area. In some instances (such as in MW-13), concentrations of PCE
and TCE both exhibited an approximately 88 and 81percent decline, respectively.
Concentrations of cis-1,2-DCE at MW-13 also exhibited an approximately 79 percent
decrease in concentration at MW-13. While CVOC concentrations in MW-13 exhibited
the greatest relative declines, trends of CVOC concentrations in other shallow-zone

g:\project\00266417.0000\file\summary report\pilot summary report final 7-2018.docx 7-2
Pre-Design Investigation Report
Crown Dykman (Site #130054) City of Glen Cove, New York
wells also showed a relative decline during the same period. However, deep-zone
wells exhibited relatively stable CVOC concentrations from September 2013 to July
2014.
These results are consistent with the heterogeneity observed in the geologic units at
the site. High and low permeability units are interspersed throughout the site, resulting
in preferential flow paths that can affect the distribution of the permanganate once
injected. Such effects were also observed during the first chemical oxidation pilot,
where the injection technology used had difficulty distributing the sodium
permanganate evenly throughout the subsurface.
Based on the data and observations presented herein, introduction of sodium
permanganate to the subsurface via purpose-build injection wells would be an effective
technology to implement the ISCO strategy presented in the ROD for the Crown
Dykman Site. However, the presence of significant heterogeneity and preferential flow
paths may reduce the overall effectiveness of the ISCO remedy, as some areas of the
subsurface may prove recalcitrant to in-situ chemical oxidation.
7.2 Supplemental Investigation
Soil sampling results show that significant concentrations of PCE are present in the soil
below the site building, within the area of the 2005 IRM excavation (Walden
Associates, 2006). Soil samples from the well MW-27 boring, which was installed in
the vicinity of the southwestern corner of the 2005 IRM excavation yielded the greatest
concentrations of PCE and TCE in soil, at concentrations indicative of free-phase PCE
within the soil in this area. In addition to CVOCs, BTEX compounds, including
ethylbenzene and xylenes, were present in soil samples from all four boring locations
within the building.
Based on the results of groundwater sampling within the monitoring wells installed
within the building, the presence of the petroleum compounds is likely creating
subsurface conditions favorable to degradation of the PCE to cis-1,2-DCE in
groundwater within this presumed source area. However, while there are significant
concentrations of vinyl chloride observed in groundwater in the vicinity of the source
area, the presence of this constituent is likely due to the mass of cis-1,2-DCE present
and available for degradation.
The low groundwater gradient beneath this portion of the building, and the continued
presence of a potential NAPL source of PCE in the vicinity, is contributing to the

g:\project\00266417.0000\file\summary report\pilot summary report final 7-2018.docx 7-3
Pre-Design Investigation Report
Crown Dykman (Site #130054) City of Glen Cove, New York
continued presence of CVOCs in both soil and groundwater beneath the southwestern
corner of the site building. This area acts as a source for the groundwater plume that
must be addressed. While the results of the pre-design chemical oxidation pilot
indicate that chemical oxidation would likely be an effective remedial solution for the
groundwater plume if implemented in full-scale, the presence of a continuing source
area would undermine the effectiveness of the remedy and would likely lengthen the
remedial timeframe if not addressed.
7.3 LNAPL Distribution and Trends
LNAPL was present in monitoring wells MW-6R, MW-8, MW-16R, and MW-17R during
the initial sampling rounds, however, by July 2014 there were no measurable
thicknesses of LNAPL present in the Site wells. LNAPL characterization of a sample in
well MW-8 is consistent with gasoline. While presence of LNAPL at the Site was
consistent with detections of BTEX and other petroleum-related compounds in
groundwater, LNAPL trends in all of the wells appear to indicate that measurable levels
of LNAPL are no longer present in wells at the Site.
7.4 SVE System
Based on the indoor air and sub-slab soil vapor sampling results, it appears that
CVOCs in indoor air and in the sub-slab vapor have mainly decreased. The only sub-
slab soil vapor point of concern is SS-7. This soil vapor point showed increases in
CVOCs. This soil vapor point is located in the auto repair shop and its increase in
CVOCs is most likely attributed to a confounding source associated with auto-repair
activities taking place in the area. If the SVE system will remain in operation in its
current configuration during and after the remedial activities at the site, some
modification to the existing equipment could be made to minimize maintenance issues
and reduce the long-term energy usage.

g:\project\00266417.0000\file\summary report\pilot summary report final 7-2018.docx 8-1
Pre-Design Investigation Report
Crown Dykman (Site #130054) City of Glen Cove, New York
8. Recommendations
The following recommendations have been developed based upon the results of the
investigations discussed herein and the approach indicated as preferred by the
NYSDEC’s project representatives:
In the near term, it is recommended that an evaluation of remedial alternatives
to potentially implement at the site be conducted to identify the option which
will facilitate achievement of the established remedial objectives in the shortest
timeframe and most cost-effective manner that is practicable. The data
collected during the investigations described herein should be used as a basis
of this evaluation;
Since measurable levels of LNAPL are no longer present in wells at the Site, it
is recommended that implementation of the LNAPL recovery element of the
remedy, as identified in the ROD, be deferred for the present time;
The examination of the SVE system identified some potential equipment
modifications which could be implemented to alleviate certain recurring
maintenance issues. In addition, the qualitative energy usage analysis
indicated that the existing system could be retrofitted to provide long-term
energy savings. However, it is not recommended that any action to upgrade or
retrofit the SVE system be undertaken at this time. Instead, it is suggested
that the selection of the preferred remedial approach be completed first, as a
number of the potential remedial options will affect the SVE system and its
performance objectives. Subsequent to identification of the remedial
approach, improvements to the SVE system can be examined and evaluated
in the context of the overall remedy, and any enhancements to it can be
designed and implemented as part of the remedial construction.

g:\project\00266417.0000\file\summary report\pilot summary report final 7-2018.docx 9-1
Pre-Design Investigation Report
Crown Dykman (Site #130054) City of Glen Cove, New York
9. References
ARCADIS/Malcolm Pirnie, 2012a. “In-situ Chemical Oxidation Pilot Test Work Plan.”
Crown Dykman Site, Glen Cove, New York; ARCADIS/Malcolm Pirnie, Inc., for: New
York State Department of Environmental Conservation, Division of Environmental
Remediation, January 2012.
ARCADIS/Malcolm Pirnie, 2012b. “Chemical Oxidation Pilot Study Summary
(DRAFT).” Crown Dykman Site, Glen Cove, New York; ARCADIS/Malcolm Pirnie, Inc.,
for: New York State Department of Environmental Conservation, Division of
Environmental Remediation, August 2012.
Cadwell, D.H., and others, 1986. Surficial Geologic Map of New York, Lower Hudson
sheet: New York State Museum – Geological Survey, Map and Chart Series # 40,
scale 1:250,000.
EEA, Inc., 1991. “Revised Work Plan for site Investigation and Remediation at 60 Herb
Hill Road, Glen Cove, New York.” Energy and Environmental Analysts, Inc., 1991.
EEA, 1996. “Remedial Investigation/ Feasibility Study (RI/FS).” (Crown Dykman site,
Glen Cove, New York); Energy and Environmental Analysts, Inc., 1996.
EEA, 1997a, “Site Investigation Prior to Performing Interim Remediation at the Crown
Dykman site, Glen Cove, New York.” (Crown Dykman site, Glen Cove, New York);
Energy and Environmental Analysts, Inc., 1997.
EEA, 1997b, “Results of the Remedial Investigation at the Crown Dykman site, Glen
Cove, New York.” (Crown Dykman site, Glen Cove, New York); Energy and
Environmental Analysts, Inc., 1997.
EEA, 1999, “Remedial Investigation/ Feasibility Study (RI/FS).” (Crown Dykman site,
Glen Cove, New York); Energy and Environmental Analysts, Inc., 1999.
EEA, 2000, “Results of the Interim Remediation at the Crown Dykman site.” (Crown
Dykman site, Glen Cove, New York); Energy and Environmental Analysts, Inc., 2000.
Fischer, D.W., Isachsen, Y.W., and Rickard, L.V., 1970. Geologic Map of New York,
Lower Hudson sheet: New York State Museum and Science Service Map and Chart
Series No. 15, 6 sheets, scale 1:250,000.

g:\project\00266417.0000\file\summary report\pilot summary report final 7-2018.docx 9-2
Pre-Design Investigation Report
Crown Dykman (Site #130054) City of Glen Cove, New York
Kilburn, C., 1979. “Hydrogeology of the Town of North Hempstead, Nassau County,
Long Island, New York”: Long Island Water Resources Bulletin 12, 87 p., scale
approx.1:107,000.
Kilburn, C., and Krulikas, R.K., 1987. “Hydrogeology and groundwater quality of the
northern part of the Town of Oyster Bay, Nassau County, Long Island, in 1980”: U.S.
Geological Survey Water-Resources Investigations Report 85–4051, 61pp.
Malcolm Pirnie, 2006. “Pre-project Management Work Plan Investigation Results” –
Crown Dykman Site (Site #1-30-054), Glen Cove, New York. Malcolm Pirnie, Inc.,
September 2006.
Malcolm Pirnie, 2009a. Remedial Investigation Report – Crown Dykman Site (Site #1-
30-054), Glen Cove, New York. Malcolm Pirnie, Inc., December 2009.
Malcolm Pirnie, 2009b. Feasibility Study – Crown Dykman Site (Site #1-30-054), Glen
Cove, New York. Malcolm Pirnie, Inc., December 2009.
Smolensky, D.A., Buxton, H.T., and Shernoff, K., 1989. “Hydrologic framework of Long
Island, New York.” U.S. Geol. Surv. hydrologic investigation atlas, 1989.
Walden, 2006. “On-Site Source area Removal Interim Remedial Measure (IRM)
Report.” (Crown Dykman site, Glen Cove, New York); Walden Environmental
Engineering, PLLC. June 2006.
Weston, 1997. “Final site Inspection Report.” (Crown Dykman site, Glen Cove, New
York); Roy F. Weston, Inc., 1997.

Figures
Pre‐Design Investigation Report
Crown Dykman (Site #130054)Glen Cove, Nassau County, New York

Pre‐Design Investigation ReportCrown Dykman (NYSDEC Site No.130054)
Glen Cove, New York
Figure 1Site Location
SITE
N
Approximate Scale in Miles
0 0.25 0.75 1.00.50

MW-23S
MW-2
FIGURE
Pre-Design Investigation ReportCrown Dykman
(NYSDEC Site No.130054)Glen Cove, New York
LEGEND
CHAIN-LINK FENCE
WOOD-PICKET FENCE
PROPERTY BOUNDARY (SURVEY)
MW-13 GROUNDWATER MONITORING WELL
GM-1 DAMAGED/MISSING WELL LOCATION
2005 IRM EXCAVATION AREA/ SVE SYSTEM SUB-SLAB PIPING
W
W
W
MW-20
Volvo Repair Garage
Laundry Facility
Laundry Facility
MW-16R
MW-17R
MW-19
MW-15R
MW-14R
MW-6R
MW-10S
MW-10D
MW-11
MW-8
GM-9
MW-5
MW-3
MW-4
GM-1MW-7
MW-23DMW-1D
MW-1DDMW-1
MW-25S
MW-25DMW-21S
MW-21D
MW-22(R)S
MW-22(R)DMW-24
MW-9
MP-20
MW-12MW-13
IW-01S
IW-01D
MW-22S
MW-22D
Storage Area
MW-18
MW-29
MW-27
MW-26
MW-28
N
Approximate Scale in Feet
0 30 60
IW-01S PERMANGANATE INJECTION WELL
W UNDERGROUND UTILITY ACCESS (WATER)
Site Plan
2

Pre‐Design Investigation ReportCrown Dykman (NYSDEC Site No.130054)
Glen Cove, New York
MW-5
NMW-4
SB-20
SB-23
SB-9
SB-8
SB-6
SB-5
SB-4
SB-3
SB-7
SB-2
SB-11
SB-21
SB-12
SB-26SB-1
SB-18
SB-16
SB-17SB-14
SB-19
SB-13
SB-22
MW-18
MW-22SMW-22D
MW-1MW-1D
MW-1DDMW-23D
MW-23SMW-7
MW-13
MW-8
MW-11
MW-24
GM-9
MW-12
MW-21SMW-21D
IW-1SIW-1D
MW-10S
MW-10D
MW-22(R)D
MW-22(R)S
MW-25D
MW-25S
Figure 3aGeologic Cross‐Section Location
(Cross‐Section N‐S)
N
S

FIGURE
Pre-Design Investigation ReportCrown Dykman
(NYSDEC Site No.130054)Glen Cove, New York
Geologic Cross-Section (North-South)
3b
NOTES
1. CROSS-SECTION INFORMATION FROM 2008-2009REMEDIAL INVESTIGATION DATA, INCLUDINGDIRECT-PUSH SOIL BORINGS ANDGROUNDWATER MONITORING WELL BORINGLOGS (MALCOLM PIRNIE, INC, 2009a).
2. GROUNDWATER ELEVATIONS FROM NOVEMBER2013 POST-PILOT GROUNDWATER SAMPLINGEVENT.
ELE
VA
TIO
N (
FE
ET
±M
SL)
MONITORING WELL
SB-22
SOIL BORING
IDENTIFIER
BORING
IDENTIFIER
RISER
SCREENED INTERVAL
LEGEND
SB-09SB-08 SB-06 MW-11 SB-05 MW-08 SB-04
MW-13SB-13 IW-01S SB-17 MW-25D SB-14
SB-19
IW-01D
MW-1DD
MEDIUM TO COARSE SAND
FINE SAND
SILTY FINE SAND
SILT AND CLAYEY SILT
STRATIGRAPHY
HARBOR HILL GROUND MORAINE (INCLUDES FILL)
CLAY (PORT WASHINGTON UNIT)
WOOD SLAT FENCE
CROWN DYKMAN BUILDINGBLOCK
OUTBUILDING
HERBHILLROAD
RETAININGWALL
20
25
10
15
0
5
-10
-5
-20
-15
-30
-25
-35
20
25
10
15
0
5
-10
-5
-20
-15
-30
-25
-35
N S
APPROXIMATE SCALE IN FEET (1” = 12.5’)NO VERTICAL EXAGGERATION
0 12.5 25
MW-08
ISCO INJECTION WELL
IDENTIFIER
RISER
INJECTION INTERVAL
IW-01S
GROUNDWATER TABLE (DASHED WHERE INFERRED)
WELL WATER LEVEL OBSERVATION
MW-25SMW-1D
MW-1

MW-24MW-25D
MW-25S
IW-01SIW-01D
MW-1
MW-22(R)S
MW-22(R)D
MW-1D
Pre-Design Investigation ReportCrown Dykman (NYSDEC Site No.130054)
Glen Cove, New York
MW-26
MW-27MW-28
MW-29
N
APPROXIMATE SCALE IN FEET
0 20 40
LEGEND
MONITORING WELL
PILOT INJECTION WELLS
WOODEN-SLAT FENCE
CHAIN-LINK FENCE
Figure 4Port Washington Clay Surface
(Top of First Confining Unit)
TOP OF CLAY ELEVATION ISOCONTOUR(FEET AMSL)
-15
0

FIGURE
Pre-Design Investigation ReportCrown Dykman
(NYSDEC Site No.130054)Glen Cove, New York
MW-1
W
W
W
GM-9
MW-12
MW-8
MW-11
MW-13
MW-21D
MW-21SMW-24
MW-9
MW-22D
MW-22S
MP-20
MW-1D
MW-1DD
MW-23S
MW-23D
MW-7
MW-2
GM-1
MW-10S
MW-10D
MW-6R MW-17R
MW-20
MW-19
MW-15R
MW-14RMW-16R
MW-18
LEGEND
CHAIN-LINK FENCE
WOOD-PICKET FENCE
PROPERTY BOUNDARY (SURVEY)
MW-9 GROUNDWATER MONITORING WELL
W
N
APPROXIMATE SCALE IN FEET (1” = 25’)
0 25 50
Groundwater Potentiometric Surface Shallow Wells
July 2014
5a
1616
10.3311.39
11.16
13.04
14.30
16.9916.26
15.09
14.82
14.30
13.93
14.34
14.08
14.10
13.84
15.31
POTENTIOMETRIC CONTOUR (Feet AMSL)
GROUNDWATER ELEVATION (Feet AMSL)
16.99
APPROXIMATE GROUNDWATER FLOW DIRECTION
17

FIGURE
Pre-Design Investigation ReportCrown Dykman
(NYSDEC Site No.130054)Glen Cove, New York
MW-1
W
W
W
GM-9
MW-12
MW-8
MW-11
MW-13
MW-21D
MW-21SMW-24
MW-9
MW-22D
MW-22S
MP-20
MW-1D
MW-1DD
MW-23S
MW-23D
MW-7
MW-2
GM-1
MW-10S
MW-10D
MW-6R MW-17R
MW-20
MW-19
MW-15R
MW-14RMW-16R
MW-18
LEGEND
CHAIN-LINK FENCE
WOOD-PICKET FENCE
PROPERTY BOUNDARY (SURVEY)
MW-9 GROUNDWATER MONITORING WELL
W
N
APPROXIMATE SCALE IN FEET (1” = 25’)
0 25 50
5b
Groundwater Potentiometric SurfaceDeep WellsJuly 2014
13121111
1213
10.34
10.33
14.0613.09
10.44
POTENTIOMETRIC CONTOUR (Feet AMSL)
GROUNDWATER ELEVATION (Feet AMSL)
13.09
APPROXIMATE GROUNDWATER FLOW DIRECTION
13

FIGURE
Pre-Design Investigation ReportCrown Dykman
(NYSDEC Site No.130054)Glen Cove, New York
MW-1
W
W
W
APPROXIMATE SCALE IN FEET (1” = 25’)
0 25 50
GM-9
MW-12
MW-8
MW-11
MW-13
MW-21D
MW-21S
MW-24
MW-22D
MW-22S
MP-20
MW-1D
MW-1DD
MW-23S
MW-23D
MW-7
MW-2
GM-1
MW-10S
MW-10D
MW-6R MW-17R
MW-20
MW-19
MW-15R
MW-14RMW-16R
MW-18
W
Concrete Vault
Flooded Depression
MW-9WETLAND AREA
MW-22(R)D
MW-22(R)S
MW-25SMW-25D
IW-01SIW-01D
LEGEND
CHAIN-LINK FENCE
WOOD-PICKET FENCE
PROPERTY BOUNDARY (SURVEY)
MW-9 GROUNDWATER MONITORING WELL
MW-18 DAMAGED/MISSING WELL LOCATION
N
6
Data Qualifiers:
a) D – Based on dilution of original sample.
b) J – Result is estimated value, as result isbelow reporting limit for respectivecompound.
c) Indicates that compoundexceeds the respective NYSDEC ClassGA standard or guidance value.
Summary of Detected Compounds in Groundwater – Baseline Sampling
(August 2014)

Pre-Design Investigation ReportCrown Dykman (NYSDEC Site No.130054)
Glen Cove, New York
MW-24MW-25D
MW-25S
IW-01SIW-01D
MW-1
MW-22(R)S
MW-22(R)D
MW-1D
APPROXIMATE SCALE IN FEET
0 20 40
LEGEND
MONITORING WELL(PCE Concentration – ug/L)
DAMAGED/MISSING WELL
PILOT INJECTION WELLS
WOODEN-SLAT FENCE
CHAIN-LINK FENCE
MW-18
Figure 7aTetrachloroethene (PCE) in Groundwater
August 2013
CONCENTRATIONISOCONTOUR(ug/L)
290 D
50 UD
11
40 U
50 UD
570 D
57 D81 D
7.4
7,900 D
7,000 D
8.8
1,100 D
470
210 D
MW-24290 D
N
DATA QUALIFIERS:
D – Compound analyzed under dilution factor
UD – Compound not detected at dilution factor; reporting limit shown
JD – Compound value estimated at dilution factor
U – Compound undetected; reporting limit shown

Pre-Design Investigation ReportCrown Dykman (NYSDEC Site No.130054)
Glen Cove, New York
MW-24MW-25D
MW-25S
IW-01SIW-01D
MW-1
MW-22(R)S
MW-22(R)D
MW-1D
APPROXIMATE SCALE IN FEET
0 20 40
LEGEND
MONITORING WELL(TCE Concentration – ug/L)
DAMAGED/MISSING WELL
PILOT INJECTION WELLS
WOODEN-SLAT FENCE
CHAIN-LINK FENCE
MW-18
Figure 7bTricholorethene (TCE) in Groundwater
August 2013
CONCENTRATIONISOCONTOUR(ug/L)
150
50 UD
1 U
38 JD
50 UD
300 D
67 D40 D
9
2,200 D
7,800 D
6.9
1,100 D
230
130 D
MW-24150
N
DATA QUALIFIERS:
D – Compound analyzed under dilution factor
UD – Compound not detected at dilution factor; reporting limit shown
JD – Compound value estimated at dilution factor
U – Compound undetected; reporting limit shown

Pre-Design Investigation ReportCrown Dykman (NYSDEC Site No.130054)
Glen Cove, New York
MW-24MW-25D
MW-25S
IW-01SIW-01D
MW-1
MW-22(R)S
MW-22(R)D
MW-1D
N
APPROXIMATE SCALE IN FEET
0 20 40
LEGEND
MONITORING WELL(DCE Concentration – ug/L)
DAMAGED/MISSING WELL
PILOT INJECTION WELLS
WOODEN-SLAT FENCE
CHAIN-LINK FENCE
MW-18
Figure 7cCis-1,2-Dichloroethene (DCE) in Groundwater
August 2013
CONCENTRATIONISOCONTOUR(ug/L)
1,200 D
3,400 D
1 U
2,400 D
4,800 D
1,700 D
470 D
2,400 D
71
40,000 D
51,000 D
48
6,200 D
1,400
730 D
MW-241,200 D
1,000
1,000
DATA QUALIFIERS:
D – Compound analyzed under dilution factor
UD – Compound not detected at dilution factor; reporting limit shown
JD – Compound value estimated at dilution factor
U – Compound undetected; reporting limit shown

Pre-Design Investigation ReportCrown Dykman (NYSDEC Site No.130054)
Glen Cove, New York
MW-24MW-25D
MW-25S
IW-01SIW-01D
MW-1
MW-22(R)S
MW-22(R)D
MW-1D
APPROXIMATE SCALE IN FEET
0 20 40
LEGEND
MONITORING WELL(VC Concentration – ug/L)
DAMAGED/MISSING WELL
PILOT INJECTION WELLS
WOODEN-SLAT FENCE
CHAIN-LINK FENCE
MW-18
Figure 7dVinyl Chloride (VC) in Groundwater
August 2013
CONCENTRATIONISOCONTOUR(ug/L)
49 D
98 D
1 U
40 UD
50 UD
170 D
67 D73 D
8.1
4,500 D
3,000 D
5.3 UD
26 D
87
110 D
MW-2449 D
N
DATA QUALIFIERS:
D – Compound analyzed under dilution factor
UD – Compound not detected at dilution factor; reporting limit shown
JD – Compound value estimated at dilution factor
U – Compound undetected; reporting limit shown

FIGURE
MW-1
W
W
W
N
APPROXIMATE SCALE IN FEET (1” = 25’)
0 25 50
GM-9
MW-12
MW-8
MW-11
MW-13
MW-21D
MW-21S
MW-24
MW-22D
MW-22S
MP-20
MW-1D
MW-1DD
MW-23S
MW-23D
MW-7
MW-2
GM-1
MW-10D
MW-17R
MW-20
MW-19
MW-15R
MW-14RMW-16R
MW-18
W
Concrete Vault
Flooded
Depression
MW-9
WETLAND
AREA
MW-22(R)D
MW-22(R)S
MW-25SMW-25D
IW-01S
IW-01D
LEGEND
CHAIN-LINK FENCE
WOOD-PICKET FENCE
PROPERTY BOUNDARY
(SURVEY)
MW-9 GROUNDWATER
MONITORING WELL
APPROXIMATE PROPOSED
TREATMENT AREA
(Crown Dykman Record of Decision)
GM-1 DAMAGED/MISSING
WELL LOCATION
APPROXIMATE 2005 IRM
EXCAVATION AREA/ SVE PIPING
Pre-Design Investigation Report
Crown Dykman
(NYSDEC Site No.130054)
Glen Cove, New York
MW-10S
MW-6R
MW-29
MW-27
MW-26
MW-28 IW-01D
SODIUM PERMANGANATE
INJECTION WELL
ISCO Pilot Study Area
8

FIGURE
Pre-Design Investigation ReportCrown Dykman
(NYSDEC Site No.130054)Glen Cove, New York
Sodium Permanganate Pilot Injection System Schematic
9
LEGEND
FLOW METER
FLOW CONTROL/ CUTOFF VALVE
PRESSURE GAUGE
IW-01D IW-01S
SODIUM PERMANGANATE STOCK SOLUTION TANK
(40% SOLUTION)
SECONDARY CONTAINMENT
MIXING/ INJECTION TANK
MIXING/ INJECTION
TANK
DIAPHRAGM PUMP
DIAPHRAGM PUMP
FLOW METERS
PRESSURE GAUGE
OVERFLOW CONTAINMENT
SECONDARY CONTAINMENT
MIXING/ INJECTION
TANK
IW-01D
IW-01D
IW-01S
OVERFLOW CONTAINMENT
SECONDARY CONTAINMENT
AIR COMPRESSOR

Pre-Design Investigation ReportCrown Dykman (NYSDEC Site No.130054)
Glen Cove, New York
Figure 10aDissolved Oxygen and Oxidation-Reduction
Potential Trends – Well MW-1

Pre-Design Investigation ReportCrown Dykman (NYSDEC Site No.130054)
Glen Cove, New York
Figure 10bDissolved Oxygen and Oxidation-Reduction
Potential Trends – Well MW-1D

Pre-Design Investigation ReportCrown Dykman (NYSDEC Site No.130054)
Glen Cove, New York
Figure 10cDissolved Oxygen and Oxidation-Reduction
Potential Trends – Well MW-1DD

Pre-Design Investigation ReportCrown Dykman (NYSDEC Site No.130054)
Glen Cove, New York
Figure 10dDissolved Oxygen and Oxidation-Reduction
Potential Trends – Well MW-10S

Pre-Design Investigation ReportCrown Dykman (NYSDEC Site No.130054)
Glen Cove, New York
Figure 10eDissolved Oxygen and Oxidation-Reduction
Potential Trends – Well MW-10D

Pre-Design Investigation ReportCrown Dykman (NYSDEC Site No.130054)
Glen Cove, New York
Figure 10fDissolved Oxygen and Oxidation-Reduction
Potential Trends – Well MW-13

Pre-Design Investigation ReportCrown Dykman (NYSDEC Site No.130054)
Glen Cove, New York
Figure 10gDissolved Oxygen and Oxidation-Reduction
Potential Trends – Well MW-25S

Pre-Design Investigation ReportCrown Dykman (NYSDEC Site No.130054)
Glen Cove, New York
Figure 10hDissolved Oxygen and Oxidation-Reduction
Potential Trends – Well MW-25D

N
Pre-Design Investigation Report Crown Dykman
(NYSDEC Site No.130054)Glen Cove, New York
LEGEND
CHAIN-LINK FENCE
WOOD-PICKET FENCE
PROPERTY BOUNDARY (SURVEY)
MW-9 GROUNDWATER MONITORING WELL
MW-18 DAMAGED/MISSING WELL LOCATION
SVE SYSTEM SUB-SLAB PIPING
Approximate Scale in Feet
0 30 60
W
W
W
MW-20
Volvo Repair Office
Laundry Facility
Laundry Facility
MW-16R
MW-17R
MW-19
MW-15R
MW-14R
MW-6R
MW-10S
MW-10D
MW-11
MW-8
GM-9
MW-5
MW-3
MW-4
MW-2
GM-1MW-7
MW-23D
MW-23S
MW-1D
MW-1DDMW-1
MW-25S
MW-25DMW-21S
MW-21D
MW-22(R)S
MW-22(R)DMW-24
MW-9
MP-20
MW-12MW-13
IW-01S
IW-01D
MW-22S
MW-22D
Storage Area
MW-18
MW-29
MW-27
MW-26
MW-28
FIGURE
Summary of Detected CVOCs in Groundwater
Baseline and Post‐Injection Sampling Rounds
Data Qualifiers:
a) D – Based on dilution of original sample.
b) J – Result is estimated value, as result is belowreporting limit for respective compound.
c) U – Result is not detected, Reporting limitprovided.
d) NA – Not Analyzed
e) Indicates that compound exceeds therespective NYSDEC Class GA standard orguidance value.
PI – POST INJECTION SAMPLING EVENT
NS – NOT SAMPLED
NS – NOT SAMPLED DUE TO THE PRESENCE OF PERMANGANATE
*All concentrations reported in ug/l*
11

Pre-Design Investigation ReportCrown Dykman (NYSDEC Site No.130054)
Glen Cove, New York
Figure 12aCVOC Trends in Groundwater – Well MW-1

Pre-Design Investigation ReportCrown Dykman (NYSDEC Site No.130054)
Glen Cove, New York
Figure 12bCVOC Trends in Groundwater – Well MW-1D

Pre-Design Investigation ReportCrown Dykman (NYSDEC Site No.130054)
Glen Cove, New York
Figure 12cCVOC Trends in Groundwater – Well MW-1DD

Pre-Design Investigation ReportCrown Dykman (NYSDEC Site No.130054)
Glen Cove, New York
Figure 12dCVOC Trends in Groundwater – Well MW-10S

Pre-Design Investigation ReportCrown Dykman (NYSDEC Site No.130054)
Glen Cove, New York
Figure 12eCVOC Trends in Groundwater – Well MW-10D

Pre-Design Investigation ReportCrown Dykman (NYSDEC Site No.130054)
Glen Cove, New York
Figure 12fCVOC Trends in Groundwater – Well MW-13

Pre-Design Investigation ReportCrown Dykman (NYSDEC Site No.130054)
Glen Cove, New York
Figure 12gCVOC Trends in Groundwater – Well MW-25S

Pre-Design Investigation ReportCrown Dykman (NYSDEC Site No.130054)
Glen Cove, New York
Figure 12hCVOC Trends in Groundwater – Well MW-25D

N
Pre-Design Investigation Report Crown Dykman
(NYSDEC Site No.130054)Glen Cove, New York
LEGEND
CHAIN-LINK FENCE
WOOD-PICKET FENCE
PROPERTY BOUNDARY (SURVEY)
MW-9 GROUNDWATER MONITORING WELL
MW-18 DAMAGED/MISSING WELL LOCATION
SVE SYSTEM SUB-SLAB PIPING
Approximate Scale in Feet
0 30 60
W
W
W
MW-20
Volvo Repair Office
Laundry Facility
Laundry Facility
MW-16R
MW-17R
MW-19
MW-15R
MW-14R
MW-6R
MW-10S
MW-10D
MW-11
MW-8
GM-9
MW-5
MW-3
MW-4
MW-2
GM-1MW-7
MW-23D
MW-23S
MW-1D
MW-1DDMW-1
MW-25S
MW-25DMW-21S
MW-21D
MW-22(R)S
MW-22(R)DMW-24
MW-9
MP-20
MW-12MW-13
IW-01S
IW-01D
MW-22S
MW-22D
Storage Area
MW-18
MW-29
MW-27
MW-26
MW-28
FIGURE
Summary of Detected Non‐CVOC Compounds in Groundwater
Baseline and Post‐Injection Sampling Rounds
Data Qualifiers:
a) D – Based on dilution of original sample.
b) J – Result is estimated value, as result is belowreporting limit for respective compound.
c) U – Result is not detected, Reporting limitprovided.
d) NA – Not Analyzed
e) Indicates that compound exceeds therespective NYSDEC Class GA standard orguidance value.
PI – POST INJECTION SAMPLING EVENT
NS – NOT SAMPLED
NS – NOT SAMPLED DUE TO THE PRESENCE OF PERMANGANATE
*All concentrations reported in ug/l*
13

N
Pre-Design Investigation Report Crown Dykman
(NYSDEC Site No.130054)Glen Cove, New York
LEGEND
CHAIN-LINK FENCE
WOOD-PICKET FENCE
PROPERTY BOUNDARY (SURVEY)
MW-9 GROUNDWATER MONITORING WELL
MW-18 DAMAGED/MISSING WELL LOCATION
SVE SYSTEM SUB-SLAB PIPING
Approximate Scale in Feet
0 30 60
W
W
W
MW-20
Volvo Repair Office
Laundry Facility
Laundry Facility
MW-16R
MW-17R
MW-19
MW-15R
MW-14R
MW-6R
MW-10S
MW-10D
MW-11
MW-8
GM-9
MW-5
MW-3
MW-4
MW-2
GM-1MW-7
MW-23D
MW-23S
MW-1D
MW-1DDMW-1
MW-25S
MW-25DMW-21S
MW-21D
MW-22(R)S
MW-22(R)DMW-24
MW-9
MP-20
MW-12MW-13
IW-01S
IW-01D
MW-22S
MW-22D
Storage Area
MW-18
MW-29
MW-27
MW-26
MW-28
FIGURE
Summary of LNAPL Thickness from2008 to 2014
14

MW-18
FIGURE
Pre-Design Investigation ReportCrown Dykman
(NYSDEC Site No.130054)Glen Cove, New York
MW-1
W
W
W
APPROXIMATE SCALE IN FEET (1” = 25’)
0 25 50
GM-9
MW-12
MW-8
MW-11
MW-13
MW-21D
MW-21S
MW-24
MW-22D
MW-22S
MP-20
MW-1D
MW-1DD
MW-23S
MW-23D
MW-7
MW-2
GM-1
MW-10S
MW-10D
MW-6R
MW-17R
MW-20
MW-19
MW-15R
MW-14RMW-16R
W
Concrete Vault
Flooded Depression
MW-9WETLAND AREA
MW-22(R)D
MW-22(R)S
MW-25SMW-25D
IW-01SIW-01D
LEGEND
CHAIN-LINK FENCE
WOOD-PICKET FENCE
PROPERTY BOUNDARY (SURVEY)
MW-9 GROUNDWATER MONITORING WELL
N
APPROXIMATE 2005 IRM EXCAVATION AREA/ SVE PIPING
MW-29
MW-27
MW-26
MW-28
15
Summary of Detected Compounds in Soil –July 2014
Data Qualifiers:
a) D – Based on dilution of original sample.
b) J – Result is estimated value, as result is below reporting limit for respective compound.
c) U – Result is not detected, Reporting limitprovided.
d) NA – Not Analyzed
e) Exceeds NYSDEC Unrestricted SoilCleanup Standards
f) Exceeds NYSDEC Commercial SoilCleanup Standards
*All concentrations reported in mg/Kg*

N
Pre-Design Investigation Report Crown Dykman
(NYSDEC Site No.130054)Glen Cove, New York
LEGEND
CHAIN-LINK FENCE
WOOD-PICKET FENCE
PROPERTY BOUNDARY (SURVEY)
MW-9 GROUNDWATER MONITORING WELL
MW-18 DAMAGED/MISSING WELL LOCATION
SVE SYSTEM SUB-SLAB PIPING
Approximate Scale in Feet
0 30 60
W
W
W
MW-20
Volvo Repair Office
Laundry Facility
Laundry Facility
MW-16R
MW-17R
MW-19
MW-15R
MW-14R
MW-6R
MW-10S
MW-10D
MW-11
MW-8
GM-9
MW-5
MW-3
MW-4
MW-2
GM-1MW-7
MW-23D
MW-23S
MW-1D
MW-1DDMW-1
MW-25S
MW-25DMW-21S
MW-21D
MW-22(R)S
MW-22(R)DMW-24
MW-9
MP-20
MW-12MW-13
IW-01S
IW-01D
MW-22S
MW-22D
Storage Area
MW-18
MW-29
MW-27
MW-26
MW-28
FIGURE
Supplemental Investigation Groundwater Analytical Summary –
July 2014
Data Qualifiers:
a) D – Based on dilution of original sample.
b) J – Result is estimated value, as result is belowreporting limit for respective compound.
c) U – Result is not detected, Reporting limitprovided.
d) NA – Not Analyzed
e) Indicates that compound exceeds therespective NYSDEC Class GA standard orguidance value.
PI – POST INJECTION SAMPLING EVENT
NS – NOT SAMPLED
NS – NOT SAMPLED DUE TO THE PRESENCE OF PERMANGANATE
*All concentrations reported in ug/l*
16

FIGURE
Pre-Design Investigation Report
Crown Dykman
(NYSDEC Site No.130054)
Glen Cove, New York
Soil Vapor Extraction System Piping Schematic
17
LEGEND
0 5 10 15 ft
APPROXIMATE SCALE
PVC SUBVENTING
STUBBED UP AT WALL
TRENCH FILLED
WITH CONCRETE
2” PERFORATED
PVC PIPE
LIMITS OF NEW
CONCRETE
TRUNK 4
TR
UN
K 5
TRUNK 4A TRUNK 3TRUNK 2 TRUNK 1A
TRUNK 1
STORAGE
ROOM/ SUMP
BOILER
ROOM
WATER BASED LAUNDRY AUTO REPAIR SHOP
LAUNDRY STORAGE
STORAGE AREA
OFFICE
OFFICE/STORAGE
OVERHEAD DOOR
Source: June 2006 On-site Source Area Removal IRM Report, Walden Associates
AREA OF SUB-SLAB
EXCAVATION
WITH NEW CONCRETE FLOOR
2” PVC PIPING - SOILD
2” PVC PIPING - PERFORATED
CROWN DYKMAN BUILDING

W
W
WFIGURE
Pre-Design Investigation ReportCrown Dykman
(NYSDEC Site No.130054)Glen Cove, New York
APPROXIMATE SCALE IN FEET (1” = 25’)
0 25 50
W
Concrete Vault
Flooded Depression
Summary of Soil Vapor and Indoor Air Analytical Results (January 2008 and November 2013)
18
NOTES
SS-1
SS-2
SS-3
SS-4
SS-5
SS-6
SS-7
SS-8
SS-9SS-10
IA-3
IA-2
IA-1
IA-4
IA-5
IA-6
SS-1CompoundPCE 5,492.76 42TCE 644.91 1.1 UVinyl Chloride 7.67 0.51 U
1/29/2008 11/19/2013
SS-2CompoundPCE 1,220.61 J 2.7
1/29/2008 11/20/2013
SS-4Compoundcis-1,2-DCE 37.3 16PCE 17,631.08 150trans-1,2-DCE 3.97 U 1.4TCE 521.3 12
1/29/2008 11/20/2013
SS-3Compoundcis-1,2-DCE 117 3.4 3.1PCE 28,480.98 110 120TCE 316 5.2 5.0
11/20/2013 11/21/20131/29/2008
SS-5CompoundPCE 140 J 2.2
11/20/20131/29/2008
SS-6CompoundPCE 91.7 11TCE 6.43 1.1 U
1/29/2008 11/20/2013
SS-7Compoundcis-1,2-DCE 3.97 U 2.6PCE 29.9 200TCE 2.69 U 5.1
1/29/2008 11/21/2013
SS-8CompoundPCE 8,137.42 J 750TCE 228 J 25
1/29/2008 11/20/2013
SS-9Compoundcis-1,2-DCE 2,498 1.2 UPCE 650,993.87 EJ 280trans-1,2-DCE 264 1.2 UTCE 11,285.89 3.1Vinyl Chloride 115 0.77 U
1/29/2008 11/20/2013
SS-10Compoundcis-1,2-DCE 833 0.79 UPCE 413,652.35 120trans-1,2-DCE 327 0.79 UTCE 12,898.16 1.1 UVinyl Chloride 13 0.51 U
11/20/20131/29/2008
IA-1Compoundcis-1,2-DCE 0.87 0.79 U 0.79 UPCE 16.2 1.4 U 1.4 UTCE 1.39 J 1.1 U 1.1 U
1/29/2008 11/20/2013 11/21/2013
IA-2Compoundcis-1,2-DCE 0.4 J 0.79 UPCE 7.13 1.4 UTCE 0.75 J 1.1 U
11/20/20131/29/2008
IA-3Compoundcis-1,2-DCE 0.95 0.79 UPCE 94.3 1.4 UTCE 6.59 1.1 U
1/29/2008 11/20/2013
IA-4CompoundPCE 5.43 2.8
1/29/2008 11/20/2013
IA-5CompoundPCE 2.38 1.4 UTCE 0.48 J 1.1 U
1/29/2008 11/20/2013
IA-6CompoundPCE 3.06 1.4 U
1/29/2008 11/20/2013
U - The compound was not detected at or above the indicated concentration.J - The concentration given is an approximate value.E - Indicates the analyte‘s concentration exceeds the calibrated range of the instrument for that specific analysis.NJ - Compound has been "tentatively identified"; associated value represents approximate concentration.
SS-3 and IA-1 sampled twice during 2013 event due to Summa malfunctions during first sampling run
All results in ug/m3 – 2013 results are preliminary, pending data validation.
LEGEND
CHAIN-LINK FENCE
WOOD-PICKET FENCE
PROPERTY BOUNDARY (SURVEY)
PERMENANT SUB-SLAB POINT
TEMPORARY SUB-SLAB POINT
INDOOR AIR POINTIA-5
SS-4
SS-6
N

Tables
Pre‐Design Investigation Report
Crown Dykman (Site #130054)Glen Cove, Nassau County, New York

(ft/day) (cm/sec) (ft/day) (cm/sec) (ft/day) (cm/sec)
MW-1S med-coarse sand 28 1.00E-02 35 1.25E-02 32 1.12E-02
MW-1D med-coarse sand 33 1.16E-02 20 7.12E-03 27 9.37E-03
MW-2 med-fine sand 7.5 2.63E-03 0.31 1.08E-04 3.9 1.37E-03
MW-3 med-fine sand 2.8 9.87E-04 1.7 6.17E-04 2.3 8.02E-04
MW-7 med-fine sand 3.0 1.05E-03 14 4.78E-03 8.3 2.91E-03
MW-9 fine silty sand 0.53 1.89E-04 0.29 1.04E-04 0.41 1.46E-04
GM-9 med-coarse sand 60 2.12E-02 104 3.67E-02 82 2.89E-02
MW-10S med-coarse sand 19 6.80E-03 1.8 6.42E-04 11 3.72E-03
MW-10D fine silty sand 0.34 1.20E-04 0.28 9.81E-05 0.31 1.09E-04
MP-20 fine silty sand 0.67 2.37E-04 1.2 4.16E-04 0.93 3.26E-04
47 1.65E-02 54 1.90E-02 50 1.78E-02
4.4 1.56E-03 5.2 1.83E-03 4.8 1.69E-03
0.52 1.82E-04 0.58 2.06E-04 0.55 1.94E-04
NOTE: values based on Bouwer and Rice slug testing analysis.
Hydraulic Testing Summary
Primary Unit
Table 1.
Average K (med-coarse sand):
Average K (med-fine sand):
Average K (fine silty sand):
Average (Rising/Falling)Rising Head TestFalling Head TestWell ID

Well ID
Ground Surface
Elevation
(Feet
AMSL)
Measuring Point
Elevation
(Feet AMSL)
Total Depth
(Feet
BGS)
Screen Top
Elevation
(Feet ± MSL)
Screen Bottom
Elevation
(Feet ± MSL)
Screen
Length
(Feet)
Well Diameter
(inches)Well Material
MW-26 NM NM 14.00 3.00 13.00 10 2 PVC
MW-27 NM NM 15.00 5.00 15.00 10 2 PVC
MW-28 NM NM 14.00 4.00 14.00 10 2 PVC
MW-29 NM NM 14.00 4.00 14.00 10 2 PVC
Table 2.
Summary of New Well Construction

Well Purge
Rate
(gpm)
Static Water
Level
(ft)
Depth to
Water at
Drawdown (ft)
Total Drawdown
(ft)
Specific Capacity
(gpm/ft)
2.25 5.78 9.97 4.19 0.54
2.25 5.78 9.42 3.64 0.62
2.25 5.78 8.96 3.18 0.71
2.25 5.78 8.50 2.72 0.83
2.25 5.78 8.25 2.47 0.91
2.25 5.78 7.90 2.12 1.06
2.25 5.78 7.71 1.93 1.17
2.25 5.81 7.42 1.61 1.40
2.25 5.81 7.31 1.50 1.50
2.25 5.81 7.09 1.28 1.76
2.25 5.8 6.98 1.18 1.91gpm/ft - gallons per minute, per foot of saturated thickness.
Table 3a. Injection Well IW-01S Drawdown and Estimated Well Specific Capacity
During Well Development.
0.00
0.50
1.00
1.50
2.00
2.50
Spe
cifi
c C
apac
ity
(gp
m/f
t)
Estimated Specific Capacity in Injection Well IW-01S
Start of Well Development
End of Well Development

Table 4
Summary of Basline TOC and COD Data
Sample ID
Depth or Screen Interval (feet)
Sampling Date
Units
General ChemistryChemical Oxygen Demand 14.5 11.3 13.2 58.3 15.7 62.1 5.5 J 15.7
Total Organic Carbon 2.7 2.4 2.6 11.5 2.4 11.2 3.0 5.1
* Guidance Value
**Sum of these compounds can not exceed 0.4 ug/L.
U - Compound not detected, Reporting Limit provided.
J - Estimated by Validator.
D - Result of diluted sample shown.
B - The analyte was found in an associated blank, as well as in the
sample.
ug/L ug/Lug/L ug/L ug/L ug/L ug/L ug/L
8/27/2013 8/27/20138/27/2013 8/26/2013 8/26/2013 8/26/2013 8/26/2013 8/26/2013
MW-21S MW-21DMW-1 MW-1D MW-1DD MW-10S MW-10D MW-13
Exceeds NYSDEC Class GA Standard or Guidance Value
G:\PROJECT\00266417.0000\FILE\Summary Report\Tables\Table 4 - Summary of Baseline COD and TOC.xlsx 1 of 2

Table 4
Summary of Basline TOC and COD Data
Sample ID
Depth or Screen Interval (feet)
Sampling Date
Units
General ChemistryChemical Oxygen Demand
Total Organic Carbon
* Guidance Value
**Sum of these compounds can not exceed 0.4 ug/L.
U - Compound not detected, Reporting Limit provided.
J - Estimated by Validator.
D - Result of diluted sample shown.
B - The analyte was found in an associated blank, as well as in the
sample.
Exceeds NYSDEC Class GA Standard or Guidance Value
18.9 37.5 26.3 12.6 18.6 11.0 14.5
3.4 5.1 9.2 3.3 3.0 2.7 3.7
ug/Lug/L ug/L ug/L ug/L
8/27/2013 8/27/20138/27/2013 8/27/2013 8/27/2013 8/27/2013
ug/L ug/L
8/27/2013
MW-25D MW-25S IW-01S IW-01DMW-22(R)S MW-22(R)D MW-24
G:\PROJECT\00266417.0000\FILE\Summary Report\Tables\Table 4 - Summary of Baseline COD and TOC.xlsx 2 of 2

Well ID Date ORP (mV) DO (mg/L)
8/27/2013 348 0.24
10/14/2013 16 0.00
11/21/2013 60 0.00
1/15/2014 4 0.00
7/10/2014 7 0.09
8/26/2013 84 0.14
10/14/2013 19 0.00
11/21/2013 133 0.00
1/14/2014 68 0.00
7/10/2014 66 0.11
8/26/2013 61 0.00
10/14/2013 61 0.00
11/21/2013 77 0.00
1/14/2014 101 0.33
7/10/2014 127 0.10
8/26/2013 -- --
10/14/2013 * *
11/22/2013 -95 0.00
1/15/2014 -91 0.00
7/15/2014 -58 0.17
8/26/2013 144 0.20
10/15/2013 3 5.73
11/22/2013 24 0.00
1/15/2014 47 0.00
7/14/2014 55 0.07
8/26/2013 290 0.06
10/15/2013 18 0.00
11/22/2013 122 0.00
1/15/2014 144 0.93
7/14/2014 70 0.12
8/27/2014 -- --
10/15/2013 -99 6.47
11/21/2013 157*** 0.48***
1/15/2014 93 2.37
7/9/2014 7 0.28
*Readings not collected due to the presence of product in well.
Table 5.
MW-1
MW-1D
*** Well went dry after intial purge. Only one round of parameters recorded.
**DO reading not recorded due to Horiba malfunction.
**** Readings not collected due to the presence of permanganate.
Notes:
MW-12
MW-1DD
MW-8
MW-10D
MW-10S
Summary of Well DO and ORP Data
--Well not sampled during Baseline event
1 of 3

Well ID Date ORP (mV) DO (mg/L)
Table 5.
MW-1
Summary of Well DO and ORP Data
8/26/2013 -22 0.14
10/15/2013 -70 **
11/21/2013 79 0.00
1/15/2014 -8 0.00
7/15/2014 -64 0.05
8/27/2014 -- --
10/15/2013 -89 **
11/21/2013 -94 0.00
1/15/2014 4 0.00
7/15/2014 -81 0.15
8/27/2013 402 0.14
10/14/2013 97 0.00
11/21/2013 -31 0.00
1/14/2014 253 3.29
7/14/2014 682 0.16
8/27/2013 396 0.20
10/14/2013 130 1.07
11/21/2013 -3 1.24
1/14/2014 158 6.56
7/17/2014 **** ****
8/26/2013 68 2.21
10/14/2013 -61 0.00
11/21/2013 54 0.95
1/14/2014 -69 0.00
7/9/2014 -27 0.00
8/26/2013 -12 1.15
10/14/2013 -72 0.00
11/21/2013 90 0.00
1/14/2014 -4 3.51
7/9/2014 -43 0.00
8/27/2014 -- --
10/14/2013 99 0.00
11/21/2013 167 0.00
1/14/2014 80 0.00
7/10/2014 52 0.21
*Readings not collected due to the presence of product in well.
MW-22(R)S
MW-23D
MW-13
MW-21S
MW-21D
MW-22(R)D
MW-14R
Notes:
--Well not sampled during Baseline event
**DO reading not recorded due to Horiba malfunction.
*** Well went dry after intial purge. Only one round of parameters recorded.
**** Readings not collected due to the presence of permanganate.
2 of 3

Well ID Date ORP (mV) DO (mg/L)
Table 5.
MW-1
Summary of Well DO and ORP Data
8/27/2014 -- --
10/14/2013 90 0.00
11/21/2013 295 0.00
1/14/2014 223 4.34
7/10/2014 208 0.26
8/27/2013 350 0.09
10/14/2013 -65 0.00
11/21/2013 72 0.00
1/14/2014 550 0.00
7/14/2014 31 0.00
8/26/2013 -17 0.75
10/15/2013 -146 *
11/22/2013 -45 0.00
1/14/2014 -44 0.00
7/14/2014 -46 0.00
8/26/2013 -33 3.00
10/15/2013 -158 *
11/22/2013 -108 0.00
1/14/2014 -76 0.00
7/14/2014 **** ****
*Readings not collected due to the presence of product in well.
MW-24
MW-25D
MW-25S
MW-23S
Notes:
--Well not sampled during Baseline event
**DO reading not recorded due to Horiba malfunction.
*** Well went dry after intial purge. Only one round of parameters recorded.
**** Readings not collected due to the presence of permanganate.
3 of 3

Table 6.
Groundwater Analytical Data Summary
Sample ID NYSDEC Class GA
Depth or Screen Interval (feet) Standard or
Sampling Date Guidance Value
Units ug/L
VOCs
1,1,1,2-Tetrachloroethane 5 80 UD 10 U 20 U 50 UD 10 UD
1,1,1-Trichloroethane 5 80 UD 40 UD 20 U 10 U 20 U 20 U 50 UD 50 U 25 U 20 U 10 UD 13 UD 4.0 U
1,1,2,2-Tetrachloroethane 5 80 UD 40 UD 20 U 10 U 20 U 20 U 50 UD 50 U 25 U 20 U 10 UD 13 UD 4.0 U
1,1,2-Trichloro-1,2,2-trifluoroethane 40 UD 20 U 10 U 20 U 50 UD 50 U 25 U 20 U 13 UD 4.0 U
1,1,2-Trichloroethane 1 80 UD 40 UD 20 U 10 U 20 U 20 U 50 UD 50 U 25 U 20 U 10 UD 13 UD 4.0 U
1,1-Dichloroethane 5 80 UD 40 UD 20 U 10 U 20 U 20 U 50 UD 50 U 25 U 20 U 10 UD 13 UD 4.0 U
1,1-Dichloroethene 5 80 UD 40 UD 20 U 10 U 20 U 20 U 50 UD 50 U 25 U 20 U 10 UD 13 UD 4.0 U
1,2,3-Trichlorobenzene 5 80 UD 40 UD 20 U 50 UD 10 UD 13 UD
1,2,4-Trichlorobenzene 5 80 UD 40 UD 20 U 10 U 20 U 20 U 50 UD 50 U 25 U 20 U 10 UD 13 UD 4.0 U
1,2-Dibromo-3-Chloropropane 0.04 80 UD 80 UD 20 U 10 U 20 U 20 U 50 UD 50 U 25 U 20 U 10 UD 25 UD 4.0 U
1,2-Dibromoethane 5 80 UD 40 UD 20 U 10 U 20 U 20 U 50 UD 50 U 25 U 20 U 10 UD 13 UD 4.0 U
1,2-Dichlorobenzene 5 80 UD 40 UD 20 U 10 U 20 U 20 U 50 UD 50 U 25 U 20 U 10 UD 13 UD 4.0 U
1,2-Dichloroethane 0.04 80 UD 40 UD 20 U 10 U 20 U 20 U 50 UD 50 U 25 U 20 U 10 UD 13 UD 4.0 U
1,2-Dichloropropane 5 80 UD 40 UD 20 U 10 U 20 U 20 U 50 UD 50 U 25 U 20 U 10 UD 13 UD 4.0 U
1,3-Dichlorobenzene 3 80 UD 40 UD 20 U 10 U 20 U 20 U 50 UD 50 U 25 U 20 U 10 UD 13 UD 4.0 U
1,4-Dichlorobenzene 0.6 80 UD 40 UD 20 U 10 U 20 U 20 U 50 UD 50 U 25 U 20 U 10 UD 13 UD 4.0 U
2-Butanone 1 800 UD 400 UD 100 U 100 U 200 U 200 U 500 UD 500 U 250 U 200 U 100 UD 130 UD 40 U
2-Hexanone 3 400 UD 400 UD 100 U 50 U 100 U 100 U 500 UD 250 U 130 U 100 U 50 UD 130 UD 20 U
4-Methyl-2-Pentanone 5 400 UD 400 UD 20 U 50 U 100 U 100 U 500 UD 250 U 130 U 100 U 50 UD 130 UD 20 U
Acetone 50 800 UD 400 UD 200 U 100 U 200 U 200 U 500 UD 500 U 250 U 200 U 100 UD 130 UD 40 U
Benzene 5 80 UD 40 UD 20 U 10 U 20 U 20 U 50 UD 50 U 25 U 20 U 10 UD 13 UD 4.0 U
Bromodichloromethane 5 80 UD 40 UD 20 U 10 U 20 U 20 U 50 UD 50 U 25 U 20 U 10 UD 13 UD 4.0 U
Bromoform 80 UD 40 UD 20 U 10 U 20 U 20 U 50 UD 50 U 25 U 20 U 10 UD 13 UD 4.0 U
Bromomethane 50* 80 UD 40 UD 20 U 10 U 20 U 20 U 50 UD 50 U 25 U 20 U 10 UD 13 UD 4.0 U
Carbon Disulfide 1 80 UD 40 UD 20 U 10 U 20 U 20 U 50 UD 50 U 25 U 20 U 10 UD 13 UD 4.0 U
Carbon Tetrachloride 5 80 UD 40 UD 20 U 10 U 20 U 20 U 50 UD 50 U 25 U 20 U 10 UD 13 UD 4.0 U
Chlorobenzene 5 80 UD 40 UD 20 U 10 U 20 U 20 U 50 UD 50 U 25 U 20 U 10 UD 13 UD 4.0 U
Chloroethane 50* 80 UD 40 UD 20 U 10 U 20 U 20 U 50 UD 50 U 25 U 20 U 10 UD 13 UD 4.0 U
Chloroform 50* 80 UD 40 UD 20 U 10 U 20 U 20 U 50 UD 50 U 25 U 20 U 10 UD 13 UD 4.0 U
Chloromethane 5 80 UD 40 UD 20 U 10 U 20 U 20 U 50 UD 50 U 25 U 20 U 10 UD 13 UD 4.0 U
cis-1,2-Dichloroethene 5 6200 D 690 D 970 630 1300 1400 3800 D 4800 1900 1300 730 D 490 D 240
cis-1,3-Dichloropropene 5 80 UD 40 UD 20 U 10 U 20 U 20 U 50 UD 50 U 25 U 20 U 10 UD 13 UD 4.0 U
Cyclohexane 80 UD 40 UD 20 U 10 U 20 U 20 U 50 UD 50 U 25 U 20 U 10 UD 13 UD 4.0 U
Dibromochloromethane 5 80 UD 40 UD 20 U 10 U 20 U 20 U 50 UD 50 U 25 U 20 U 10 UD 13 UD 4.0 U
Dichlorodifluoromethane 7 80 UD 40 UD 20 U 10 U 500 20 U 50 UD 50 U 25 U 500 10 UD 13 UD 4.0 U
Ethyl Benzene 5 80 UD 40 UD 20 U 10 U 20 U 20 U 50 UD 50 U 25 U 20 U 10 UD 13 UD 4.0 U
Isopropylbenzene 50 80 UD 40 UD 20 U 10 U 20 U 20 U 50 UD 50 U 25 U 20 U 10 UD 13 UD 4.0 U
Methyl Acetate 100 UD 20 U 10 U 20 U 500 UD 50 U 25 U 20 U 130 UD 4.0 U
Methyl tert-butyl Ether 5 80 UD 40 UD 50 U 20 U 50 UD 50 U 2.1 JD 13 UD
Methylcyclohexane 40 UD 20 U 50 U 20 U 50 UD 50 U 25 U 20 U 13 UD 4.0 U
Methylene Chloride 5 80 UD 40 UD 20 U 7.7 J 20 U 10 J 50 UD 50 U 25 20 U 6.2 JD 13 UD 4.0 U
Styrene 5 80 UD 40 UD 20 U 10 U 20 U 20 U 50 UD 50 U 25 U 20 U 10 UD 13 UD 4.0 U
Tert-Butyl Methyl Ether 5 20 U 2.0 J 20 U 50 U 25 U 20 U 1.0 J
Tetrachloroethene 5 1100 D 240 D 250 170 530 470 630 D 700 300 270 210 D 110 D 74
Toluene 5 80 UD 40 UD 20 U 10 U 20 U 20 U 50 UD 50 U 25 U 20 U 10 UD 13 UD 4.0 U
trans-1,2-Dichloroethene 5 80 UD 40 UD 20 U 10 U 20 U 20 U 22 JD 50 U 25 U 20 U 10 UD 2.4 J 4.0 U
trans-1,3-Dichloropropene 5 80 UD 40 UD 20 U 10 U 20 U 20 U 50 UD 50 U 25 U 20 U 10 UD 13 UD 4.0 U
Trichloroethene 5 1100 D 100 D 140 95 340 230 690 D 840 290 290 130 D 76 D 44
Trichlorofluoromethane 5 80 UD 40 UD 20 U 10 U 20 U 20 U 50 UD 50 U 25 U 20 U 10 UD 13 UD 4.0 U
Vinyl Chloride 5 520 D 58 D 65 21 20 U 87 350 D 410 96 49 110 D 75 D 38
Xylene (Total) 5 80 UD 80 UD 40 U 20 U 40 U 40 U 100 UD 100 U 50 U 40 U 20 UD 13 UD 8.0 U
Notes
* Guidance Value
**Sum of these compounds can not exceed 0.4 ug/L.
U - Compound not detected, Reporting Limit provided.
J - Estimated by Validator.
D - Result of diluted sample shown.
† - The data for these wells is reversed from the Laboratory data summary, as the wells were mislabeled in the field.
MW-1
7/10/2014
ug/L
MW-1D
7/10/2014
ug/L
11/21/2013
ug/L
MW-1D
11/21/2013
ug/L
MW-1DDMW-1
ug/L
1/15/2014 11/21/2013
ug/Lug/L
1/14/2014
MW-1DMW-1
ug/L
10/14/2013
ug/Lug/L ug/L
8/27/2013 8/26/2013 8/26/201310/14/2013
ug/L
10/14/2013
ug/L
MW-1DDMW-1† MW-1D†MW-1 MW-1DDMW-1D
Exceeds NYSDEC Class GA Standard or Guidance Value
G:\PROJECT\00266417.0000\FILE\Summary Report\Tables\Table 6 - Groundwater Sampling Summary.xlsx 1 of 9

Table 6.
Groundwater Analytical Data Summary
Sample ID NYSDEC Class GA
Depth or Screen Interval (feet) Standard or
Sampling Date Guidance Value
Units ug/L
VOCs
1,1,1,2-Tetrachloroethane 5
1,1,1-Trichloroethane 5
1,1,2,2-Tetrachloroethane 5
1,1,2-Trichloro-1,2,2-trifluoroethane
1,1,2-Trichloroethane 1
1,1-Dichloroethane 5
1,1-Dichloroethene 5
1,2,3-Trichlorobenzene 5
1,2,4-Trichlorobenzene 5
1,2-Dibromo-3-Chloropropane 0.04
1,2-Dibromoethane 5
1,2-Dichlorobenzene 5
1,2-Dichloroethane 0.04
1,2-Dichloropropane 5
1,3-Dichlorobenzene 3
1,4-Dichlorobenzene 0.6
2-Butanone 1
2-Hexanone 3
4-Methyl-2-Pentanone 5
Acetone 50
Benzene 5
Bromodichloromethane 5
Bromoform
Bromomethane 50*
Carbon Disulfide 1
Carbon Tetrachloride 5
Chlorobenzene 5
Chloroethane 50*
Chloroform 50*
Chloromethane 5
cis-1,2-Dichloroethene 5
cis-1,3-Dichloropropene 5
Cyclohexane
Dibromochloromethane 5
Dichlorodifluoromethane 7
Ethyl Benzene 5
Isopropylbenzene 50
Methyl Acetate
Methyl tert-butyl Ether 5
Methylcyclohexane
Methylene Chloride 5
Styrene 5
Tert-Butyl Methyl Ether 5
Tetrachloroethene 5
Toluene 5
trans-1,2-Dichloroethene 5
trans-1,3-Dichloropropene 5
Trichloroethene 5
Trichlorofluoromethane 5
Vinyl Chloride 5
Xylene (Total) 5
Notes
* Guidance Value
**Sum of these compounds can not exceed 0.4 ug/L.
U - Compound not detected, Reporting Limit provided.
J - Estimated by Validator.
D - Result of diluted sample shown.
† - The data for these wells is reversed from the Laboratory data summary, as the wells were mislabeled in the field.
Exceeds NYSDEC Class GA Standard or Guidance Value
500 UD
2.0 U 4.0 U 1.9 1.0 U 1.0 U 1.0 U 8.0 U 1.0 U 1.0 U 10 U 20 U 500 UD
2.0 U 4.0 U 1.0 U 1.0 U 1.0 U 0.84 J 8.0 U 1.0 U 1.0 U 10 U 20 U 500 UD
2.0 U 4.0 U 1.0 U 1.0 U 1.0 U 1.0 U 8.0 U 1.0 U 1.0 U 10 U 20 U
2.0 U 4.0 U 1.0 U 1.0 U 1.0 U 1.0 U 8.0 U 1.0 U 1.0 U 10 U 20 U 500 UD
2.0 U 4.0 U 1.0 U 1.0 U 1.3 1.0 U 8.0 U 1.0 U 1.0 U 10 U 20 U 500 UD
2.0 U 4.0 U 1.0 U 1.0 U 1.0 U 1.0 U 8.0 U 1.0 U 1.0 U 10 U 20 U 500 UD
10 U 500 UD
2.0 U 4.0 U 1.0 U 1.0 U 1.0 U 1.0 U 8.0 U 1.0 U 1.0 U 10 U 20 U 500 UD
2.0 U 4.0 U 1.0 U 1.0 U 1.0 U 1.0 U 8.0 U 1.0 U 1.0 U 10 U 20 U 500 UD
2.0 U 4.0 U 1.0 U 1.0 U 1.0 U 1.0 U 8.0 U 1.0 U 1.0 U 10 U 20 U 500 UD
2.0 U 4.0 U 1.0 U 1.0 U 1.0 U 1.0 U 8.0 U 1.0 U 1.0 U 10 U 20 U 500 UD
2.0 U 4.0 U 1.0 U 1.0 U 1.0 U 1.0 U 8.0 U 1.0 U 1.0 U 20 U 500 UD
2.0 U 4.0 U 1.0 U 1.0 U 1.0 U 1.0 U 8.0 U 1.0 U 1.0 U 10 U 20 U 500 UD
2.0 U 4.0 U 1.0 U 1.0 U 1.0 U 1.0 U 8.0 U 1.0 U 1.0 U 10 U 20 U 500 UD
2.0 U 4.0 U 1.0 U 1.0 U 1.0 U 1.0 U 8.0 U 1.0 U 1.0 U 10 U 20 U 500 UD
20 U 40 U 10 U 10 U 10 U 10 U 10 U 10 U 10 U 100 U 200 U 5000 UD
10 U 20 U 5.0 U 5.0 U 5.0 U 5.0 U 5.0 U 5.0 U 5.0 U 50 U 100 U 2500 UD
10 U 20 U 5.0 U 5.0 U 5.0 U 5.0 U 5.0 U 5.0 U 5.0 U 50 U 100 U 2,500 UD
20 U 40 U 10 U 10 U 10 U 5.1 J 10 U 10 U 5.8 J 100 U 200 U 5,000 UD
2.0 U 4.0 U 1.0 U 1.0 U 1.0 U 1.0 U 8.0 U 1.0 U 1.4 10 U 20 U 500 UD
2.0 U 4.0 U 1.0 U 1.0 U 1.0 U 1.0 U 8.0 U 1.0 U 1.0 U 10 U 20 U 500 UD
2.0 U 4.0 U 1.0 U 1.0 U 1.0 U 1.0 U 8.0 U 1.0 U 1.0 U 10 U 20 U 500 UD
2.0 U 4.0 U 1.0 U 1.0 U 1.0 U 1.0 U 8.0 U 1.0 U 1.0 U 10 U 20 U 500 UD
2.0 U 4.0 U 1.0 U 0.49 BJ 1.0 U 1.0 U 8.0 U 1.0 U 1.0 U 10 U 20 U 500 UD
2.0 U 4.0 U 1.0 U 1.0 U 1.0 U 1.0 U 8.0 U 1.0 U 1.0 U 10 U 20 U 500 UD
2.0 U 4.0 U 1.0 U 1.0 U 1.0 U 1.0 U 8.0 U 1.0 U 1.0 U 10 U 20 U 500 UD
2.0 U 4.0 U 1.0 U 1.0 U 1.0 U 2.4 3.8 J 1.0 U 1.0 U 10 U 20 U 500 UD
2.0 U 4.0 U 1.0 U 1.0 U 1.0 U 1.0 U 0.54 J 1.0 U 1.0 U 10 U 20 U 500 UD
2.0 U 4.0 U 1.0 U 1.0 U 1.0 U 1.0 U 8.0 U 1.0 U 1.0 U 10 U 20 U 500 UD
85 170 3.3 1.0 U 2.6 41 360 D 20 220 D 190 910 40,000 D
2.0 U 4.0 U 1.0 U 1.0 U 1.0 U 1.0 U 8.0 U 1.0 U 1.0 U 10 U 20 U 500 UD
2.0 U 4.0 U 1.0 U 1.0 U 1.0 U 1.0 U 8.0 U 1.0 U 2.3 2.2 J 20 U 500 UD
2.0 U 4.0 U 1.0 U 1.0 U 1.0 U 1.0 U 8.0 U 1.0 U 1.0 U 10 U 20 U 500 UD
2.0 U 99 25 26 26 1.0 U 8.0 U 1.0 U 1.0 U 10 U 20 U 500 UD
2.0 U 4.0 U 1.0 U 1.0 U 1.0 U 7.1 8.0 U 14 120 D 130 20 U 500 UD
2.0 U 4.0 U 1.0 U 1.0 U 1.0 U 9.3 8.0 U 8.9 65 86 20 U 500 UD
2.0 U 4.0 U 1.0 U 1.0 U 1.0 U 2.5 U 8.0 U 1.0 U 1.0 U 25 U 50 U
10 U 2.5 U 2.5 U 2.5 U 2.5 U 500 UD
2.0 U 4.0 U 1.0 U 1.0 U 1.0 U 0.88 J 8.0 U 1.3 8.3 11 20 U
1.8 J 4.0 U 1.0 U 1.0 U 1.0 U 1.0 U 8.0 U 1.0 U 1.0 U 10 U 20 U 340 JD
2.0 U 4.0 U 1.0 U 1.0 U 1.0 U 1.0 U 8.0 U 1.0 U 1.0 U 10 U 20 U 500 UD
0.47 J 0.9 J 1.0 U 1.0 U 1.0 U 1.0 U 2.3 J 1.2 5.9 13 20 U
33 40 52 1.0 U 1.4 1.4 58 1.0 U 1.3 10 U 20 U 7,900 D
2.0 U 4.0 U 1.0 U 1.0 U 1.0 U 0.54 J 8.0 U 8.7 79 85 20 U 500 UD
2.0 U 4.0 U 1.0 U 1.0 U 1.0 U 0.97 J 0.92 J 1.0 U 2.8 10 U 20 U 450 JD
2.0 U 4.0 U 1.0 U 1.0 U 1.0 U 1.0 U 8.0 U 1.0 U 1.0 U 10 U 20 U 500 JD
15 28 8.6 1.0 U 1.4 0.91 J 40 1.0 U 0.55 J 10 U 20 U 2,200 D
2.0 U 4.0 U 1.0 U 1.0 U 1.0 U 1.0 U 8.0 U 1.0 U 1 U 10 U 20 U 500 UD
25 30 1.0 U 1.0 U 1.0 U 11 1.2 3.0 25 38 210 4500 D
4.0 U 8.0 U 2.0 U 2.0 U 2.0 U 3.4 2.0 U 120 1200 1400 40 U 1000 UD
MW-3
7/9/2014
ug/L
7/10/2014
ug/L
MW-1DD MW-4
7/9/2014
ug/L
11/22/2013
ug/L
MW-1DD
1/14/2014
MW-8
ug/L ug/Lug/L
8/26/2013
MW-2
7/11/2014
MW-10SMW-7 MW-8
ug/L
1/15/20147/10/2014
ug/L
MW-6R
7/15/2014
ug/L
MW-8
ug/L
7/15/2014
MW-9
7/16/2014
ug/L
G:\PROJECT\00266417.0000\FILE\Summary Report\Tables\Table 6 - Groundwater Sampling Summary.xlsx 2 of 9

Table 6.
Groundwater Analytical Data Summary
Sample ID NYSDEC Class GA
Depth or Screen Interval (feet) Standard or
Sampling Date Guidance Value
Units ug/L
VOCs
1,1,1,2-Tetrachloroethane 5
1,1,1-Trichloroethane 5
1,1,2,2-Tetrachloroethane 5
1,1,2-Trichloro-1,2,2-trifluoroethane
1,1,2-Trichloroethane 1
1,1-Dichloroethane 5
1,1-Dichloroethene 5
1,2,3-Trichlorobenzene 5
1,2,4-Trichlorobenzene 5
1,2-Dibromo-3-Chloropropane 0.04
1,2-Dibromoethane 5
1,2-Dichlorobenzene 5
1,2-Dichloroethane 0.04
1,2-Dichloropropane 5
1,3-Dichlorobenzene 3
1,4-Dichlorobenzene 0.6
2-Butanone 1
2-Hexanone 3
4-Methyl-2-Pentanone 5
Acetone 50
Benzene 5
Bromodichloromethane 5
Bromoform
Bromomethane 50*
Carbon Disulfide 1
Carbon Tetrachloride 5
Chlorobenzene 5
Chloroethane 50*
Chloroform 50*
Chloromethane 5
cis-1,2-Dichloroethene 5
cis-1,3-Dichloropropene 5
Cyclohexane
Dibromochloromethane 5
Dichlorodifluoromethane 7
Ethyl Benzene 5
Isopropylbenzene 50
Methyl Acetate
Methyl tert-butyl Ether 5
Methylcyclohexane
Methylene Chloride 5
Styrene 5
Tert-Butyl Methyl Ether 5
Tetrachloroethene 5
Toluene 5
trans-1,2-Dichloroethene 5
trans-1,3-Dichloropropene 5
Trichloroethene 5
Trichlorofluoromethane 5
Vinyl Chloride 5
Xylene (Total) 5
Notes
* Guidance Value
**Sum of these compounds can not exceed 0.4 ug/L.
U - Compound not detected, Reporting Limit provided.
J - Estimated by Validator.
D - Result of diluted sample shown.
† - The data for these wells is reversed from the Laboratory data summary, as the wells were mislabeled in the field.
Exceeds NYSDEC Class GA Standard or Guidance Value
1.0 U
420 UD 200 U 200 U 100 U 1.0 U 2.0 UD 1.0 U 1.0 U 1.0 U 10 U 1.0 U 1.0 U
420 UD 200 U 200 U 100 U 1.0 U 2.0 UD 1.0 U 1.0 U 1.0 U 10 U 1.0 U 1.0 U
420 UD 200 U 200 U 100 U 2.0 UD 1.0 U 1.0 U 1.0 U 10 U 1.0 U 1.0 U
420 UD 200 U 200 U 100 U 1.0 U 2.0 UD 1.0 U 1.0 U 1.0 U 10 U 1.0 U 1.0 U
420 UD 200 U 200 U 100 U 1.0 U 0.58 J 0.52 J 0.57 J 0.85 J 10 U 1.0 U 1.0 U
420 UD 200 U 200 U 100 U 1.0 U 2.0 UD 1.0 U 1.0 U 1.0 U 10 U 0.49 J 0.63 J
420 UD 1.0 U 2.0 UD 1.0 U
420 UD 200 U 200 U 100 U 1.0 U 2.0 UD 1.0 U 1.0 U 1.0 U 10 U 1.0 U 1.0 U
830 UD 200 U 200 U 100 U 1.0 U 4.0 UD 1.0 U 1.0 U 1.0 U 10 U 2.0 U 1.0 U
420 UD 200 U 200 U 100 U 1.0 U 2.0 UD 1.0 U 1.0 U 1.0 U 10 U 1.0 U 1.0 U
420 UD 200 U 200 U 100 U 1.0 U 2.0 UD 1.0 U 1.0 U 1.0 U 10 U 1.0 U 1.0 U
420 UD 200 U 200 U 100 U 0.36 J 2.0 UD 1.0 U 1.0 U 1.0 U 10 U 1.0 U 1.0 U
420 UD 200 U 200 U 100 U 1.0 U 2.0 UD 1.0 U 1.0 U 1.0 U 10 U 1.0 U 1.0 U
420 UD 200 U 200 U 100 U 1.0 U 2.0 UD 1.0 U 1.0 U 1.0 U 10 U 1.0 U 1.0 U
420 UD 200 U 200 U 100 U 1.0 U 2.0 UD 1.0 U 1.0 U 1.0 U 10 U 1.0 U 1.0 U
4,200 UD 2000 U 2000 U 1000 U 10 U 20 UD 10 U 10 U 10 U 100 U 10 U 10 U
4,200 UD 1000 U 1000 U 500 U 5.0 U 20 UD 5.0 U 5.0 U 5.0 U 50 U 10 U 5.0 U
4,200 UD 1000 U 1000 U 500 U 5.0 U 20 UD 5.0 U 5.0 U 5.0 U 50 U 10 U 5.0 U
4,200 UD 2000 U 2000 U 1000 U 10.0 U 46 D 10 U 10 U 10 U 100 U 10 U 21
420 UD 200 U 200 U 100 U 1.0 U 2.0 UD 1.0 U 1.0 U 1.0 U 19 0.95 J 0.50 J
420 UD 200 U 200 U 100 U 1.0 U 2.0 UD 1.0 U 1.0 U 1.0 U 10 U 1.0 U 1.0 U
420 UD 200 U 200 U 100 U 1.0 U 2.0 UD 1.0 U 1.0 U 1.0 U 10 U 1.0 U 1.0 U
420 UD 200 U 200 U 100 U 1.0 U 2.0 UD 1.0 U 1.0 U 1.0 U 10 U 1.0 U 1.0 U
420 UD 200 U 200 U 100 U 1.0 U 2.0 UD 1.0 U 1.0 U 1.0 U 10 U 1.0 U 1.0 U
420 UD 200 U 200 U 100 U 1.0 U 2.0 UD 1.0 U 1.0 U 1.0 U 10 U 1.0 U 1.0 U
420 UD 200 U 200 U 100 U 1.0 U 2.0 UD 1.0 U 1.0 U 1.0 U 10 U 1.0 U 1.0 U
420 UD 200 U 200 U 100 U 1.0 U 2.0 UD 1.0 U 1.0 U 0.50 J 10 U 1.0 U 1.0 U
420 UD 200 U 200 U 100 U 1.0 U 2.0 UD 1.0 U 1.0 U 1.0 U 10 U 1.0 U 1.0 U
420 UD 200 U 200 U 100 U 1.0 U 2.0 UD 1.0 U 1.0 U 1.0 U 10 U 1.0 U 1.0 U
7,600 D 15,000 14,000 4600 71 54 D 20 10 80 1400 D 4.7 3.1
420 UD 200 U 200 U 100 U 1.0 U 2.0 UD 1.0 U 1.0 U 1.0 U 10 U 1.0 U 1.0 U
420 UD 200 U 200 U 100 U 1.0 U 2.0 UD 1.0 U 1.0 U 1.0 U 10 U 1.0 U 1.0 U
420 UD 200 U 200 U 100 U 1.0 U 2.0 UD 1.0 U 1.0 U 1.0 U 10 U 1.0 U 1.0 U
420 UD 200 U 200 U 100 U 1.0 U 2.0 UD 1.0 U 1.0 U 1.0 U 250 1.0 U 1.0 U
420 UD 200 U 200 U 100 U 1.0 U 2.0 UD 1.0 U 1.0 U 1.0 U 10 U 1.0 1.0 U
420 UD 200 U 200 U 100 U 1.0 U 2.0 UD 1.0 U 1.0 U 1.0 U 60 27 11
420 UD 200 U 200 U 250 U 20 UD 1.0 U 1.0 U 2.5 U 24 10 U 1.0 U
420 UD 1.0 U 2.0 UD 25 U 4.0
420 UD 200 U 200 U 100 U 2.0 UD 1.0 U 1.0 U 1.0 U 10 U 1.0 U 1.0 U
420 UD 200 U 200 U 100 U 1.0 U 2.0 UD 1.0 U 1.0 U 1.0 U 10 U 1.0 U 1.0 U
420 UD 200 U 200 U 100 U 1.0 U 2.0 UD 1.0 U 1.0 U 1.0 U 10 U 1.0 U 1.0 U
200 U 200 U 100 U 1.0 U 1.0 U 1.0 U 120 2.0
5,200 D 9,700 7,000 1900 7.4 9.3 D 2.9 0.69 J 9.5 10 U 1.2 1.7
420 UD 200 U 200 U 100 U 1.0 U 2.0 UD 1.0 U 1.0 U 1.0 U 38 1.0 U 1.0 U
420 UD 200 U 200 U 100 U 1.2 0.59 JD 1.0 U 1.0 U 1.0 U 11 1.0 U 1.0 U
420 UD 200 U 200 U 100 U 1.0 U 2.0 UD 1.0 U 1.0 U 1.0 U 10 U 1.0 U 1.0 U
1,300 D 2,700 2,000 1000 9.0 6.5 D 2.3 0.96 J 6.8 10 U 1.7 2.2
420 UD 200 U 200 U 100 U 1.0 U 2.0 UD 1.0 U 1.0 U 1.0 U 10 U 1.0 U 1.0 U
790 D 1,500 810 250 8.1 8.9 D 2.2 0.97 J 16 450 1.0 1.0 U
830 UD 400 U 400 U 200 U 2.0 U 4.0 UD 2.0 U 2.0 U 2.0 U 310 0.54 J 0.85 J
MW-12
11/21/2013
ug/L
10/14/2013
ug/L
MW-10D
10/14/2013
ug/L
MW-12
10/14/2013
ug/Lug/L
8/26/2013
MW-10D MW-10DMW-10S
ug/L
MW-10S MW-10DMW-10S
1/15/2014
ug/L
11/22/20131/15/2014
ug/L
MW-10S MW-10D
11/22/2013
ug/L ug/L
7/14/2014 7/15/2014
MW-11
ug/L
7/14/2014
ug/L
G:\PROJECT\00266417.0000\FILE\Summary Report\Tables\Table 6 - Groundwater Sampling Summary.xlsx 3 of 9

Table 6.
Groundwater Analytical Data Summary
Sample ID NYSDEC Class GA
Depth or Screen Interval (feet) Standard or
Sampling Date Guidance Value
Units ug/L
VOCs
1,1,1,2-Tetrachloroethane 5
1,1,1-Trichloroethane 5
1,1,2,2-Tetrachloroethane 5
1,1,2-Trichloro-1,2,2-trifluoroethane
1,1,2-Trichloroethane 1
1,1-Dichloroethane 5
1,1-Dichloroethene 5
1,2,3-Trichlorobenzene 5
1,2,4-Trichlorobenzene 5
1,2-Dibromo-3-Chloropropane 0.04
1,2-Dibromoethane 5
1,2-Dichlorobenzene 5
1,2-Dichloroethane 0.04
1,2-Dichloropropane 5
1,3-Dichlorobenzene 3
1,4-Dichlorobenzene 0.6
2-Butanone 1
2-Hexanone 3
4-Methyl-2-Pentanone 5
Acetone 50
Benzene 5
Bromodichloromethane 5
Bromoform
Bromomethane 50*
Carbon Disulfide 1
Carbon Tetrachloride 5
Chlorobenzene 5
Chloroethane 50*
Chloroform 50*
Chloromethane 5
cis-1,2-Dichloroethene 5
cis-1,3-Dichloropropene 5
Cyclohexane
Dibromochloromethane 5
Dichlorodifluoromethane 7
Ethyl Benzene 5
Isopropylbenzene 50
Methyl Acetate
Methyl tert-butyl Ether 5
Methylcyclohexane
Methylene Chloride 5
Styrene 5
Tert-Butyl Methyl Ether 5
Tetrachloroethene 5
Toluene 5
trans-1,2-Dichloroethene 5
trans-1,3-Dichloropropene 5
Trichloroethene 5
Trichlorofluoromethane 5
Vinyl Chloride 5
Xylene (Total) 5
Notes
* Guidance Value
**Sum of these compounds can not exceed 0.4 ug/L.
U - Compound not detected, Reporting Limit provided.
J - Estimated by Validator.
D - Result of diluted sample shown.
† - The data for these wells is reversed from the Laboratory data summary, as the wells were mislabeled in the field.
Exceeds NYSDEC Class GA Standard or Guidance Value
1,000 UD 1,000 UD
1.0 U 1.0 U 1,000 UD 2,500 UD 2,500 U 2,500 U 1,000 UD 410 U 25 U 1.0 U 2.0 U 1.0 U
1.0 U 1.0 U 1,000 UD 2,500 UD 2,500 U 2,500 U 1,000 UD 110 U 25 U 1.0 U 2.0 U 6.8
1.0 U 1.0 U 2,500 UD 2,500 U 2,500 U 160 U 25 U 1.0 U 2.0 U 1.0 U
1.0 U 1.0 U 1,000 UD 2,500 UD 2,500 U 2,500 U 1,000 UD 120 U 25 U 1.0 U 2.0 U 1.0 U
1.0 U 1.0 U 1,000 UD 2,500 UD 2,500 U 2,500 U 1,000 UD 190 U 25 U 1.0 U 2.0 U 1.0 U
1.0 U 1.0 U 1,000 UD 2,500 UD 2,500 U 2,500 U 1,000 UD 150 U 25 U 1.0 U 2.0 U 1.0 U
1,000 UD 2,500 UD 1,000 UD
1.0 U 1.0 U 1,000 UD 2,500 UD 2,500 U 2,500 U 1,000 UD 210 U 25 U 1.0 U 2.0 U 1.0 U
1.0 U 1.0 U 1,000 UD 5,000 UD 2,500 U 2,500 U 1,000 UD 200 U 25 U 1.0 U 2.0 U 1.0 U
1.0 U 1.0 U 1,000 UD 2,500 UD 2,500 U 2,500 U 1,000 UD 370 U 25 U 1.0 U 2.0 U 1.0 U
1.0 U 1.0 U 1,000 UD 2,500 UD 2,500 U 2,500 U 1,000 UD 400 U 25 U 1.0 U 2.0 U 1.0 U
1.0 U 1.0 U 1,000 UD 2,500 UD 2,500 U 2,500 U 1,000 UD 110 U 25 U 1.0 U 2.0 U 1.0 U
1.0 U 1.0 U 1,000 UD 2,500 UD 2,500 U 2,500 U 1,000 UD 360 U 25 U 1.0 U 2.0 U 1.0 U
1.0 U 1.0 U 1,000 UD 2,500 UD 2,500 U 2,500 U 1,000 UD 390 U 25 U 1.0 U 2.0 U 1.0 U
1.0 U 1.0 U 1,000 UD 2,500 UD 2,500 U 2,500 U 1,000 UD 420 U 25 U 1.0 U 2.0 U 1.0 U
10 U 10 U 10,000 UD 25,000 UD 25,000 U 25,000 U 10,000 UD 660 U 250 U 10 U 20 U 10 U
5.0 U 5.0 U 5,000 UD 25,000 UD 13,000 U 13,000 U 5,000 UD 620 U 130 U 5.0 U 10 U 3.0 J
5.0 U 5.0 U 5,000 UD 25,000 UD 13,000 U 13,000 U 5,000 UD 1100 U 130 U 5.0 U 10 U 5.0 U
10 U 3.6 J 10,000 UD 25,000 UD 25,000 U 25,000 U 10,000 UD 1500 U 250 U 10 U 20 U 4.6 J
1.0 U 0.42 J 1,000 UD 2,500 UD 2,500 U 2,500 U 1,000 UD 210 U 25 U 1.0 U 1.4 J 1.0 U
1.0 U 1.0 U 1,000 UD 2,500 UD 2,500 U 2,500 U 1,000 UD 200 U 25 U 1.0 U 2.0 U 1.0 U
1.0 U 1.0 U 1,000 UD 2,500 UD 2,500 U 2,500 U 1,000 UD 130 U 25 U 1.0 U 2.0 U 1.0 U
1.0 U 1.0 U 1,000 UD 2,500 UD 2,500 U 2,500 U 1,000 UD 350 U 25 U 1.0 U 2.0 U 1.0 U
1.0 U 1.0 U 1,000 UD 2,500 UD 2,500 U 2,500 U 1,000 UD 95 U 25 U 1.0 U 2.0 U 0.24 J
1.0 U 1.0 U 1,000 UD 2,500 UD 2,500 U 2,500 U 1,000 UD 140 U 25 U 1.0 U 2.0 U 1.0 U
1.0 U 1.0 U 1,000 UD 2,500 UD 2,500 U 2,500 U 1,000 UD 380 U 25 U 1.0 U 2.0 U 1.0 U
1.0 U 1.0 U 1,000 UD 2,500 UD 2,500 U 2,500 U 1,000 UD 160 U 25 U 1.0 U 2.0 U 1.0 U
1.0 U 1.0 U 1,000 UD 2,500 UD 2,500 U 2,500 U 1,000 UD 170 U 25 U 1.0 U 2.0 U 1.0 U
1.0 U 1.0 U 1,000 UD 2,500 UD 2,500 U 2,500 U 1,000 UD 180 U 25 U 1.0 U 2.0 U 1.0 U
2.7 7.6 51,000 D 54,000 D 140,000 120,000 57,000 D 25000 1400 5.1 25 32
1.0 U 1.0 U 1,000 UD 2,500 UD 2,500 U 2,500 U 1,000 UD 180 U 25 U 1.0 U 2.0 U 1.0 U
1.0 U 1.0 U 1,000 UD 2,500 UD 2,500 U 2,500 U 1,000 UD 90 U 25 U 1.0 U 2.0 U 0.26 J
1.0 U 1.0 U 1,000 UD 2,500 UD 2,500 U 2,500 U 1,000 UD 160 U 25 U 1.0 U 2.0 U 1.0 U
1.0 U 26 1,000 UD 2,500 UD 2,500 U 2,500 U 1,000 UD 340 U 25 U 1.0 U 2.0 U 1.0 U
1.0 U 1.0 U 1,000 UD 2,500 UD 2,500 U 2,500 U 1,000 UD 370 U 36 5.2 22 2.1
1.8 1.0 U 1,000 UD 2,500 UD 2,500 U 2,500 U 1,000 UD 400 U 20 J 4.5 8.6 10
1.0 U 6.7 25,000 UD 2,500 U 2,500 U 250 U 25 U 1.0 U 5.0 U 2.5 U
2.5 U 4,000 UD 2,500 UD 1,000 UD
1.0 U 1.0 U 2,500 UD 2,500 U 2,500 U 80 U 25 U 1.5 0.91 J 2.3
1.0 U 1.0 U 630 JD 2,500 UD 2,500 U 2,500 U 660 JD 230 J 25 U 1.0 U 2.0 U 1.0 U
1.0 U 1.0 U 1,000 UD 2,500 UD 2,500 U 2,500 U 1,000 UD 370 U 25 U 1.0 U 2.0 U 1.0 U
1.0 U 2 2,500 U 2,500 U 80 U 4.4 J 1.0 U 0.37 J 1.0 U
7.9 6.1 7,000 D 5,200 D 9,600 34,000 6,300 D 4100 25 U 0.83 J 2.0 U 0.96 J
1.0 U 1.0 U 1,000 UD 2,500 UD 2,500 U 2,500 U 1,000 UD 260 U 50 2.0 39 1.0 U
1.0 U 1.0 U 1,000 UD 2,500 UD 2,500 U 2,500 U 1,000 UD 450 U 25 U 1.0 U 2.2 1.0 U
1.0 U 1.0 U 1,000 UD 2,500 UD 2,500 U 2,500 U 1,000 UD 190 U 25 U 1.0 U 2.0 U 1.0 U
2.4 3.2 7,800 D 7,100 D 17,000 22,000 7,000 D 4100 25 U 0.67 J 2.0 U 1.8
1.0 U 1.0 U 1,000 UD 2,500 UD 2,500 U 2,500 U 1,000 UD 440 U 25 U 1.0 U 2.0 U 1.0 U
1.0 U 0.96 J 3,000 D 2,100 JD 2,400 J 3,800 3,000 D 450 U 920 4.0 32 1.7
2.0 U 0.79 J 2,000 UD 5,000 UD 5,000 U 5,000 U 2,000 UD 330 U 390 48 170 2.0 U
11/21/201310/14/2013
ug/L
MW-13
ug/Lug/L
8/26/2013 8/26/2013
ug/L
1/15/201411/21/2013
ug/L
MW-13D (DUP)MW-12 MW-14RMW-13 MW-15RMW-12
ug/L
7/15/20141/15/2014
MW-14R
ug/L
7/9/2014
ug/L
MW-13
ug/L
MW-13 MW-13
ug/L
7/15/2014
MW-14R
1/15/2014
ug/L
7/15/2014
ug/L
G:\PROJECT\00266417.0000\FILE\Summary Report\Tables\Table 6 - Groundwater Sampling Summary.xlsx 4 of 9

Table 6.
Groundwater Analytical Data Summary
Sample ID NYSDEC Class GA
Depth or Screen Interval (feet) Standard or
Sampling Date Guidance Value
Units ug/L
VOCs
1,1,1,2-Tetrachloroethane 5
1,1,1-Trichloroethane 5
1,1,2,2-Tetrachloroethane 5
1,1,2-Trichloro-1,2,2-trifluoroethane
1,1,2-Trichloroethane 1
1,1-Dichloroethane 5
1,1-Dichloroethene 5
1,2,3-Trichlorobenzene 5
1,2,4-Trichlorobenzene 5
1,2-Dibromo-3-Chloropropane 0.04
1,2-Dibromoethane 5
1,2-Dichlorobenzene 5
1,2-Dichloroethane 0.04
1,2-Dichloropropane 5
1,3-Dichlorobenzene 3
1,4-Dichlorobenzene 0.6
2-Butanone 1
2-Hexanone 3
4-Methyl-2-Pentanone 5
Acetone 50
Benzene 5
Bromodichloromethane 5
Bromoform
Bromomethane 50*
Carbon Disulfide 1
Carbon Tetrachloride 5
Chlorobenzene 5
Chloroethane 50*
Chloroform 50*
Chloromethane 5
cis-1,2-Dichloroethene 5
cis-1,3-Dichloropropene 5
Cyclohexane
Dibromochloromethane 5
Dichlorodifluoromethane 7
Ethyl Benzene 5
Isopropylbenzene 50
Methyl Acetate
Methyl tert-butyl Ether 5
Methylcyclohexane
Methylene Chloride 5
Styrene 5
Tert-Butyl Methyl Ether 5
Tetrachloroethene 5
Toluene 5
trans-1,2-Dichloroethene 5
trans-1,3-Dichloropropene 5
Trichloroethene 5
Trichlorofluoromethane 5
Vinyl Chloride 5
Xylene (Total) 5
Notes
* Guidance Value
**Sum of these compounds can not exceed 0.4 ug/L.
U - Compound not detected, Reporting Limit provided.
J - Estimated by Validator.
D - Result of diluted sample shown.
† - The data for these wells is reversed from the Laboratory data summary, as the wells were mislabeled in the field.
Exceeds NYSDEC Class GA Standard or Guidance Value
1.0 U 50 UD
10 U 1.0 U 1.0 U 1.0 U 1.0 U 50 UD 20 U 20 U 50 UD 130 UD 50 U 50 U 1.0 U
13 1.0 U 1.0 U 1.0 U 1.0 U 50 UD 20 U 20 U 50 UD 130 UD 50 U 50 U 1.0 U
10 U 1.0 U 1.0 U 1.0 U 50 UD 20 U 20 U 130 UD 50 U 50 U 1.0 U
10 U 1.0 U 1.0 U 1.0 U 1.0 U 50 UD 20 U 20 U 50 UD 130 UD 50 U 50 U 1.0 U
10 U 4.5 1.0 U 1.0 U 0.65 J 50 UD 20 U 20 U 50 UD 130 UD 50 U 50 U 1.0 U
10 U 2.4 1.0 U 1.0 U 1.0 U 50 UD 20 U 20 U 50 UD 130 UD 50 U 50 U 0.4 J
1.0 U 50 UD 50 UD 130 UD
10 U 1.0 U 1.0 U 1.0 U 1.0 U 50 UD 20 U 20 U 50 UD 130 UD 50 U 50 U 1.0 U
10 U 1.0 U 1.0 U 1.0 U 1.0 U 100 UD 20 U 20 U 50 UD 250 UD 50 U 50 U 1.0 U
10 U 1.0 U 1.0 U 1.0 U 1.0 U 50 UD 20 U 20 U 50 UD 130 UD 50 U 50 U 1.0 U
10 U 1.0 U 1.0 U 1.0 U 1.0 U 50 UD 20 U 20 U 50 UD 130 UD 50 U 50 U 1.0 U
10 U 1.0 U 1.0 U 1.0 U 1.0 U 50 UD 20 U 20 U 50 UD 130 UD 50 U 50 U 1.0 U
10 U 1.0 U 1.0 U 1.0 U 1.0 U 50 UD 20 U 20 U 50 UD 130 UD 50 U 50 U 1.0 U
10 U 1.0 U 1.0 U 1.0 U 1.0 U 50 UD 20 U 20 U 50 UD 130 UD 50 U 50 U 1.0 U
10 U 1.0 U 1.0 U 1.0 U 1.0 U 50 UD 20 U 20 U 50 UD 130 UD 50 U 50 U 1.0 U
100 U 10 U 10 U 10 U 2.0 J 500 UD 200 U 200 U 500 UD 1,300 UD 500 U 500 U 10 U
50 U 5.0 U 5.0 U 5.0 U 5.0 U 500 UD 100 U 100 U 250 UD 1,300 UD 250 U 250 U 5.0 U
50 U 5.0 U 5.0 U 5.0 U 5.0 U 500 UD 100 U 100 U 250 UD 1,300 UD 250 U 250 U 5.0 U
100 U 10 U 3.9 J 10 U 20 500 UD 200 U 200 U 500 UD 1,300 UD 500 U 500 U 5.8 J
10 U 0.73 J 1.0 U 1.0 U 1.0 U 50 UD 20 U 20 U 50 UD 130 UD 50 U 50 U 1.0 U
10 U 1.0 U 1.0 U 1.0 U 1.0 U 50 UD 20 U 20 U 50 UD 130 UD 50 U 50 U 1.0 U
10 U 1.0 U 1.0 U 1.0 U 3.9 50 UD 20 U 20 U 50 UD 130 UD 50 U 50 U 1.0 U
10 U 1.0 U 1.0 U 1.0 U 1.0 U 50 UD 20 U 20 U 50 UD 130 UD 50 U 50 U 1.0 U
10 U 1.0 U 1.0 U 1.0 U 1.0 U 50 UD 20 U 20 U 50 UD 130 UD 50 U 50 U 1.0 U
10 U 1.0 U 1.0 U 1.0 U 1.0 U 50 UD 20 U 20 U 50 UD 130 UD 50 U 50 U 1.0 U
10 U 1.0 U 1.0 U 1.0 U 1.0 U 50 UD 20 U 20 U 50 UD 130 UD 50 U 50 U 1.0 U
10 U 13 1.0 U 1.0 U 1.0 U 50 UD 20 U 20 U 50 UD 130 UD 50 U 50 U 1.0 U
10 U 1.0 U 1.0 U 1.0 U 0.89 J 50 UD 20 U 20 U 50 UD 130 UD 50 U 50 U 1.0 U
10 U 1.0 U 1.0 U 1.0 U 1.0 U 50 UD 20 U 20 U 50 UD 130 UD 50 U 50 U 1.0 U
10 3900 D 12 15 1.0 U 1,100 D 1,400 3500 D 3,400 D 2,200 D 3,500 3,700 430 D
10 U 1.0 U 1.0 U 1.0 U 1.0 U 50 UD 20 U 20 U 50 UD 130 UD 50 U 50 U 1.0 U
10 U 1.0 U 1.0 U 1.0 U 1.1 50 UD 20 U 20 U 42 JD 130 UD 50 U 50 U 1.0 U
10 U 1.0 U 1.0 U 1.0 U 1.0 U 50 UD 20 U 20 U 50 UD 130 UD 50 U 50 U 1.0 U
10 U 1.0 U 1.0 U 1.0 U 1.0 U 50 UD 20 U 20 U 50 UD 130 UD 50 U 50 U 260
17 1.0 U 1.0 U 1.0 U 1.0 U 50 UD 20 U 20 U 50 UD 130 UD 50 U 50 U 1.0 U
17 1.1 1.0 U 1.0 U 1.0 U 50 UD 20 U 20 U 50 UD 130 UD 50 U 50 U 1.0 U
25 U 2.5 U 2.5 U 2.5 U 500 UD 20 U 20 U 1,300 UD 50 U 50 U 1.0 U
1.0 U 50 UD 50 UD 130 UD 2.5 U
2.7 J 0.35 J 1.0 U 1.0 U 50 UD 20 U 20 U 130 UD 50 U 50 U 0.41 J
10 U 1.0 U 1.0 U 1.0 U 1.0 U 50 UD 20 U 20 U 43 J D 130 UD 50 U 50 U 1.0 U
10 U 1.0 U 1.0 U 1.0 U 1.0 U 50 UD 20 U 20 U 50 UD 130 UD 50 U 50 U 1.0 U
10 U 2.2 1.0 U 1.0 U 20 U 20 U 50 U 50 U 1.0 U
10 U 490 D 2.0 2 11 380 D 290 630 50 UD 130 UD 50 U 50 U 0.64 J
10 U 1.0 U 1.0 U 1.0 U 1.0 U 50 UD 20 U 20 U 50 UD 130 UD 50 U 50 U 1.0 U
10 U 22 1.0 U 1.0 U 1.0 U 28 J 20 U 27 81 D 35 JD 50 U 50 U 6.1
10 U 1.0 U 1.0 U 1.0 U 1.0 U 50 UD 20 U 20 U 50 UD 130 UD 50 U 50 U 1.0 U
15 520 D 1.9 2.1 1.0 U 210 D 150 460 50 UD 130 UD 50 U 50 U 0.84 J
10 U 1.0 U 1.0 U 1.0 U 1.0 U 50 UD 20 U 20 U 50 UD 130 UD 50 U 50 U 1.0 U
10 U 830 D 1.0 U 1.0 U 1.0 U 50 UD 32 82 98 D 57 JD 130 52 420 D
20 U 2.0 U 2.0 U 2.0 U 2.0 U 100 UD 40 U 40 U 100 UD 250 UD 100 U 100 U 2.0 U
MW-22S
7/11/201410/14/201310/14/20138/27/2013 8/27/2013
ug/L ug/L
MW-21S MW-21D
ug/L
MW-21D
ug/L
1/14/2014
MW-21S
ug/L
1/14/2014 11/21/2013
ug/L
MW-21S
ug/L
11/21/2013
MW-20
ug/L ug/L
MW-21S MW-21D MW-21DMW-16R
7/15/2014
ug/L
MW-18
7/14/2014
ug/L
MW-19
7/15/2014
ug/L
7/15/2014
ug/L
G:\PROJECT\00266417.0000\FILE\Summary Report\Tables\Table 6 - Groundwater Sampling Summary.xlsx 5 of 9

Table 6.
Groundwater Analytical Data Summary
Sample ID NYSDEC Class GA
Depth or Screen Interval (feet) Standard or
Sampling Date Guidance Value
Units ug/L
VOCs
1,1,1,2-Tetrachloroethane 5
1,1,1-Trichloroethane 5
1,1,2,2-Tetrachloroethane 5
1,1,2-Trichloro-1,2,2-trifluoroethane
1,1,2-Trichloroethane 1
1,1-Dichloroethane 5
1,1-Dichloroethene 5
1,2,3-Trichlorobenzene 5
1,2,4-Trichlorobenzene 5
1,2-Dibromo-3-Chloropropane 0.04
1,2-Dibromoethane 5
1,2-Dichlorobenzene 5
1,2-Dichloroethane 0.04
1,2-Dichloropropane 5
1,3-Dichlorobenzene 3
1,4-Dichlorobenzene 0.6
2-Butanone 1
2-Hexanone 3
4-Methyl-2-Pentanone 5
Acetone 50
Benzene 5
Bromodichloromethane 5
Bromoform
Bromomethane 50*
Carbon Disulfide 1
Carbon Tetrachloride 5
Chlorobenzene 5
Chloroethane 50*
Chloroform 50*
Chloromethane 5
cis-1,2-Dichloroethene 5
cis-1,3-Dichloropropene 5
Cyclohexane
Dibromochloromethane 5
Dichlorodifluoromethane 7
Ethyl Benzene 5
Isopropylbenzene 50
Methyl Acetate
Methyl tert-butyl Ether 5
Methylcyclohexane
Methylene Chloride 5
Styrene 5
Tert-Butyl Methyl Ether 5
Tetrachloroethene 5
Toluene 5
trans-1,2-Dichloroethene 5
trans-1,3-Dichloropropene 5
Trichloroethene 5
Trichlorofluoromethane 5
Vinyl Chloride 5
Xylene (Total) 5
Notes
* Guidance Value
**Sum of these compounds can not exceed 0.4 ug/L.
U - Compound not detected, Reporting Limit provided.
J - Estimated by Validator.
D - Result of diluted sample shown.
† - The data for these wells is reversed from the Laboratory data summary, as the wells were mislabeled in the field.
Exceeds NYSDEC Class GA Standard or Guidance Value
40 U 50 UD
4.0 U 40 U 83 UD 40 U 10 U 10 U 50 UD 130 UD 50 U 50 U 50 U 40 U
4.0 U 40 U 83 UD 40 U 10 U 10 U 50 UD 130 UD 50 U 50 U 50 U 40 U
4.0 U 83 UD 40 U 10 U 10 U 130 UD 50 U 50 U 50 U 40 U
4.0 U 40 U 83 UD 40 U 10 U 10 U 50 UD 130 UD 50 U 50 U 50 U 40 U
4.0 U 40 U 83 UD 40 U 10 U 10 U 50 UD 130 UD 50 U 50 U 50 U 9.2 JD
4.0 U 40 U 83 UD 40 U 10 U 10 U 50 UD 130 UD 50 U 50 U 50 U 40 U
40 U 83 UD 50 UD 130 UD 40 U
4.0 U 40 U 83 UD 40 U 10 U 10 U 50 UD 130 UD 50 U 50 U 50 U 40 U
4.0 U 40 U 170 UD 40 U 10 U 10 U 50 UD 250 UD 50 U 50 U 50 U 80 U
4.0 U 40 U 83 UD 40 U 10 U 10 U 50 UD 130 UD 50 U 50 U 50 U 40 U
4.0 U 40 U 83 UD 40 U 10 U 10 U 50 UD 130 UD 50 U 50 U 50 U 40 U
4.0 U 40 U 83 UD 40 U 10 U 10 U 50 UD 130 UD 50 U 50 U 50 U 40 U
4.0 U 40 U 83 UD 40 U 10 U 10 U 50 UD 130 UD 50 U 50 U 50 U 40 U
4.0 U 40 U 83 UD 40 U 10 U 10 U 50 UD 130 UD 50 U 50 U 50 U 40 U
4.0 U 40 U 83 UD 40 U 10 U 10 U 50 UD 130 UD 50 U 50 U 50 U 40 U
40 U 400 U 830 UD 400 U 100 U 100 U 500 UD 1300 UD 500 U 500 U 500 U 400 U
20 U 200 U 830 UD 200 U 50 U 50 U 250 UD 1300 UD 250 U 250 U 250 U 400 U
20 U 200 U 830 UD 200 U 50 U 50 U 250 UD 1300 UD 250 U 250 U 250 U 400 U
40 U 400 UD 830 UD 400 U 100 U 100 U 500 UD 1300 UD 500 U 500 U 500 U 400 U
4.0 U 40 UD 83 UD 40 U 10 U 10 U 50 UD 130 UD 50 U 50 U 50 U 40 U
4.0 U 40 UD 83 UD 40 U 10 U 10 U 50 UD 130 UD 50 U 50 U 50 U 40 U
4.0 U 40 UD 83 UD 40 U 10 U 10 U 50 UD 130 UD 50 U 50 U 50 U 40 U
4.0 U 40 UD 83 UD 40 U 10 U 10 U 100 UD 130 UD 50 U 50 U 50 U 40 U
4.0 U 40 UD 83 UD 40 U 10 U 10 U 100 UD 130 UD 50 U 50 U 50 U 40 U
4.0 U 40 UD 83 UD 40 U 10 U 10 U 100 UD 130 UD 50 U 50 U 50 U 40 U
4.0 U 40 UD 83 UD 40 U 10 U 10 U 100 UD 130 UD 50 U 50 U 50 U 40 U
4.0 U 40 UD 83 UD 40 U 10 U 10 U 100 UD 130 UD 50 U 50 U 50 U 40 U
4.0 U 40 UD 83 UD 40 U 10 U 10 U 100 UD 130 UD 50 U 50 U 50 U 40 U
4.0 U 40 UD 83 UD 40 U 10 U 10 U 100 UD 130 UD 50 U 50 U 50 U 40 U
1100 D 2400 D 1,800 D 2,100 740 1900 D 4,800 D 2800 D 3,200 3,600 3200 1,100 D
4.0 U 40 UD 83 UD 40 U 10 U 10 U 50 UD 130 UD 50 U 50 U 50 U 40 U
4.0 U 40 UD 83 UD 40 U 10 U 10 U 50 UD 130 UD 50 U 50 U 50 U 40 U
4.0 U 40 UD 83 UD 40 U 10 U 10 U 50 UD 130 UD 50 U 50 U 50 U 40 U
670 40 UD 83 UD 40 U 10 U 1000 50 UD 130 UD 50 U 50 U 1300 40 U
4.0 U 40 UD 83 UD 40 U 10 U 10 U 50 UD 130 UD 50 U 50 U 50 U 40 U
4.0 U 40 UD 83 UD 40 U 10 U 10 U 50 UD 130 UD 50 U 50 U 50 U 40 U
10 U 830 UD 40 U 10 U 10 U 1300 UD 50 U 50 U 50 U 400 U
40 UD 83 UD 25 U 100 UD 130 UD 130 U 40 U
4.0 U 83 UD 40 U 10 U 10 U 130 UD 50 U 50 U 50 U 40 U
4.0 U 21 JD 83 UD 40 U 4.8 J 10 U 50 UD 130 UD 50 U 50 U 50 U 40 U
4.0 U 40 UD 83 UD 40 U 10 U 10 U 50 UD 130 UD 50 U 50 U 50 U 40 U
3.2 J 40 U 10 U 10 U 50 U 50 U 50 U
71 74 D 83 UD 40 U 14 10 U 50 UD 130 UD 50 U 50 U 50 U 270 D
4.0 U 40 UD 83 UD 40 U 10 U 10 U 50 UD 130 UD 50 U 50 U 50 U 40 U
7.8 36 JD 83 UD 40 U 10 U 16 50 UD 130 UD 50 U 50 U 50 U 40 U
4.0 U 40 UD 83 UD 40 U 10 U 10 U 50 UD 130 UD 50 U 50 U 50 U 40 U
98 38 JD 83 UD 40 U 8.9 J 10 U 50 UD 130 UD 50 U 50 U 50 U 120 D
4.0 U 50 UD 83 UD 40 U 10 U 10 U 50 UD 130 UD 50 U 50 U 50 U 40 U
170 40 UD 20 J 40 U 10 U 24 50 UD 56 JD 52 50 U 60 22 JD
8.0 U 80 UD 170 UD 80 U 20 U 20 U 100 UD 250 UD 100 U 100 U 100 U 80 U
MW-22(R)S
11/21/2013
ug/L
10/14/2013
MW-22(R)D
10/14/2013
ug/L
8/27/2013
ug/L ug/L
MW-22(R)DMW-22(R)DMW-22(R)S MW-22(R)D
ug/L
1/14/20148/27/2013 10/14/2013
MW-23DMW-22(R)S
ug/L
11/21/2013
ug/Lug/L
MW-22(R)S
ug/L
1/14/2014
ug/L
MW-22(R)D
7/9/2014
ug/L
MW-22D
7/11/2014
ug/L
MW-22(R)S
7/9/2014
G:\PROJECT\00266417.0000\FILE\Summary Report\Tables\Table 6 - Groundwater Sampling Summary.xlsx 6 of 9

Table 6.
Groundwater Analytical Data Summary
Sample ID NYSDEC Class GA
Depth or Screen Interval (feet) Standard or
Sampling Date Guidance Value
Units ug/L
VOCs
1,1,1,2-Tetrachloroethane 5
1,1,1-Trichloroethane 5
1,1,2,2-Tetrachloroethane 5
1,1,2-Trichloro-1,2,2-trifluoroethane
1,1,2-Trichloroethane 1
1,1-Dichloroethane 5
1,1-Dichloroethene 5
1,2,3-Trichlorobenzene 5
1,2,4-Trichlorobenzene 5
1,2-Dibromo-3-Chloropropane 0.04
1,2-Dibromoethane 5
1,2-Dichlorobenzene 5
1,2-Dichloroethane 0.04
1,2-Dichloropropane 5
1,3-Dichlorobenzene 3
1,4-Dichlorobenzene 0.6
2-Butanone 1
2-Hexanone 3
4-Methyl-2-Pentanone 5
Acetone 50
Benzene 5
Bromodichloromethane 5
Bromoform
Bromomethane 50*
Carbon Disulfide 1
Carbon Tetrachloride 5
Chlorobenzene 5
Chloroethane 50*
Chloroform 50*
Chloromethane 5
cis-1,2-Dichloroethene 5
cis-1,3-Dichloropropene 5
Cyclohexane
Dibromochloromethane 5
Dichlorodifluoromethane 7
Ethyl Benzene 5
Isopropylbenzene 50
Methyl Acetate
Methyl tert-butyl Ether 5
Methylcyclohexane
Methylene Chloride 5
Styrene 5
Tert-Butyl Methyl Ether 5
Tetrachloroethene 5
Toluene 5
trans-1,2-Dichloroethene 5
trans-1,3-Dichloropropene 5
Trichloroethene 5
Trichlorofluoromethane 5
Vinyl Chloride 5
Xylene (Total) 5
Notes
* Guidance Value
**Sum of these compounds can not exceed 0.4 ug/L.
U - Compound not detected, Reporting Limit provided.
J - Estimated by Validator.
D - Result of diluted sample shown.
† - The data for these wells is reversed from the Laboratory data summary, as the wells were mislabeled in the field.
Exceeds NYSDEC Class GA Standard or Guidance Value
20 UD
8.4 8.0 U 8.0 U 130 UD 80 U 80 U 40 U 10 U 20 UD 40 UD 20 U
8.0 U 8.0 U 8.0 U 130 UD 80 U 80 U 40 U 10 U 20 UD 40 UD 20 U
8.0 U 8.0 U 8.0 U 130 UD 80 U 80 U 40 U 10 U 40 UD 20 U
8.0 U 8.0 U 8.0 U 130 UD 80 U 80 U 40 U 10 U 20 UD 40 UD 20 U
4.1 J 3.7 J 8.0 U 130 UD 80 U 80 U 40 U 10 U 20 UD 40 UD 20 U
8.0 U 8.0 U 8.0 U 130 UD 80 U 80 U 40 U 10 U 20 UD 40 UD 20 U
130 UD 20 UD 40 UD
8.0 U 8.0 U 8.0 U 130 UD 80 U 80 U 40 U 10 U 20 UD 40 UD 20 U
8.0 U 8.0 U 8.0 U 130 UD 80 U 80 U 40 U 10 U 20 UD 80 UD 20 U
8.0 U 8.0 U 8.0 U 130 UD 80 U 80 U 40 U 10 U 20 UD 40 UD 20 U
8.0 U 8.0 U 8.0 U 130 UD 80 U 80 U 40 U 10 U 20 UD 40 UD 20 U
8.0 U 8.0 U 8.0 U 130 UD 80 U 80 U 40 U 10 U 20 UD 40 UD 20 U
8.0 U 8.0 U 8.0 U 130 UD 80 U 80 U 40 U 10 U 20 UD 40 UD 20 U
8.0 U 8.0 U 8.0 U 130 UD 80 U 80 U 40 U 10 U 20 UD 40 UD 20 U
8.0 U 8.0 U 8.0 U 130 UD 80 U 80 U 40 U 10 U 20 UD 40 UD 20 U
80 U 80 U 80 U 1300 UD 800 U 800 U 400 U 100 U 200 UD 400 UD 200 U
40 U 40 U 40 U 1300 UD 400 U 400 U 200 U 50 U 100 UD 400 UD 100 U
40 U 40 U 40 U 1300 UD 400 U 400 U 200 U 50 U 100 UD 400 UD 100 U
80 U 80 U 80 U 1300 UD 800 U 800 U 400 U 100 U 200 UD 400 UD 200 U
8.0 U 8.0 U 8.0 U 130 UD 80 U 80 U 40 U 10 U 20 UD 40 UD 20 U
8.0 U 8.0 U 8.0 U 130 UD 80 U 80 U 40 U 10 U 20 UD 40 UD 20 U
8.0 U 8.0 U 8.0 U 130 UD 80 U 80 U 40 U 10 U 20 UD 40 UD 20 U
8.0 U 8.0 U 8.0 U 130 UD 80 U 80 U 40 U 10 U 20 UD 40 UD 20 U
8.0 U 8.0 U 8.0 U 130 UD 80 U 80 U 40 U 10 U 20 UD 40 UD 20 U
8.0 U 8.0 U 8.0 U 130 UD 80 U 80 U 40 U 10 U 20 UD 40 UD 20 U
8.0 U 8.0 U 8.0 U 130 UD 80 U 80 U 40 U 10 U 20 UD 40 UD 20 U
8.0 U 8.0 U 8.0 U 130 UD 80 U 80 U 40 U 10 U 20 UD 40 UD 20 U
8.0 U 8.0 U 8.0 U 130 UD 80 U 80 U 40 U 10 U 20 UD 40 UD 20 U
8.0 U 8.0 U 8.0 U 130 UD 80 U 80 U 40 U 10 U 20 UD 40 UD 20 U
380 790 560 2800 D 4,800 4,800 1900 610 1200 D 720 D 1100
8.0 U 8.0 U 8.0 U 130 UD 80 U 80 U 40 U 10 U 20 UD 40 UD 20 U
8.0 U 8.0 U 8.0 U 130 UD 80 U 80 U 40 U 10 U 20 UD 40 UD 20 U
8.0 U 8.0 U 8.0 U 130 UD 80 U 80 U 40 U 10 U 20 UD 40 UD 20 U
8.0 U 8.0 U 200 130 UD 80 U 80 U 40 U 270 20 UD 40 UD 20 U
8.0 U 8.0 U 8.0 U 130 UD 80 U 80 U 40 U 10 U 20 UD 40 UD 20 U
8.0 U 8.0 U 8.0 U 130 UD 80 U 80 U 40 U 10 U 20 UD 40 UD 20 U
8.0 U 8.0 U 8.0 U 1300 UD 80 U 80 U 40 U 10 U 40 UD 20 U
20 U 130 UD 25 U 20 UD 40 UD
8.0 U 8.0 U 8.0 U 130 UD 80 U 80 U 40 U 10 U 40 UD 20 U
8.0 U 8.0 U 8.0 U 130 UD 80 U 80 U 40 U 10 U 11 JD 40 UD 20 U
8.0 U 8.0 U 8.0 U 130 UD 80 U 80 U 40 U 10 U 20 UD 40 UD 20 U
3.6 J 3.0 J 1.6 J 80 U 80 U 40 U 10 U 20 U
140 170 160 700 D 1,000 1,000 590 320 290 D 96 D 97
8.0 U 8.0 U 8.0 U 130 UD 80 U 80 U 40 U 10 U 20 UD 40 UD 20 U
8.0 U 8.0 U 8.0 U 130 UD 80 U 80 U 40 U 10 U 20 UD 40 UD 20 U
8.0 U 8.0 U 8.0 U 130 UD 80 U 80 U 40 U 10 U 20 UD 40 UD 20 U
61 120 150 550 D 820 820 420 190 150 D 69 D 91
8.0 U 8.0 U 8.0 U 130 UD 80 U 80 U 40 U 10 U 20 UD 40 UD 20 U
47 110 11 140 D 210 180 40 U 10 U 49 D 38 JD 55
16 U 16 U 16 U 250 UD 160 U 160 U 80 U 20 U 40 UD 80 UD 40 U
MW-23D
ug/L
11/21/2013
MW-23S
ug/L
11/21/2013
MW-24
11/21/2013
ug/L
MW-23D
ug/L
1/15/2014
MW-23S
ug/L
1/15/2014
ug/L
10/14/2013
ug/Lug/L
10/14/2013 11/20/2013 8/27/2013
ug/L
MW-24MW-23S MW-23S (DUP) MW-24MW-23D
7/10/2014
ug/L
MW-23S
7/10/2014
ug/L
G:\PROJECT\00266417.0000\FILE\Summary Report\Tables\Table 6 - Groundwater Sampling Summary.xlsx 7 of 9

Table 6.
Groundwater Analytical Data Summary
Sample ID NYSDEC Class GA
Depth or Screen Interval (feet) Standard or
Sampling Date Guidance Value
Units ug/L
VOCs
1,1,1,2-Tetrachloroethane 5
1,1,1-Trichloroethane 5
1,1,2,2-Tetrachloroethane 5
1,1,2-Trichloro-1,2,2-trifluoroethane
1,1,2-Trichloroethane 1
1,1-Dichloroethane 5
1,1-Dichloroethene 5
1,2,3-Trichlorobenzene 5
1,2,4-Trichlorobenzene 5
1,2-Dibromo-3-Chloropropane 0.04
1,2-Dibromoethane 5
1,2-Dichlorobenzene 5
1,2-Dichloroethane 0.04
1,2-Dichloropropane 5
1,3-Dichlorobenzene 3
1,4-Dichlorobenzene 0.6
2-Butanone 1
2-Hexanone 3
4-Methyl-2-Pentanone 5
Acetone 50
Benzene 5
Bromodichloromethane 5
Bromoform
Bromomethane 50*
Carbon Disulfide 1
Carbon Tetrachloride 5
Chlorobenzene 5
Chloroethane 50*
Chloroform 50*
Chloromethane 5
cis-1,2-Dichloroethene 5
cis-1,3-Dichloropropene 5
Cyclohexane
Dibromochloromethane 5
Dichlorodifluoromethane 7
Ethyl Benzene 5
Isopropylbenzene 50
Methyl Acetate
Methyl tert-butyl Ether 5
Methylcyclohexane
Methylene Chloride 5
Styrene 5
Tert-Butyl Methyl Ether 5
Tetrachloroethene 5
Toluene 5
trans-1,2-Dichloroethene 5
trans-1,3-Dichloropropene 5
Trichloroethene 5
Trichlorofluoromethane 5
Vinyl Chloride 5
Xylene (Total) 5
Notes
* Guidance Value
**Sum of these compounds can not exceed 0.4 ug/L.
U - Compound not detected, Reporting Limit provided.
J - Estimated by Validator.
D - Result of diluted sample shown.
† - The data for these wells is reversed from the Laboratory data summary, as the wells were mislabeled in the field.
Exceeds NYSDEC Class GA Standard or Guidance Value
100 UD 50 UD 10 UD
20 U 20 U 20 U 100 UD 50 UD 10 U 10 U 10 U 10 UD 10 UD 14 UD 2.0 U 2.0 U
20 U 20 U 20 U 100 UD 50 UD 10 U 10 U 10 U 10 UD 10 UD 14 UD 2.0 U 2.0 U
20 U 20 U 20 U 50 UD 10 U 10 U 10 U 10 UD 14 UD 2.0 U 2.0 U
20 U 20 U 20 U 100 UD 50 UD 10 U 10 U 10 U 10 UD 10 UD 14 UD 2.0 U 2.0 U
20 U 20 U 20 U 100 UD 50 UD 10 U 10 U 10 U 10 UD 10 UD 14 UD 2.0 U 2.0 U
20 U 20 U 20 U 100 UD 50 UD 10 U 10 U 10 U 10 UD 10 UD 14 UD 2.0 U 2.0 U
100 UD 50 UD 10 UD 10 UD 14 UD
20 U 20 U 20 U 100 UD 50 UD 4.9 J 10 U 10 U 10 UD 10 UD 14 UD 2.0 U 2.0 U
20 U 20 U 20 U 100 UD 100 UD 10 U 10 U 10 U 10 UD 20 UD 29 UD 2.0 U 2.0 U
20 U 20 U 20 U 100 UD 50 UD 10 U 10 U 10 U 10 UD 10 UD 14 UD 2.0 U 2.0 U
20 U 20 U 20 U 100 UD 50 UD 10 U 10 U 10 U 10 UD 10 UD 14 UD 2.0 U 2.0 U
20 U 20 U 20 U 100 UD 50 UD 10 U 10 U 10 U 10 UD 10 UD 14 UD 2.0 U 2.0 U
20 U 20 U 20 U 100 UD 50 UD 10 U 10 U 10 U 10 UD 10 UD 14 UD 2.0 U 2.0 U
20 U 20 U 20 U 100 UD 50 UD 10 U 10 U 10 U 10 UD 10 UD 14 UD 2.0 U 2.0 U
20 U 20 U 20 U 100 UD 50 UD 10 U 10 U 10 U 10 UD 10 UD 14 UD 2.0 U 2.0 U
200 U 200 U 200 U 400 UD 500 UD 100 U 100 U 100 U 100 UD 100 UD 140 UD 20 U 20 U
100 U 100 U 100 U 200 UD 500 UD 50 U 50 U 50 U 50 UD 100 UD 140 UD 10 U 10 U
100 U 100 U 100 U 200 UD 500 UD 50 U 50 U 50 U 50 UD 100 UD 140 UD 10 U 10 U
200 U 200 U 200 U 400 UD 500 UD 100 U 100 U 100 U 100 UD 100 UD 140 UD 20 U 20 U
20 U 20 U 20 U 40 UD 50 UD 10 U 10 U 10 U 10 UD 10 UD 14 UD 2.0 U 2.0 U
20 U 20 U 20 U 40 UD 50 UD 10 U 10 U 10 U 10 UD 10 UD 14 UD 2.0 U 2.0 U
20 U 20 U 20 U 40 UD 50 UD 10 U 10 U 10 U 10 UD 10 UD 14 UD 2.0 U 2.0 U
20 U 20 U 20 U 40 UD 50 UD 10 U 10 U 10 U 10 UD 10 UD 14 UD 2.0 U 2.0 U
20 U 20 U 20 U 40 UD 50 UD 10 U 10 U 10 U 10 UD 10 UD 14 UD 2.0 U 2.0 U
20 U 20 U 20 U 40 UD 50 UD 10 U 10 U 10 U 10 UD 10 UD 14 UD 2.0 U 2.0 U
20 U 20 U 20 U 40 UD 50 UD 10 U 10 U 10 U 10 UD 10 UD 14 UD 2.0 U 2.0 U
20 U 20 U 20 U 40 UD 50 UD 10 U 10 U 10 U 10 UD 10 UD 14 UD 2.0 U 2.0 U
20 U 20 U 20 U 40 UD 50 UD 10 U 10 U 10 U 10 UD 10 UD 14 UD 2.0 U 2.0 U
20 U 20 U 20 U 40 UD 50 UD 10 U 10 U 10 U 10 UD 10 UD 14 UD 2.0 U 2.0 U
1100 1200 910 2400 D 1,000 UD 800 620 740 470 D 260 D 270 D 110 170
20 U 20 U 20 U 40 UD 50 UD 10 U 10 U 10 U 10 UD 10 UD 14 UD 2.0 U 2.0 U
20 U 20 U 20 U 40 UD 50 UD 10 U 10 U 10 U 10 UD 10 UD 14 UD 2.0 U 2.0 U
20 U 20 U 20 U 40 UD 50 UD 10 U 10 U 10 U 10 UD 10 UD 14 UD 2.0 U 2.0 U
20 U 20 U 20 U 40 UD 50 UD 10 U 10 U 10 U 10 UD 10 UD 14 UD 2.0 U 2.0 U
20 U 20 U 20 U 40 UD 50 UD 10 U 10 U 10 U 10 UD 10 UD 14 UD 2.0 U 2.0 U
20 U 20 U 20 U 40 UD 50 UD 10 U 10 U 10 U 10 UD 10 UD 14 UD 2.0 U 2.0 U
20 U 20 U 50 U 500 UD 10 U 10 U 25 U 10 UD 14 UD 2.0 U 2.0 U
200 U 40 UD 50 UD 10 UD 10 UD 2.8 JD
20 U 20 U 20 U 50 UD 10 U 2.0 J 10 U 10 UD 14 UD 2.0 U 2.0 U
20 U 15 J 20 U 40 UD 50 UD 10 U 10 U 10 U 10 UD 10 UD 14 UD 2.0 U 2.0 U
20 U 20 U 20 U 40 UD 50 UD 10 U 10 U 10 U 10 UD 10 UD 14 UD 2.0 U 2.0 U
20 U 20 U 20 U 10 U 10 U 10 U 1.2 BJ 0.53 J
220 240 180 81 D 50 UD 110 300 34 110 D 57 D 58 D 6.4 36
20 U 20 U 20 U 40 UD 50 UD 10 U 10 U 10 U 10 UD 10 UD 14 UD 2.0 U 2.0 U
19 J 21 20 U 40 UD 50 UD 10 U 10 U 10 U 10 UD 10 UD 14 UD 2.0 U 2.0 U
20 U 20 U 20 U 40 UD 50 UD 10 U 10 U 10 U 10 UD 10 UD 14 UD 2.0 U 2.0 U
170 200 90 40 D 50 UD 47 100 21 67 D 28 D 29 D 4.2 16
20 U 20 U 20 U 40 UD 50 UD 10 U 10 U 10 U 10 UD 10 UD 14 UD 2.0 U 2.0 U
39 39 41 73 D 20 J 10 U 9.4 J 15 26 D 20 D 21 D 4.8 3.6
40 U 40 U 40 U 80 UD 100 UD 20 U 20 U 20 U 20 UD 20 UD 29 UD 4.0 U 4.0 U
MW-25D
11/22/2013
ug/L
MW-25D
10/14/2013
ug/L
MW-25S
10/14/2013
ug/L
MW-25S
ug/L
11/22/201310/14/2013
ug/Lug/L ug/L
MW-25S (DUP)
8/27/2013
MW-25SMW-25D MW-25S
ug/L
1/15/2014
MW-24 (DUP)
ug/L
1/14/2014
MW-24
ug/L
1/14/2014
MW-25D
ug/L
1/15/2014 8/27/2013
MW-24
ug/L
7/14/2014
MW-25D
7/14/2014
ug/L
G:\PROJECT\00266417.0000\FILE\Summary Report\Tables\Table 6 - Groundwater Sampling Summary.xlsx 8 of 9

Table 6.
Groundwater Analytical Data Summary
Sample ID NYSDEC Class GA
Depth or Screen Interval (feet) Standard or
Sampling Date Guidance Value
Units ug/L
VOCs
1,1,1,2-Tetrachloroethane 5
1,1,1-Trichloroethane 5
1,1,2,2-Tetrachloroethane 5
1,1,2-Trichloro-1,2,2-trifluoroethane
1,1,2-Trichloroethane 1
1,1-Dichloroethane 5
1,1-Dichloroethene 5
1,2,3-Trichlorobenzene 5
1,2,4-Trichlorobenzene 5
1,2-Dibromo-3-Chloropropane 0.04
1,2-Dibromoethane 5
1,2-Dichlorobenzene 5
1,2-Dichloroethane 0.04
1,2-Dichloropropane 5
1,3-Dichlorobenzene 3
1,4-Dichlorobenzene 0.6
2-Butanone 1
2-Hexanone 3
4-Methyl-2-Pentanone 5
Acetone 50
Benzene 5
Bromodichloromethane 5
Bromoform
Bromomethane 50*
Carbon Disulfide 1
Carbon Tetrachloride 5
Chlorobenzene 5
Chloroethane 50*
Chloroform 50*
Chloromethane 5
cis-1,2-Dichloroethene 5
cis-1,3-Dichloropropene 5
Cyclohexane
Dibromochloromethane 5
Dichlorodifluoromethane 7
Ethyl Benzene 5
Isopropylbenzene 50
Methyl Acetate
Methyl tert-butyl Ether 5
Methylcyclohexane
Methylene Chloride 5
Styrene 5
Tert-Butyl Methyl Ether 5
Tetrachloroethene 5
Toluene 5
trans-1,2-Dichloroethene 5
trans-1,3-Dichloropropene 5
Trichloroethene 5
Trichlorofluoromethane 5
Vinyl Chloride 5
Xylene (Total) 5
Notes
* Guidance Value
**Sum of these compounds can not exceed 0.4 ug/L.
U - Compound not detected, Reporting Limit provided.
J - Estimated by Validator.
D - Result of diluted sample shown.
† - The data for these wells is reversed from the Laboratory data summary, as the wells were mislabeled in the field.
Exceeds NYSDEC Class GA Standard or Guidance Value
25 UD 25 UD
20 U 1000 U 1000 U 10 U 1.0 U 25 UD 25 UD
20 U 1000 U 1000 U 10 U 1.0 U 25 UD 25 UD
20 U 1000 U 1000 U 10 U 1.0 U20 U 1000 U 1000 U 10 U 1.0 U 25 UD 25 UD
20 U 1000 U 1000 U 10 U 1.0 U 25 UD 0.60 JD
17 J 1000 U 1000 U 4.9 J 1.0 U 25 UD 25 UD
25 UD 25 UD
20 U 1000 U 1000 U 10 U 1.0 U 25 UD 25 UD
20 U 1000 U 1000 U 10 U 1.0 U 25 UD 25 UD
20 U 1000 U 1000 U 10 U 1.0 U 25 UD 25 UD
20 U 1000 U 1000 U 10 U 1.0 U 25 UD 25 UD
20 U 1000 U 1000 U 10 U 0.61 J 25 UD 0.29 JD
20 U 1000 U 1000 U 10 U 1.0 U 25 UD 25 UD
20 U 1000 U 1000 U 10 U 1.0 U 25 UD 25 UD
20 U 1000 U 1000 U 10 U 1.0 U 25 UD 25 UD
200 U 10000 U 10000 U 100 U 10 U 250 UD 10 UD
100 U 5000 U 5000 U 50 U 5.0 U 130 UD 5.0 UD
100 U 5000 U 5000 U 50 U 5.0 U 130 UD 5.0 UD
200 U 10000 U 10000 U 100 U 10 U 250 UD 10 UD
20 U 1000 U 1000 U 10 U 1.0 U 25 UD 1.0 UD
20 U 1000 U 1000 U 10 U 1.0 U 25 UD 1.0 UD
20 U 1000 U 1000 U 10 U 1.0 U 25 UD 1.0 UD
20 U 1000 U 1000 U 10 U 1.0 U 25 UD 1.0 UD
20 U 1000 U 1000 U 10 U 1.0 U 25 UD 1.0 UD
20 U 1000 U 1000 U 10 U 1.0 U 25 UD 1.0 UD
20 U 1000 U 1000 U 10 U 1.0 U 25 UD 1.0 UD
20 U 1000 U 1000 U 12 1.0 U 25 UD 1.0 UD
20 U 1000 U 1000 U 10 U 1.0 U 25 UD 1.0 UD
20 U 1000 U 1000 U 10 U 1.0 U 25 UD 1.0 UD
54000 D 130000 D 110000 D 3100 D 46 1700 D 48
20 U 1000 U 1000 U 10 U 1.0 U 25 UD 1.0 UD
20 U 1000 U 1000 U 10 U 1.0 U 25 UD 1.1
20 U 1000 U 1000 U 10 U 1.0 U 25 UD 1.0 UD
20 U 1000 U 1000 U 10 U 1.0 U 25 UD 1.0 UD
110 1000 U 1000 U 31 1.0 U 25 UD 1.0 UD
52 1000 U 1000 U 24 1.0 U 25 UD 1.0 UD
50 U 2500 U 2500 U 25 U 2.5 U25 UD 0.32 J
20 U 1000 U 1000 U 10 U 1.0 U20 U 1000 U 660 J 10 U 1.0 U 14 J D 1.0 UD
20 U 1000 U 1000 U 10 U 1.0 U 25 UD 1.0 UD
20 U 1000 U 1000 U 4.4 J 1.0 U8100 D 150000 D 77000 1700 D 4.9 570 D 8.8
90 1000 U 1000 U 6.1 J 1.0 U 25 UD 1.0 UD
220 1000 U 1000 U 13 0.99 J 25 UD 1.0 UD
20 U 1000 U 1000 U 10 U 1.0 U 25 UD 1.0 UD
5500 D 13000 28000 260 5.0 300 D 6.9
20 U 1000 U 1000 U 10 U 1.0 U 25 UD 1.0 UD
3600 D 4900 3000 550 3.8 170 D 5.3 UD
520 2000 U 2000 U 130 2.0 U 50 UD 2.0 UD
ug/L
MP-20
7/16/2014 8/27/2013 8/27/2013
ug/L ug/L
IW-01DIW-01SMW-27 MW-28
7/15/20147/15/2014
ug/L
7/15/2014
ug/L
MW-29
7/15/2014
ug/Lug/L
MW-26
G:\PROJECT\00266417.0000\FILE\Summary Report\Tables\Table 6 - Groundwater Sampling Summary.xlsx 9 of 9

Date MW-6R MW-8 MW-14/14R MW-15/15R MW-16/16R MW-17/17R
9/8/2008 0.25 0.75 --- --- --- ---
12/16/2008 1.86 --- --- --- --- ---
4/8/2009 2.25 2.10 --- --- --- ---
7/9/2009 1.63 2.00 --- --- --- ---
8/13/2009 1.79 2.24 --- --- --- ---
8/15/2009 --- --- 0.10 NP --- ---
8/17/2009 0.40 0.50 0.30 NP NP ---
8/21/2009 --- --- 0.45 NP 0.30 0.06
8/25/2009 --- 0.51 0.45 NP 0.50 0.02
8/26/2009 NP 0.39 0.55 NP 0.42 0.01
11/6/2009 --- --- --- --- --- ---
11/9/2009 --- --- NP NP 0.45 NP
11/13/2009 --- --- NP NP NP NP
5/4/2010 --- NP 0.15 NP NP NP
3/9/2011 0.13 0.14 0.08 0.13 NP NP
6/23/2011 <0.01 0.38 0.02 <0.01 NP NP
9/20/2011 --- --- 0.05 NP NP NP
4/4/2012 NP 0.05 NP NP NP NP
10/14/2013 <0.01 0.58 --- NP <0.01 <0.01
11/19/2013 <0.01 0.95 NP NP 0.07 0.08
1/14/2014 NP 0.23 NP --- --- ---
7/7/2014 NP NP NP NP NP 0.02
Notes:
Values presented in feet
NP - No product
"---" Indicates Not Measured
"<0.01" Indicates sheen
Table 7.
LNAPL Thickness Summary
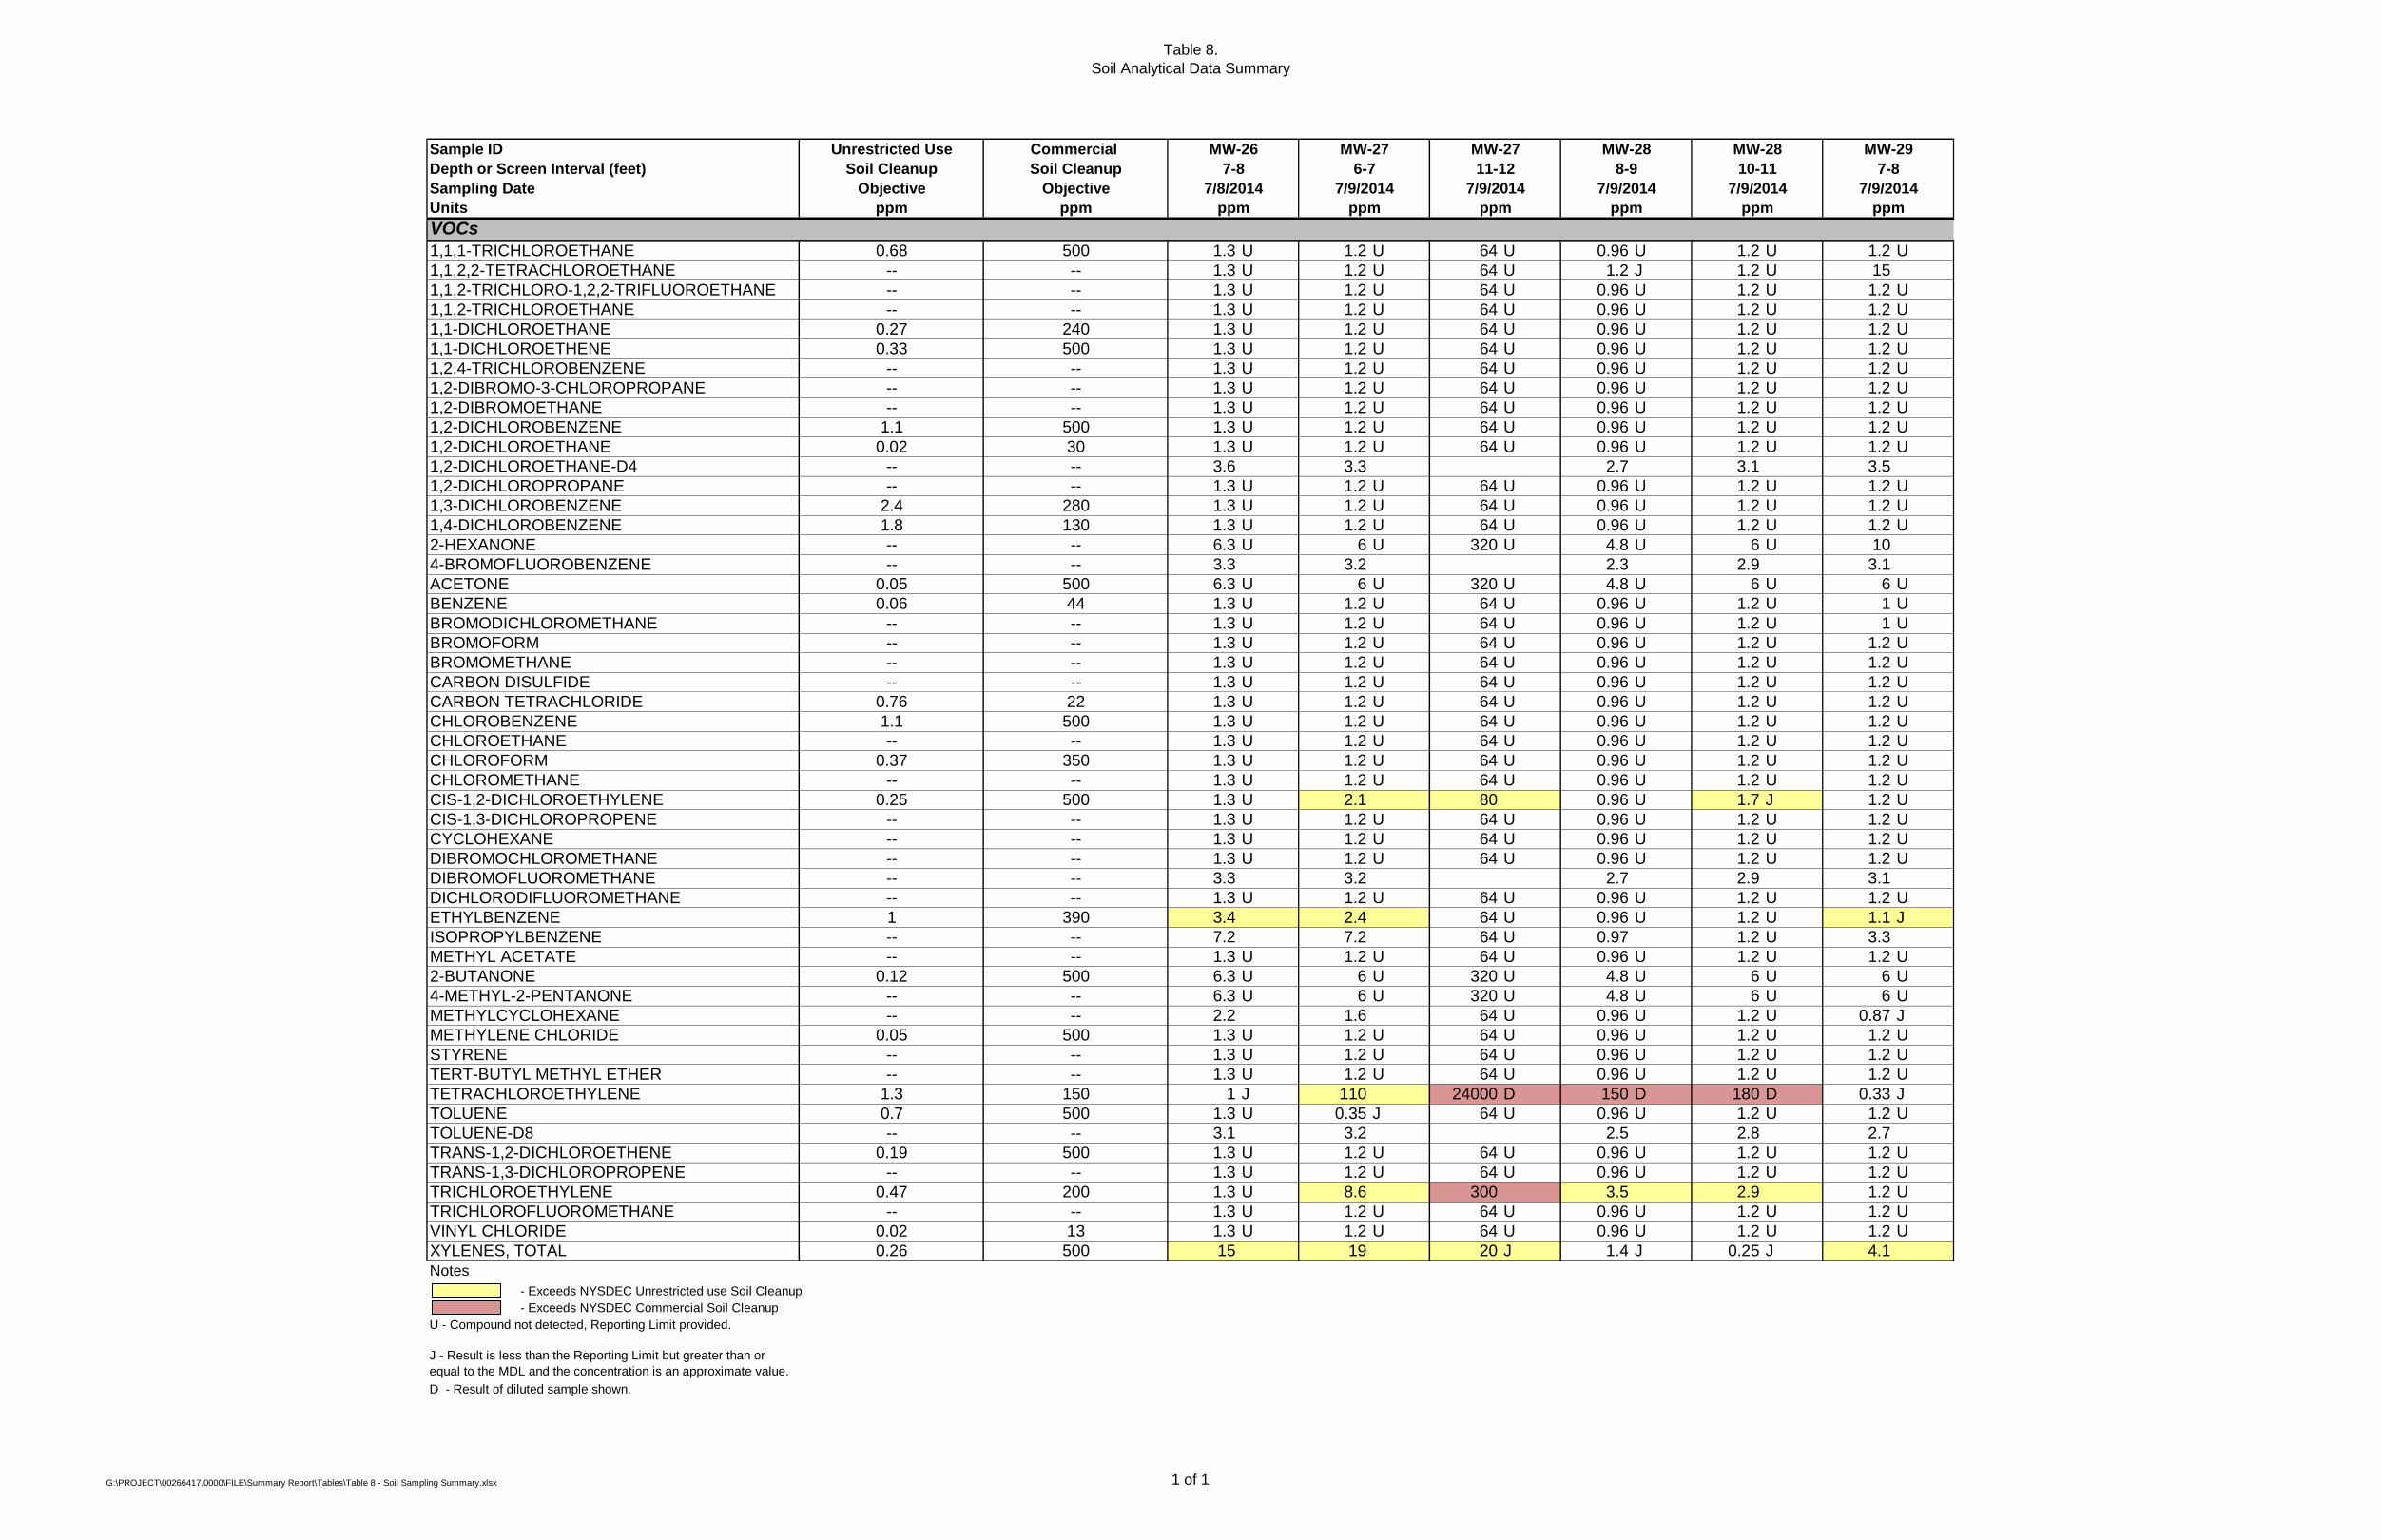
Table 8.
Soil Analytical Data Summary
Sample ID Unrestricted Use Commercial
Depth or Screen Interval (feet) Soil Cleanup Soil Cleanup
Sampling Date Objective Objective
Units ppm ppm
VOCs
1,1,1-TRICHLOROETHANE 0.68 500 1.3 U 1.2 U 64 U 0.96 U 1.2 U 1.2 U
1,1,2,2-TETRACHLOROETHANE -- -- 1.3 U 1.2 U 64 U 1.2 J 1.2 U 15
1,1,2-TRICHLORO-1,2,2-TRIFLUOROETHANE -- -- 1.3 U 1.2 U 64 U 0.96 U 1.2 U 1.2 U
1,1,2-TRICHLOROETHANE -- -- 1.3 U 1.2 U 64 U 0.96 U 1.2 U 1.2 U
1,1-DICHLOROETHANE 0.27 240 1.3 U 1.2 U 64 U 0.96 U 1.2 U 1.2 U
1,1-DICHLOROETHENE 0.33 500 1.3 U 1.2 U 64 U 0.96 U 1.2 U 1.2 U
1,2,4-TRICHLOROBENZENE -- -- 1.3 U 1.2 U 64 U 0.96 U 1.2 U 1.2 U
1,2-DIBROMO-3-CHLOROPROPANE -- -- 1.3 U 1.2 U 64 U 0.96 U 1.2 U 1.2 U
1,2-DIBROMOETHANE -- -- 1.3 U 1.2 U 64 U 0.96 U 1.2 U 1.2 U
1,2-DICHLOROBENZENE 1.1 500 1.3 U 1.2 U 64 U 0.96 U 1.2 U 1.2 U
1,2-DICHLOROETHANE 0.02 30 1.3 U 1.2 U 64 U 0.96 U 1.2 U 1.2 U
1,2-DICHLOROETHANE-D4 -- -- 3.6 3.3 2.7 3.1 3.5
1,2-DICHLOROPROPANE -- -- 1.3 U 1.2 U 64 U 0.96 U 1.2 U 1.2 U
1,3-DICHLOROBENZENE 2.4 280 1.3 U 1.2 U 64 U 0.96 U 1.2 U 1.2 U
1,4-DICHLOROBENZENE 1.8 130 1.3 U 1.2 U 64 U 0.96 U 1.2 U 1.2 U
2-HEXANONE -- -- 6.3 U 6 U 320 U 4.8 U 6 U 10
4-BROMOFLUOROBENZENE -- -- 3.3 3.2 2.3 2.9 3.1
ACETONE 0.05 500 6.3 U 6 U 320 U 4.8 U 6 U 6 U
BENZENE 0.06 44 1.3 U 1.2 U 64 U 0.96 U 1.2 U 1 U
BROMODICHLOROMETHANE -- -- 1.3 U 1.2 U 64 U 0.96 U 1.2 U 1 U
BROMOFORM -- -- 1.3 U 1.2 U 64 U 0.96 U 1.2 U 1.2 U
BROMOMETHANE -- -- 1.3 U 1.2 U 64 U 0.96 U 1.2 U 1.2 U
CARBON DISULFIDE -- -- 1.3 U 1.2 U 64 U 0.96 U 1.2 U 1.2 U
CARBON TETRACHLORIDE 0.76 22 1.3 U 1.2 U 64 U 0.96 U 1.2 U 1.2 U
CHLOROBENZENE 1.1 500 1.3 U 1.2 U 64 U 0.96 U 1.2 U 1.2 U
CHLOROETHANE -- -- 1.3 U 1.2 U 64 U 0.96 U 1.2 U 1.2 U
CHLOROFORM 0.37 350 1.3 U 1.2 U 64 U 0.96 U 1.2 U 1.2 U
CHLOROMETHANE -- -- 1.3 U 1.2 U 64 U 0.96 U 1.2 U 1.2 U
CIS-1,2-DICHLOROETHYLENE 0.25 500 1.3 U 2.1 80 0.96 U 1.7 J 1.2 U
CIS-1,3-DICHLOROPROPENE -- -- 1.3 U 1.2 U 64 U 0.96 U 1.2 U 1.2 U
CYCLOHEXANE -- -- 1.3 U 1.2 U 64 U 0.96 U 1.2 U 1.2 U
DIBROMOCHLOROMETHANE -- -- 1.3 U 1.2 U 64 U 0.96 U 1.2 U 1.2 U
DIBROMOFLUOROMETHANE -- -- 3.3 3.2 2.7 2.9 3.1
DICHLORODIFLUOROMETHANE -- -- 1.3 U 1.2 U 64 U 0.96 U 1.2 U 1.2 U
ETHYLBENZENE 1 390 3.4 2.4 64 U 0.96 U 1.2 U 1.1 J
ISOPROPYLBENZENE -- -- 7.2 7.2 64 U 0.97 1.2 U 3.3
METHYL ACETATE -- -- 1.3 U 1.2 U 64 U 0.96 U 1.2 U 1.2 U
2-BUTANONE 0.12 500 6.3 U 6 U 320 U 4.8 U 6 U 6 U
4-METHYL-2-PENTANONE -- -- 6.3 U 6 U 320 U 4.8 U 6 U 6 U
METHYLCYCLOHEXANE -- -- 2.2 1.6 64 U 0.96 U 1.2 U 0.87 J
METHYLENE CHLORIDE 0.05 500 1.3 U 1.2 U 64 U 0.96 U 1.2 U 1.2 U
STYRENE -- -- 1.3 U 1.2 U 64 U 0.96 U 1.2 U 1.2 U
TERT-BUTYL METHYL ETHER -- -- 1.3 U 1.2 U 64 U 0.96 U 1.2 U 1.2 U
TETRACHLOROETHYLENE 1.3 150 1 J 110 24000 D 150 D 180 D 0.33 J
TOLUENE 0.7 500 1.3 U 0.35 J 64 U 0.96 U 1.2 U 1.2 U
TOLUENE-D8 -- -- 3.1 3.2 2.5 2.8 2.7
TRANS-1,2-DICHLOROETHENE 0.19 500 1.3 U 1.2 U 64 U 0.96 U 1.2 U 1.2 U
TRANS-1,3-DICHLOROPROPENE -- -- 1.3 U 1.2 U 64 U 0.96 U 1.2 U 1.2 U
TRICHLOROETHYLENE 0.47 200 1.3 U 8.6 300 3.5 2.9 1.2 U
TRICHLOROFLUOROMETHANE -- -- 1.3 U 1.2 U 64 U 0.96 U 1.2 U 1.2 U
VINYL CHLORIDE 0.02 13 1.3 U 1.2 U 64 U 0.96 U 1.2 U 1.2 U
XYLENES, TOTAL 0.26 500 15 19 20 J 1.4 J 0.25 J 4.1
Notes
- Exceeds NYSDEC Unrestricted use Soil Cleanup
- Exceeds NYSDEC Commercial Soil Cleanup
U - Compound not detected, Reporting Limit provided.
J - Result is less than the Reporting Limit but greater than or
equal to the MDL and the concentration is an approximate value.
D - Result of diluted sample shown.
MW-29MW-28
10-116-7
ppm
7/9/2014
MW-27
7/8/2014
7-8 7-8
7/9/2014
ppmppm ppm
7/9/2014
ppm ppm
7/9/2014 7/9/2014
MW-26
11-12 8-9
MW-27 MW-28
G:\PROJECT\00266417.0000\FILE\Summary Report\Tables\Table 8 - Soil Sampling Summary.xlsx 1 of 1

Well ID Condition Comments
MW‐1 S Water above well casing upon arrival.
MW‐1D S
MW‐1DD S
MW‐2 S
MW‐3 S
MW‐4 S Well usable ‐ wellhead completion damaged
MW‐5 * Unable to locate ‐ well buried under debris pile
MW‐6R S
MW‐7 S
MW‐8 S
MW‐10S S
MW‐10D S
MW‐11 S
MW‐12 S
MW‐14R S
MW‐15R S
MW‐16R S
MW‐17R S
MW‐18 S
MW‐19 S
MW‐20 S
MW‐21S S
MW‐21D S
MW‐22S U Well is usable, surface completion damaged
MW‐22D U Well is usable, surface completion damaged
MW‐22RS S Loose J‐plug. Water above well casing upon arrival.
MW‐22RD S
MW‐23S S
MW‐23D S
MW‐24 S
MW‐25S S Installed September 2013
MW‐25D S Installed September 2013
MW‐26 S Installed July 2014
MW‐27 S Installed July 2014
MW‐28 S Installed July 2014
MW‐29 S Installed July 2014
IW‐01S S Installed September 2013
IW‐01D S Installed September 2013
GM‐1 * Unable to locate well due to presence of spoil pile
MP‐20 S None
MW‐9 S None
GM‐9 S Not sampled during July 2014 Event
Notes:S ‐ Satisfactory
U ‐ Unsatisfactory
* ‐ Could not locate
Table 9.
Site
Parcel A
Parcel B
Monitoring Well Assessment Summary
1 of 1

Table 10.
Sub-slab and Indoor Air Analytical Summary
Sample Type:
Sample ID
Sampling Date
Dilution Factor
Units
COMPOUND1,1,1-Trichloroethane 5.44 U 1.1 U 0.54 U 1.1 U 5.44 U 1.1 U 1.1 U
1,1,2,2-Tetrachloroethane 6.87 UJ 1.4 U 0.69 U 1.4 U 6.87 UJ 1.4 U 1.4 U
1,1,2-Trichlorotrifluoroethane 7.65 U 1.5 U 0.76 U 1.3 7.65 U 1.5 U 1.5 U
1,1,2-Trichloroethane 5.44 U 1.1 U 0.54 U 1.1 U 5.44 U 1.1 U 1.1 U
1,1-Dichloroethane 4.05 U 0.81 U 0.4 U 0.81 U 4.05 U 0.81 U 0.81 U
1,1-Dichloroethene 3.97 U 0.79 U 0.4 U 0.79 U 3.97 U 0.79 U 0.79 U
1,2,4-Trichlorobenzene 7.4 UJ 3.7 U 0.74 U 3.7 U 7.4 UJ 3.7 U 3.7 U
1,2,4-Trimethylbenzene 4.91 UJ 1.5 379 3.7 U 4.91 UJ 3 3.4
1,2-Dibromoethane 7.69 U 1.5 U 0.77 U 1.5 U 7.69 U 1.5 U 1.5 U
1,2-Dichlorobenzene 6.01 UJ 1.2 U 0.6 U 1.2 U 6.01 UJ 1.2 U 1.2 U
1,2-Dichloroethane 4.05 U 0.81 U 0.4 U 0.81 U 4.05 U 0.81 U 3.5
1,2-Dichloropropane 4.62 U 0.92 U 0.46 U 0.92 U 4.62 U 0.92 U 0.92 U
1,2-Dichlorotetrafluoroethane 1.4 U 1.4 U 1.4 U 1.4 U
1,3,5-Trimethylbenzene 4.91 UJ 1.3 256 6.7 4.91 UJ 2.5 0.98 U
1,3-Butadiene 2.21 UJ 0.44 U 0.22 U 0.44 U 2.21 UJ 0.44 U 0.44 U
1,3-Dichlorobenzene 6.01 UJ 1.2 U 0.6 U 1.2 U 6.01 UJ 1.2 U 1.2 U
1,4-Dichlorobenzene 6.01 UJ 1.2 U 0.6 U 1.2 U 6.01 UJ 1.2 U 1.2 U
1,4-Dioxane 3.6 U 18 U 0.36 U 18 U 3.6 U 18 U 18 U
2,2,4-Trimethylpentane 4.66 U 2.7 6.48 J 59 4.66 U 7.5 2.1
2-Chlorotoluene 5.18 UJ 1.0 U 0.52 U 1.0 U 5.18 UJ 1.0 U 1.0 U
2-HEXANONE 2.0 U 2.0 U 2.0 U
4-Ethyltoluene 4.91 UJ 0.98 U 78.66 J 6.8 4.91 UJ 0.98 U 0.98 U
4-Methyl-2-Pentanone 4.09 U 18.9 J 4.5
Acetone 152 15 3,088.10 12 U 2,850.55 12 U 12 U
Allyl Chloride 3.15 U 1.6 U 0.31 U 1.6 U 3.15 U 1.6 U 1.6 U
Benzene 3.19 U 3.7 9.86 J 13 9.25 0.84 1.2
Benzyl Chloride 1.0 U 1.0 U 1 U
Bromodichloromethane 6.71 U 1.3 U 0.67 U 1.3 U 6.71 U 1.3 U 1.3 U
Bromoethene 4.38 U 0.78 U 0.44 U 0.87 U 4.38 U 0.87 U 0.87 U
Bromoform 10.35 UJ 21 U 1.03 U 2.1 U 10.35 UJ 2.1 U 2.1 U
Bromomethane 3.89 U 0.78 U 0.39 U 0.78 U 3.89 U 0.78 U 0.78 U
Butane 34 41 12 7.5
Carbon Disulfide 3.11 U 1.6 U 1.12 J 1.6 U 3.11 U 1.6 U 1.6 U
Carbon Tetrachloride 3.15 U 1.3 U 0.5 J 1.3 U 3.15 U 1.3 U 1.3 U
Chlorobenzene 4.62 UJ 0.92 U 0.46 U 0.92 U 4.62 UJ 0.92 U 0.92 U
Chlorodifluoromethane 1.8 U 1.8 U 1.8 U 1.8 U
Chloroethane 2.66 U 1.3 U 0.27 U 1.3 U 2.66 U 1.3 U 1.3 U
Chloroform 24.3 7.2 0.92 J 4.8 28.2 0.98 U 0.98 U
Chloromethane 2.04 U 1.0 U 0.2 U 1.0 U 2.04 U 1.0 U 1.0 U
cis-1,2-Dichloroethene 1824 0.79 U 348.9 J 0.79 U 117 3.4 3.1
cis-1,3-Dichloropropene 4.54 U 0.91 U 0.45 U 0.91 U 4.54 U 0.91 U 0.91 U
Cumene 0.98 U 2.2 0.98 U
Cymene 1.1 U 1.1 U 1.1 U 1.1 U
Cyclohexane 3.35 U 3.1 3.39 J 11 3.35 U 1.7 1.3
Dibromochloromethane 8.51 U 1.7 U 0.85 U 1.7 U 8.51 U 1.7 U 1.7 U
Dichlorodifluoromethane 4.95 U 2.6 4.11 J 2.6 5.44 2.6 2.6
Dichlorotetrafluoroethane 6.99 U 0.7 U 6.99 U
Ethyl Benzene 4.34 UJ 7.4 18.3 J 15 4.34 UJ 0.87 U 1.6
Heptane 4.09 U 6.87 J 4.09 U
Hexachloro-1,3-Butadiene 10.7 UJ 1.07 U 10.67 UJ
Hexachlorobutadiene 2.1 U 2.1 U 2.1 U 2.1 U
Hexane 3.52 UJ 10.8 J 3.52 UJ
Isoproypl Alcohol 12 U 12 U 12 U 12 U
m/p-Xylene 4.34 UJ 21 99.2 J 55 5.2 J 4.9 5.7
Methyl Ethyl Ketone 8.1 1.5 1.5 U 2.0 U
Metheyl Isobutyl Ketone 2.0 U 2.0 U 2.0 U 2.0 U
Methyl Methacrylate 4.09 U 2.0 U 0.41 U 2.0 U 4.09 U 2.0 U 2.0 U
Methylene Chloride 7.3 1.7 U 3.02 J 1.7 U 14.3 1.7 U 1.7 U
Napthalene 2.6 U 2.6 U 2.6 U 2.6 U
n-Butane 34 41 7.5 12
n-Heptane 0.82 U 13 0.82 U 0.82 U
n-Hexane 1.7 27 1.4 1.4
n-Propylbenzene 0.98 U 4.3 0.98 U 0.98 U
o-Xylene 4.34 UJ 15 44.6 J 21 4.34 UJ 4.4 3.1
Sec-Butylbenzene 1.1 U 1.1 U 1.1 U 1.1 U
Styrene 4.25 UJ 0.85 U 0.43 U 0.85 U 4.25 UJ 0.85 U 0.85 U
T-Butylbenzene 1.1 U 1.1 U 1.1 U 1.1 U
t-1,3-Dichloropropene 4.54 U 0.45 U 4.54 U
tert-Butyl alcohol 6.96 15 U 363.78 J 15 U 2,152.36 15 U 15 U
Tert-Butyl-Methyl-Ether 0.72 U 0.72 U 0.72 U
Tetrachloroethene 5,492.76 42 1,220.61 J 2.7 28,480.98 110 120
Tetrahydrofuran 2.94 U 15 U 2.89 J 15 U 2.94 U 15 U 15 U
Toluene 3.76 U 31 27.7 J 80 14.7 4 6.3
trans-1,2-Dichloroethene 20.2 0.79 U 2.02 J 0.79 U 3.97 U 0.79 U 0.79 U
Trans-1,3-Dichloropropene
Trichloroethene 644.91 1.1 U 21.8 J 8.4 316 5.2 5.0
Trichlorofluoromethane 5.6 U 1.3 1.46 J 1.3 5.6 U 1.3 1.5
Vinyl Chloride 7.67 0.51 U 107.36 J 0.51 U 2.56 U 0.51 U 0.51 U
Xylene (total) 36 76 9.2 8.9
Notes:
U - The compound was not detected at the indicated concentration.
J - The concentration given is an approximate value.
E - Indicates the analyte‘s concentration exceeds the calibrated range of the instrument
for that specific analysis.
NJ - Compound has been "tentively identified"; associated value represents
approximate concentration.
SS-3 and IA-1 sampled twice during 2013 event due to Summa malfunctions during
first sampling run
2013 data to be validated still
SS-3
11/20/2013
1
ug/M3
SS-1 SS-1 SS-2 SS-2 SS-3 SS-3
ug/M3 ug/M3 ug/M3 ug/M3 ug/M3 ug/M3
10 1 1 1 10 1
SUB-SLAB SAMPLES
1/29/2008 11/19/2013 1/29/2008 11/20/2013 1/29/2008 11/21/2013
1 of 6

Table 10.
Sub-slab and Indoor Air Analytical Summary
Sample Type:
Sample ID
Sampling Date
Dilution Factor
Units
COMPOUND1,1,1-Trichloroethane
1,1,2,2-Tetrachloroethane
1,1,2-Trichlorotrifluoroethane
1,1,2-Trichloroethane
1,1-Dichloroethane
1,1-Dichloroethene
1,2,4-Trichlorobenzene
1,2,4-Trimethylbenzene
1,2-Dibromoethane
1,2-Dichlorobenzene
1,2-Dichloroethane
1,2-Dichloropropane
1,2-Dichlorotetrafluoroethane
1,3,5-Trimethylbenzene
1,3-Butadiene
1,3-Dichlorobenzene
1,4-Dichlorobenzene
1,4-Dioxane
2,2,4-Trimethylpentane
2-Chlorotoluene
2-HEXANONE
4-Ethyltoluene
4-Methyl-2-Pentanone
Acetone
Allyl Chloride
Benzene
Benzyl Chloride
Bromodichloromethane
Bromoethene
Bromoform
Bromomethane
Butane
Carbon Disulfide
Carbon Tetrachloride
Chlorobenzene
Chlorodifluoromethane
Chloroethane
Chloroform
Chloromethane
cis-1,2-Dichloroethene
cis-1,3-Dichloropropene
Cumene
Cymene
Cyclohexane
Dibromochloromethane
Dichlorodifluoromethane
Dichlorotetrafluoroethane
Ethyl Benzene
Heptane
Hexachloro-1,3-Butadiene
Hexachlorobutadiene
Hexane
Isoproypl Alcohol
m/p-Xylene
Methyl Ethyl Ketone
Metheyl Isobutyl Ketone
Methyl Methacrylate
Methylene Chloride
Napthalene
n-Butane
n-Heptane
n-Hexane
n-Propylbenzene
o-Xylene
Sec-Butylbenzene
Styrene
T-Butylbenzene
t-1,3-Dichloropropene
tert-Butyl alcohol
Tert-Butyl-Methyl-Ether
Tetrachloroethene
Tetrahydrofuran
Toluene
trans-1,2-Dichloroethene
Trans-1,3-Dichloropropene
Trichloroethene
Trichlorofluoromethane
Vinyl Chloride
Xylene (total)
Notes:
U - The compound was not detected at the indicated concentration.
J - The concentration given is an approximate value.
E - Indicates the analyte‘s concentration exceeds the calibrated range of the instrument
for that specific analysis.
NJ - Compound has been "tentively identified"; associated value represents
approximate concentration.
SS-3 and IA-1 sampled twice during 2013 event due to Summa malfunctions during
first sampling run
2013 data to be validated still
5.44 U 1.1 U 5.44 UJ 1.1 U 5.44 U 1.1 U 5.44 U
6.87 UJ 1.4 U 6.87 UJ 1.4 U 6.87 U 1.4 U 6.87 UJ
7.65 U 1.5 U 7.65 UJ 1.5 U 7.65 U 1.5 U 5.44 U
5.44 U 1.1 U 5.44 UJ 1.1 U 5.44 U 1.1 U 7.65 U
4.05 U 0.81 U 4.05 UJ 0.81 U 4.05 U 0.81 U 4.05 U
3.97 U 0.79 U 3.97 UJ 0.79 U 3.97 U 0.79 U 3.97 U
7.4 UJ 3.7 U 7.4 UJ 3.7 U 7.4 U 3.7 U 7.4 UJ
4.91 UJ 1.2 4.91 UJ 3.6 4.91 U 0.98 U 4.91 UJ
7.69 U 1.5 U 7.69 UJ 1.5 U 7.69 U 1.5 U 7.69 U
6.01 UJ 1.2 U 6.01 UJ 1.2 U 6.01 U 1.2 U 6.01 UJ
4.05 U 17 4.05 UJ 0.81 U 4.05 U 0.81 U 4.05 U
4.62 U 0.92 U 4.62 UJ 0.92 U 4.62 U 0.92 U 4.62 U
1.4 U 1.4 U 1.4 U
4.91 UJ 1.1 4.91 UJ 1.0 4.91 U 0.98 U 4.91 UJ
2.21 UJ 0.44 U 2.21 UJ 0.44 U 2.21 U 0.44 U 2.21 UJ
6.01 UJ 1.2 U 6.01 UJ 1.2 U 6.01 U 1.2 U 6.01 UJ
6.01 UJ 1.2 U 6.01 UJ 1.2 U 6.01 U 1.2 U 6.01 UJ
3.6 U 18 U 3.6 UJ 18 U 3.6 U 18 U 3.6 U
4.66 U 1.1 U 4.66 UJ 7.5 4.66 U 0.93 U 6.06 J
5.18 UJ 1.0 U 5.18 UJ 1.0 U 5.18 U 1.0 U 5.18 UJ
2.0 U 0.98 U
4.91 UJ 0.98 U 4.91 UJ 0.99 4.91 U 0.98 U 4.91 UJ
6.54 4.09 UJ 4.09 U 4.09 U
1,425.28 12 U 47.20 J 12 U 216 12 U 807.66
3.15 U 1.6 U 3.15 UJ 1.6 U 3.15 U 1.6 U 3.15 U
3.83 0.64 U 3.19 UJ 2.0 4.15 0.85 13.4 J
1.0 U 1.0 U
6.71 U 1.3 U 6.71 UJ 1.3 U 6.71 U 1.3 U 6.71 U
4.38 U 0.78 U 4.38 UJ 0.87 U 4.38 U 0.78 4.38 U
10.35 UJ 2.1 U 10.35 UJ 2.1 U 10.35 U 2.1 U 10.35 UJ
3.89 U 0.78 U 3.89 UJ 0.78 U 3.89 U 0.78 U 3.89 U
3.1 8.4 8.4
3.11 U 1.6 U 12.1 J 1.6 U 3.11 U 3.0 U 3.11 U
3.15 U 1.3 U 3.15 UJ 1 3.15 U 3.0 3.15 U
4.62 UJ 0.92 U 4.62 UJ 0.92 U 4.62 U 0.92 U 4.62 UJ
1.8 U 1.8 U 1.8 U
2.66 U 1.3 U 2.66 UJ 1.3 U 2.66 U 1.3 U 2.66 U
84.7 0.98 U 349 J 0.98 U 80.8 0.98 U 4.87 U
2.04 U 1.0 U 2.04 UJ 1.1 2.04 U 1.0 U 2.04 U
37.3 16 3.97 UJ 1.6 U 3.97 U 0.79 U 3.97 U
4.54 U 0.91 U 4.54 UJ 0.91 U 4.54 U 0.91 U 4.54 U
0.98 U
1.1 U 1.1 U 1.1 U
3.35 U 0.69 U 3.35 UJ 1.6 3.35 U 1.0 3.35 U
8.51 U 1.7 U 8.51 UJ 1.7 U 8.51 U 1.7 U 8.51 U
4.95 U 2.7 4.95 UJ 2.9 4.95 U 2.5 U 3.46 J
6.99 U 1.4 U 6.99 UJ 6.99 U 6.99 U
4.34 UJ 0.87 U 4.34 UJ 2.1 4.34 U 0.87 U 4.34 UJ
4.09 U 4.09 UJ 4.09 U 5.32
10.67 UJ 10.67 UJ 10.67 U 10.67 UJ
2.1 U 2.1 U 2.1 U
3.52 UJ 3.52 UJ 3.52 U 3.52 UJ
12 U 12 U 12 U
4.34 UJ 2.2 4.34 UJ 7.7 3.9 J 2.2 U 13 J
2.0 U 1.5 U 1.8
2.0 U 2.0 U 2.0 U
4.09 U 2.0 U 4.09 UJ 2.0 U 4.09 U 2.0 U 4.09 U
11.8 J 1.7 U 11.1 J 1.7 U 24.3 1.7 U 17
2.6 U 2.6 U 2.6 U
3.1 8.4 8.4
0.82 U 1.9 0.82 U
0.70 U 4.4 0.70 U
0.98 U 0.98 0.98 U
4.34 UJ 0.87 U 4.34 UJ 2.7 4.34 U 0.87 U 4.34 J
1.1 U 1.1 U 1.1 U
4.25 UJ 0.85 U 4.25 UJ 0.85 U 4.25 U 0.85 U 4.25 UJ
1.1 U 1.1 U 1.1 U
4.54 U 4.54 UJ 4.54 U 4.54 U
1079 EJ 15 U 13.9 J 15 U 184 15 U 1,061.02
0.72 U
17,631.08 150 140 J 2.2 91.7 11 29.9
2.94 U 15 U 2.94 UJ 15 U 2.94 U 15 U 2.94 U
3.76 U 0.75 U 3.76 UJ 2.2 7.9 0.75 U 35.7
3.97 U 1.4 3.97 UJ 0.79 U 3.97 U 0.79 U 3.97 U
521.3 12 2.69 UJ 1.1 U 6.43 1.1 U 2.69 U
5.6 U 1.4 5.6 UJ 1.5 5.6 U 1.3 5.6 U
2.56 U 0.51 U 2.56 UJ 0.51 U 2.56 U 0.51 U 2.56 U
2.9 10 1.1
SS-4 SS-5 SS-5 SS-6 SS-6 SS-7SS-4
ug/M3 ug/M3 ug/M3 ug/M3 ug/M3 ug/M3ug/M3
1 10 1 1010 1 10
SUB-SLAB SAMPLES
1/29/2008 11/20/2013 1/29/2008 11/20/2013 1/29/2008 11/20/2013 1/29/2008
2 of 6

Table 10.
Sub-slab and Indoor Air Analytical Summary
Sample Type:
Sample ID
Sampling Date
Dilution Factor
Units
COMPOUND1,1,1-Trichloroethane
1,1,2,2-Tetrachloroethane
1,1,2-Trichlorotrifluoroethane
1,1,2-Trichloroethane
1,1-Dichloroethane
1,1-Dichloroethene
1,2,4-Trichlorobenzene
1,2,4-Trimethylbenzene
1,2-Dibromoethane
1,2-Dichlorobenzene
1,2-Dichloroethane
1,2-Dichloropropane
1,2-Dichlorotetrafluoroethane
1,3,5-Trimethylbenzene
1,3-Butadiene
1,3-Dichlorobenzene
1,4-Dichlorobenzene
1,4-Dioxane
2,2,4-Trimethylpentane
2-Chlorotoluene
2-HEXANONE
4-Ethyltoluene
4-Methyl-2-Pentanone
Acetone
Allyl Chloride
Benzene
Benzyl Chloride
Bromodichloromethane
Bromoethene
Bromoform
Bromomethane
Butane
Carbon Disulfide
Carbon Tetrachloride
Chlorobenzene
Chlorodifluoromethane
Chloroethane
Chloroform
Chloromethane
cis-1,2-Dichloroethene
cis-1,3-Dichloropropene
Cumene
Cymene
Cyclohexane
Dibromochloromethane
Dichlorodifluoromethane
Dichlorotetrafluoroethane
Ethyl Benzene
Heptane
Hexachloro-1,3-Butadiene
Hexachlorobutadiene
Hexane
Isoproypl Alcohol
m/p-Xylene
Methyl Ethyl Ketone
Metheyl Isobutyl Ketone
Methyl Methacrylate
Methylene Chloride
Napthalene
n-Butane
n-Heptane
n-Hexane
n-Propylbenzene
o-Xylene
Sec-Butylbenzene
Styrene
T-Butylbenzene
t-1,3-Dichloropropene
tert-Butyl alcohol
Tert-Butyl-Methyl-Ether
Tetrachloroethene
Tetrahydrofuran
Toluene
trans-1,2-Dichloroethene
Trans-1,3-Dichloropropene
Trichloroethene
Trichlorofluoromethane
Vinyl Chloride
Xylene (total)
Notes:
U - The compound was not detected at the indicated concentration.
J - The concentration given is an approximate value.
E - Indicates the analyte‘s concentration exceeds the calibrated range of the instrument
for that specific analysis.
NJ - Compound has been "tentively identified"; associated value represents
approximate concentration.
SS-3 and IA-1 sampled twice during 2013 event due to Summa malfunctions during
first sampling run
2013 data to be validated still
1.1 U 5.44 UJ 4.4 U 15.8 1.6 U 5.44 U 1.1 U
1.4 U 6.87 UJ 5.5 U 6.87 UJ 2.1 U 6.87 UJ 1.4 U
1.5 U 5.44 UJ 6.1 U 18.4 2.3 U 5.44 U 1.5 U
1.1 U 7.65 U 4.4 U 5.44 U 1.6 U 7.65 U 1.1 U
0.81 U 4.05 U 3.2 U 43.3 2.1 4.05 U 0.81 U
0.79 U 3.97 U 3.2 U 29.8 1.2 U 31.7 0.79 U
3.7 U 7.4 UJ 15 U 7.4 UJ 5.6 U 7.4 UJ 3.7 U
1.4 4.91 UJ 3.9 U 4.91 UJ 1.5 U 4.91 UJ 1.0
1.5 U 7.69 UJ 6.1 U 7.69 U 2.3 U 7.69 U 1.5 U
1.2 U 6.01 UJ 4.8 U 6.01 UJ 1.8 U 6.01 UJ 1.2 U
0.81 U 4.05 UJ 3.2 U 4.05 U 1.2 U 4.05 U 0.81 U
0.92 U 4.62 UJ 3.7 U 4.62 U 1.4 U 4.62 U 1.4 U
1.4 U 5.6 U 2.1 U 1.4 U
0.98 U 4.91 UJ 3.9 U 74.1 J 1.5 U 4.91 UJ 0.98 U
0.44 U 2.21 UJ 1.8 U 2.21 UJ 0.66 U 2.21 UJ 0.43
1.2 U 6.01 UJ 4.8 U 6.01 UJ 1.8 U 6.01 UJ 1.2 U
1.2 U 6.01 UJ 4.8 U 6.01 UJ 1.8 U 6.01 UJ 1.2 U
18 U 3.6 UJ 72 U 3.6 U 27 U 3.6 U 18 U
2.2 4.66 UJ 3.7 U 4.66 U 1.4 U 4.66 U 2.3
1.0 U 5.18 UJ 4.1 U 5.18 UJ 1.6 U 5.18 UJ 1.0 U
2.0 U 8.2 U 3.1 U 2.0 U
0.98 U 4.91 UJ 3.9 U 14.2 J 1.5 U 4.91 UJ 0.98 U
4.09 UJ 4.09 U 4.09 U
12 U 38.20 48 U 1,472.79 18 U 108 40
1.6 U 3.15 U 6.3 U 3.15 U 2.3 U 3.15 U 1.6 U
1.5 3.19 UJ 2.6 U 11.5 0.96 U 21.4 0.99
1.0 U 4.1 U 1.6 U 1.0 U
1.3 U 6.71 UJ 5.4 U 6.71 U 2.0 U 6.71 U 1.3 U
0.87 U 4.38 U 3.5 U 4.38 U 1.3 U 4.38 U 0.87 U
2.1 U 10.35 UJ 8.3 U 10.35 UJ 3.1 U 10.35 UJ 2.1 U
0.78 U 3.89 U 3.1 U 3.89 U 1.2 U 3.89 U 0.78 U
14 4.8 U 1.8 U 4.6
1.6 U 3.11 U 6.2 U 3.11 U 2.3 U 3.11 U 2.0
1.3 U 6.93 J 5.0 U 3.15 U 1.9 U 3.78 J 1.3 U
0.92 U 4.62 UJ 3.7 U 4.62 UJ 1.4 U 4.62 UJ 0.92 U
1.8 U 7.1 U 2.7 U 1.8 U
1.0 U 2.66 U 5.3 U 156 2.0 U 2.66 U 1.3 U
0.98 U 54 J 120 21.9 140 34.1 27
1.0 U 2.04 U 4.1 U 2.04 U 1.5 U 2.04 U 1.0 U
2.6 14.3 J 3.2 U 2,498 1.2 U 833 0.79 U
0.91 U 4.54 UJ 3.6 U 4.54 U 1.4 U 4.54 U 0.91 U
0.98 U
1.1 U 4.4 U 1.6 U 1.1 U
2.0 3.35 U 2.8 U 3.35 U 1.0 U 3.35 U 0.69 U
1.7 U 8.51 UJ 6.8 U 8.51 U 2.6 U 8.51 U 1.7 U
2.9 4.95 U 9.9 U 6.93 J 3.7 U 11.4 J 2.5 U
6.99 U 6.99 U 1.2 U 6.99 U 0.79 U
1.5 4.34 UJ 3.5 U 4.34 UJ 1.3 U 4.34 UJ 0.85
4.09 U 4.09 U 4.09 U
10.67 UJ 10.67 UJ 10.67 UJ
2.1 U 8.5 U 3.2 U 2.1 U
3.52 UJ 3.52 UJ 3.52 UJ
12 U 49 U 18 U 12 U
5.8 4.34 UJ 8.7 U 5.2 J 3.3 U 4.34 UJ 2.2 U
1.5 U 5.9 U 2.2 U 3.3
2.0 U 8.2 U 3.1 U 2.0 U
2.0 U 4.09 U 8.2 U 4.09 U 3.1 U 4.09 U 2.0 U
3.6 8.69 6.9 U 12.5 J 2.6 U 13.2 1.7 U
2.6 U 10 U 3.9 U 2.6 U
14 4.4 U 1.6 U 1.1 U
1.7 3.3 U 1.2 U 1.4
2.8 2.8 U 1.1 U 1.5
0.98 U 3.9 U 1.5 U 0.98 U
1.9 4.34 UJ 3.5 U 9.1 J 1.3 U 4.34 UJ 0.87 U
1.1 U 4.4 U 1.6 U 1.1 U
0.85 U 4.25 UJ 3.4 U 4.25 U 1.3 U 4.25 UJ 0.85 U
1.1 U 4.4 U 1.6 U 1.1 U
4.54 UJ 4.54 U 4.54 U
15 U 3.03 U 61 U 97.2 23 U 3.03 U 15 U
0.72 U 2.9 U 1.1 U 0.72 U
200 8,137.42 J 750 650,993.87 EJ 280 413,652.35 120
15 U 2.94 UJ 59 U 2.94 U 22 U 2.94 U 15 U
6.7 3.76 UJ 3.0 U 6.02 1.1 U 25.6 3.4
0.79 U 3.97 U 3.2 U 264 1.2 U 327 0.79 U
0.91 U 3.6 U 1.4 U 0.91 U
5.1 228 J 25 11,285.89 3.1 12,898.16 1.1 U
2.0 5.6 U 4.5 U 5.6 U 1.7 5.6 U 1.2
0.51 U 2.56 U 2.0 U 115 0.77 U 13 0.51 U
7.7 3.5 U 1.3 U 2.9
SS-10 SS-10
11/20/2013
1
ug/M3ug/M3 ug/M3
SS-7 SS-8 SS-8 SS-9 SS-9
ug/M3 ug/M3 ug/M3
1 10
ug/M3
1/29/2008
1 10 1 10
11/21/2013 1/29/2008 11/20/2013 1/29/2008 11/20/2013
SUB-SLAB SAMPLES
3 of 6

Table 10.
Sub-slab and Indoor Air Analytical Summary
Sample Type:
Sample ID
Sampling Date
Dilution Factor
Units
COMPOUND1,1,1-Trichloroethane
1,1,2,2-Tetrachloroethane
1,1,2-Trichlorotrifluoroethane
1,1,2-Trichloroethane
1,1-Dichloroethane
1,1-Dichloroethene
1,2,4-Trichlorobenzene
1,2,4-Trimethylbenzene
1,2-Dibromoethane
1,2-Dichlorobenzene
1,2-Dichloroethane
1,2-Dichloropropane
1,2-Dichlorotetrafluoroethane
1,3,5-Trimethylbenzene
1,3-Butadiene
1,3-Dichlorobenzene
1,4-Dichlorobenzene
1,4-Dioxane
2,2,4-Trimethylpentane
2-Chlorotoluene
2-HEXANONE
4-Ethyltoluene
4-Methyl-2-Pentanone
Acetone
Allyl Chloride
Benzene
Benzyl Chloride
Bromodichloromethane
Bromoethene
Bromoform
Bromomethane
Butane
Carbon Disulfide
Carbon Tetrachloride
Chlorobenzene
Chlorodifluoromethane
Chloroethane
Chloroform
Chloromethane
cis-1,2-Dichloroethene
cis-1,3-Dichloropropene
Cumene
Cymene
Cyclohexane
Dibromochloromethane
Dichlorodifluoromethane
Dichlorotetrafluoroethane
Ethyl Benzene
Heptane
Hexachloro-1,3-Butadiene
Hexachlorobutadiene
Hexane
Isoproypl Alcohol
m/p-Xylene
Methyl Ethyl Ketone
Metheyl Isobutyl Ketone
Methyl Methacrylate
Methylene Chloride
Napthalene
n-Butane
n-Heptane
n-Hexane
n-Propylbenzene
o-Xylene
Sec-Butylbenzene
Styrene
T-Butylbenzene
t-1,3-Dichloropropene
tert-Butyl alcohol
Tert-Butyl-Methyl-Ether
Tetrachloroethene
Tetrahydrofuran
Toluene
trans-1,2-Dichloroethene
Trans-1,3-Dichloropropene
Trichloroethene
Trichlorofluoromethane
Vinyl Chloride
Xylene (total)
Notes:
U - The compound was not detected at the indicated concentration.
J - The concentration given is an approximate value.
E - Indicates the analyte‘s concentration exceeds the calibrated range of the instrument
for that specific analysis.
NJ - Compound has been "tentively identified"; associated value represents
approximate concentration.
SS-3 and IA-1 sampled twice during 2013 event due to Summa malfunctions during
first sampling run
2013 data to be validated still
0.54 U 1.1 U 1.1 U 0.54 U 1.1 U 0.54 U
0.69 U 1.4 U 1.4 U 0.69 U 1.4 U 0.69 U
0.54 U 1.5 U 1.5 U 0.54 U 1.5 U 0.54 U
0.76 U 1.1 U 1.1 U 0.76 U 1.1 U 0.76 U
0.4 U 0.81 U 0.81 U 0.4 U 0.81 U 0.4 U
0.4 U 0.79 U 0.79 U 0.4 U 0.79 U 0.4 U
0.74 U 3.7 U 3.7 U 0.89 3.7 U 0.74 U
2.8 0.98 U 23 6.48 3 3.39
0.77 U 1.5 U 1.5 U 0.77 U 1.5 U 0.77 U
0.6 U 1.2 U 1.2 U 0.6 U 1.2 U 0.6 U
0.4 U 0.81 U 0.81 U 0.4 U 0.81 U 0.4 U
0.46 U 0.92 U 0.92 U 0.46 U 0.92 U 0.46 U
1.4 U 1.4 U 1.4 U
1.18 0.98 U 6.4 1.72 0.98 U 0.88
0.22 U 0.44 U 0.44 U 0.22 U 0.44 U 0.22 U
0.6 U 1.2 U 1.2 U 0.6 U 1.2 U 0.6 U
0.6 U 1.2 U 1.2 U 1.2 1.2 U 0.6 U
0.36 U 18 U 18 U 0.36 U 18 U 0.36 U
10.5 0.93 U 60 7.46 8.4 5.87
0.52 U 1.0 U 1.0 U 0.52 U 1.0 U 0.52 U
2.0 U 2.0 U 2.0 U
1.08 0.98 U 6.4 1.57 0.98 U 0.83
0.41 U 0.41 U 0.61
45.13 12 U 12 U 38.01 12 U 30.88
0.31 U 1.6 U 1.6 U 0.31 U 1.6 U 0.31 U
15.6 0.91 9.1 14.2 2.3 10
1.0 U 1.0 U 1.0 U
0.67 U 1.3 U 1.3 U 0.67 U 1.3 U 0.67 U
0.44 U 0.87 U 0.87 U 0.44 U 0.87 U 0.44 U
1.03 U 2.1 U 2.1 U 1.03 U 2.1 U 1.03 U
0.39 U 0.78 U 0.78 U 0.39 U 0.78 U 0.39 U
1.6 57 15
0.31 U 1.6 U 1.6 U 0.31 U 1.6 U 0.31 U
0.57 J 1.3 U 1.3 U 0.63 J 1.3 U 0.57 J
0.46 U 0.92 U 0.92 U 0.46 U 0.92 U 0.46 U
0.61 1.8 U 1.8 U 1.8 U 0.27 U
4.82 1.3 U 1.3 U 0.27 U 1.3 U 2.77
0.98 U 0.98 U 18.8 0.98 U
1.06 1.0 U 1.1 1.1 1.1 1
0.87 0.79 U 0.79 U 0.4 J 0.79 U 0.95
0.45 U 0.91 U 0.91 U 0.45 U 0.91 U 0.45 U
1.1 U 1.1 U 1.1 U
7.48 0.69 U 10 5.03 1.7 3.42
0.85 U 1.7 U 1.7 U 0.85 U 1.7 U 0.85 U
5.34 2.5 U 2.5 3.07 2.5 28.5
0.7 U 0.79 U 0.79 U 0.7 U 0.79 U 0.7 U
7.89 0.87 U 13 4.99 0.87 3.29
10.4 5.93 4.34
1.07 U 1.07 U 1.07 U
2.1 U 2.1 U 2.1 U
30.5 37.5 28.1
12 U 12 U 12 U
22 2.2 U 44 14.5 7.1 8.84
1.5 U 1.5 U 1.5 U
2.0 U 2.0 U 2.0 U
0.41 U 2.0 U 3.7 0.41 U 2.0 U 0.41 U
4.1 3.6 1.7 U 3.51 1.7 U 5.15
2.6 U 2.6 2.6 U
1.1 U 1.1 U 1.1 U
0.82 U 15 2.5
0.70 U 30 5.3
0.98 U 4.2 0.98 U
7.54 0.87 U 17 4.9 2.7 3.16
1.1 U 1.1 U 1.1 U
0.3 J 0.85 U 0.85 U 0.47 0.85 U 0.43 U
1.1 U 1.1 U 1.1 U
0.45 U 0.45 U 0.45 U
0.3 U 15 U 15 U 0.85 15 U 0.82
0.72 U 0.72 U 0.72 U
16.2 1.4 U 1.4 U 7.13 1.4 U 94.3
2.53 15 U 15 U 0.71 15 U 0.29 U
86.68 0.85 56 189 E 11 67.83
0.4 U 0.79 U 0.79 U 0.4 U 0.79 U 0.4 U
0.91 U 0.91 U 0.91 U
1.39 J 1.1 U 1.1 U 0.75 J 1.1 U 6.59
1.46 1.2 1.2 0.56 U 1.2 1.34
0.26 U 0.51 U 0.51 U 0.26 U 0.51 U 0.26 U
0.87 U 61 9.9
IA-3IA-1 IA-1 IA-1 IA-2 IA-2
ug/M3 ug/M3 ug/M3 ug/M3 ug/M3 ug/M3
1 1 1 1
1/29/2008
1 1
1/29/2008
INDOOR AIR SAMPLES
11/20/2013 11/21/2013 1/29/2008 11/20/2013
4 of 6

Table 10.
Sub-slab and Indoor Air Analytical Summary
Sample Type:
Sample ID
Sampling Date
Dilution Factor
Units
COMPOUND1,1,1-Trichloroethane
1,1,2,2-Tetrachloroethane
1,1,2-Trichlorotrifluoroethane
1,1,2-Trichloroethane
1,1-Dichloroethane
1,1-Dichloroethene
1,2,4-Trichlorobenzene
1,2,4-Trimethylbenzene
1,2-Dibromoethane
1,2-Dichlorobenzene
1,2-Dichloroethane
1,2-Dichloropropane
1,2-Dichlorotetrafluoroethane
1,3,5-Trimethylbenzene
1,3-Butadiene
1,3-Dichlorobenzene
1,4-Dichlorobenzene
1,4-Dioxane
2,2,4-Trimethylpentane
2-Chlorotoluene
2-HEXANONE
4-Ethyltoluene
4-Methyl-2-Pentanone
Acetone
Allyl Chloride
Benzene
Benzyl Chloride
Bromodichloromethane
Bromoethene
Bromoform
Bromomethane
Butane
Carbon Disulfide
Carbon Tetrachloride
Chlorobenzene
Chlorodifluoromethane
Chloroethane
Chloroform
Chloromethane
cis-1,2-Dichloroethene
cis-1,3-Dichloropropene
Cumene
Cymene
Cyclohexane
Dibromochloromethane
Dichlorodifluoromethane
Dichlorotetrafluoroethane
Ethyl Benzene
Heptane
Hexachloro-1,3-Butadiene
Hexachlorobutadiene
Hexane
Isoproypl Alcohol
m/p-Xylene
Methyl Ethyl Ketone
Metheyl Isobutyl Ketone
Methyl Methacrylate
Methylene Chloride
Napthalene
n-Butane
n-Heptane
n-Hexane
n-Propylbenzene
o-Xylene
Sec-Butylbenzene
Styrene
T-Butylbenzene
t-1,3-Dichloropropene
tert-Butyl alcohol
Tert-Butyl-Methyl-Ether
Tetrachloroethene
Tetrahydrofuran
Toluene
trans-1,2-Dichloroethene
Trans-1,3-Dichloropropene
Trichloroethene
Trichlorofluoromethane
Vinyl Chloride
Xylene (total)
Notes:
U - The compound was not detected at the indicated concentration.
J - The concentration given is an approximate value.
E - Indicates the analyte‘s concentration exceeds the calibrated range of the instrument
for that specific analysis.
NJ - Compound has been "tentively identified"; associated value represents
approximate concentration.
SS-3 and IA-1 sampled twice during 2013 event due to Summa malfunctions during
first sampling run
2013 data to be validated still
1.1 U 0.54 U 1.1 U 0.54 U 1.1 U 0.54 U 1.1 U
1.4 U 0.69 U 1.4 U 0.69 U 1.4 U 0.69 U 1.4 U
1.5 U 0.54 U 1.5 U 0.54 U 1.5 U 0.54 U 1.5 U
1.1 U 0.76 U 1.1 U 0.76 U 1.1 U 0.76 U 1.1 U
0.81 U 0.4 U 0.81 U 0.4 U 0.81 U 0.4 U 0.81 U
0.79 U 0.4 U 0.79 U 0.4 U 0.79 U 0.4 U 0.79 U
3.7 U 0.74 U 3.7 U 0.74 U 3.7 U 0.74 U 3.7 U
0.98 U 17.8 19 5.5 1.4 8.74 1.0
1.5 U 0.77 U 1.5 U 0.77 U 1.5 U 0.77 U 1.5 U
1.2 U 0.6 U 1.2 U 0.6 U 1.2 U 0.6 U 1.2 U
0.81 U 0.4 U 0.81 U 0.4 U 0.81 U 0.4 U 0.81 U
0.92 U 0.46 U 0.92 U 0.46 U 0.92 U 0.46 U 0.92 U
1.4 U 1.4 U 1.4 U 1.4 U
0.98 U 5.4 5.4 1.87 0.98 U 2.75 0.98 U
0.44 U 0.22 U 4.2 0.22 U 1.1 0.22 U 0.44 U
1.2 U 0.6 U 1.2 U 0.6 U 1.2 U 0.6 U 1.2 U
1.2 U 0.6 U 1.2 U 0.3 J 1.2 U 0.6 U 1.2 U
18 U 0.36 U 18 U 0.36 U 18 U 0.36 U 18 U
3 21.1 31 9.56 7.5 14.8 2.0
1.0 U 0.52 U 1.0 U 0.52 U 1.0 U 0.52 U 1.0 U
2.0 U 2.0 U 2.0 U 2.0 U
0.98 U 4.91 6.0 1.62 0.98 U 2.5 0.98 U
0.86 0.7 0.86
13 22.80 J 12 U 21.00 13 25.70 J 12
1.6 U 0.31 U 1.6 U 0.31 U 1.6 U 0.31 U 1.6 U
1.7 23.6 13 13.7 3.3 19.6 1.2
1.0 U 1.0 U 1.0 U 1.0 U
1.3 U 0.67 U 1.3 U 0.67 U 1.3 U 0.67 U 1.3 U
0.87 U 0.44 U 0.87 U 0.44 U 0.87 U 0.44 U 0.87 U
2.1 U 1.03 U 2.1 U 1.03 U 2.1 U 1.03 U 2.1 U
0.78 U 0.39 U 0.78 U 0.39 U 0.78 U 0.39 U 0.78 U
7.4 75 0.4 6.1
1.6 U 0.31 U 1.6 U 0.31 U 1.6 U 0.31 U 1.6 U
1.3 U 0.5 J 1.3 U 0.5 J 1.3 U 0.5 J 1.3 U
0.92 U 0.46 U 0.92 U 0.46 U 0.92 U 0.46 U 0.92 U
1.8 U 0.27 U 1.8 U 0.27 U 1.8 U 0.27 U 1.8 U
1.3 U 2.53 1.3 U 1.31 1.3 U 1.46 1.3 U
26 0.98 U 0.98 U 0.98 U
1.7 0.88 1.1 0.94 1.5 0.9 1.2
0.79 U 0.4 U 0.79 U 0.4 U 0.79 U 0.4 U 0.79 U
0.91 U 0.45 U 0.91 U 0.45 U 0.91 U 0.45 U 0.91 U
1.1 U 1.1 U 1.1 U 1.1 U
0.73 8.12 5.0 9.36 NJ 0.98 6.37 0.69 U
1.7 U 0.85 U 1.7 U 0.85 U 1.7 U 0.85 U 1.7 U
2.5 U 3.17 2.6 2.38 2.5 2.62 2.6
0.7 U 0.79 U 0.7 U 0.79 U 0.7 U 0.79 U
0.87 U 16.3 14 4.73 2.7 9.06 0.87 U
17.5 8.67 11.8
1.07 U 1.07 U 1.07 U
2.1 U 2.1 U 2.1 U 2.1 U
46.6 43 52.87 EJ
12 U 18 12 U 12 U
2.2 U 60.6 48 15 8.2 30.8 2.6
1.5 U 1.5 U 1.5 U 2.2
2.0 U 2.0 U 2.0 U 2.0 U
2.0 U 0.41 U 2.0 U 0.41 U 2.0 U 0.41 U 2.0 U
1.7 U 2.82 NJ 1.7 U 6.99 1.7 U 2.99 1.7 U
2.6 U 3.4 2.6 U 2.6 U
1.1 U 1.1 U 1.1 U 1.1 U
1.1 8.8 2.0 0.87
2.0 16 3.0 1.1
0.98 U 3.5 0.98 U 0.98 U
0.87 U 20.5 18 5.68 3.0 10.4 0.95
1.1 U 1.1 U 1.1 U 1.1 U
0.85 U 0.85 2.3 0.47 0.85 U 0.51 0.85 U
1.1 U 1.1 U 1.1 U 1.1 U
0.45 U 0.45 U 0.45 U
15 U 0.3 U 15 U 0.97 15 U 0.73 15 U
0.72 U 0.72 U 0.72 U 0.72 U
1.4 U 5.43 2.8 2.38 1.4 U 3.06 1.4 U
15 U 0.29 U 15 U 0.29 U 15 U 0.29 U 15 U
6.1 90.44 67 41.45 15 79.14 5.0
0.79 U 0.4 U 0.79 U 0.4 U 0.79 U 0.4 U 0.79 U
0.91 U 0.91 U 0.91 U 0.91 U
1.1 U 0.96 J 1.1 U 0.48 J 1.1 U 0.54 J 1.1 U
1.4 0.56 U 1.3 1.62 1.3 1.46 1.3
0.51 U 0.26 U 0.51 U 0.26 U 0.51 U 0.26 U 0.51 U
2.1 U 65 11 3.6
IA-6 IA-6IA-5IA-3 IA-4 IA-4 IA-5
ug/M3 ug/M3 ug/M3 ug/M3ug/M3 ug/M3 ug/M3
1 1 1 1 1
11/20/2013 1/29/2008 11/20/2013
1 1
1/29/2008 11/20/201311/20/2013 1/29/2008
INDOOR AIR SAMPLES
5 of 6

Table 10.
Sub-slab and Indoor Air Analytical Summary
Sample Type:
Sample ID
Sampling Date
Dilution Factor
Units
COMPOUND1,1,1-Trichloroethane
1,1,2,2-Tetrachloroethane
1,1,2-Trichlorotrifluoroethane
1,1,2-Trichloroethane
1,1-Dichloroethane
1,1-Dichloroethene
1,2,4-Trichlorobenzene
1,2,4-Trimethylbenzene
1,2-Dibromoethane
1,2-Dichlorobenzene
1,2-Dichloroethane
1,2-Dichloropropane
1,2-Dichlorotetrafluoroethane
1,3,5-Trimethylbenzene
1,3-Butadiene
1,3-Dichlorobenzene
1,4-Dichlorobenzene
1,4-Dioxane
2,2,4-Trimethylpentane
2-Chlorotoluene
2-HEXANONE
4-Ethyltoluene
4-Methyl-2-Pentanone
Acetone
Allyl Chloride
Benzene
Benzyl Chloride
Bromodichloromethane
Bromoethene
Bromoform
Bromomethane
Butane
Carbon Disulfide
Carbon Tetrachloride
Chlorobenzene
Chlorodifluoromethane
Chloroethane
Chloroform
Chloromethane
cis-1,2-Dichloroethene
cis-1,3-Dichloropropene
Cumene
Cymene
Cyclohexane
Dibromochloromethane
Dichlorodifluoromethane
Dichlorotetrafluoroethane
Ethyl Benzene
Heptane
Hexachloro-1,3-Butadiene
Hexachlorobutadiene
Hexane
Isoproypl Alcohol
m/p-Xylene
Methyl Ethyl Ketone
Metheyl Isobutyl Ketone
Methyl Methacrylate
Methylene Chloride
Napthalene
n-Butane
n-Heptane
n-Hexane
n-Propylbenzene
o-Xylene
Sec-Butylbenzene
Styrene
T-Butylbenzene
t-1,3-Dichloropropene
tert-Butyl alcohol
Tert-Butyl-Methyl-Ether
Tetrachloroethene
Tetrahydrofuran
Toluene
trans-1,2-Dichloroethene
Trans-1,3-Dichloropropene
Trichloroethene
Trichlorofluoromethane
Vinyl Chloride
Xylene (total)
Notes:
U - The compound was not detected at the indicated concentration.
J - The concentration given is an approximate value.
E - Indicates the analyte‘s concentration exceeds the calibrated range of the instrument
for that specific analysis.
NJ - Compound has been "tentively identified"; associated value represents
approximate concentration.
SS-3 and IA-1 sampled twice during 2013 event due to Summa malfunctions during
first sampling run
2013 data to be validated still
0.54 U 1.1 U 36.45 U 36.45 U 36.45 U 1.1 U
0.69 U 1.4 U 46.04 U 46.04 U 46.04 U 1.4 U
0.54 U 1.5 U 36.45 U 36.45 U 36.45 U 1.5 U
0.76 U 1.1 U 51.24 U 51.24 U 51.24 U 1.1 U
0.4 U 0.81 U 27.13 U 27.13 U 27.13 U 0.81 U
0.4 U 0.79 U 26.58 U 26.58 U 26.58 U 0.79 U
0.74 U 3.7 U 49.6 U 49.6 U 49.6 U 3.7 U
0.83 0.98 U 32.88 U 32.88 U 32.88 U 3.4
0.77 U 1.5 U 51.52 U 51.52 U 51.52 U 1.5 U
0.6 U 1.2 U 40.28 U 40.28 U 40.28 U 1.2 U
0.4 U 0.81 U 27.13 U 27.13 U 27.13 U 0.81 U
0.46 U 0.92 U 30.97 U 30.97 U 30.97 U 0.92 U
1.4 U 1.4 U
0.49 U 0.98 U 32.88 U 32.88 U 32.88 U 1.1
0.22 U 0.44 U 14.8 U 14.8 U 14.8 U 1.2
0.6 U 1.2 U 40.28 U 40.28 U 40.28 U 1.2 U
0.6 U 1.2 U 40.28 U 40.28 U 40.28 U 1.2 U
0.36 U 18 U 24.11 U 24.11 U 24.11 U 18 U
2.33 2.7 131 172 187 13
0.52 U 1.0 U 34.69 U 34.69 U 34.69 U 1.0 U
2.0 U 2.0 U
0.49 U 0.98 U 32.88 U 32.88 U 32.88 U 1.2
0.41 J 27.4 U 27.4 U 27.4 U
22.80 J 12 U 15.89 U 138.00 15.89 U 12 U
0.31 U 1.6 U 21.1 U 21.1 U 21.1 U 1.6 U
8.26 0.64 U 21.37 U 21.37 U 21.37 U 7.1
1.0 U 1.0 U
0.67 U 1.3 U 44.94 U 44.94 U 44.94 U 1.3 U
0.44 U 0.87 U 29.32 U 29.32 U 29.32 U 0.87 U
1.03 U 2.1 U 69.33 U 69.33 U 69.33 U 2.1 U
0.39 U 0.78 U 26.03 U 26.03 U 26.03 U 0.78 U
1.2 U 70
0.31 U 1.6 U 20.83 U 20.83 U 20.83 U 1.6 U
0.5 J 1.3 U 21.39 U 21.39 U 21.39 U 1.3 U
0.46 U 0.92 U 30.97 U 30.97 U 30.97 U 0.92 U
0.27 U 1.8 U 17.81 U 1.8 U
0.49 U 1.3 U 17.81 U 17.81 U 502 1.3 U
0.98 U 32.61 U 440 2.1
0.9 1.2 13.7 U 13.7 U 13.7 U 1.0 U
0.4 U 0.79 U 2,934 3,251 2,736 0.79 U
0.45 U 0.91 U 30.42 U 30.42 U 30.42 U 0.91 U
1.1 U 1.1 U
4.73 0.69 U 22.47 U 22.47 U 22.47 U 3.4
0.85 U 1.7 U 57 U 57 U 57 U 1.7 U
2.28 2.5 33.16 U 33.16 U 33.16 U 2.9
0.7 U 0.79 U 46.86 U 46.86 U 46.86 U
0.87 0.87 U 29.05 U 29.05 U 29.05 U 5.5
1.8 27.4 U 63 68.5
1.07 U 71.52 U 71.52 U 71.52 U
2.1 U 2.1 U
21.1 23.57 U 23.57 U 23.57 U
12 U 12 U
2.3 2.2 U 29.05 U 29.05 U 29.05 U 19
1.5 U 1.5 U
2.0 U 2.0 U
0.41 U 2.0 U 27.44 U 27.44 U 27.44 U 2.0 U
2.68 1.7 U 25.6 23.29 U 23.29 U 1.9
2.6 U 2.6 U
1.1 U 1.1 U
0.82 U 5.3
0.70 U 12
0.98 U 0.98 U
0.87 0.87 U 29.05 U 29.05 U 29.05 U 5.8
1.1 U 1.1 U
0.43 U 0.85 U 28.5 U 28.5 U 28.5 U 0.85 U
1.1 U 1.1 U
0.45 U 30.42 U 30.42 U 30.42 U
0.3 U 15 U 20.28 U 20.28 U 20.28 U 15 U
0.72 U 0.72 U
3.33 1.4 U 257,685 142,405 122,061 75
0.29 U 15 U 19.73 U 19.73 U 35.5 15 U
10.2 0.75 U 45.4 27.7 25.2 J 33
0.4 U 0.79 U 266 125 149 0.79 U
0.91 U 0.91 U
0.38 J 1.1 U 9,673.62 3,761.96 3,170.80 1.5
1.34 1.2 37.54 U 37.54 U 37.54 U 1.7
0.26 U 0.51 U 454 2,192 2,569 0.51 U
1.3 25
OA-1 AA-1 DS-1
1
ug/M3
DUP-112113
11/21/2013
DUP-1(DS-2)DS-2
ug/M3 ug/M3
1 67 67 671
ug/M3ug/M3ug/M3
1/30/20081/29/2008 11/20/2013 1/30/2008 1/30/2008
SSDS SAMPLESAMBIENT AIR
6 of 6


