Pre-competitive actions along the value chain
66
Jason Clay, PhD SVP Markets, WWF-US Food—Too Big to Fail Pre-competitive actions along the value chain
-
Upload
francois-stepman -
Category
Presentations & Public Speaking
-
view
363 -
download
2
Transcript of Pre-competitive actions along the value chain

Jason Clay, PhD SVP Markets, WWF-US
Food—Too Big to Fail Pre-competitive actions along the value chain

“You can’t wake a person who’s pretending to sleep”
Oromo proverb

change at the speed of life

1 Time to increase GDP per capita (in PPP terms) from 1,300 to 2,600 USD Source: Angus Maddison, University of Groningen
Britain (1700-1855)
US (1820-1873)
India (1989-2006)
China (1983-1995)
Population at start of growth period
9M
10M
822M
1,023M
Years to double GDP per capita1
155
53
17
12
The China phenomenon
China doubling of GDP was 12x the speed of
Britain during the Industrial Revolution at
100x the scale
400 million lifted out of poverty

Source: The Chicago Council on Global Affairs, Advancing Global Food Security in the Face of a Changing Climate, Gerald C. Nelson, March 2014
2004 2006 2008 2010 2012
260
240
220
200
180
160
140
120
Food
Pric
e In
dex
Burundi (1)
Somalia (5)
India (4) Mauritania (2)
Mozambique (6) Yemen (12)
Cameroon (40)
Sudan (3)
Haiti (5), Egypt (3), Cote d’Ivoire (1)
Somalia (5)
Tunisia (1)
India (1) Sudan (1) Mozambique (13)
Tunisia (300+) Libya (10000+)
Egypt (800+)
Algeria (4), Arabia (1) Mauritania (1), Sudan (1),
Yemen (300+) Oman (2), Morocco (5) Iraq (29), Bahrain (31) Syria (900+) Uganda (5)
Food prices & food riots, 2004 -12
food security is national security
and, global trade is key

40 years = 8,000 years
global food
is already the biggest threat
food production


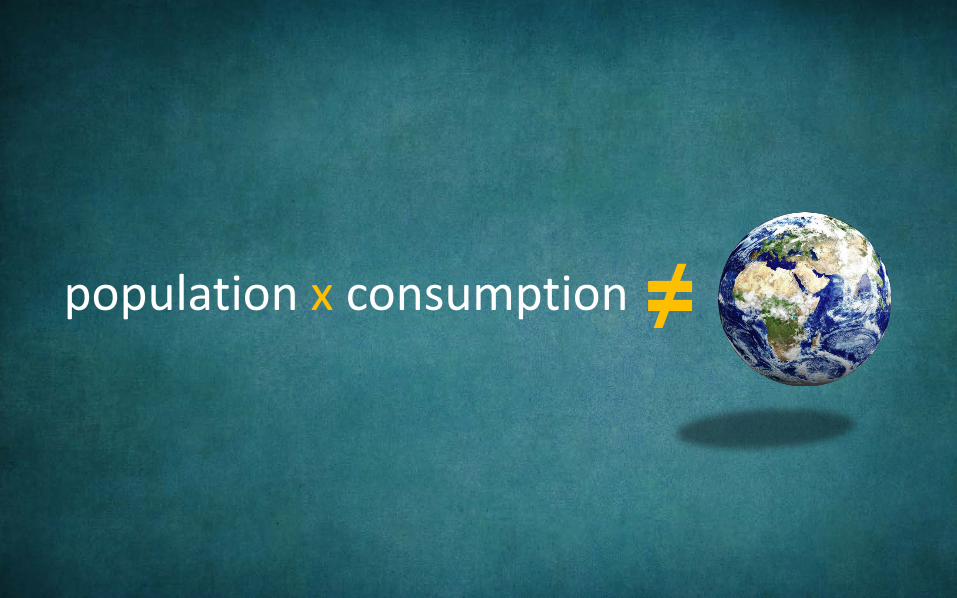
≠ population x consumption

x 1 = 7
x 2 = 18

measure absolute impacts not per capita ones

freeze the footprint of food

the issue isn’t what to think
it’s how to think

trade is key for food
security

export animal proteins not feed

subsidies are the biggest barrier to innovation

10%
15%
20%
25%
5%
30%
1930
Source: USDA Economic Research Service, Food Expenditure Series, 2014
1940 1950 1960 1970 1980 1990 2000 2013
Food as a % of U.S. disposable income

food is cheap, but 1 billion can’t afford it

half of farm families can’t feed themselves

by 2050 double food availability

productivity & efficiency and
waste & consumption

On a finite planet, should consumers
have a choice about sustainable
products?
or should all choices
be sustainable?

1 out of 3 calories waste
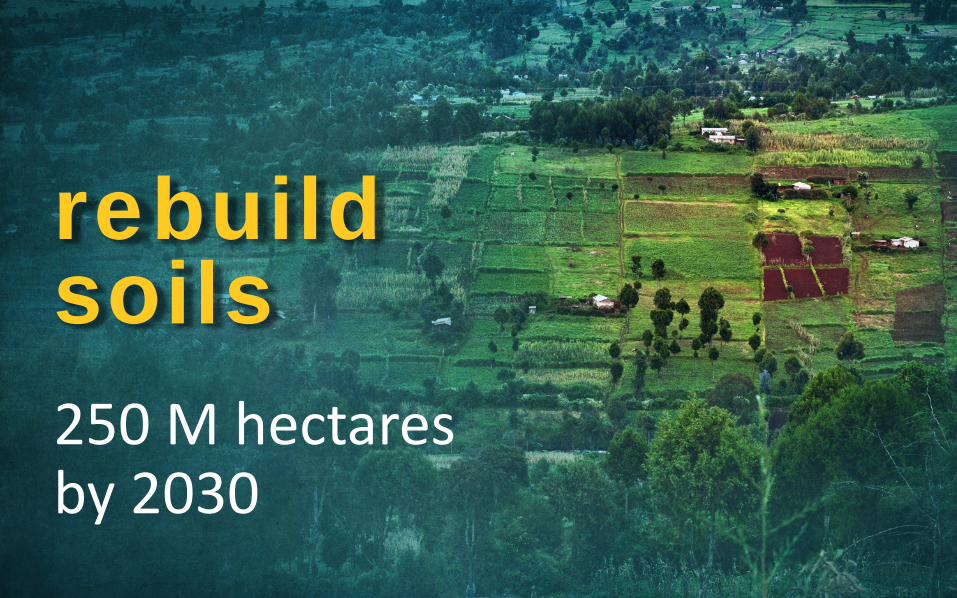
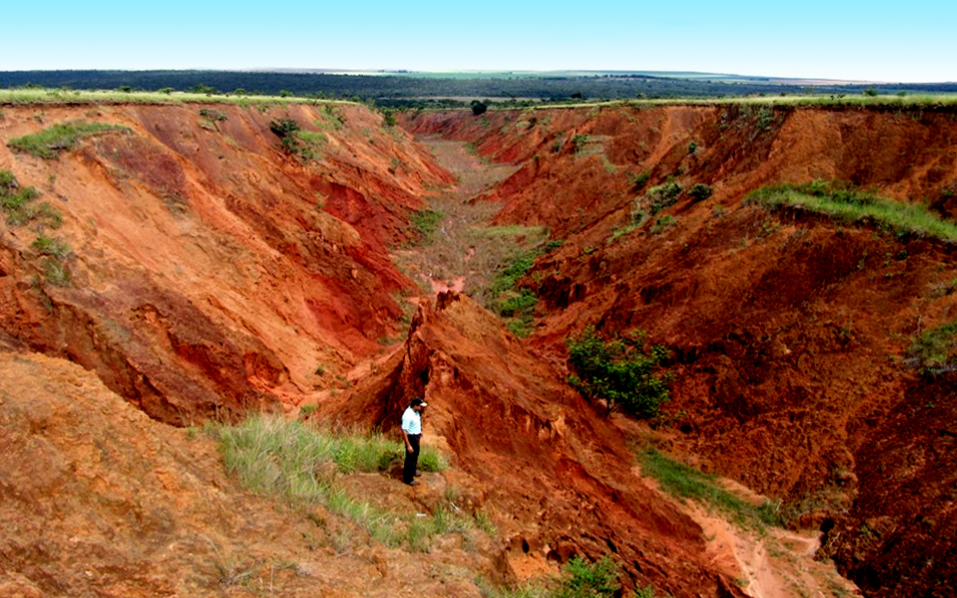
250 M hectares by 2030
rebuild soils
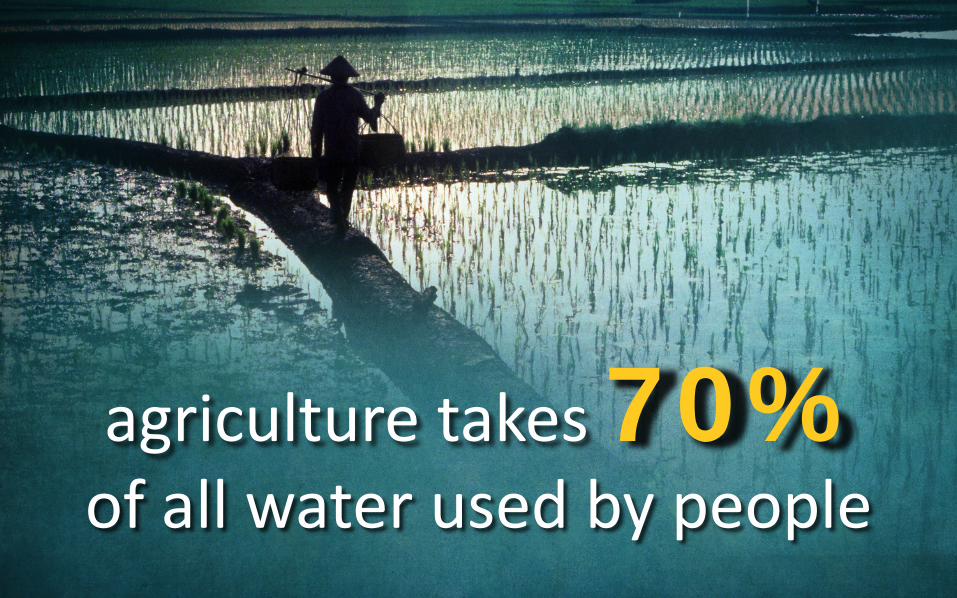
agriculture takes 70% of all water used by people

liter of water = calorie 1 1
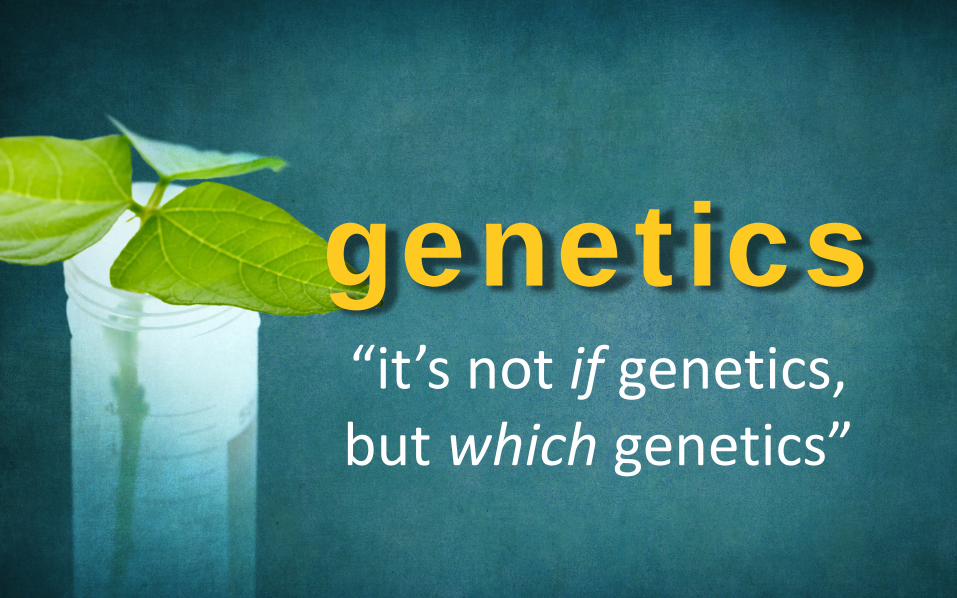
“it’s not if genetics, but which genetics”
genetics

Corn
Bananas
Sugar

oil palm millet peanut
cowpeas cassava vine spinach
plantain coco yam sorghum
Orphan crops

100 times better better practices

which gives us more food?

recognizing the best or
moving the rest?

government regulation
voluntary standards
num
ber o
f pro
duce
rs
performance shift
Reward the best, or move the rest?
worse average better

intangible values
organic
non-GMO
smallholder
no child labor
deforestation
physical values
weights and measures
quality
color
foreign matter
health and safety
Traded commodities – then and now

challenges for animal protein

beef takes 60% of land,
produces 1.3% of calories

Chicken – Improvement evolution
1925 1945 1965 1985 2005 2045*
Conversion – kg feed/kg live 4.7 4.0 2.4 2.0 1.7 1.6
Mortality % 18% 10% 6% 5% 4% 3%
Age (days) 112 84 63 49 42 40
Live commercial weight - kg 1.0 1.4 1.6 1.9 2.4 3.2
Source: Dr. Paul Aho, Novus Poultry Roundtable: Feeding the World and the Role of Poultry, January 2010
Poultry – efficiency matters
*projected

…to optimizing key ones
shift from maximizing one variable…

climate change & food production
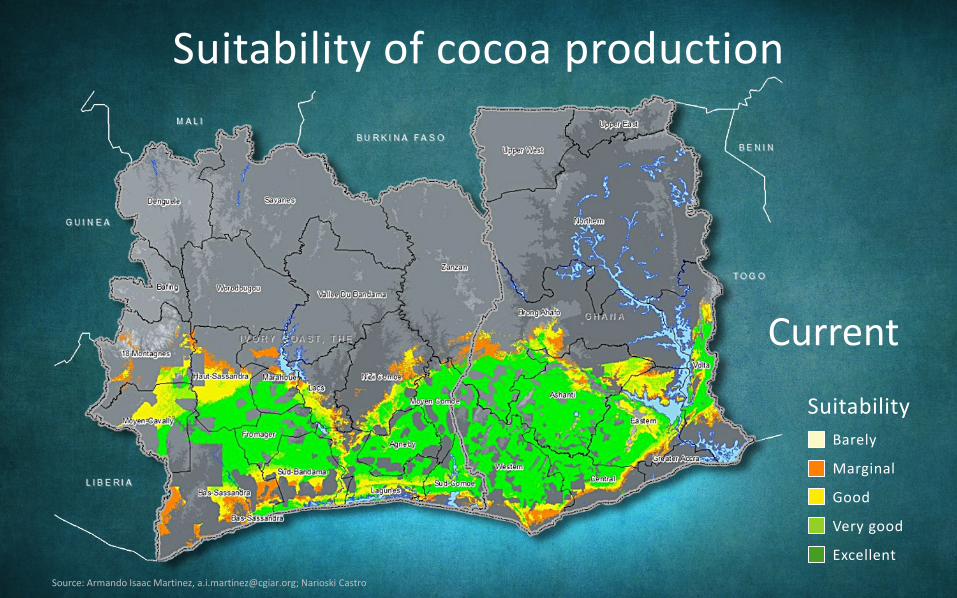
Source: Armando Isaac Martinez, [email protected]; Narioski Castro
Good
Marginal
Barely
Suitability
Very good
Excellent
Current
Suitability of cocoa production

Source: Armando Isaac Martinez, [email protected]; Narioski Castro
Less suitable
Much less
Suitability Change
No change
More suitable
2030
Suitability of cocoa production

in the short term climate smart agriculture = efficient production

in the medium term, producers change crops

won’t buy certified poverty


• Illegal deforestation, national parks
• Child labor
• Government—make all exports legal
• The private sector ‒ Long-term contracts ‒ 3-year grace period with salary
• Focus on West Africa & grafting
Rehabilitating cocoa
Photo: Alamy


salmon aquaculture


Deforestation-free supply chains by 2020 • 57 companies
• 4 commodities (beef, soy, palm oil, pulp)
• 2 countries (Brazil and Indonesia)

Growing the success of Irish food & horticulture

risk raw materials and reputation
the key global food issue is
0
20
40
60
80
100
1975 1985 1995 2005 2009
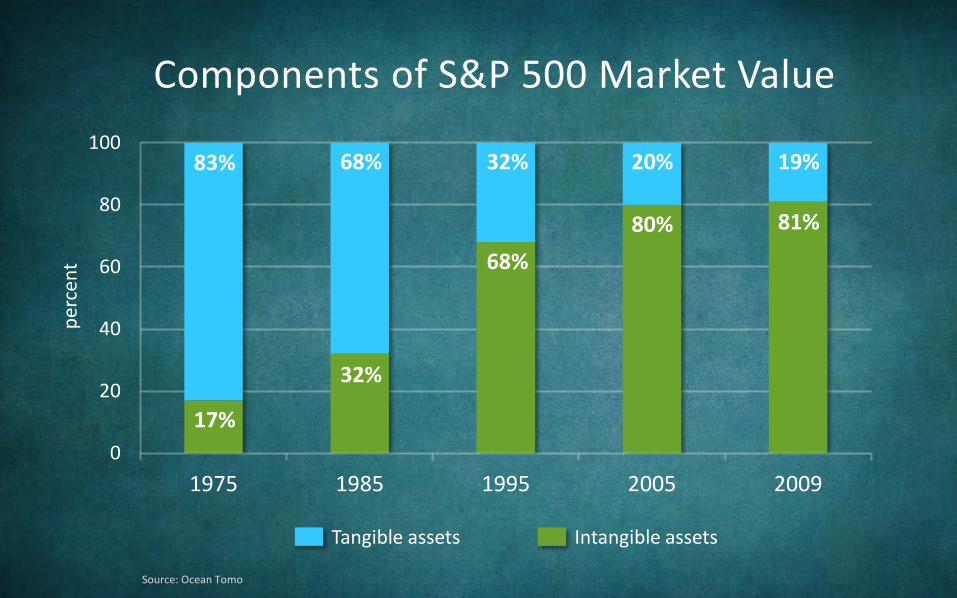
17%
83%
32%
68%
68%
32%
80%
20%
81%
19%
Tangible assets Intangible assets
Source: Ocean Tomo
perc
ent
Components of S&P 500 Market Value
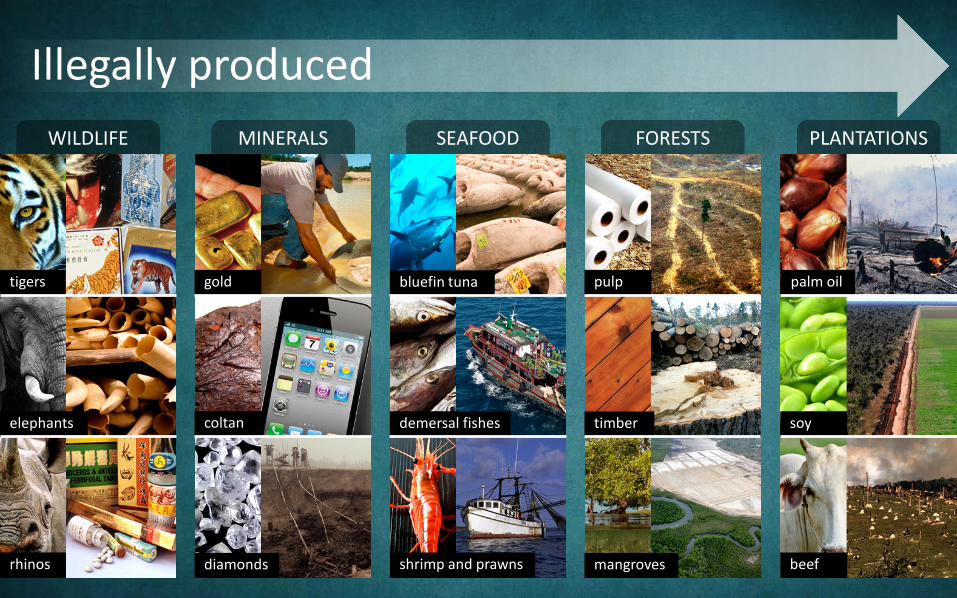
WILDLIFE
tigers
elephants
rhinos
MINERALS
gold
coltan
diamonds
SEAFOOD
bluefin tuna
demersal fishes
shrimp and prawns
FORESTS
pulp
timber
mangroves
PLANTATIONS
palm oil
soy
beef
Illegally produced

Research ‒ Is illegality important for you? • 8 companies’ supply chains • 8 commodities, 8 countries • All data in the public domain • Make illegality pre-competitive • Illegality undercuts price

“If you don’t know where you’re going, any road will get you there.”

think about it
![05[2] Strategy competitors, competitive rivalry, competitive behavior, and competitive dynamics · PDF fileDefine competitors, competitive rivalry, competitive behavior, and competitive](https://static.fdocuments.us/doc/165x107/5aa5b2eb7f8b9ac8748d8018/052-strategy-competitors-competitive-rivalry-competitive-behavior-and-competitive.jpg)