Exponential Functions Topic 3: Applications of Exponential Functions.

Pre-Calculus 12H.
Chapter 7: Exponential Functions
Assignment Outline
This unit examines key characteristics and properties of exponential functions. Techniques used to solve
exponential equations will be taught and applied to solving problems.
Date
Topic
Assignment
7.1 Exponential Functions p. 342 #1-4, 5ac, 6, 7
7.2 Transformations of Exponential Functions
p. 354 #1-5, 7, 9, 10, 12
7.3 Exponential Equations p. 364 #1-5, 7aceg, 10, 11
Ch. 7 Test
Exponential Functions
This module will explore the properties of exponential functions of the form y=cx,c>0,c≠1. Transformations
(reflections, stretches, and translations) of functions as they apply to exponential functions will be discussed.
Solving Exponential Equations
Exponential equations, in one variable, will be solved using a common base.
Modelling Exponential Behaviour
Real-world problems involving exponential growth and decay will be modelled and solved using exponential
functions.
Name: ____________________ Pre- Calculus 12 H. Date: _____________
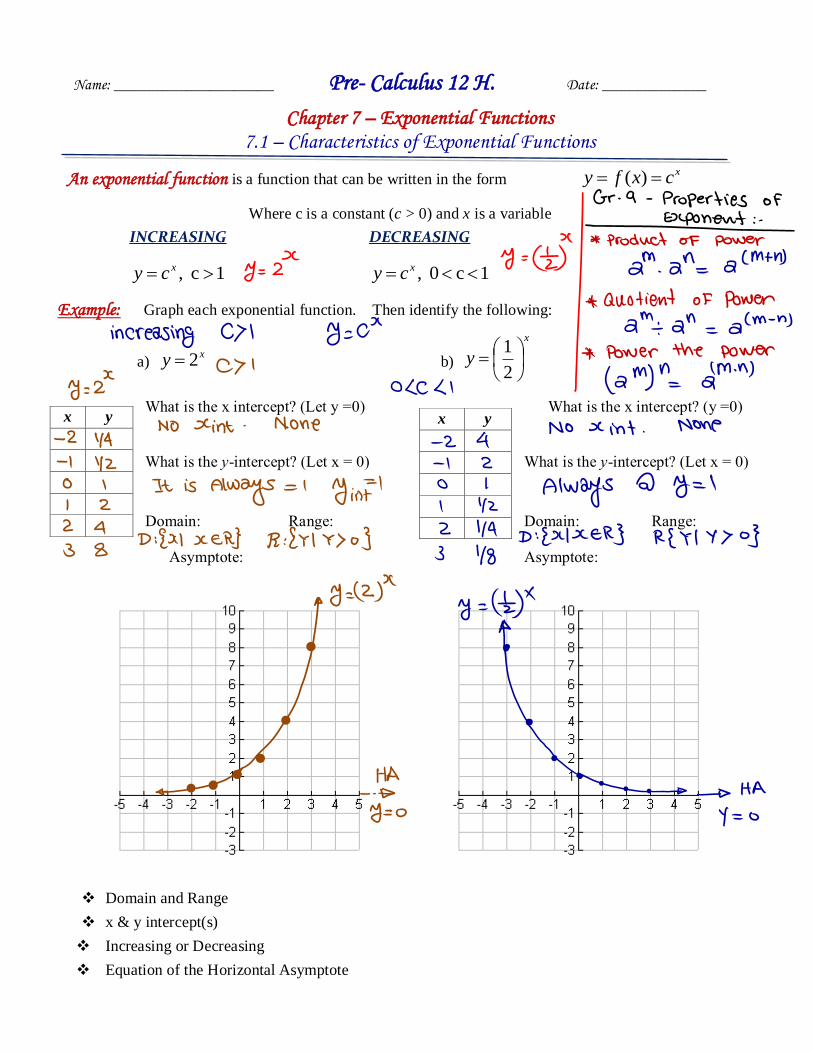
Chapter 7 – Exponential Functions 7.1 – Characteristics of Exponential Functions
An exponential function is a function that can be written in the form ( ) xy f x c
Where c is a constant (c > 0) and x is a variable
INCREASING DECREASING
1c , xcy 1c0 , xcy
Example: Graph each exponential function. Then identify the following:
a) xy 2 b)
x
y
2
1
What is the x intercept? (Let y =0) What is the x intercept? (y =0)
What is the y-intercept? (Let x = 0) What is the y-intercept? (Let x = 0)
Domain: Range: Domain: Range:
Asymptote: Asymptote:
Domain and Range
x & y intercept(s)
Increasing or Decreasing
Equation of the Horizontal Asymptote
x y
x y

Applying Graphing Tools to the Exponential Function xby
1. Give a rough sketch of the following functions (dot the function xy 2 on each):
a) xy 2 b) xy 2 c) xy 4 d) y
1
2
x
a) What happens to )(xf when it becomes )(xf ?
b) What happens to )(xf when it becomes )( xf ?
c) What happens to )(xf as b gets larger than 1?
d) What happens to )(xf when b is between 0 and 1?
Example: Write the function of the following graphs in xcy form.
GROWTH and DECAY
0c Exponential Growth
10 c Exponential Decay
*Half-Life: Length of time for an unstable element to spontaneously decay to one half its original mass.

Example: A radioactive sample of radium (Ra-225) has a half-life of 15 days.
a) Beginning with 1.0 grams, create an exponential graph that models the mass of Ra-225 over time. What
value does the mass remaining approach as time passes? What are the domain and range of this function?
b) Write the exponential decay model that relates the mass of Ra-225 remaining to time, in 15-day
intervals.
c) Estimate how many days it would take for Ra-225 to decay to 30
1 of its original mass.
Exponential functions are used to model populations, carbon date artifacts, help coroners determine time of
death, compute investments, as well as many other applications.
The most common applications: population growth, exponential decay, and compound interest
A good model for most exponential functions is:
n
t
rAA )(0 where
growth of periodn
timet
aygrowth/dec of rater
amount initial A
tat timeamount A
0
Note: the term half-life refers to the amount of time it takes for decay to be at a rate of 0.5

Example: A scientist is doing an experiment on bacterial growth. She places a single bacterium in a petri
dish and it divides to form two new bacteria within one hour. This process will continue as long as there is
sufficient food and space for the bacteria.
a) Write an equation to illustrate this situation. What would the domain be?
b) What is the population size after?
3 hours?
3.5 hours?
4 hours?
24 hours?
48 hours?
c) If the scientist added an antibiotic to the petri dish medium, the population of bacteria decreases at a rate
of 7% per hour. What equation could you use to illustrate the relative size of the population over time?
Approximately how many hours would have to pass so that the population is 50% of what it was to start
with?
Example: There are 40,000 homes in a certain city. Each year 10% of the homes are expected to
disconnect from septic systems and connect to the sewer system. Write an exponential decay model for the
number of homes that still use septic systems. Use the graph of the model to estimate when about 17,200
homes will still not be connected to the sewer system.
Assignment: p. 342 #1-4, 5ac, 6, 7