PRE-ACCESSION AID OF EUROPEAN UNION · pre-accession aid of european union: the prospects for...
127
PRE-ACCESSION AID OF EUROPEAN UNION: THE PROSPECTS FOR TURKEY A THESIS SUBMITTED TO THE GRADUATE SCHOOL OF SOCIAL SCIENCES OF THE MIDDLE EAST TECHNICAL UNIVERSITY BY SIRMA DEMİR IN PARTIAL FULFILLMENT OF THE REQUIREMENTS FOR THE DEGREE OF MASTER OF SCIENCE IN THE DEPARTMENT OF ECONOMICS JULY 2003
-
Upload
duongthien -
Category
Documents
-
view
220 -
download
0
Transcript of PRE-ACCESSION AID OF EUROPEAN UNION · pre-accession aid of european union: the prospects for...

PRE-ACCESSION AID OF EUROPEAN UNION: THE PROSPECTS FOR TURKEY
A THESIS SUBMITTED TO THE GRADUATE SCHOOL OF SOCIAL SCIENCES
OF THE MIDDLE EAST TECHNICAL UNIVERSITY
BY
SIRMA DEMİR
IN PARTIAL FULFILLMENT OF THE REQUIREMENTS FOR THE DEGREE
OF
MASTER OF SCIENCE
IN
THE DEPARTMENT OF ECONOMICS
JULY 2003
ABSTRACT
PRE-ACCESSION AID OF EUROPEAN UNION:
THE PROSPECTS FOR TURKEY
Demir, Sırma
M.S., Department of Economics
Supervisor: Assoc. Prof. Dr. Nazım Ekinci
July 2003, 115 pages
This thesis calculates the amount of pre-accession aid which will be given
Turkey when Turkey starts accession negotiations with EU. By using Poland’s
receipts from pre-accession financial transfers of EU during its accession
negotiations, the study makes expectation about Turkey’s pre-accession aid. This
thesis also attempts to ask the reality of this calculated value by looking at the
budgetary situation of EU during Turkey’s pre-accession period.
Keywords: Fifth Enlargement of EU, Pre-accession Aid of EU
iii

ÖZ
AVRUPA BİRLİĞİ’NİN GİRİŞ ÖNCESİ YARDIMI
TÜRKİYE’NİN ÖNÜNDEKİ İHTİMALLER
Demir, Sırma
Yüksek Lisans, İktisat Bölümü
Tez Yöneticisi: Doç. Dr. Nazım Ekinci
Temmuz 2003, 115 sayfa
Bu tez, Türkiye Avrupa Birliği ile katılım müzakerelerine başladığı zaman
alacağı giriş öncesi yardımı hesaplamaktadır. Polonya’nın katılım müzakereleri
süresince almış olduğu yardımları kullanarak bu çalışma Türkiye’nin katılım öncesi
yardımı için beklenti oluşturmaktadır. Ayrıca, bu tez, hesaplanan bu miktarın
gerçekçiliğini de Avrupa Birliği’nin Türkiye müzakarelere başladığı zamanki bütçe
pozisyonuna bakarak sorgulamaktadır.
Anahtar Kelimeler: Avrupa Birliği’nin beşinci genişlemesi, Avrupa Birliği’nin
giriş öncesi yardımı
iv

To my parents
v

ACKNOWLEDGEMENTS
I express sincere appreciation to my supervisor Assoc. Prof. Dr. Nazim
Ekinci for his guidance and insight throughout the study. Thanks go to all my
friends for their moral support and encouragement in finishing this study. I would
like to express my gratitude to Fatih for his endless support. Finally, to my mother, I
offer sincere thanks for her faith in me.
vi

“I hereby declare that all information in this document has been obtained and
presented in accordance with academic rules and ethical conduct. I also declare that,
as required by these rules and conduct, I have fully cited and referenced all material
and results that are not original to this work”.
Date: Signature:
vii

TABLE OF CONTENTS
ABSTRACT……………………………………………………………………… ii
ÖZ………………………………………………………………………………… iv
DEDICATION…………………………………………………………………… v
ACKNOWLEDGEMENTS……………………………………………………… vi
TABLE OF CONTENTS……………………………………………………….. viii
LIST OF TABLES………………………………………………………………... xii
CHAPTER
1. INTRODUCTION………………………………………………………... 1
2. EUROPEAN UNION AND ITS STRATEGIES FOR CANDIDATE
COUNTRIES BEFORE FIFTH ENLARGEMENT……………………… 5
2.1 Introduction…………………………………………………………… 5
2.2 History of EU with Its Enlargements………………………………… 6
2.2.1 A Brief History of EU………………………………………….. 6
2.2.2 Enlargements of EU……………………………………………. 7
2.3 EU Budget……………………………………………………………. 9
2.3.1 EU Budget Revenues and Expenditures………………………... 9
2.3.1.1 Revenues of Union Budget…………………………….. 9
2.3.1.2 Expenditures of Union Budget…………………………. 10
2.3.2 Evaluation of the Distribution of the Expenditures to the Member
States…………………………………………………………… 11
viii
2.3.2.1 According to Net Budgetary Transfers of Member
States………………………………………………….. 12
2.3.2.2 According to Enlargements…………………………… 13
2.4 Accession Strategy of EU Before Fifth Enlargement………………. 14
2.4.1 Accession Criterion for Membership…………………………. 14
2.4.2 Pre-Accession Aid to Greece, Spain and Portugal……………. 15
2.5 Conclusion…………………………………………………………... 16
3. EUROPEAN UNION’S STARTEGIES TOWARDS CANDIDATE
COUNTRIES IN THE FIFTH ENLARGEMENT……………………… 18
3.1 Introduction…………………………………………………………. 18
3.2 New Conditions for Accession to the EU…………………………… 19
3.2.1 Political Criterion……………………………………………... 19
3.2.2 Economic Criterion…………………………………………… 20
3.2.3 Other Obligations of Membership……………………………. 21
3.3 The Enlargement Process…………………………………………... 29
3.3.1 Analytical Examination of the Acquis (Screening)………….. 29
3.3.2 Accession Negotiations……………………………………… 30
3.3.3 Regular Reports……………………………………………… 31
3.4 Pre-Accession Strategy…………………………………………….. 32
3.4.1 The Developments After Copenhagen Council……………… 32
3.4.2 Components of Pre-Accession Strategies……………………. 34
3.4.3 Pre-Accession Strategies Towards the Candidate Countries in the
Fifth Enlargement……………………………………………. 39
3.5 Conclusion…………………………………………………………. 40
ix
4. PRE-ACCESSION AID AND DISTRIBUTION CRITERIA OF IT IN THE
FIFTH ENLARGEMENT……………………………………………… 42
4.1 Introduction………………………………………………………… 42
4.2 The Fifth (Current) Enlargement…………………………………… 43
4.2.1 Acceding Countries…………………………………………... 43
4.2.2 A History of Fifth Enlargement………………………………. 44
4.2.3 Is the Fifth Enlargement Really a Big Challenge of EU?…….. 45
4.3 EU’s Financial Assistance to Its Candidate Countries……………… 46
4.3.1 Financial Assistance for Central and Eastern European
Countries……………………………………………………… 46
4.3.2 Financial Assistance for Cyprus and Malta…………………… 51
4.3.3 Financial Assistance for Turkey………………………………. 52
4.4 Inter-Country Comparision…………………………………………. 53
4.5 Conclusion………………………………………………………….. 55
5. CALCULATION OF PRE-ACCESSION AID FOR TURKEY………. 57
5.1 Introduction………………………………………………………… 57
5.2 Poland………………………………………………………………. 58
5.2.1 Why Do We Choose Poland?………………………………… 58
5.2.2 Relations Between EU and Poland………………………….... 60
5.2.3 A General Idea About Poland’s Socia-Economic Development.. 60
5.3 Derivation and Application of Original Parameters………………… 63
5.3.1 Derivation of Original Parameters……………………………. 63
5.3.1.1 Derivation of First Two of Original Parameters……… 64
5.3.1.2 Derivation of Other Original Parameters……………... 65
x

5.3.2 Application of ‘Original Parameters’ to Other Central and Eastern
European Candidate Countries……………………………….. 66
5.4 Expected Pre-Accession Aid for Turkey (Application of Original
Parameters to Turkey)………………………………………………. 69
5.5 Conclusion………………………………………………………….. 71
6. THE RELATION BETWEEN TURKEY’S PRE-ACCESSION AID AND
REFORMS OF EU ON STRUCTURAL AND AGRICULTURAL
POLICIES………………………………………………………………. 73
6.1 Introduction…………………………………………………………. 73
6.2 2000-2006 Budget of European Union……………………………... 74
6.2.1 2000-2006 Budgetary Framework of EU…………………….. 75
6.2.2 Some Considerations on the Enlargement Budget…………… 76
6.3 Reforms on Agricultural and Structural Policies of EU……………. 79
6.3.1 Need for Reforms…………………………………………….. 79
6.3.2 Required EU Policy Reforms………………………………… 80
6.3.3 Scenario Results……………………………………………… 82
6.3.4 Can These Reforms Really Be Made?……………………….. 84
6.4 Evaluation of the Expected Pre-Accession to Turkey……………… 86
6.5 Conclusion………………………………………………………….. 90
7. CONCLUSION………………………………………………………… 91
REFERENCES…………………………………………………………………. 94
APPENDIX A.TURKISH ECONOMY AFTER HELSINKI EUROPEAN
COUNCIL……………………………………………………… 98
xi
LIST OF TABLES
TABLE 2.1 Net Budgetary Transfers of Member States 1983-1998………… 12 4.1 Candidate Countries in 2001……………………………………. 44 4.2 Total Phare Allocations During 1992-2002…………………….. 46 4.3 Total Sapard Allocations 2000-2006…………………………… 48 4.4 ISPA Allocations Between 2000-2002…………………………. 50 4.5 Pre-accession Assistance for Cyprus and Malta………………... 51 4.6 Financial Transfers to Turkey…………………………………... 52
4.7 EU Financial Aid to Candidate Countries for pre-2000 and post-2000 period………………………………………………... 53
5.1 Comparision of Poland and Turkey…………………………….. 59 5.2 Poland…………………………………………………………… 61
5.3 Original Parameters……………………………………………... 66
5.4 Application of Original Parameters to Other Central and Eastern European Candidate Countries………………………………….. 68 5.4 The New Interval of Pre-accession Aid With the Corrected
Boundaries………………………………………………………. 69 6.1 Distribution of the Expenditures in the Enlarged Union………… 77
6.2 Distribution of Expenditures in EU-20…………………………... 77
6.3 Simulation of EU Expenditure 2007 and 2013…………………... 82
6.4 Simulation of EU Budget Expenditures in 2013…………………. 83
xii

6.5 Financial Perspectives in 2001 and 2002 (before the planned enlargement in 2002)…………………………………………...… 87
6.6 Total Operational Expenditures in 2007 and 2013………………. 88
A.1 Growth Rates and Demand Components……………………… 103 A.2 Balance of Payments………………………………………….... 104 A.3 Developments in Labor Market………………………………... 105 A.4 Consolidated Budget Balance…………………………………. 107 A.5 Structure of Production………………………………………… 112 A.6 Developments in Domestic Labor Market……………………... 113 A.7 Maastricht Convergence Criteria in 2001……………………… 114
xiii

CHAPTER 1
INTRODUCTION
Turkey had applied for European Community membership as early as 1987.
On 10-11 December 1999 at Helsinki Summit Turkey was accepted as a candidate
country of European Union. In fact, Turkey is one of the candidate countries of
EU’s fifth enlargement. The fifth (current) enlargement of EU consists of twelve
candidate countries besides Turkey. However Turkey is not evaluated with other
candidates countries of fifth enlargement. Ten Central and Eastern European
Countries, Malta and Cyprus are other candidate countries of fifth enlargement. The
accession negotiations started at Luxembourg Summit in 1997 with six of these
countries and then expanded to 12 countries. Ten candidate countries are expected
join the Union in 2004. Other two candidates, Bulgaria and Romania, will have
joined the Union by the end of 2007. Turkey has not started acccession negotiations
yet.
Although fifth enlargement has a lot of advantages for EU, EU has been
aware of the difficulties of this enlargement since the begining. Up to now, EU has
undergone four enlargements. Although these enlargements included at most 3
countries, EU faced severe problems in financing these enlargements especially
second and third enlargements (Greece, Spain and Portugal). Greece, Spain and
Portugal have been big burdens on Union budget since their accession date. The
reason for this is that these countries were not ready for membership when they
joined the Community. Because EU’s policy in those days was: first join then
prepare for membership. Given that 3 countries from the previous enlargements
have still large demands from Union budget, what would be the demands of 12
countries?
1

EU needed to look over Union policies when the fifth enlargement came to
the agenda. EU needed to prepare the candidate countries for membership after
facing severe problems in financing the second and third enlargements. That is pre-
accession period gained more importance. Also, EU has to think the accession
period of these candidate countries because of the size of the enlargement. The
distribution of EU funds will absolutely change when these poorer countries join the
Union. For example, Baldwin (1997) arrives at a consensus estimate of a net cost of
ECU23 billion for the acceding of Poland, Hungary, Czech and Slovakia in 2000. In
order to eliminate the difficulties of the accession period, EU needs to make some
reforms on agricultural and structural policies of the Union. Because, the most
important share of Union budget is devoted to these funds.
The reforms for accession period of fifth enlargement is on the agenda of EU1.
However, no concrete reform has been undertaken so far. In Christian Weise’s
(2001) paper, some scenarios for EU budgets in 2007 and 2013 are given. These are
just predictions of the Union budget in the case of reforms and no reforms on
agricultural and structural funds. Scenario studies show that a further delay in
reforms will eventually push up the budgetary costs. Since no concrete reform was
undertaken by the EU so far, we have used the Christian Weise’s scenarios in
evaluating our prediction for Turkey’s pre-accession aid.
For the pre-accession period EU undertook big reforms. Firstly, EU
changed its accession strategy before fifth enlargement. It announced new
conditions for EU membership at Copenhagen European Council in 1993. New
instruments were introduced to prepare candidate countries for membership.
Enlargement process has been held in a more systematic way in current
enlargement. In fact, EU’s accession poliy has changed; first prepare then join.
Jovanovic (1999) says that the forthcoming enlargement of EU will be the best
prepared enlargement to date.
Preparation of candidate countries cannot be achieved without providing
support and financial aid. One of the instruments of new pre-accession strategy is
pre-accession aid. Especially, during the accession negotiations in order to accept
and put in practice the EU’s criteria namely Copenhagen Criteria, candidate
countries need to undertake a lot of reforms. EU supports these reforms by pre-
1 Throughout the thesis “EU” is used instead of all names of today’s EU since its foundation.
2

accession aid. All 13 candidate countries have received some financial aid under the
name of pre-accession aid during their candidacy period. Turkey has received only
60 million euro from pre-accession aids of Union for the period 2000-2001.
However, the candidate countries which started accession negotiations have
received larger amounts. Because, while candidate countries negotiate EU’s laws
and rules, they need more financial help to implement these laws and rules. For this
purpose, EU increases its financial transfers to these countries.
Turkey has made some reforms for EU membership since Helsinki Summit.
However, especially after two deep financial crises in 2000 and 2001, Turkey’s
economy has deteriorated. Despite this economic situation, if Turkey starts
accession negotiations it will receive more than it received up to that date. Because
during accession negotiations since EU’s demands increases from candidate country
its help also increases. And also Turkey will need financial help for preparation of
membership because of its economic situation. However, when Turkey starts
accession negotiations at least ten candidate countries will have just joined the
Union. Union then have at least 25 members not only 15 members. That is Union
budget will be burdened by the transfers to new members. If some reforms were
made on Union’s structural and agricultural policies then the burden of the new
members on Union budget would decrease and so the possibility of Turkey’s share
would increase. That is, accession period’s reforms are very important for Turkey’s
pre-accession period. We try to evaluate Turkey’s pre-accession aid in the case of
reforms and no reforms by Christian Weise’s (2001) budget scenarios.
This thesis starts from the assumption that Turkey will be treated as other
candidate countries of fifth enlargement when it starts accession negotiations. This
thesis tries to answer first the question of how much pre-accession aid will be given
to Turkey when Turkey starts accession negotiations. Then we ask the reality of the
amount we calculated.
We proceed in the following manner. First, we list the amounts of pre-
accession aid given to other candidates of fifth enlargement during their accession
negotiations. We derive the criteria of EU for distributing pre-accession aid. EU
distributes pre-accession aid according to area, agricultural area, population,
employment in agriculture and GDP per capita of the country. Then we take one of
the candidate countries as an example to us, which will be Poland. Poland is the
most similar candidate country to Turkey in the fifth enlargement in terms of
3

population, area and agricultural share in GDP. By making use of Poland’s receipts
from pre-accession aid we calculate aid per capita of total population, per capita of
agricultural population, per km2 of total area and per km2 of agricultural area for
Poland. Then we apply these numbers to Turkey for calculating the pre-accession
aid of Turkey. In order to discuss the reality of the Turkey’s calculated pre-
accession aid we use Christian Weise’s (2001) scenarios for EU’s 2007 and 2013
budgets. By looking at EU’s budget situations, we find the scenarios under which
our expectations are more likely to be met.
The study is organised as follows. In the following chapter, previous
enlargements, burden of these enlargements on EU budget and pre-accession
periods of these enlargements are presented. In the third chapter, the new strategies
developed for fifth enlargement’s pre-accession period are given. Pre-accession aid
is introduced in this chapter. In the fourth chapter, fifth enlargement’s countries’
pre-accession aid receipts are given. Also, the criteria for distributing pre-accession
aid are derived. In this chapter, we see that since Turkey has not started accession
negotiations, its pre-accession aid can not be compared with other candidates’
receipts. In Chapter 5 after looking Poland more closely, we calculate Turkey’s
expected pre-accession aid by making use of Poland’s receipts from pre-accession
aid. The discussion of the realism of this expectation will be done in Chapter 6.
Chapter 7 consists of some general comments. Turkey’s economic situation
according to Copenhagen Economic Criteria, especially after Helsinki Council, is
considered in Appendix A.
4
CHAPTER 2
EUROPEAN UNION AND ITS STRATEGIES FOR CANDIDATE
COUNTRIES BEFORE FIFTH ENLARGEMENT
2.1 Introduction
European Union changed its accession strategy when fifth (current)
enlargement came to the agenda of EU. It announced new conditions for
membership, namely Copenhagen Criteria, and introduced new instruments for
preparing candidate countries to full membership. In previous enlargements we
cannot see such a detail work. What was the reason for these reforms for pre-
accession period? Why did EU need such reforms? The reason may be experiences
of EU from previous enlargements or the difference of the fifth enlargement or
both.
EU established in 1952. It has increased its members from six to fifteen
through four enlargements since its foundation date. From these, second and third
enlargements (Greece, Spain and Portugal) are the enlargements which have been
talked about a lot since the accession date of these countries. Because, these
countries’, especially Greece’s, economies met with tremendeous problems after
full membership. And, in order to reduce the disparities between advanced members
and these countries, EU has devoted lion share of its funds to these countries.
Hence, these countries have been big burdens on EU budget. Theodore
Georgakopoulos (from an unpressed work) says that Greece’s economy was totally
unprepared when Greece became full member of European Community. This was
resulted in the fact that these countries were not subject to strict conditions for
membership. That is, they did not have to improve their economies before full
membership.
5

The fifth enlargement consists of twelve candidate countries besides Turkey.
Up to this enlargement, the enlargements of EU included at most three countries.
Fifth enlargement is the largest ever enlargement of EU. This means that, this
enlargement is different from previous enlargements with its size. By taking into
account this fact and considering bad experiences from previous enlargements, EU
made reforms to prepare candidate countries for membership before fifth
enlargement. This chapter tries to answer the question of why did EU need reforms
before fifth enlargement within this framework. This chapter answers this question
by presenting the bad experiences of EU from previous enlargements. The second
part of this chapter presents the history of EU with its enlargements. The third part
gives the EU budget in order to see the burdens of members (especially Spain,
Greece and Portugal) on Union budget. After seeing some members’ big burdens on
Union budget, we try to find the reason of this. We will look at pre-accession
periods of these countries. The fourth part presents the pre-accession periods of
second and third enlargements. The final part gathers all the results from previous
parts and answers the question of this chapter.
2.2 History of EU With Its Enlargements
In this part we will give a brief history of EU. Then we will present
enlargements of EU from IKV (2002). Before looking at burdens of current
members on the Union budget, we introduce these members according to their
accession date.
2.2.1 A Brief History of EU
In July 1952, France, West Germany, Italy, the Netherlands, Belgium and
Luxembourg formally established the European Coal and Steel Community
(ECSC). In January 1958, the above six countries also established the European
Economic Community (EEC) and the European Atomic Energy Community
(EURATOM). In July 1967, the three communities merged into one organisation,
called by a joint name the European Communities (EC). In November 1993, the
Treaty of the European Union (also called the Maastricht Treaty) came into force,
and the European Communities changed into the European Union (EU).
6

2.2.2 Enlargements of EU
The Union has since undergone four enlargements: (1973) First
enlargement; Denmark, Ireland and United Kingdom, (1981) second enlargement;
Greece, (1986) third enlargement; Portugal and Spain, (1995) fourth enlargement;
Austria, Finland, Sweden.
It now consists of 15 Member States (the six founding members plus
Denmark, Greece, Spain, Ireland, Austria, Portugal, Finland, Sweden and the
United Kingdom).
In March 1998, the EU formally launched the process that will make
enlargement possible. This will be the EU’s fifth enlargement2. It embraces the
following thirteen countries: Hungary, Poland, Estonia, the Czech Republic,
Slovenia, Cyprus, Romania, the Slovak Republic, Latvia, Lituania, Bulgaria, Malta
and Turkey. That is, ten Central and Eastern European Countries (CEEC-10),
Cyprus, Malta and Turkey.
a) First Enlargement: Denmark, Ireland and United Kingdom
Because of the success of ECSC, EEC, EURATOM, United Kingdom,
Ireland, Denmark and Norway applied EEC membership. First application was done
in 1961 by United Kingdom. But this application was rejected by France by the
reason of not satisfying the Treaty of Rome. After this negative answer, United
Kingdom applied to the Union in 1967 with Ireland. Denmark also applied for
membership in the same year. But, again applications rejected by the president of
France.
The president of France, De Gaulle, resigned in 1969; after this European
Community started negotiations with United Kingdom, Denmark, Ireland and
Norway. Negotiations lasted two years for United Kingdom, Denmark and Ireland
and these countries joined to the Union in 1972. Norway had also signed an
accession treaty in 1994 but Norwegian voters narrowly rejected membership in a
referendum.
b) Second Enlargement: Greece
Greece applied to European Community for membership in 1959. After
some meetings, Greece signed an Association Agreement, Treaty of Atina, with
2 The fifth enlargement will be presented in detail in Chapter 4.
7

European Community in 1961. Greece’s aim was to join the European Community,
and this was stated in this agreement.
Union froze the relations with Greece from 1967 to 1974 because of the
military intervention in Greece. In 1975, Greece applied to the Union for the
membership. After this application, the Commission prepared a report for Greece in
1976. In the report, it was said that because of the economic trouble in Greece,
joining of Greece to Union is not appropriate now. Developments in democracy in
Greece was seen by the Union and Union started to the accession negotiations in
1976. After the negotiations, Joining Treaty was signed between Greece and Union
in 1979 and it became effective in 1981.
c) Third Enlargement: Spain and Portugal
The first applications of Spain and Portugal to the Union was in 1962. They
applied for the ‘Association Agreements’ but both of them were rejected because
these two countries were governed by dictatorships in that date.
With the joining of Greece in 1981, the Union was expanding to the south of
the Europe. So, a new term started with Spain and Portugal. Since these two
countries had less developed economies in those days, the relations with the
European Community improved slowly. In 1975, democratic regime was introduced
in Spain. After this development, in 1977, Spain applied to the Community for
membership. And, this application was accepted and accession negotiations was
started in 1978.
Portugal is a founding member of EFTA (European Free Trade Area), which
was founded in 1960. Like Spain, the relations of Portugal with EU remained in
commercial levels in those years. In 1973, two EFTA countries, United Kingdom
and Denmark joined to the Union. After this development, Portugal applied for
membership to the Union in 1977. Commission accepted this application and started
the accession negotiations in 1979. These two countries joined to the Union in
1986.
d) Fourth Enlargement: Austria, Finland, Sweeden
The fourth enlargement was done with Austria, Finland and Sweeden. These
countries have had more developed economies than Southern Countries. Austria
applied for membership to the Community in 1989. Sweeden applied to the
Community in 1991 and Finland applied in 1992. Union started negotiations with
these three countries in 1993. Since these countries had high standards of living and
8

developed market economies, their accession did not cause any problem. These
countries became net contributers to the Union budget in the first year of their
accession. This also proves the developed economies of these countries.
2.3 EU Budget
The purpose of this section is to see the burdens of members on Union
budget. First we presents the budget structure of EU by examining its revenues and
expenditures. Second we look at net budgetary transfers (receipts minus
contributions) of members from 1983 to 1998. We will close this part by concluding
that second and third enlargements countries have received lion share from the
budget since their accession date. In the next part, part 4, we will give the reason of
this conclusion.
2.3.1 EU Budget Revenues and Expenditures
In this section we present briefly EU budget structure by giving
expenditures and revenues of the budget. Informations are taken from ‘The
Structural Funds in 1998’ (European Commission, 1999) and from the Europe
Server (http://europe.eu.int).
2.3.1.1 Revenues of Union Budget
The Decision of 21 April 1970, renewed in 1988 and 1994, introduced the
‘system of own resources’ for the first time. Up to this date, budget was financed by
the direct contributions of the member states. System of own resources can be
defined as ‘the tax revenue allocated once and for all and which accrue to it
automatically without the need for any subsequent decision by the national
authorities’.
Own resources comprise: Traditional own resources (Agricultural duties,
Sugar levies, Customs duties), VAT Own Resources and GNP Own Resources.
Own resources total ceiling is set as a percentage of the GNP of the entire Union.
This percentage has undergone some changes over years. The ceiling in 1999 was
1.27% of GNP. That is, the ceiling of the contribution of a member state to the
Union budget should be the 1.27% of its GNP in 1999. From here we can say that
higher the GNP share of a member state in Union, higher the share in budget
9

financing. Germany, France, Italy and UK are the most important contributers to the
budget (Allocation of 1998 EU operating expenditure by Member State, 1999).
There are also revenues other than own resources. For example,
contributions made to research programmes, private revenues, transitory
contributions. But, these are less than 1% of total revenues.
2.3.1.2 Expenditures of Union Budget
Budget expenditures comprise: Agricultural Guidaline, Structural
Operations, Other Internal Policies, External Action and Administrative
Expenditures. Below, these expenditures are explained briefly. The payments are
made in agricultural guidaline and structural operations through EU Funds. These
funds are: Structural Funds, Cohesion Fund and Guarantee section of European
Agriculture Guidance and Guarantee Fund (EAGGF-G).
A. Agricultural Guidaline: EU expenditure on the Common Agricultural
Policy is effected through the European Agriculture Guidance and Guarantee Fund
(EAGGF). EAGGF’s Guarantee Section finances price guarantees, purchases by
intervention agencies, storage costs, direct income subsidies and so on. It comprises
90% amount of total EAGGF budget.
B. Structural Operations: The payments are made in structural operations
through Structural Funds and Cohesion Fund. Structural Funds are: EAGGF-
Guidance section, European Social Fund (ESF), European Regional Development
Fund (ERDF), Financial Instrument for Fisheries Guidance (FIFG).
1) Structural Funds: Objectives of Structural funds:
Objective 1: assisting regions lagging behind in development (whose GDP is
normally 75% or less than the Community average)
Objective 2: adapting declining industrial areas
Objective 3: combating long-term unemployement and improving employement
chances for the young
Objective 4: adapting the workforce to industrial changes
Objective 5a: adjusting agricultural structures and modernising the fishing industry
Objective 5b: developing and adjusting the structure of vunerable rural areas.
The Structural Funds support these objectives as seen in the following matrix:
10

Obj. 1 Obj 2 Obj 3 Obj 4 Obj 5a Obj 5b
ERDF + + +
ESF + + + + +
EAGGF-G + + +
FIFG +
2) Cohesion Fund: set up under a special provision of the Maastricht Treaty
in 1994 to help the four least prosperous member of the EU. These countries,
defined as those whose per capita GDP of less than 90% of the EU average, were:
Portugal, Spain, Greece and Ireland.
C) Other Internal Policies: Examples of funding other internal policies are:
environment, audiovisual media and culture, information and communication.
Approximately 10% of total expenditures are devoted to other internal policies.The
most important internal policies are investigation expenditures.
D) External Action: This part consists of aids made to the countries other
than EU member states. For example: Mediterranean Countries, African, Caribbean
and Pacific countries, Latin American and Asian countries.
E) Administrative Expenditures: A serious part of this expenditures are
composed by the salaries of the personel of Union institutions. Administrative
expenditures has approximately 5% share in total expenditures.
2.3.2 Evaluation of the Distribution of the Expenditures to the Member
States
In this section we will see which countries receive more from the budget
expenditures, which countries’ receipts are more than its contributions. First, we
will look at net budgetary transfers of members. Second, we will evaluate the net
budgetary transfers of member states within the framework of enlargements. At the
end of this part we will conclude that second and third enlargement countries have
been big burden on the budget.
11

2.3.2.1 According to Net Budgetary Transfers of Member States
The issue of ‘who gets what’ from the Community Budget and ‘who pays’
has been at the centre of Community politics since its inception. Net budgetary
transfers shows the difference between the member states’ contributions to the
Union budget and revenues from the budget, i.e. receipts minus payments. Table 2.1
presents the net budgetary transfers of member states between 1983 and 1998.
Table 2.1 Net Budgetary Transfers of Member States Between 1983-1998 (M ECU)
1983-1985 1986 1987-1994 1995 1996 1997 1998
Germany -11997 -3741 -66510 -13198 -10528 -10943 -10225
France -613 -561 -14375 -1540 -137 -781 -1532
Italy 3145 -194 -6783 -672 -1152 -61 -2091
UK -4319 -1438 -18371 -4639 -2106 -1798 -5556
Spain 94 15922 7253 6114 5936 6697
Netherlands 1071 217 -1212 -1921 -2331 -2276 -3005
Belgium -1100 -283 504 1718 1415 1079 801
Sweden -897 -656 -1129 -1039
Austria -860 -213 -723 -756
Denmark 1055 421 2880 345 247 68 180
Greece 3295 1272 26048 3528 4081 4371 4647
Finland -134 88 56 -170
Portugal 219 10099 2441 2849 2721 2903
Ireland 2929 1230 23066 1913 2316 2676 2242
Luxembourg -120 -59 1818 694 787 725 693
Source: Commission Report 1999 and Nurettin Bilici(1997)
In this table we can see that some countries are net contributers to the budget
while others are net beneficiaries of the budget. Germany, France, UK and Italy are
12

the four most important net contributer countries to the budget (Italy started
contribution after 1986). Although these four countries receive large amounts from
the budget, especially from agricultural expenditures and other internal policies,
since their GNP is high, their contribution exceed their receipts. We can also
observe that Greece, Spain, Portugal and Ireland are net beneficiaries of the budget
and their net transfers are very high compared to the other member states. And,
although they joined the Union in 1995, Austria, Finland and Sweeden started to
contribute Union budget at the first year of their accession and their contributions
have been more than their receipts from the budget since their accession date
(except in 1996 and 1997 for Finland).
2.3.2.2 According to the Enlargements
UK, joined the Union in the first enlargement of EU, is one of the four
major contributers to the budget. As seen in Table 2.1 above, Denmark is a net
beneficiary of the budget, but its net transfers are not so much compared to other net
beneficiaries of the budget. Ireland, another country joined to the Community in the
first enlargement, is one of the less developed countries of the Union. So, its net
transfers have been very high as seen in Table 2.1.
From Allocation of 1998 EU operating expenditure by Member State
(1999), it can be seen that Spain is the largest beneficiary of total expenditures. But
if we look at Table 2.1, Greece is the largest beneficiary of net transfers. The reason
for this situation is the high GNP of Spain. Since Spain’s GNP is high its
contribution to the budget is also high, so although it has been the largest beneficary
of EU budget, in terms of net budgetary transfers it comes after Greece. Also in
Table 2.1, Portugal is seen with higher receipts than contributions. Spain, Portugal,
Greece and Ireland are said as the less developed countries of EU.
As said above, Austria, Sweden and Finland, the fourth enlargement
countries, have been net contributers of the budget since their accession, because,
these countries had been developed countries when they joined to the Union (IKV,
2002). So, they have not needed so much budgetary transfers.
Hence, we can conclude that, EU’s second and third enlargement countries,
Greece, Spain and Portugal, have been large burdens on the EU budget compared to
the other member states. Another proof for this is the Cohesion Fund. Cohesion
13

Fund was set up in 1994, in order to help these less-favored member states to cope
with the transition to European Monetary Union. As said above, the countries
benefing from this fund are: Greece, Spain, Portugal and Ireland.
2.4 Accession Strategy of EU Before Fifth Enlargement
In the previous part, we saw that the countries, in second and third
enlargements, have received the largest part of the budget. There have been
discrepancies between these countries and the other members. In order to reduce the
discrepancies between these members and the other members, EU has devoted
largest part of its budget to these countries. Why is there such a big discrepancy
between these countries and other members? In this point one question is come to
our mind: were these countries really ready when they joined to the Union? Did
they prepare well for the membership? In order to answer these questions we should
look at pre-accession periods of these enlargements. What was the accession
strategy of EU in the first four enlargements? First, we present the accession
criterion for membership in those days. Second, we look at whether or not EU
supported these members financially during their pre-accession period. We reach
the conclusion that EU changed its accession strategy in fifth enlargement because
of the failures of the strategy applied in previous enlargements.
2.4.1 Accession Criterion for Membership
In the Article 237 Treaty of Rome, by which EEC was founded; the
procedure for membership of EEC is explained as follows: ‘Any European State
may apply to become a member of the Community. It shall address its application
to the Council, which shall act unanimously after obtaining the opinion of the
Commission’. In fact, in Treaty of Rome, there is no detailed information about the
EU membership. In Maastricht Treaty, signed in 1993, again there is no clear
explanation for the membership. We cannot see any strict economic and political
criteria for membership.
EU is generally interested in enlargement for various political, security,
ecology and economic reasons. The Southern Enlargement (Greece, Spain and
Portugal) of EU, although costly in financial terms, had the objective of stabilizing
democracy in these countries following a period of dictatorship (Jovanovic, 1999).
14
2.4.2 Pre-Accession Aid to Greece, Spain and Portugal
Pre-accession aid is an instrument of EU which is used for preparing
candidate countries for membership. It is a financial support for candidate countries
(In Chapter 3 we will see that this instrument becomes very important in EU’s pre-
accession strategy). What about the role of this instrument in second and third
enlargements? Since, there were no strict demands of Union from these countries in
their pre-accession periods we do not expect large amount of financial support to
these countries in their pre-accession periods.
Nurettin Bilici (1996) says that Spain received little aid, which is negligible,
from EC before membership. When Portugal transmitted from dictatorship to
democracy, EU provided to this country 150 million euro (IKV, 2002). However,
this aid is not for preparation of membership. We can say that Spain, Portugal and
Greece did not receive any financial aid from EC during their pre-accession periods
in the form of grant or financial support for investment. However, there are some
amounts given to these countries in the form of credit through European Investment
Bank3. Nurettin Bilici (1997) gives these amounts as:
a) Pre-Accession Aid to Spain in the Form of Credit: Spain got 550
million ECU financial aid before the accession to the Community. These are:
1.Pre-Accession financial cooperation aid: 200 million ECU;
2.Pre-Accession first supplementary financial cooperation aid: 100 million ECU;
3.Pre-Accession second supplementary financial cooperation aid: 250 million ECU.
The financial aids from EIB to Spain is amounted to 21366 million ECU
from 1986 to 1995. So, from pre-accession period to 1995 total credits given to
Spain is amounted to 21816 million euro.
b) Pre-Accession Aid to Portugal in the Form of Credit: Portugal
obtained 725 million ECU financial transfers in the pre-accession period. These are:
1.I. Financial Protocol: 200 million ECU
2.Pre-Accession aid: 150 million ECU;
3.Pre-Accession first supplementary aid: 75 million ECU;
4.Pre-Accession second supplementary aid: 150 million ECU, Emergency aid: 150
million ECU.
3 As an independent Community institution, the EIB is responsible for granting loans and issuing guarantees to finance capital projects consistent with the aims of Community economic policy. EIB grants loans not only members of EU but also the countries outside the Union.
15

Up to 1995, Portugal received totally 9478 million ECU from EIB as a
credit (725 million ECU in the pre-accession period, 8753 million ECU after
accession).
c) Pre-Accession Aid to Greece in the Form of Credit: Greece received
totally 350 million ECU in the pre-accession period, which are:
1.I. Financial Cooperation: 125 million ECU;
2.II. Financial Cooperation: 225 million ECU (Rapport.... garanties 10)
Up to end of 1995, Greece received totally 5553 million ECU from EIB
sources (350 million ECU in pre-accession period, 5203 million ECU after
accession).
2.5 Conclusion
Up to now EU has undergone four enlargements. In these enlargements,
EU’s policy was like ‘first join then prepare for membership’. Because there was no
strict criterion for membership. There was no criterion for candidate country’s
economy.
First and fourth enlargements did not cause problems in Union (except,
Ireland). Because, these countries had already developed countries when they joined
the Union. However, second and third enlargements have caused big problems in
the Union. Their economies had not performed well when they became members. In
order to reduce the discrepancies in the Union EU has devoted the largest part of its
funds to these countries. As seen, EU budget has suffered from these three countries
a lot. The main reason for this bad experiences is not to make these countries
prepare well for membership.
Even though Spain and Portugal were unprepared, ‘poor countries’, they
were market economies. CEEC-10 are poor countries, besides they only started in
1990 the transition from planned socialist economies to private market economies.
Also, the fifth enlargement is the largest ever enlargement of EU. Fifth enlargement
consists of 12 candidate countries except Turkey. And, we found that Greece, Spain
and Portugal have been big burdens on Union budget since their economies were
not ready for membership when they joined the Union. While EU has been
suffering from 3 countries (Greece, Spain and Portugal), what would be the result
for 12 countries? If fifth enlargement’s countries were permitted to enter without
16

good preparation the burden would be much larger than second and third
enlargements’. Their economies should be improved before accession. Because of
that, EU has changed its accession strategy. In the next chapter, the new strategy of
EU will be given in detail.
17

CHAPTER 3
EUROPEAN UNION’S STRATEGIES TOWARDS CANDIDATE
COUNTRIES IN THE FIFTH ENLARGEMENT
3.1 Introduction
In the previous chapter, we saw that there are important reasons of EU to
change its accession strategy for a new enlargement. Before accepting the
applications of Central and Eastern European Countries for EU membership, EU
changed its accession criterion and accession strategy.
EU announced new accession criterion at Copenhagen European Council in
1993. Being a European State is not enough for membership with this new
accession criterion. Copenhagen Criteria includes political criteria, economic
criteria and adoption of acquis. Acquis is detailed laws and rules adopted on the
basis of the EU’s founding treaties.
Compliance with Copenhagen political criterion is prerequsite for the
opening of any accession negotiations. What is the accession negotiation about?
The aim of accession negotiations is to remove the difference between the acquis
and the candidate countries’ subjects under discussion. Accession negotiations is an
ingredient of enlargement process. Before starting accession negotiations an
analytical examination of the acquis (screening) is done. This measures the
difficulties of candidate countries in adopting the acquis. In order to examine the
progress made by candidate countries, regular reports are used. These reports
contain a detailed analysis of the progress made by candidate countries. Regular
reports and screening are the other ingredients of the enlargement process.
EU helps the candidate countries for their preparation. For this purpose EU
uses pre-accession strategies. At Corfu Summit, 1994, Commission was charged
18
with preparing pre-accession strategy for the candidate countries. Three pre-
accession strategies were prepared. One for CEECs, one for Cyprus and Malta, one
for Turkey. Some of the parts in three strategies are common.
The purpose of this chapter is to present the pre-accession period which was
designed for fifth enlargement. In the first part, we will give Copenhagen Criteria.
In the second part, enlargement process is given with its ingredients. The third part
gives the pre-accession strategies for fifth enlargement. At the end we can conclude
that new criteria for accession are hard to fulfill. However, in order to deal with
candidates EU found a systematic way.
3.2 New Conditions for Accession to the EU
In this part, we present the new condition for accession known as
Copenhagen Criteria. There are three criteria in Copenhagen Criteria: political,
economic and adoption of the acquis. We will see in detail each of these criterion.
Copenhagen Criteria was announced at Copenhagen European Council, 1993,
which are:
1) Political criterion: stability of institutions guaranteeing democracy, the rule of
law, human rights and respect for and protection of minorities;
2) Economic criterion: the existence of a functioning market economy as well as the
capacity to cope with competitive pressure and market forces within the Union;
3) Other obligations of membership: the ability to take on the obligations of
membership including adherence to the aims of political, economic and monetary
union.
3.2.1. Political Criterion
The first criterion of Copenhagen Criteria. A candidate country can not start
accession negotiaitons without satisfying political criterion. Its content is: "Stability
of institutions guaranteeing democracy, the rule of law, human rights and the
respect for and protection of minorities”. Since the entry into force of the Treaty of
Amsterdam in May 1999, these requirements have been enshrined as constitutional
principles in the Treaty on European Union, and have been emphasised in the
Charter of Fundamental Rights of the European Union, that was proclaimed at the
Nice European Council in December 2000.
19

Concerning democracy and the rule of law, the commission looks at the way
democracy functions in practice instead of relying on formal descriptions of the
political institutions. Human rights, respect for fundemental rights should be
guaranteed in the candidate countries.
3.2.2 Economic Criterion
Economic Criterion consists of two parts: “the existence of a functioning
market economy as well as the capacity to cope with competitive pressure and
market forces within the Union”
a) The existence of a functioning market economy: The existence of a
functioning market economy is assessed on the basis of the following factors:
1) Equilibrium between demand and supply is established by the free interplay of
market forces; prices, as well as trade, are liberalised,
2) significant barriers to market entry and exit are absent,
3) the legal system, including the regulation of property rights, as in place; laws and
contracts can be enforced,
4) macroeconomic stability should be achieved including adequate price stability
and sustainable public finances and external accounts,
5) broad consensus about the essentials of economic policy,
6) the financial sector is sufficiently well developed to channel savings towards
productive investment.
b) The capacity to withstand competitive pressure and market forces
within the Union: this economic criterion is assessed on the basis of the following
factors:
1) the existence of a functioning market economy, with a sufficient degree of
macroeconomic stability for economic agents to make decisions in a climate of
stability and predictability,
2) a sufficient amount, at an appropriate cost, of human and physical capital,
including infrastructure (energy supply, telecommunication, transport, etc.),
education and research, and future developments in this field,
3) the extent to which government policy and legislation influence competitiveness
through trade policy, competetion policy, state aid, etc.,
20

4) the degree and the pace of trade integration a country achieves with the Union
before enlargement. This applies both to the volume and the nature of goods already
traded with member states,
5) the proportion of small firms, partly because small firms tend to benefit more
from improved market access, and partly because a dominance of large firms could
indicate a greater reluctance to adjust.
Assessing a country’s position vis a vis the second criterion (The capacity to
withstand competetive pressure and market forces within the Union) is even more
difficult than the first because: the criterion is more complex, the judgement has to
be made in a medium-term perspective, meeting this criterion depends in part on
meeting the first, and even when the right policy measures are being taken, these
take time to work their way through the economy and have their full impact on its
ability to cope with competetive pressures. The criterion about the functioning
market economy should be satisfied in the short term, but the criteria about the
capacity to withstand competetive pressure should be applied in the medium term.
3.2.3 Other Obligations of Membership
This criterion consists of two parts: adoption of acquis and adherence to the
aims of political, economic and monetary union.
a) Adoption of the acquis: On the joining the Union, applicants are
expected to accept the ‘acquis’, i.e. the detailed laws and rules adopted on the basis
of the European Union’s founding treaties, mainly the treaties of Rome, Maastricht
and Amsterdam. The adoption of the acquis involves a process of transposition to
internal law, implementation and enforcement. The importance not only of
incorporating Community legislation into national legislation, but as well of
ensuring its effective application through appropriate administrative and judicial
structures was highlighted by the European Council in Madrid and is a central
feature of the accession negotiations. It is a key aspect of preparation for
membership and an essential pre-condition for creating the mutual trust
indispensable for future membership.
The acquis is made up of 31 chapters. After giving chapters of the acquis we
will look at briefly content of chapters. The chapters of acquis are:
1. Free movement of goods
21

2. Freedom of movement for persons
3. Freedom to provide services
4. Free movement of capital
5. Company law
6. Competetion policy
7. Agriculture
8. Fisheries
9. Transport policy
10. Taxation
11. Economic and monetary union
12. Statistics
13. Social policy and employement
14. Energy
15. Industrial policy
16. Small and medium-sized undertakigs
17. Science and research
18. Education and training
19. Telecommunications and information technologies
20. Culture and audiovisual policy
21. Regional policy and coordination of structural instruments
22. Environment
23. Consumers and health protection
24. Cooperation in the fields of justice and home affairs
25. Customs union
26. External relations
27. Common foreign and security policy
28. Financial control
29. Financial and budgetary provisions
30. Institutions
31. Other
1) Free movement of Goods: The principle of the free movement of goods requires
a common regulatory framework to ensure products can move freely from one part
of the Union to another just as they would within the boundries of an individual
22

country. This means that basic technical standards, product certification and
metrological definitions must be governed by rules established at European level.
2) Freedom of movement for persons: The acquis covers the four broad areas of
mutual recognition of professional qualifications, citizens rights, free movement of
workers and co-ordination of social security schemes. Through the general system
of ‘mutual recognition’, the Community seeks to eliminate obstacles to the taking
up and pursuit of regulated professions, accepting the principle that a person fully
qualified to practise a regulated profession in one member state should be entitled to
do so anywhere in the Community.
3) Freedom to provide services: The acquis in this sector lays down the minimum
requirements for the different types of institutions in order to create a uniform
minimum standard based on the following principles: minimal harmonisation of the
authorisation conditions and the prudential rules, home country control and single
licence, mutual recognition of national supervisory standards.
4) Free movement of capital: The definition of free movement of capital covers
much more than payments and transfers of money over the borders. Other
transactions allowing transfer of ownershipof assets and liabilities are also part of
the acquis in this chapter, for instance, investments in companies and real estate or
portfolio investments. Several candidate countries have requested and been granted
transitional periods on foreigners right to ivestment freely in real state.
5) Company Law: The main issues in this chapter are: the protection of industrial
property rights for pharmaceutical products within the enlarged Union, Community
Trademark(CTM) where the Union has proposed an automatic extension of the
existing CTM to the terriority of the Candidate Countries, the fight against piracy
and counterfeiting.
6) Competetion Policy: In assessing whether the candidate Countries can comply
with the competetion acquis and withstand the competetive pressures of the internal
market resulting from the full application of this acquis, the Commission examines
whether undertakigs operating in the candidate countries are accustomed to
operating in an environment such as that of the community. In the field of State
Aid, part of the acquis is addressed under other chapters, namely transport,
agriculture and fisheries.
7) Agriculture: Agriculture is the largest of the negotiations chapters. With the
exception of the field of veterinary and phytosanitary legislation, it consists mostly
23

of regulations and legislation will therefore be directly applicable at the date of
accession and does not call for transposition the part of the candidate countries. The
emphasis in the preparations for accession will therefore be on the candidate
country’s ability to implement and enforce the Community acquis.
8) Fisheries: The applicant countries are encouraged to introduce the legislation
before acession, firstly to prepare the administration and the operators to their
eventual participation into the Common Fisheries Policy ahead of accession, and
secondly to provide for the eventual implementation of the acquis provisions as
from accession.
9) Transport Policy: The ‘road transport’ related acquis covers a vast area of
social, technical, fiscal, safety and environmental requirements. The ‘railway’
acquis has recently been subject of substantial amendments and the liberilization of
this sector call for an even further opening of national railway markets to competing
railway undertakigs from other Member States. In ‘aviation’issues of market access,
safety and infrastructure organization have to be addressed. In ‘maritime’transport
the enforcement of the maritime safety acquis forms one of the biggest challenges.
10) Taxation: The EU acquis in this chapter mainly covers indirect taxation, in
particular Value Added Tax (VAT) and excise duties regimes, while on direct
taxation the acquis is limited legislation on corporate taxation. In the field of ‘excise
duties’ the acquis contains harmonised legislation as regards mineral oils, tobacco
products and alcholic beverages. Communitylegislation establishes the structure of
the duty that shoul be charged, together with a system of minimum rates for each
product group. Finally, the acquis in the area of ‘direct taxation’ mainly concerns
some aspects of corporation taxes and capital duty. Governments fear the economic
and social implications of significantly raising rates- and hence prices- of socially
sensitive goods by accession. Therefore, all candidate countries have requested
transitional periods on specific goods or services.
11) Economic and Monetary Union: According to the treaty, the disregarding opt-
out status, a member state is either a member state that has adopted or a member
state with denogation. A member state with a denogation is excluded from the rights
and obligations within the European system of Central Banks (ESCB). This implies
amongst other things, that the member state in question will not participate in the
Single Currency since the criteria for being able to do so have not yet been fulfilled.
The candidate countries cannot adopt the euro upon accession because the Treaty
24

requires that an assesment of the sustainability of the government’s financial
position be performed before accession. The other reason is that the candidate
countries will not have participated in the Exchange Rate Mechanism, which is not
open to the candidate countries prior to accession.
The opt-out status being disregarded for the candidate countries, no
transitional periods or special arrangenments are therefore permitted, nor have they
been requested by any of the countries with which negotiations have been carried
out until now.
12) Statistics: Adoption of the legal acquis for this chapter is not, as such,
problematic the main issue is rather whether the countries are able to produce
accurate and harmonised data in a permanent and sustainable way.
13) Social Policy and Employement: Employement and social policy covers areas
where there exists sustantial secondary legal acquis at EU level, such as health and
safety issues, labour law and equality of treatment between women and men, as
well as areas such as social dialouge, employement and social protection where
convergent policies are being developed, on the basis of the EC Treaty.
14) Energy: : Energy is a major economic and geopolitic factor. The European
Union is hovewer dependent on imports for half of its supplies, whilw this
dependence could reach 70% for oil, 90% and for coal even 100%. Most likely
enlargement will only reinforce these trends, despite the fact that certain candidate
countries are producers of primary energy (e.g Poland for coal and Romania for oil
and gas) Candidate countries have made considerable progress over the past years
and some issues related with this subject are applicable to the candidate countries
in varying degrees.
15) Industrial Policy: : In the framework of the negotiations it has been requested
to the candidate countries to present industry policy and restructring strategies in
order to assess whether their industrial policies were in line with the principles, in
particular regarding privisation and restructring, set out in the council decision on
‘the Implementation of a community action programme to strengthen the
competetiveness of European Industry’.
16) Small and Medium-sized Enterprises: The acquis currently in force under this
chapter heading, cover the area of enterprise policy, distributive trades, tourism and
social economy, and consists largely of decisions setting up consultation procedures
and Community programmes, or of recommendations.
25
17) Science and Research: The acquis consists of a large number of Council and
Commission Decisions concerning two areas: (i) Framework Programmes of
European Community activities in the field of research, technological development
and demonstration and of the European Atomic Energy Community for research
and trining activities; (ii) Science and Technology Co-operation agreements with
third countries.
18) Education and Training: The Community’s acquis consists of a1977
Directive action programmes and Conclusions, Resolutions or Declarations of the
Council or the Council and the Ministers of Education meeting within the Council
on various issues. Moreover, two bodies have been set up, the European Centre for
the Development of Vocational Training and the European Training foundation.
19) Telecommunications and information technologies: The European Union
established its policy in the sector Telecommunications sector as a result of rapid
technological development. The opening of telecommunications markets across the
EU began in 1988 and, with some transitory exceptions were completely opened to
competetion in 1998. The telecommunications acquis has now been updated
(february 2002) and candidate countries will be required to transpose and apply this
modified legislation by the time they enter the EU.
20) Culture and audiovisual policy: The focus of this chapter is alingment by the
Candidate Countries with the television without Frontiers directive. The directive
establishes the legal frame of reference for the free movement of television
broadcasting services in the Union in order to promote the development of of a
Europeam market in broadcasting and related activities such as television
advertising and the production of audiovisual programmes.
21) Regional policy and coordination of structural instruments: The main issues
addressed in the negotiations under this chapter are administrative and
programming capacity as well as eligibility. The acquis under Chapter 21 does not
define how the specific structures for the practical managament of Structural and
the Cohesion Funds should be set up, but leaves it up to the Member States. In order
to profit from funds, the candidate countries will have to have the appropriate
system in place by the time of accession. Upon accession, the candidate countries
will have to comply with certain requirements: legislative frameworks, territorial
organisation, programming capacity, administrative capacity, financial and
budgetary management.
26

22) Environment: Apart from horizontal issues quality standards are set for Air,
Waste management, Water, Nature protection, Industrial pollution control,
Chemicals and genetically modified organisms, noise and Nuclear safety and
Radiation Protection.
23) Consumers and health protection: The acquis for this chapter is composed of
the following areas: misleading advertising, product liability, doorstep sales,
consumer credit, dangerous contracts, time-share distance selling comperative
advertising prices on foodstuffs guarantees for sale of consumer goods and
injuctions.
24) Cooperation in the fields of justice and home affairs: Negotiations on Justice
and Home affairs acquis are not about transition periods; neither the candidate
countries nor the EU have any requests for these on the table. Perhaps the most
visible component of the EU’s Justice and Home affairs policies is the Schengen
acquis, which result in the lifting of internal border controls. However, accession to
the EU will not immediately lead to the lifting border of controls between old and
new member states: as with previous enlargements, this will be the subject of a
seperate Council unanimous decision, some time after accession.
25) Customs union: From the first day of accession, customs administration of
candidate countries will have to manage and control their borders, which will then
be external borders of the Union, in the interest of the EU population and trade
operators.
26) External relations: The external relations chapter covers the Community’s
economic and trade relations with third countries and international organisations as
well as co-operation and assistance. The main components are the common
commercial policy and the development policy of the Community. The fundemental
basis for the common commercial policy is the common customs tariff vis-a vis
third countries.
27) Common foreign and security policy: The EU’sCommon Foreign and
Security Policy (CFSP) is not equipped with the legal instruments (directives,
regulations) that exist for other Community policies. It uses instruments such as
joint actions, common positions, statements and declarations, as well as in the
conclusions of the European Council and the Council.
28) Financial control: The European Commission is called to assess the existing
financial control systems in the candidate countries with regard to five elements: (i)
27

Public Internal Financial Control (PIFC) includes financial control activities in the
public sector, covering control exercised by central and decentralised government
agencies. (ii) External Audit: comprises the ability of the candidate countries to
confirm the independence of their external control body in terms of deciding on the
questions of audit approach and choice of inquiry, as well as reporting without
restriction or interference by the government or other bodies.(iii) Control Measures
relating the EU Own Resources.(iv) EU Pre-accession funding and future Structural
Action:The correct use, control, monitoring and evaluation of EU funding constitute
an important element in assessing the Candidate Countries ability to apply the
acquis under this chapter. (v) Protection of the EU financial interests.
29) Finance and Budgetary Provisions: The acquis in this field covers the rules
concerning the organisation, the establishment and the implementation of the EU
budget. The acquis consists of regulations and decisions which will be directly
applicable by candidate countries upon accession and, therefore, do not require
transposition into their legislation.
30) Institutions: One of the keys to successful enlargement will be the effective
and well-balanced representation and integration of the new member states in the
institutional architecture of the Union. This is the purpose of chapter30 on
institutions which covers mainly the composition and functioning or institutions and
bodies established under the Treaties or secondary legislation.
31) Other matters: This chapter serves as a framework for question not covered in
the preceding chapters, notably, problems which are not directly related to acquis.
b) The aims of political, economic and monetary union: European
Monetary Union (EMU) is an integral part of the Community acquis. However, a
clear distinction should be made between participation in European Monetary
Union and adoption of the euro as a single currency. New Member States are not
expected to adopt the single currency upon accession, even though they will be
taking in part in European Monetary Union. European Monetary Union implies a
gradual development of the economies of candidate countries leading to the final
adoption of the single currency as ultimately all Member States must introduce the
euro.
The procees which will be ended with the adoption of the euro as a single
currency contains three distinct preparatory phases: the pre-accession phase, the
accession phase, the final euro phase.
28

Four convergence criteria were laid down that have to be met by a member
country in order to qualify for participation in the EMU. These criteria are known as
Maastricht Criteria.The EU membership require Copenhagen Criteria, it does not
require the satisfaction of the Maastricht Criterias. Maastricht Criteria can be met
after accession.
Maastricht Convergence Criteria are:
1) The average rate of inflation should not exceed by more than 1.5 % that of the
three best-performing member states in terms of price stability.
2) The national deficit should be no more than 3 %of GDP. No country's
outstanding debt should be more than 60 % of its GDP.
3) An average nominal long-term interest rate that does not exceed by more than 2
% that of, at most, the three best performing member states in terms of price
stability
4) They must have kept their currencies stable over the past two years against other
European Union currencies within the Exchange Rate Mechanism (ERM). ERM
presently allows for currency fluctuation margins of no greater than 15 %.
3.3 The Enlargement Process
A candidate country has to fulfill the Copenhagen Criteria before accession
to the Union. In the enlargement process, there is accession negotiation.
Compliance with the Copenhagen political criterion is a prerequisite for the opening
of any accession negotiations. Before starting accession negotiations, EU and the
candidate country make detailed examination of the acquis together. Evaluation for
candidate countries’ progress achieved on the Copenhagen Criterion is made
through regular reports. These are ingredients of an enlargement process. In this
part we present these ingredients.
3.3.1 Analytical Examination of the Acquis (Screening)
Before starting accession negotiations, EU and the candidate country make
detailed examination of the acquis together. The aim of the Screening is to explain
the acquis to facilitate its adoption, and to measure the difficulties of candidate
countries in this respect.
29

3.3.2 Accession Negotiations
Compliance with the Copenhagen political criteria is a prerequsite for the
opening of any accession negotiations. Following a detailed examination of the
different chapters of the acquis communautaire ('screening'), such as free movement
of goods, agriculture, environment, etc., negotiations are opened with the candidate
countries, chapter by chapter. Below, we see the aim of accession negotiations, their
procedure and the actors in accession negotiations.
a) What Are the Negotiations About?
The negotiations determine the conditions under which each applicant
country will join the EU. The aim of the accession negotiations is: to remove the
differences between the acquis communautaire and the candidate countries’ subjects
under discussion. The candidates enter the negotiations with the EU, to seek
agreement as to when and how can join. On the joining the Union, applicants are
expected to accept the ‘acquis’. The acquis is not negotiable.
In the negotiations, the candidate countries commit themselves to adopt,
implement and enforce the acquis, as required, by accession. Some chapters of the
acquis may be provisionally closed. The provisional closure of a chapter depends
inter alia on the Union accepting the credibility of the commitments made by the
candidate countries.
b) Who are the actors in the accession process?
On the Union side, the 15 Member States are the parties to the accession
negotiations. The Presidency of the Council of Ministers, which rotates among the
member states every six months, presents the negotiating positions agreed by the
Council and chairs negotiating sessions at the level of ministers or their deputies.
Each applicant country draws up its position on each of the 31 chapters of the EU
acquis, to engage in negotiations. Each applicant has appointed a Chief Negotiator,
with a supporting team of experts.
The European Commission proposes the draft negotiating positions. The
Commission is in close contact with the applicant countries in order to seek
solutions to problems arising during the negotiations. Within the Commission, the
work is coordinated by the Directorate General for Enlargement. The General
Secretariat of the Council and the applicant countries provide the secretariat for the
negotiations. The European Parliament is kept informed of the progress of the
30

negotiations and gives its assent to the resulting accession treaties. Each member
state will need to ratify the treaties of accession.
The basic responsibility in this procedures is belong to Council although the
final decision about the membership of the candidate country is given by the
member states. The Parliament sends the applications for the membership before
starting the accession negotiations to related commitee for evaluation.
c) How do the negotiations proceed?
The negotiations with each applicant proceed on their own merits. The pace
of each negotiation will depend on the degree of preparation by each applicant
country and the complexity of the issues to be resolved. For this reason, it is not
possible to estimate the likely length of each negotiation in advance.
After the opening of negotiations, the Commission proposes common
negotiating positions for the EU for each chapter relating to matters of Community
competence. Negotiating positions are then approved unanimously by the Member
States. The results of the negotiations are incorporated in a draft accession treaty,
which is submitted to the Council for approval and to the European Parliament for
assent. After signature, the accession treaty is submitted to the Member States and
to the candidate country for ratification by them involving, in some cases,
referenda. When the treaty takes effect, the candidate becomes a Member State.
This ratification process can take around two years.
As said above, in the negotiations, the candidate countries commit
themselves to adopt, implement and enforce the acquis, as required, by accession. In
June 1995 the European Council at Madrid highlighted the importance, not only of
incorporating the acquis into national legislation, but also of ensuring its effective
application through appropriate administrative structures.
3.3.3 Regular Reports
The reports serve as a basis for the Council to take decisions on the conduct
of negotiations or their extension to other candidates on the basis of the accession
criteria. Regular Reports are prepared by the Commission and submitted to the
European Council. In these reports, Commission examines the progress achieved on
the Copenhagen Criteria to arrive at an evaluation of the total achievement to date.
31

3.4 Pre-Accession Strategy
In the previous parts, we saw the new conditions for membership and the
enlargement process. The perspective of the membership, given at the Copenhagen
Council, was defined in general features. Since, the criterion is hard to implement
and enforce, in order to help the candidate countries EU introduced pre-accession
strategies for this enlargement. Three pre-accession strategies were prepared for this
enlargement, one for CEECs, one for Cyprus and Malta, one for Turkey.
Pre-accession strategies were prepared after Copenhagen Council. First we
will present the preparation period of these strategies. Second, we will present the
main ingredients of pre-accession strategies. In the last section we will give the pre-
accession strategies of three groups of candidate countries.
3.4.1 The Developments After Copenhagen Council
Central and Eastern European Countries started to apply for membership to
the Union after the Copenhagen Council, at which it had been declared that Central
and Eastern European Countries shall become member of the Union. Cyprus, Malta
and Turkey applied to the Union for membership before Central and Eastern
European Countries did.
The perspective of the membership, given at the Copenhagen Council, was
defined in general features. Hence, in order to prepare the countries of central
Europe for European Union membership, in June 1994, at Corfu Summit, the
Commission was charged of preparing a strategy. The prepared strategy was
approved in December 1994 at the Essen Summit. This strategy is named as ‘Pre-
accession strategy’ or ‘Essen strategy’.
In the economical view, the strategy proposed the Central and Eastern
European Countries to join the Single Market. So, after becoming member of the
European Union, these countries could benefit from the free circulation
opportunities of the European Union market. However, gaining the full membership
is not enough to benefit from these opportunities. Because, achieving a genuine
Single Market requires inter alia effective application of Community rules for
approximation of legislation and administrative practices in the fields of conformity
assessment, product liability and general product safety, the protection of health,
enviroment and consumers, indirect taxation, adequate management of the external
32

borders, implementation of safety requirements and state aids. An inadequte or
incomplete implementation of the existing body of Single Market legislation by the
time of accession could lead to market distortions for European Union industry. So,
the goal of the Commission during the pre-accession period has to be to prepare
each country properly for its accession.
Within the pre-accession strategy adopted by the Essen European Council,
the Council invited the Commission to prepare a White Paper on the Single Market
aspects of enlargement. White Paper is a general reference document for all
candidate countries providing an orientation to prepare for accession which sets out
the key elements of the existing body of Community law to be adopted in each
sector. It is important to apply the elements about the Single Market in White Paper
before accession. It is not possible to manage the free movement in the absence of a
balanced and free competition area. And the most important obstacles in this area
are; monopolies in public and private sector, company’s marriages and state aids.
Hence, three points become important in this situation: competition policy, the
control of the state aids and application of the acquis about the Single Market. For
the first two, Union promised to give aid and it has been providing it through
financial aid programmes.
The Madrid European Council in December 1995 called on the European
Commission to submit an assessment of the candidates’ applications for
membership as soon as possible after the Intergovernmental Conference on the
reform of the European Union’s institutions, which was completed in june 1997 in
Amsterdam, and to prepare a detailed analysis of what enlargement would mean for
the European Union. It also reaffirmed that The Madrid European Council in
December 1995 called on the European Commission to submit an assessment of the
candidates’ applications for membership as soon as possible after the
Intergovernmental Conference on the reform of the European Union’s institutions,
which was completed in june 1997 in Amsterdam, and to prepare a detailed analysis
of what enlargement would mean for the European Union. It also reaffirmed that the
necessary decisions for launching accession negotiations would be taken within six
months of the Intergovernmental Conference’s conclusion. The preparations of the
Commission continued two years. In july 1997, the Commission presented its
assessments and analyses in a report which is called as ‘Agenda 2000’.
33
The Agenda 2000 is a single framework in which the Commission:
1) outlines the broad perspective for the development of the European Union and its
policies beyond the turn of the century
2) addresses the challenge of enlargement. It draws the main coclusions and
recommendations from the individual opinions on the applicant countries and gives
the Commission’s views on the launching of the accession process and on
reinforcement of the pre-accession strategy
3) the impact of enlargement on the European Union as a whole
4) the future financial framework beyond 2000, taking into account the prospect of
an enlarged Union.
In Agenda 2000 (1997) it was stated that in order to meet the cost of
enlargement, some reforms should have been needed especially for the Common
Agricultural Policy and the Structural Policies4. So, it was the first time for
European Union that it needed to interrogate its structure for an enlargement.
The Luxembourg Europen Council 1997, was an important milestone for the
future of the European Union. At this summit, the applications of ten Central and
Eastern European Countries and Cyprus were accepted. Malta backed up its
application because of the change in its government, so Malta was not discussed at
the Summit. The Luxembourg European Council decided on an enhanced pre-
accession strategy for the ten candidate countries of central Europe, with a specific
strategy for Cyprus. It also asked the Commission to elaborate a European Strategy
to prepare Turkey for accession in every field. Following Malta's reactivation of its
application for membership in October 1998, a specific pre-accession strategy was
also developed for Malta. Furthermore, in December 1999, on the basis of a
recommendation by the Commission, the Helsinki European Council decided to
prepare a pre-accession strategy for Turkey, building on the European Strategy.
3.4.2 Components of Pre-Accession Strategies
As we said EU prepared three pre-accession strategies for the three groups
of candidate countries. The first group is: CEECs, the second group is: Cyprus and
Malta, and the third group is Turkey. In this part we present all components of pre-
accession strategies. Some of the these components are in the first group’s pre-
4 We will see the reforms on EU’s Agricultural and Structural Polices in Chapter 6 in detail.
34

accession strategy, some of them second’s and some of them are in third’s. Also,
some of the components are common for each group. We will present the
distribution of these components across groups in the next part. The components of
pre-accession strategies are:
a) Europe Agreements: Europe Agreements provide the legal basis for
biletaral relations between the Central and Eastern European Countries and EU. The
main objectives of these agreements are: political dialogue, free trade and freedom
of movement, economic cooperation, financial cooperation and cultural
cooperation.
b) The Association Agreements with Cyprus, Malta and Turkey: The
legal framework for the relationship between the European Community and Cyprus,
Malta, and Turkey, are the Association Agreements, which date back to the sixties
and early seventies. These Agreements cover trade-related issues and various other
areas of cooperation. They aim to progressively establish a customs union between
the European Community and each of these three countries concerned. In the case
of Turkey, this objective was achieved in 1995, with the entry into force of the
Customs Union Agreement. With Cyprus, progress towards a customs union is due
to be completed by 2002. For Malta, there has been little progress, and so far no
target date for a customs union has been agreed.
In contrast to the more recent Europe Agreements, these early Association
Agreements do not provide for political dialogue. Such dialogue takes place, in the
case of Cyprus and Malta, on the basis of a specific decision of the General Affairs
Council, and, in the case of Turkey, on the basis of specific Association Council
resolutions and the conclusions of the Helsinki European Council.In December
1997, Turkey unilaterally suspended its political dialogue with the EU, but resumed
the process in late 1999.
c) Accession Partnership: An accession partnership has been drawn up for
each candidate country. This provides an assessment of the priority areas in which
the candidate country needs to make progress in order to prepare for accession. No
more than 20 pages in length, the Accession Partnerships mobilise all forms of
European Union support within a single framework for each country. The
Accession Partnerships thus provide a single framework for the programming of the
priorities of each candidate country and the programming of the financial means
available to implement those priorities.
35

The Accession Partnerships contain precise commitments on the part of the
candidate countries relating in particular to democracy, macroeconomic
stabilisation, industrial restructuring, nuclear safety and the adoption of the ‘acquis’,
focusing on the priority areas identified in each of the Commission’s Opinions on
the applications of the candidate countries for European Union membership.
Each country’s Accession Partnership is complemented by its own National
Programme for the Adoption of the Acquis (NPAA). For its part, the NPAA gives
details of each country’s commitments with regard to achieving the Copenhagen
criteria and adopting the ‘acquis communautaire’.
d) Pre-accession assistance: The aims of the pre-accession strategy can not
be achieved without recourse to the instruments providing support and financial
aid. The European Union is providing assistance and promoting investment in the
candidate countries to stimulate change so that the candidates can adapt more
rapidly to European Union requirements, and become members without
unnecessary delay or long transitional periods.
It is useful to categorize the candidate countries into three groups for
explaining the Pre-Accession Assistance of EU: the CEECs, Cyprus and Malta, and
Turkey. This categorization is useful in the sense that the type of European Union
financial aid has been the same for the countries in the group.
1) Financial Assistance for Central and Eastern Europe: Central and Eastern
European candidate countries have benefited from European Union’s financial
assistance since the beginning of the transition process through the Phare
programme. Two programmes now complement Phare: Ispa and Sapard.
(i) Phare Programme: The Phare programme was originally created for Poland
and Hungary (Official Journal of the European Communities L 375, 23.12.1989,
p.11) and then extended to candidate Central and East European Countries (Official
Journal of the European Communities L 161,26.6.1999, p.68). The Phare
programme has been providing support to the countries of Central and Eastern
Europe since 1989, helping them through a period of fundemental economic and
social transition and political change. During 1989-1997 period, Phare operated on
a ‘demand driven’ basis. The governments from partner countries proposed projects
to the European Commission themselves and as long as they met Phare objectives,
projects could be in any fields and for varying amounts. This led to numerous small
projects to be submitted, which were rather complicated and time-consuming.
36
Phare’s current ‘pre-accession’ focus was put in place in 1997, in response
to the Luxembourg European Council’s launching of the present enlargement
process. After the Luxembourg European Council, the Phare Programme became
radically accession driven. Phare funds now focus entirely on the pre-accession
priorities highlighted in each country’s Accession Partnership. Accession
Partnerships are a key feature of the revised Phare programme, since they lay down
the short-term and medium-term priorities for each country in the accession process.
After the introduction of other two aid programmes, Phare orientation focus
essentially on two types of support. The first one is: Institution building (accounting
for around one third of the phare allocation); capacity building is a major priority
for all the countries, since many do not have adequate capacity to prepare for
European integration. The second one is: Investment support investment to
strengthen the regulatory infrastructure needed to ensure compliance with the
acquis (around one third of the allocation), and investment in economic and social
cohesion to help the candidates prepare for the implementation of Structural Funds
for accession (the remaining one-third of the Phare allocation).
There are two types of institution building projects: Twinning is the
principal instrument in this respect. It involves the secondment of practitioners from
Member States ministries, regional bodies, public agencies and professional
associations for at least one year to counterpart institutions in the candidate
countries. It has been operational in the Central and Eastern European countries
since 1998. Twinning was extended to Cyprus and Malta in 2001. TAIEX is another
instrument in this respect. Technical assistance, TAIEX (Technical Assistance
Exchange Office) remains a source of short-term advice and SIGMA (PHARE-
financed and managed by OECD) provides advice on horizontal government
functions in Central and Eastern European countries, focusing on the reform of the
civil service, financial control and audit.
(ii) Special Accession Programme for Agricultural and Rural Development
(SAPARD): SAPARD, founded on the Council Regulation 1268/1999 adopted in
June 1999, aims to support the efforts made by the candidate countries to prepare
for their participation in the Common Agricultural Policy (CAP) and the Single
Market (Official Journal of the European Communities L 161, 26.6.1999, p.87). It
involves two major, explicit, operational objectives: to help solve the priority and
37

specific problems in agriculture and rural development and to contribute to the
implementation of the acquis concerning the CAP and other agricultural priorities.
Sapard implementation is fully decentralised. It is the first time a fully
decentralised external assistance programme has been undertaken by the
Commission. The idea is that they will operate in a similar fashion to paying
agencies in the Member States (set up according to the European Guidance and
Guarantee Fund-EAGFF rules) and upon accession could become the paying
agency for the Common Agricultural Policy.
On the basis of rural development plans approved by the Commission,
SAPARD co-finances rural development projects selected by the beneficiary
countries. The implementation structure for each country is based on a SAPARD
Agency, responsible for management and payments, which must be accredited by
the Commission.
(iii) Instrument for Structural Policies for Pre-Accession (ISPA): ISPA that
came into operation in 2000 is founded on the Council Regulation 1267/1999
adopted in June 1999 (Official Journal of the European Communities L 161,
26.6.1999, p.73). The “Instrument for Structural Policies for Pre-Accession” (ISPA)
provides financial support for investment in the areas of environment and transport
in order to speed up the compliance in accession countries with the European
legislation in force for these two sectors for a period of seven years (2000-2006). A
small part of ISPA budget may also be used to fund preparatory studies and
technical assistance for project preparation and project management.
2) Financial Assistance for Cyprus and Malta: Until 2000, Financial Protocols
signed between these countries and the EU was the sole financial instrument.
According to the Council Regulation 555/2000 of 13 March, pre-accession aid will
amount to 95 million euro between Malta and Cyprus for the period 2000-2004
(Official Journal of the European Communities L 68, 16.3.2000, p.4). Malta and
Cyprus are also eligible for the European Investment Bank pre-accession facility
and facility for Mediterranean countries. The Regulations also provided for these
countries’ participation in MEDA5 regional programmes.
3) Financial Assistance for Turkey: A single framework for coordinating all
sources of pre-accession financial assistance for Turkey was adopted by the
5 MEDA is the main financial support for the Mediterranean Countries
38
Commission in July 2000, Council Regulation EC No 390/2001, (Official Journal
of the European Communities L 58, 28.2.2001, p.1). Before this, the financial
cooperation between Turkey and EU can be investigated under two main titles:
Prior to the Customs Union and in the framework of the Customs Union. This
regulation, adopted in July 2000, also provides the legal basis for the Accession
Partnership for Turkey. Further steps imply that all funds available for Turkey
should be put into one single budget. With the entry into force of the ‘Single
Framework’, the commitment and disbursement process of grant assistance to
Turkey will no longer be subject to the rather complex and tiresome MEDA
procedures, but to those applied to the other candidates. The European Parliament
suggested that Turkey should benefit from ISPA and SAPARD. But; since at the
preparation stage of these programmes Turkey had not gained the candidate status,
Turkey was excluded from the budget of these programmes. Turkey is also eligible
for EIB pre-accession facility.
e) Participation in Community Programmes: Participation in Community
Programmes is a part of the enhanced pre-accession strategy and as a useful
preparation for accession by familiarizing the associated countries and their citizens
with the Union’s policies and working methods.
3.4.3 Pre-Accession Strategies Towards the Candidate Countries of
Fifth Enlargement:
In this part we distribute the components of pre-accession strategy, given
above, across three groups of candidates: CEECs, Cyprus and Malta, Turkey.
a) Pre-Accession Strategy Towards CEECs: The EU's pre-accession
strategy towards the candidate countries of central Europe is founded on:
1) Europe agreements
2) Accession Partnerships and National Programmes for the Adoption of the Acquis
(NPAA)
3) Pre-accession assistance, including: Phare Programme, environment and
transport investment support (ISPA Programme), agricultural and rural
development support (SAPARD Programme), cofinancing with the international
financial institutions;
4) Opening of European Community programmes and agencies.
39

b) Pre-Accession Strategy Towards Cyprus and Malta: The European
Union’s pre-accession strategy towards Cyprus and Malta is based on:
1) Association Agreements;
2) Accession Partnership and National Programmes for the Adoption of the Acquis
(NPAA);
3) Specific pre-accession assistance (given in previous part under the name
‘Financial Assistance for Cyprus and Malta’)
4) Opening of European Community programmes and agencies.
c) Pre-Accession Strategy Towards Turkey: The EU's pre-accession
strategy towards Turkey is based on:
1) Association Agreement and Customs Union Agreements
2) Enhanced political dialogue;
3) Accession Partnership and National Programme for Adoption of the Acquis
(NPAA);
4) Specific assistance under a single financial framework;
5) Participation in European Community programmes and agencies.
3.5 Conclusion
When fifth enlargement came to the agenda of EU, EU needed to change its
accession strategy. First, at Copenhagen Council 1993, EU announced new
conditions for membership. Before starting accession negotiations, a candidate
country has to fulfill political criterion of Copenhagen Criteria. Copenhagen
Criteria are hard to fulfill. When we look closely to these criteria, we can see that
EU wants its candidates to improve their democracies and economies before
accession. That is, the strategy of EU has become ‘first prepare then join’ with fifth
enlargement.
Since the criteria are hard to fulfill, EU helps the candidate countries for
preparing membership. For this purpose, EU made Commission prepare pre-
accession strategies for the candidate countries. An important point here is: pre-
accession strategies differ across three groups: CEECs, Cyprus and Malta, Turkey.
One of the component of pre-accession strategies is financial assistance (pre-
accession aid). Although, structure of pre-accession aid is different across three
groups, it exists in all pre-accession strategies. By pre-accession aid, EU helps
40

candidate countries financially. Because, while implementing acquis candidate
countries need financial help. Pre-accession aid during accession negotiations will
be our main subject in the rest of our work. Here, we just introduced it. In Chapter 2
we saw that in previous enlargements EU did not use such an instrument. However,
in the fifth enlargement it has become very important. This is mainly because of the
fact that EU demands from candidate countries has increased with Copenhagen
Criteria. Because of this, candidate countries needs have increased while preparing
for membership. And, pre-accession aid is an instrument used for helping candidate
countries financially.
41

CHAPTER 4
PRE-ACCESSION AID AND THE DISTRIBUTION CRITERIA OF IT IN
THE FIFTH ENLARGEMENT
4.1 Introduction
In Chapter 3, we presented pre-accession aid as a component of pre-
accession strategies of EU in the fifth enlargement. EU uses pre-accession aid to
help the candidate countries financially for preparation of EU membership. EU
provides pre-accession aid to each of its candidate countries. However, some
candidate countries receive more than others. This means that EU has some criteria
in distributing this aid among the candidate countries. What are these criteria? The
purpose of this chapter is to find the answer of this question.
In this chapter it is useful to divide 13 candidate countries into three groups:
the first group contains CEECs, the second group contains Cyprus and Malta,
Turkey is in the third group. Because, the pre-accession aid differs across these
three groups as we saw in Chapter 3. For CEECs, three aid programmes were
founded for this purpose: Phare, Sapard and Ispa. For Cyprus, Malta and Turkey we
cannot see such special programmes. The pre-accession aid to Cyprus and Malta is
categorised by the EU as a single flow. Up to now, Turkey has not received a
serious amount from EU as a pre-accession aid compared with other candidates
because of Turkey’s different possition among candidate countries of fifth
enlargement.
In the previous chapters, we have mentioned from fifth enlargement briefly.
All, we know is that it is different from other enlargements. Because fifth
enlargement is the largest enlargement of EU. In the first part, we look at the fifth
enlargement closely. We do this because we need to know candidate countries’
42

characteristics. Since, the criteria of EU in distributing pre-accession aid will be
from the characteristics of candidate countries. In the second part, we present the
amounts of pre-accession aid given to the candidate countries. We find the criteria
of EU in distributing pre-accession aid to CEECs in the second part. The third part
presents an inter-country comparision of pre-accession aid. In the third part we will
see that the criteria found for CEECs are valid when we include Cyprus and Malta
to the group of CEECs. EU distributes pre-accession aid according to area,
population and GDP per head of the candidate country. However, if we included
Turkey, we could not reach the same criteria. We will conclude this chapter by
giving reason of this situation: Turkey is the only candidate country which has not
started accession negotiations yet. That is, the same criteria can be applied to
Turkey when Turkey starts accession negotiations.
4.2 The Fifth (Current) Enlargement
In this part, we try to present the fifth enlargement with its candidate
countries, history and its differences from other enlargements. First, we present the
candidate countries of fifth enlargement with their population, area and GDP per
capita. Second, we give a short history of this enlargement. How did this
enlargement start? It is a big enlargement. However, there are some other important
characteristics of this enlargement. These will be given in the third section of this
part.
4.2.1 Acceding Countries
The fifth enlargement includes 13 candidate countries which are Poland,
Romania, Bulgaria, Hungary, Czech Republic, Lithuania, Latvia, Slovakia, Estonia,
Slovenia, Cyprus, Malta and Turkey. Candidate countries (including Turkey)
represent 45% of the EU population and 7% of GDP. It can be observed that Turkey
is the largest candidate country in terms of population and area (17% of the EU-15
population and 24% of the EU-15 area). The second largest candidate country after
Turkey is Poland, with 313000 km2 area and 38.6 million population. Poland is
followed by Romania in terms of area and population. Malta and Cyprus have the
smallest populations and areas among the candidates. GDP per capita in purchasing
power standards is highest in Cyprus with 80% of EU-15, and lowest in Turkey
43

with 22% of the EU-15 in 2001. Table 4.1 presents these results by giving the
candidate countries area, population and GDP per capita in 2001.
Table 4.1 Candidate countries in 2001
Area
(1000 km2)
Population
(million)
GDP per
capita
% of EU
Turkey 775.0 68.6 22.0
Poland 313.0 38.6 40.0 Romania 238.0 22.4 25.0 Bulgaria 111.0 7.9 28.0 Hungary 93.0 10.2 51.0 Czech Rep. 79.0 10.2 57.0 Lithuania 65.0 3.5 38.0 Latvia 65.0 2.4 33.0 Slovakia 49.0 5.4 48.0 Estonia 45.0 1.4 42.0 Slovenia 20.0 2.0 69.0 Cyprus 9.0 0.8 80.0 Malta 0.3 0.4 55.0
Source: Regular Reports on Candidate Countries Progress 2002
4.2.2 A History of Fifth Enlargement
A decade ago, following the transformation of their political systems and the
start of extensive restructuring of their economies, the countries of Central and
Eastern Europe and Baltics began the process of political and economic integration
towards the EU. They manifested their desire to join the EU and reorient their
economies towards the West.
The EU welcomed and supported the changes. Europe Agreements were
signed between EU and these countries. Europe Agreements (in Chapter 3 we saw
44

the Europe Agrements as one of the component of pre-accession strategy) provided
the institutional framework for further integration in terms of trade. Also, the Phare
was founded to support these countries financially in those days.
After the Copenhagen European Council, CEEC-10 submitted their
applications to EU. Cyprus, Malta and Turkey had applied for membership before
these countries did6. Before starting accession negotiations EU prepared pre-
accession strategies, mentioned in Chapter 3, for these countries. The accession
negotiations were started with Poland, Hungary, Czech Republic, Slovenia, Estonia
and Cyprus in March 1998. Turkey is the only candidate country which has not
started accession negotiations yet.
The accession negotiations started in 1998 with 6 countries and then
expanded to 12 countries has come to the last stage. Poland, the Czech Republic,
Hungary, Slovenia, Latvia, Lithuania, Estonia, Slovakia, Cyprus and Malta are
expected to join the Union in 2004. Romania and Bulgaria are expected to join the
Union in 2007.
4.2.3 Is the Fifth Enlargement Really a Big Challenge of EU?
Although the European Union (EU) has absorbed a number of countries
since its creation, growing from the original six to the current fifteen member states,
the current enlargement to include the Central and Eastern European Countries
(CEECs) presents the greatest challenge yet for three reasons. First, it is the largest
ever enlargement. Ten CEECs are currently candidates for accession with a total
population of more than 100 million people. Second, in none of the previous
enlargements the candidate countries differed so much from the incumbent member
states. Thus, the candidate countries have a considerably lower level of
development, relatively large agricultural sectors and, until a decade ago, CEECs
had a completely different political system. Apart from the Czech Republic and
Slovakia, not a single transition country had a fully functioning market economy
before they became centrally planned countries. Third, in none of them previous
enlargements the EU was at such an advance stage of economic integration. In the
last ten years the Single Market has been implemented and the euro has been
created with eleven of its member states already belonging to its zone.
6 Turkey applied for EU membership in 1987, Cyprus and Malta applied in 1990 (İKV, 2002)
45

However, there are also positive sides of this enlargement. Zanias (the
article is in press) says that despite the problems of this enlargement, the political
will is for these countries to enter the EU because in this way they will be assisted
in their development process, some economic benefits will accrue to the EU also
but, most important of all, the eastern enlargement of the EU will secure against the
return to the Cold War era.
4.3 EU’s Financial Assistance to Its Candidate Countries
In this part, we see the allocation of pre-accession aid among candidate
countries. We will start with allocations made to CEECs, then we will look at
allocations to Cyprus and Malta, lastly the allocations made to Turkey will be
given.
4.3.1 Financial Assistance for Central and Eastern European Countries
As said before, there are three aid programmes for CEECs, which are Phare,
Sapard and Ispa. The receipts of CEECs from these three programmes are given
seperately in this section.
a) The Phare Programme
Phare allocations during 1992-2002 totally amounted to 11361.6 million
euro. 4132.3 million euro of this amount is distributed between 2000 and 2002.
Because, in 2000 all CEECs had started accession negotiations. So, their receipts
increased. Table 4.2 presents the Phare allocations to candidate countries according
to area, population and GDP per head of the candidate countries.
Table 4.2 Total Phare Allocations During 1992-2002
Country
Total Al.
during 1992-02
%of Total Al.
in 1992-02
Population
(million)
Area
1000 km2
GDP per
Capita
Poland 3450.0 30.4% 38.6 313.0 9200.0
Romania 2025.5 17.8% 22.4 238.0 5900.0
Bulgaria 1467.7 13.0% 7.9 111.0 6500.0
Hungary 1389.3 12.2% 10.2 93.0 11900.0
46

Table 4.2 (cont.)
Czech 854.9 7.5% 10.2 79.0 13300.0
Lithuania 584.7 5.1% 3.5 65.0 8700.0
Slovakia 572.4 5.0% 5.4 49.0 11100.0
Latvia 426.0 3.7% 2.4 65.0 7700.0
Slovenia 295.6 2.6% 2.0 20.0 16000.0
Estonia 286.2 2.5% 1.4 45.0 9800.0
Total
CEECs 11361.6 100% 104.0 1078.0
Source: Regular Reports on Candidate Countries Progress 1998-2002
We can observe from Table 4.2 that Poland is the largest beneficiary of
Phare during 1992-2002 with a 30.4% of total Phare allocations. Romania is the
second largest beneficiary with 17.8% of total Phare allocations during 1992-2002.
Estonia and Slovenia could only receive around 2%.
The largest beneficiary of Phare, Poland, is also the largest candidate
country of the Central and Eastern European Countries in terms of population and
area. And, Estonia and Slovenia, received the least portion of total Phare
allocations, are the smallest countries of CEECs in terms of population and area.
Also, Romania, second largest beneficiary of Phare, is the second largest country of
CEEC in terms of population and area. Besides these countries if we look at other
countries` receipts, we can say that area and population are important factors in
deciding Phare allocations.
By looking at Table 4.2, we can say that Phare allocations also depends on
GDP per capita. For example, although, Bulgaria’s population is less than
Hungary’s, Bulgaria received more than Hungary, this may because of the less GDP
per capita of Bulgaria or larger area of Bulgaria. Nevertheless, if Country A’s
population and area is larger than the population and area of Country B then:
whatever the GDP per capita, Country A will receive the larger part of Phare
allocations. Therefore, we can conclude that, multi-annual indicative national
47

allocations of Phare are set by the Commission, based primarily on population,
area, GDP per head7.
b) Special Accession Programme for Agricultural and Rural
Development (SAPARD)
Sapard allocations are expected to be a bit different from the Phare
allocations (and also we will see that it is different from ISPA allocations). Because,
as said in Chapter 3, Sapard helps solve the priorities and specific problems in
agriculture and rural development. So, the allocations of Sapard are expected to
depend on some agricultural datas.
Table 4.3 presents the Sapard allocations according to farming population
and agricultural area of the candidate countries. As it can be seen from Table 4.3
below, in 2000-2006 period, Sapard is providing nearly 4 billion to the Central and
Eastern European Countries. Poland and Romania receive the lion share of the
allocations, 2.3 billion euro in total. The country with the smallest allocation for this
7-year period is Slovenia with 46.1 million euro.
Table 4.3 Total Sapard Allocations 2000-2006
Country
Maximum Sapard
contribution
2000-2006
(M EUR)
Agricultural
Area
(000 ha)
Share of
Employment
In
(million)
GDP per
capita
(euro)
Poland 1226.2 18397.0 7.4 9200.0
Romania 1095.0 14874.0 9.9 5900.0
Bulgaria 378.9 5498.0 2.1 6500.0
Hungary 276.6 5853.0 0.6 11900.0
Lithuania 216.8 3489.0 0.6 8700.0
Czech Rep. 160.4 4282.0 0.5 13300.0
7 In the Council Regulation no 1266/1999 no such criteria are given, only stated that allocation of aid should be based on the principle of equal treatment, independently of the time of accession, with particular attention being paid to countries with the greatest need (Official Journal of the European Communities L 161, 26.6.1999, p.68)
48
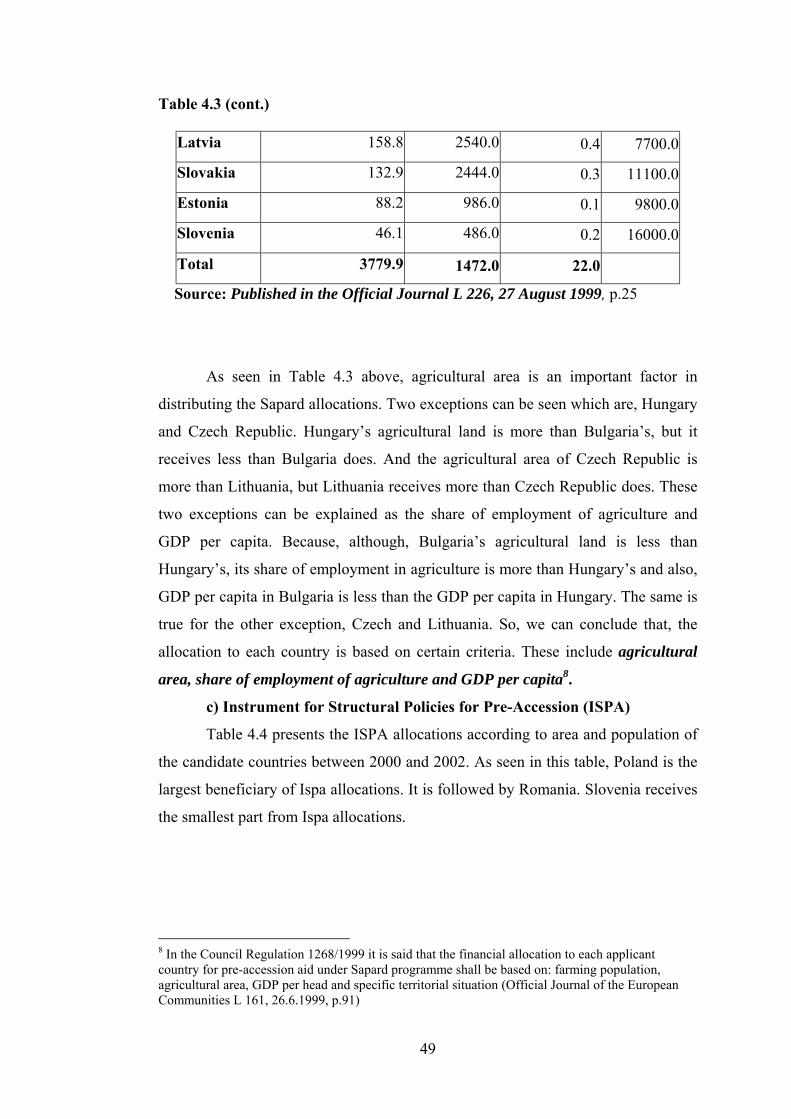
Table 4.3 (cont.)
Latvia 158.8 2540.0 0.4 7700.0
Slovakia 132.9 2444.0 0.3 11100.0
Estonia 88.2 986.0 0.1 9800.0
Slovenia 46.1 486.0 0.2 16000.0
Total 3779.9 1472.0 22.0
Source: Published in the Official Journal L 226, 27 August 1999, p.25
As seen in Table 4.3 above, agricultural area is an important factor in
distributing the Sapard allocations. Two exceptions can be seen which are, Hungary
and Czech Republic. Hungary’s agricultural land is more than Bulgaria’s, but it
receives less than Bulgaria does. And the agricultural area of Czech Republic is
more than Lithuania, but Lithuania receives more than Czech Republic does. These
two exceptions can be explained as the share of employment of agriculture and
GDP per capita. Because, although, Bulgaria’s agricultural land is less than
Hungary’s, its share of employment in agriculture is more than Hungary’s and also,
GDP per capita in Bulgaria is less than the GDP per capita in Hungary. The same is
true for the other exception, Czech and Lithuania. So, we can conclude that, the
allocation to each country is based on certain criteria. These include agricultural
area, share of employment of agriculture and GDP per capita8.
c) Instrument for Structural Policies for Pre-Accession (ISPA)
Table 4.4 presents the ISPA allocations according to area and population of
the candidate countries between 2000 and 2002. As seen in this table, Poland is the
largest beneficiary of Ispa allocations. It is followed by Romania. Slovenia receives
the smallest part from Ispa allocations.
8 In the Council Regulation 1268/1999 it is said that the financial allocation to each applicant country for pre-accession aid under Sapard programme shall be based on: farming population, agricultural area, GDP per head and specific territorial situation (Official Journal of the European Communities L 161, 26.6.1999, p.91)
49

Table 4.4 ISPA Allocations Between 2000-2002
Country
2000-2002
Total (M EUR)
Population
(million)
Area
1000 km2
GDP per capita
in PPS (euro)
Poland 1070.6 38.6 313.0 9200.0
Romania 702.6 – 768.0 22.4 238.0 5900.0
Bulgaria 297.9 - 341.5 7.9 111.0 6500.0
Hungary 272.7 10.2 93.0 11900.0
Czech 199.8 – 227.0 10.2 79.0 13300.0
Lithuania 146.7 - 167.7 3.5 65.0 8700.0
Slovakia 129.1 - 150.9 5.4 49.0 11100.0
Latvia 132.9 - 154.7 2.4 65.0 7700.0
Estonia 79.3 - 95.2 1.4 45.0 16000.0
Slovenia 46.5 - 57.4 2.0 20.0 9800.0
TOTAL 3078.1 - 3305.7 104.0 1078.0
Source: Regular Reports on Candidate Countries Progress 2000-2002
From Table 4.4, it can be observed that area and population are the most
important factors in allocation of Ispa. In fact, if a country’s area is higher then its
receipts from Ispa allocations will be higher. Poland, the largest beneficiary of Ispa
allocations, is the largest country among these candidate countries. Slovenia,
smallest country in terms of area, receives the smallest share from Ispa allocations.
We can conclude from Table 4.4 that, higher shares go to the countries with higher
areas. From Table 4.4, it can be observed that Lithuania and Latvia have the same
areas but Lithuania receives more than Latvia does. This may be because of the
population of Lithuania, which is more than Latvia’s population. So, we can say
that, allocation of Ispa resources among the recipient countries is decided on the
basis of area and population9.
9 In the Council Regulation 1267/1999 it is said that an indicative allocation between beneficiary countries of the total Community assistance under ISPA shall be made on the basis of criteria of population, area and per capita GDP (Official Journal of the European Communities L 161, 26.6.1999, p.75)
50

4.3.2 Financial Assistance for Cyprus and Malta
Until 2000, Financial Protocols signed between these countries and the EU was the
sole financial instrument. These financial transfers were not made for preparation of
accession to EU. As said in Chapter 3, in 1999 Commission proposed a pre-
accession regulation for Cyprus and Malta. The new Financial Regulation on the
implementation of the pre-accession strategy for Cyprus and Malta will ensure, like
for all candidate countries of CEEC, that assistance is targeted towards pre-
accession priorities. Table 4.5 presents the pre-accession assistance for Cyprus and
Malta after 2000.
Table 4.5 Pre-Accession Assistance for Cyprus and Malta ( M EUR)
Cyprus Malta
Pre-Accession Assistance
planned for 2000-2004
57.0
38.0
Given Pre-Accession
Assistance in 2000-2002
32.0
23.0
Area (1000km2) 9.0 0.3
Population (million) 0.8 0.4
Source: Regular Reports 2001 and 2002 for Cyprus and Malta
As seen in Table 4.5, between 2000 and 2002, Cyprus received 32 million
euro and Malta 23 million euro. The total amount Cyprus will receive up to 2004 is
57 million euro and this amount is 38 million euro for Malta. The same criteria can
be seen in distributing pre-accession aid between Cyprus and Malta. Area and
population are the important factors for distribution of aid. These amounts can be
seen as small. However, these countries are also the smallest countries of all
candidate countries. And, they are more developed than all other candidate
countries.
51

4.3.3 Financial Assistance for Turkey
As said in Chapter 3, up to Helsinki European Council the financial transfers
given to Turkey were not for accession. But, after Helsinki 1999, where Turkey’s
application for EU membership was accepted, a single framework for coordinating
all sources of pre-accession financial assistance for Turkey was adopted by the
Commission. In this new period, some financial transfers have been made under the
name of Accession Strategy. Also, Turkey continues to benefit from MEDA
programme. Table 4.6 presents a summary of financial transfers to Turkey between
1964 and 2001.
Table 4.6 Financial Transfers to Turkey (MEUR)
Total payments
1964-1995
1005.0
Total Payments
1996-1999
755.3
MEDA II (Planned)
2000-2006
889.0
Accession Strategy
Total 2000-2001
60.0
Source: Regular Reports of Turkey 2000-2002
As seen in Table 4.6 above, before Customs Union period, 1964-1995, total
payments of EU to Turkey amounted to 1005 million euro. In the framework of
Customs Union, 1996-1999, total payments were 755.3 million euro. These
financial transfers were made mainly through MEDA Programme and EIB credits.
Under the Accession Strategy Turkey received totally 60 million euro in 2000 and
2001.
MEDA programme is for Mediterranean countries, that is, it is not a
programme for pre-accession preparations of a candidate country. From this
programme, many Mediterranean countries, which are not candidate countries of
52

EU, benefit. The aid given to Turkey for its preparation for membership is only 60
million euro for two years.
4.4 Inter-Country Comparison
In this part, we compare all candidate countries’ receipts from EU. For
CEEC, the summation of receipts from three aid programmes is presented in the
Table 4.7. We can see both pre-2000 and post-2000 periods’ transfers in this table.
Table 4.7 EU Financial Aid to Candidate Countries for pre-2000 and post-2000
period (M EUR)
Country
Total aid
1990-1999
Total aid
2000-2002
Population
(million)
Area
1000 km2
GDP per
capita euro
Poland 2050.0 2997.6 38.6 313.0 9200.0
Romania 1200.0 2030.8 22.4 238.0 5900.0
Bulgaria 1000.0 959.0 7.9 111.0 6500.0
Hungary 1030.0 750.6 10.2 93.0 11900.0
Czech 563.0 574.2 10.2 79.0 13300.0
Lithuania 328.0 507.2 3.5 65.0 8700.0
Slovakia 356.0 413.6 5.4 49.0 11100.0
Latvia 320.0 331.3 2.4 65.0 7700.0
Estonia 190.0 221.4 1.4 45.0 9800.0
Slovenia 192.0 175.3 2.0 20.0 16000.0
Cyprus 42.5 32.0 0.8 9.0 18500.0
Malta 27.5 23.0 0.4 0.3 11700.0
Turkey 209.4 552.0 68.6 775.0 5200.0
TOTAL 7508.4 9016.0 105.2 1087.3
Source: Regular Reports on candidate countries progress
53

In the pre-2000 period, Poland is the largest beneficiary of total financial
transfers, it is followed by Romania with 16% of total aids. Cyprus and Malta are
the smallest beneficiaries.
It can be observed from Table 4.7 that financial transfers increase after
2000. Between 2000 and 2002 total financial transfers exceed the financial transfers
made between 1990-1999. This is mainly because of the new regulations made in
1999 for all candidate countries. Because of this reason, financial transfers have
increased especially after 1999. As mentioned above, before 2000, CEECs
benefited from only Phare programme, but two supplementary programmes set up
for these countries, Sapard and Ispa. CEECs have also benefited from these
programmes, with Phare, since 2000. Also, in 2000 all candidate countries except
Turkey had started accession negotiations. Hence, since their needs have increased,
transfers from EU to these countries also increased.
Cyprus and Malta are the smallest beneficiaries of financial transfers in the
post-2000 period also. But their receipts have increased, as in all candidates, after
2000. Turkey’s receipts have also increased after 2000 as seen. Because as said
above, some extra financial transfers have been made through Accession Strategy
since 2000.
If we look at Table 4.7, exclude Turkey, we can see that the higher the area
and population of a country higher the receipts of that country. In fact area is more
important factor in deciding the allocation of financial transfers (except the case
Slovakia and Latvia). Poland, the largest candidate country after Turkey, has
received the largest part of the financial transfers. Cyprus and Malta are the smallest
beneficiaries of financial transfers as seen in Table 4.7. Because, they are the
smallest countries in terms of area and population. Also, their GDP per capita is
higher than some other candidates who receive more than these two countries.
However, if we include Turkey in our discussion, we cannot conclude that ‘higher
the area and population of a country, higher the receipts of that country’. Because,
Turkey is the largest candidate country in terms of area and population, but it
received only 8.04 euro for per person and 0.2% of its GDP. Also, Turkey has the
smallest GDP per capita among all candidate countries.
This situation is mainly the result of the fact that all candidate countries
started accession negotiations except Turkey. So, if we make two groups among
candidate countries which are: countries which started negotiations and countries
54
which have not started yet accession negotiations Turkey will be in the second
group and all other candidates will be in the first group. And, for the first group, we
can still conclude that higher the area and population of a country higher the
receipts of that country from financial transfers.
4.5 Conclusion
Between 2000 and 2002, EU distributed nearly 9 billion euro to its 13
candidate countries. Pre-accession aid differs across three groups of candidates:
CEECs, Malta and Cyprus, Turkey. Pre-accession aid to CEECs is very systematic.
Three aid programmes were founded for this purpose. The areas of these three
programes are different from each other. However, we cannot see such a systematic
organization for Cyprus, Malta and Turkey. Pre-accession aid to Cyprus and Malta
is categorised by the EU as a single flow. There have been some amounts of aid for
Turkey. Turkey has benefited from MEDA Programme. However, this programme
is not for preparation of membership for EU. After Helsinki, Turkey started to
benefit from an extra amount of aid named as accession strategy. However, in two
years Turkey could receive only 60 million euro from this.
When we look at the distribution of pre-accession aid among CEECs, EU
takes into account area, population and GDP per head. Also, if we include Cyprus
and Malta to the group of CEECs, we can also reach the same conclusion. Cyprus
and Malta has received less than all other CEECs, however, they are also smaller
than all CEECs in terms of area and population. But, if included Turkey we could
not reach the same conclusion. When the post-2000 period is considered the
financial aid to Turkey can only be ranked in the 6th position, although it is the
largest candidate country.
All candidate countries except Turkey started accession negotiations. During
accession negotiations, candidate country needs more financial help to enforce and
implement the acquis in force. Hence, since Turkey has not started yet accession
negotiations Turkey has not been given pre-accession aid according to the criteria
which are applied to other candidates. However, sooner or later Turkey will start
accession negotiations. When it starts accession negotiations, it will receive more
than what it has received up to that date. In Chapter 5, we will calculate the amount
55

of pre-accession aid which should be given to Turkey when it starts accession
negotiations.
56

CHAPTER 5
CALCULATION OF PRE-ACCESSION AID FOR TURKEY
5.1 Introduction
In the previous chapter, we saw that EU distributes pre-accession aid
according to area, population and GDP per head of the candidate countries. But,
these criteria are valid for candidate countries which started accession negotiations.
That is, these criteria are not valid for Turkey. Turkey wants to start accession
negotiations immediately. According to Regular Report for Turkey (2002), Turkey
has not fulfilled any of the Copenhagen Criteria10. Turkey’s economic situation
according to Copenhagen Criteria is given in Appendix A. Despite this situation if
we assume Turkey will start accession negotiations then what will be the amount of
pre-accession aid given to Turkey? The purpose of this chapter is to calculate the
amount of pre-accession aid for Turkey during its accession negotiations.
Since EU started to give more importance to pre-accession aid in the fifth
enlargement, we make expectations of Turkey’s pre-accession aid by taking fifth
enlargement as model to us. In fact, we consider one of the candidate countries in
the fifth enlargement. We take into account this country’s receipts from pre-
accession aids. This country will be Poland, the most similar candidate country to
Turkey in the fifth enlargement.
We will proceed in the following way. First, by taking the receipts of Poland
from Phare, Sapard and Ispa, we will find four parameters. Since EU distributes
these aids according to area, population, agricultural area and agricultural
population these parameters will be: aid per capita, aid per agricultural employment,
aid per km2 of total area and aid per km2 of total agricultural area. Per capita and per
10 Turkey has made many reforms to fulfill Copenhagen Criteria since 2002 fall.
57

km2 aids are found from Phare ans Ispa allocations, aid per agricultural population
and per km2 of agricultural area are found from Sapard allocations to Poland. These
four will be called ‘original parameters’. Second, in order to measure how
applicable these parameters are, we will apply these parameters to other Central and
Eastern European candidate countries. The application will be done by multiplying
these parameters by the suitable datas of the countries. By multiplying per capita aid
and per km2 aid by population and area of the country respectively, we get total
allocations from Phare and Ispa to this country. By multiplying aid per agricultural
population and aid per km2 of total agricultural area by agricultural population and
agricultural area of that country respectively, we get total allocations for agriculture
(Sapard). At the end, we will get an upper and a lower bound for the pre-accession
aid. Lower bound is found by approaching from population, upper bound is found
from approaching area. When we apply these parameters to other CEECs by this
way, we get three exception. That is, three countries’ reciepts do not lie between
lower and upper bound we calculated. In order to eliminate these exceptions, we
will widen the interval. Third, we will apply these parameters to Turkey by the
same way. Hence, we will find an interval for pre-accession aid of Turkey.
In the second part of the chapter, we will look Poland more closely. In the
third part, we will calculate the parameters and apply these to CEECs. In the fourth
part, by applying these parameters to Turkey, we will get Turkey’s expected pre-
accession financial transfers.
5.2 Poland
Poland is one of the candidate countries of EU in the fifth enlargement. We
claim that Poland is the most similar candidate country to Turkey, with its size of
population, area and the agricutural share in gross value added. Because of this
similarities, we will make expectations for Turkey’s financial transfers by taking
into account Poland’s receipts from pre-accession funds. Before looking at Poland’s
receipts from pre-accession funds, in this part we will present Poland. Why do we
choose Poland? First we will answer this question then we try to introduce Poland.
58
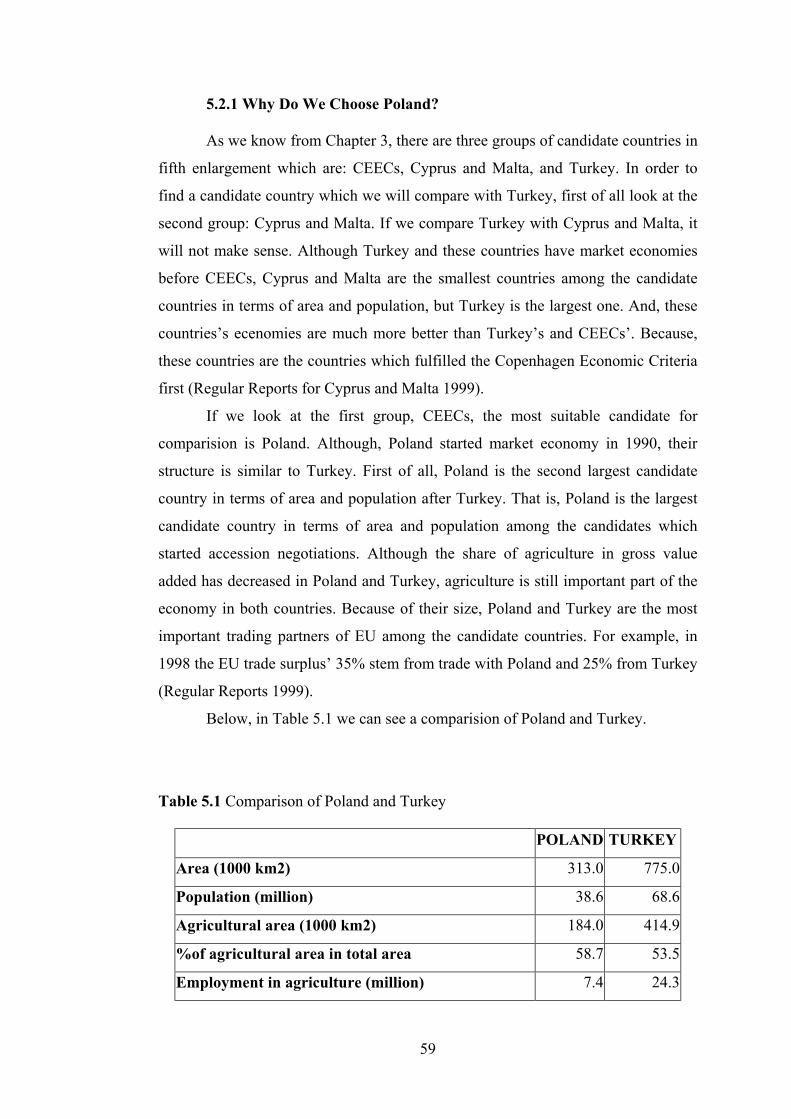
5.2.1 Why Do We Choose Poland?
As we know from Chapter 3, there are three groups of candidate countries in
fifth enlargement which are: CEECs, Cyprus and Malta, and Turkey. In order to
find a candidate country which we will compare with Turkey, first of all look at the
second group: Cyprus and Malta. If we compare Turkey with Cyprus and Malta, it
will not make sense. Although Turkey and these countries have market economies
before CEECs, Cyprus and Malta are the smallest countries among the candidate
countries in terms of area and population, but Turkey is the largest one. And, these
countries’s ecenomies are much more better than Turkey’s and CEECs’. Because,
these countries are the countries which fulfilled the Copenhagen Economic Criteria
first (Regular Reports for Cyprus and Malta 1999).
If we look at the first group, CEECs, the most suitable candidate for
comparision is Poland. Although, Poland started market economy in 1990, their
structure is similar to Turkey. First of all, Poland is the second largest candidate
country in terms of area and population after Turkey. That is, Poland is the largest
candidate country in terms of area and population among the candidates which
started accession negotiations. Although the share of agriculture in gross value
added has decreased in Poland and Turkey, agriculture is still important part of the
economy in both countries. Because of their size, Poland and Turkey are the most
important trading partners of EU among the candidate countries. For example, in
1998 the EU trade surplus’ 35% stem from trade with Poland and 25% from Turkey
(Regular Reports 1999).
Below, in Table 5.1 we can see a comparision of Poland and Turkey.
Table 5.1 Comparison of Poland and Turkey
POLAND TURKEY
Area (1000 km2) 313.0 775.0
Population (million) 38.6 68.6
Agricultural area (1000 km2) 184.0 414.9
%of agricultural area in total area 58.7 53.5
Employment in agriculture (million) 7.4 24.3
59

Table 5.1 (cont.)
% of employment in agriculture to total population 19.1 35.4
GDP per capita at current prices (PPS) in 2001 9200.0 5200.0
Source: Regular Reports for Turkey and Poland and EUROSTAT
5.2.2 Relations Between EU and Poland
We said in the first section of this part that Poland is the most similar
candidate country to Turkey. Before looking at pre-accession aids of Poland, we
will introduce Poland. In this section we try to give the relations between Poland
and EU. In the next section we will give the socia-economic development in Poland
since 1997 when Poland became a candidate country of EU.
Poland applied EU for membership in 1994 and its application was accepted
in 1997. It started to accession negotiations in 1998 and accession negotiations
come to end at the end of 2002. Commission (1997) concluded that Poland fullfilled
the political criteria and can be regarded as a functioning market economy. In
2000’s Regular Report for Poland, it was said that Poland is a functioning market
economy. And in 2002 Regular Report, it was stated that Poland’s continuation of
its current reform path and progress in macroeconomic stabilization should enable it
to cope with competitive pressure and market forces within the Union. It is expected
that Poland will join the Union in 2004 with other 9 candidate countries.
5.2.3 A general Idea About Poland’s Socia-Economic Development
Poland’s population is 38 641 thousand and area is 313 000 km2. About
60% of the country’s land is used for agriculture. About a fifth of Poles are
employed in agriculture. This contributes to less than 5% of GDP.
From Regular Reports (1999, 2000, 2001) for Poland, we can say the
following things for Poland. In the process of restructuring and economic
development services, industrial and construction have gained importance, while
the share of agriculture in GDP is declining. Its proportion is reduced from 5.5% in
1997 to 3.4 % in 2000, i.e. not very far from the EU-15 average, around 2.0 % in
2000. The productivity gap between agriculture and other sectors of the economy
60

has therefore further widened since 1997. Between 1997 and 2001, gross value
added in agriculture fell by 9%. In contrast, manufacturing rose in the same period
by around 14% and private services by more than 21%. The share of services in
value added has increased by about 6.5 percentage points since 1997. Nevertheless,
there has been less of a shift from industry to services then might have been
expected from initial conditions. Also, according to the Labor Force Survey in
Poland, there is a decline in the share of employment in agriculture and forestry,
from 20.5% in 1997 to 18.7% in 2001. All these are summarized in Table 5.2
below.
Table 5.2 Poland 1997 1998 1999 2000 2001
Population (in 1000) 38650.0 38666.0 38654.0 38646.0 38641.0
Area (in km2) 312685.0 312685.0 312685.0 312685.0 312685.0
Real GDP growth rate (per cent) 6.8 4.8 4.1 4.0 1.1
Inflation Rate (annual average) % 15.0 11.8 7.2 10.1 5.3
Structure of Production % of
gross value added
-Agriculture 5.5 4.8 4.0 3.7 3.4
-Industry 29.3 27.6 27.1 26.5 25.4
-Construction 7.9 8.7 8.8 8.4 7.5
-Services 57.2 59.0 60.1 61.4 63.8
Public Finance (% of GDP)
-General government deficit -4.3 -2.3 -1.5 -1.8
-General government debt 46.9 41.6 42.7 38.7
Unemployment Rate % 11.0 9.9 12.3 16.3 18.4
Average Employment
(in % of total)
-Agriculture 20.5 19.1 18.1 18.7
-Industry(excluding
construction) 25.3 25.0 24.4 23.6 24.0
61

Table 5.2 (cont.) -Services 47.6 48.9 50.6 50.3 50.1
Source: Regular Report 2002 for Poland
Poland has switched its exchange rate regime from a crawling peg
prevailing until 2000 to a regime of free float since then. In Poland, the highest
growth rate was 6.8%, recorded in 1997. The downturn starting in the second half
of 2000 led to a weak growth rate of just 1.1% in 2001. This was largely the result
of a poorly co-ordinated policy-mix combined with the deteriorating external
environment and domestic political uncertainty. And, one of the determining factors
behind Poland’s high growth since 1997 – and the slowdown since the second half
of 2000 – has been private investment. Over the 1997-2000 period, domestic
demand has systematically outpaced overall GDP growth. The deceleration of
output has been due to a sharp contraction of investment in 2001. In 2001, for the
first time, output growth was driven by net exports. Prior to the recent, domestically
induced, slowdown the Polish economy had demonstrated a high degree of
resilience to external shocks in the face of the Russian crisis in 1998. The loss of
export markets in the former Soviet Union amounted to some 3 percentage points of
GDP, but triggered a new round of enterprise restructuring that helped to moderate
the decline in profitability and allowed a rapid resumption of export growth.
Productivity increases, however, translated into higher unemployment, a
moderation of household incomes and ultimately lower short-term growth,
exacerbated from mid-2000 by excessively tight macroeconomic policies.
One field of socia-economic interest obviously is the problem of
unemployment. As seen in Table, unemployment rate became 18.4% in 2001. This
was mainly the result of economic restructuring together with the fall in growth due
to external crises.
Annual average inflation reached a new low of 5.3% in 2001, resuming a
rapid process of inflation reduction that had been interrupted in 1999-2000, in a
context combining unexpected supply shocks and an strong easing of policy rates
by the central bank after the Russian crisis. The general government deficit has
averaged 2.8% of GDP over the period since the Commission Opinion (1997), but
62
has widened significantly in 2001, primarily due to a combination of rapid rise in
expenditure and the slowdown in growth and fall in inflation and their combined
impact on revenues. With the downturn, high unemployment and inactivity have
become the main imbalances in the Polish economy.
Government debt had been falling significantly from around 47% of GDP in
1997 to 38.7% at the end of 2000. That trend was reversed in 2001, with the debt
ratio reaching 39.3% at the end of last year. Annual interest charges are rising in
parallel with debt, and now represent some 3% of GDP. In Poland, private sector
firms now produce over 70% of GDP.
As seen, Poland is still undergoing the consequences of Russian crisis in
1998 and restructuring of its economy. In Poland’s 2002 Regular Report it is said
that prior to the 2001 downturn, Poland was slowly, but steadily catching up with
the EU in terms of income. As indicated above, high unemployment and low
growth rates after the 1998 are explained by the crisis and restructuring.
5.3 Derivation and Application of Original Parameters
Since, the distribution criteria for pre-accession aids are: area, population,
agricultural area and agricultural population, we will start to find aid per total
population, aid per agricultural population, aid per km2 of total area and aid per km2
of total agricultural area for Poland in this part11. These four things will be called
from so on as ‘original parameters’. First, we will derive these parameters from
Poland’s receipts from Phare, Sapard and Ispa during its accession negotiations
period. Second, we will apply these parameters to other Central and Eastern
European candidate countries. By this, we can decide whether or not these
parameters are applicable to other candidate countries. Do these parameters need
any correction?
5.3.1 Derivation of Original Parameters
In this section, we derive the original parameters from Poland’s pre-
accession financial transfers. From Phare and Ispa allocations of Poland we will
11 In Chapter 4 we saw that distribution of pre-accession aid depends also on GDP per head in candidate country. Lower the GDP per head higher the receipts from pre-accession aid. Since, Turkey has the lowest GDP per head among all candidate countries it satisfies this condition automatically. Because of this reason we do not take into account GDP per head.
63

derive aid per capita and aid per km2 of total area. Because, Phare and Ispa
allocations are made according to area, population and GDP per head. For
agricultural original parameters, aid per capita of total agricultural population and
aid per km2 of total agricultural area, we will use Poland’s Sapard allocations.
Because, Sapard allocations are made according to agricultural area, share of
employment in agriculture, and GDP per capita. First we will derive aid per capita
and aid per km2 of total area by using Phare and Ispa allocations to Poland. Second,
we will derive agricultural original parameters from Sapard allocations to Poland.
5.3.1.1 Derivation of First Two Original Parameters
The first two original parameters are: aid per capita of total population and
aid per km2 of total area. These can be found from Phare and Ispa allocations to
Poland. First we will consider Phare receipts of Poland then Ispa receipts of it.
Poland started accession negotiations in 1998. And, from 1998 to 2002,
Poland received 1837.5 million euro from Phare allocations (From Chapter 4 and
Regular Reports for Poland, 1999, 2000, 2001 and 2002). And, in Chapter 4 we
concluded that Phare allocations mainly depend on population, area and GDP per
capita. If a country has a larger area and population than some other country then it
will receive more. We can easily say that if Turkey can benefit from a programme
like Phare when it starts accession negotiations, it may receive more than Poland
received in a same length of a period, because Turkey is larger than Poland in terms
of area and population and its GDP per capita is less than Poland. Below in case 1,
we will find Phare allocations to Poland in terms of per capita of total population in
one year and in case 2, we will find Phare allocations to Poland in terms of per km2
of total area in one year. First of all, we should find annual average of total Phare
allocations to Poland, which means that we should divide total allocations during its
accession negotiations (1998-2002) to five: 1837.5/5=367.5 M EUR. 367.5 M EUR
is the annual average Phare allocation to Poland.
Case1: Poland’s population is 38.6 million (Table 5.1). If we think in terms of per
capita aid, then Poland has received 367.5/38.6=9.52 euro per person in one year.
Case2: Poland’s total area is 313 000 km2. So, if we think in per km2 aid, the
Poland has received 367.5/313=1174.1 euro per km2 annualy.
64

Total indicative ISPA allocation to Poland during 2000-2006 is 2439.5 M
EUR. As concluded in Chapter 4, Ispa allocations depend on area and population.
Higher the area and population of a country mean higher the receipts from Ispa
allocations. And, as we know Turkey is larger than Poland in terms of area and
population. This means that if Turkey can benefit such a programme, when it starts
accession negotiations, then it will receive more than Poland’s receipts in a same
length of period. Below in case 1, we will find the Ispa allocations to Poland in
terms of per capita of total population in one year and in case 2, we will find the
Ispa allocations in terms of per km2 of total area in one year. The annual average of
total Ispa allocations to Poland is: 2439.5/7=348.5 M EUR.
Case1: We will think in terms of per capita of population. So, in terms of per capita
of population, Poland has received 348.5/38.6=9.02 euro per capita of total
population per year.
Case2: We will think in terms of per km2 of total land, so Poland has received
348500/313=1113.4 euro per km2 per year.
Hence, Poland’s per capita of total population receives 9.52 euro from
Phare, 9.02 euro from Ispa allocations. Or, Poland’s per km2 of total area receives
1174.1 euro from Phare, 1113.4 from Ispa allocations. If we think in terms of
population, Poland receives 18.54 euro for one person totally from Phare and Ispa
allocations. If we think in terms of area, Poland receives 2287.53 euro per km2 area
totally from Phare and Ispa allocations.
5.3.1.2 Derivation of Other Original Parameters
The remaining original parameters are: aid per capita of total farming
population and aid per km2 of total agricultural area. Here, we derive these original
parameters by using Poland’s receipts from Sapard allocations. Indicative Sapard
allocation to Poland is 1226.2 million euro for a 7-year period (from Chapter 4). In
Chapter 4, we concluded that Sapard allocations mainly depend on agricultural
area, share of employment of agriculture and GDP per capita. Higher the
agricultural area and higher the share of employment of agriculture mean higher the
share of Sapard allocations which will be made. Turkey’s agricultural area and
share of employment of agriculture is much more than those of Poland. This means
that if Turkey can benefit such a programme when it starts accession negotiations,
65

then it will receive more than Poland in a same length of period. Below in case 1,
we will find Sapard allocations to Poland in terms of per capita of farming
population in one year and in case 2, we will find Sapard allocations to Poland in
terms of per km2 of agricultural area in one year. The annual average of total Sapard
allocations to Poland is 1226.2/7=175.2 M EUR.
Case1: As we see in Chapter 4 and Table 5.1 above, Poland’s total farming
population is 7.4 million. So, in terms of per capita of total farming population,
Poland has received 175.2/7.4=23.7 euro per capita of agricultural population per
year.
Case2: We will think in terms of per km2 of total agricultural area. Poland’s total
agricultural area is 183 970 km2. So, Poland has received 175 200/183.97=952.2
euro for per km2 of total agricultural area per year.
As a result, if we combine all results we found, we will get Table 5.3:
Table 5.3 Original Parameters (euro)
PHARE SAPARD ISPA
TOTAL
(Original
Parameters)
Per capita of total population 9.5 9.0 18.5
Per capita of total agricultural
Population 23.7 23.7
Per km2 of total area 1174.1 1113.4 2287.5
Per km2 of total agricultural area 952.2 952.2
Hence, in terms of population Poland receives 18.54 euro per capita of its
total population and additionally 23.67 euro for per capita of its agricultural
population in one year. In terms of area, Poland receives 2287.53 euro per km2 of its
total area and additionally 952.2 euro per km2 of its total agricultural area in one
year.
66
5.3.2 Application of ‘Original Parameters’ to Other Central and
Eastern European Candidate Countries
In this part by applying the original parameters to other candidate countries
we will see how realistic these parameters are. We know that all CEECs started
accession negotiations. And we know their total receipts from Phare, Sapard and
Ispa from Chapter 4. First we will apply the original parameters to these countries.
Then we will compare the results with the real receipts of these countries from EU.
Hence, we can measure how applicable these parameters are.
When we apply original parameters to a candidate country, we will get two
amounts. The first amount will be found in terms of population, other will be found
in terms of area. We will say that the real allocations of pre-accession aid should be
between these two amounts.
How can these parameters be applied to a candidate country? For example,
consider Romania. Romania’s total population is 22.4 million and 9.9 million
people employ in agriculture. In order to find estimation in terms of population we
will use aid per capita of total population and aid per capita of agricultural
population from Table 5.3. Also, we will use the total population and total
agricultural population of Romania. We proceed in the following manner. First
multiply total population of Romania by aid per capita of total population:
22.4*18.54=415.3 M EUR. Then multiply total agricultural population by aid per
capita of agricultural population: 9.9*23.67=234.3 M EUR. Lastly, add the amount
we found from first procedure and from second procedure: 415.3+234.3=649.6 M
EUR. Hence, in terms of population Romania should receive 649.6 M EUR per
year. In order to find the estimation in terms of area we will use aid per km2 of total
area and aid per km2 of total agricultural area from Table 5.3. Also, we will use
Romania’s total area and agricultural area. Romania’s total area is 238000 km2 and
total agricultural area is 148740 km2. We proceed in the following manner. First
multiply total area of Romania by aid per km2 of total area: 238*2287.53=544.4 M
EUR. Second, multiply total agricultural area of Romania by aid per km2 of total
agricultural area: 148.74*952.16=141.6 M EUR. Lastly, add the amount found in
the first procedure and from second procedure: 544.4+141.6= 686 M EUR. Hence,
in terms of area Romania should receive 686 M EUR per year.
67

As a result, Romania’s pre-accession aid should be between 649.6 M EUR
and 686 M EUR according to original parameters. If we look at the real allocation
to Romania, it is annually 670.6 M EUR12. This means that for Romania, original
parameters work.
If we apply the original parameters to other Central and Eastern European
candidate countries as we apply to Romania, we will get Table 5.4:
Table 5.4 Application of Original Parameters to Other Central and Eastern
European Candidate Countries (M EUR)
Estimation in terms of
population
Estimation in
terms of area Real Allocation
Romania 649.6 686.1 670.6
Bulgaria 196.2 306.3 317.0
Hungary 203.3 268.5 247.7
Czech 200.2 221.5 171.2
Lithuania 78.4 181.9 168.9
Slovakia 108.2 135.4 137.9
Latvia 53.0 172.9 104.8
Estonia 28.3 112.3 69.9
Slovenia 41.6 50.4 54.9
Source: Table 4 and tables from Chapter 3
In Table 5.4, estimation in terms of population, that is the estimation which
is made by using the per capita of total population and per capita of total
agricultural population, is considered as a lower bound for the total financial
transfers from EU and estimation in terms of area, that is the estimation which is
made by using the per km2 of total area and per km2 of total agricultural area, is
considered as an upper bound.
12 From Chapter 4, we add up the receipts of Romania from Phare, Sapard and Ispa for one year and reach this number.
68

As seen in Table 5.4, except Bulgaria, Czech, Slovakia and Slovenia, real
financial transfers made to Central and Eastern European Countries are between the
boundaries. Bulgaria, Slovakia and Slovenia have received more than the
estimation. Only, Czech’s real financial allocations are less than the estimated one.
If we want the original parameters to be applied to other candidate countries we
should widen the boundaries. For more decisive interval of pre-accession aid, lower
bound of the interval should be decreased and upper bound should be increased.
This is nothing but widening the boundaries. How much should we increase the
upper bound and decrease the lower bound? For this question we look at the
exception countries: Czech, Bulgaria, Slovakia and Slovenia. If we decrease lower
bound by 15 percent and increase upper bound by 10 percent then all real
allocations lie between these two new boundaries. The real allocations and the new
boundaries can be seen in Table 5.5 below. From Table 5.5 we can see that all real
allocations to these countries, now, lie between the boundaries.
Table 5.5 The New Interval of Pre-Accession Aid With the Corrected Boundaries
(M EUR)
Estimation in terms
of population (%15 less
than the ‘estimation in
terms of population’ in
Table 5.4)
Estimation in terms
of area (%10 greater
than the ‘estimation in
terms of area’ in
Table 5.4)
Real Allocation
Romania 552.2 754.7 670.6
Bulgaria 166.8 337.0 317.0
Hungary 172.8 295.4 247.7
Czech 170.2 243.7 171.2
Lithuania 66.6 200.1 168.9
Slovakia 92.0 149.0 137.9
Latvia 45.1 190.2 104.8
Estonia 24.1 123.5 69.9
Slovenia 35.4 55.4 54.9
Source: Table 4 and tables from Chapter 3
69

5.4 Expected Pre-Accession Aid for Turkey (Application of Original
Parameters to Turkey)
In this part, we will make expectations about Turkey’s financial transfers of
Turkey during its accession negotiations from EU. For this calculation we will use
Poland’s receipts from pre-accession funds during its accession negotiation period.
In part 5.3 we calculated Poland’s receipts and derived original parameters. And,
we applied original parameters to other CEECs. Now, we will apply the original
parameters to Turkey in the same manner. First we will calculate ‘estimation in
terms of population’. This will be lower bound for our expectations. Second, we
will calculate ‘estimation in terms of area’. This will be upper bound for our
expectations. By combining lower and upper boundaries we will find an interval for
Turkey’s pre-accession aid. And, for more decisive interval for Turkey we will
widen this interval as we did for other candidate countries in part 5.3. We will
correct the boundaries by taking 15 percent higher of the upper bound and 10
percent lower of the lower bound. All these expectations will be done for one year.
Lastly, by looking at Poland’s accession negotiations period’s length we will decide
the total expected financial transfers of Turkey during its whole period of accession
negotiations.
a) Lower Bound for Expected Pre-Accession Aid of Turkey
For calculation of lower bound of expected pre-accession aid, we will use
‘estimation in terms of population’ made in part 5.3. We know from Chapter 4 and
Table 5.1 that Turkey’s total population is 68.6 million and its agricultural
population is 24.3 million. From Table 5.3 we can observe that Poland receives
18.54 M EUR per capita totally from Phare and Ispa allocations in one year. From
Sapard allocations Poland gets an additional 23.67 M EUR per capita of agricultural
population. So, in terms of population Turkey can expect totally the amount below
in one year: (18.54*68.6)+(23.67*24.3)=1847.025 M EUR
b) Upper Bound For Expected Pre-Accession Aid of Turkey
For calculation of upper bound of expected pre-accession aid, we will use
‘estimation in terms of area’ made in part 5.3. Turkey’s total area is 775 000 km2
and its total agricultural area is 414 880 km2. From Table 5.3, we can see that
Poland has received totally 2287.53 euro per km2 of its total area from Phare and
Ispa allocations. And, it has obtained an additional 952.16 euro per km2 of its total
70

agricultural area from Sapard allocations in one year. So, in terms of area, we can
expect the amount below for Turkey in one year:
(2287.53*775)+(952.16*414.88)=2167.86 M EUR
c) The Interval For Expected Pre-Accession Aid of Turkey
By combining a) and b) we can get the interval for expected pre-accession
aid of Turkey. So, Turkey’s possible financial transfers for one year should be in the
interval (1847.025 M EUR, 2167.86 M EUR).
d) Correction of Boundaries of Pre-Accession Aid
In part 5.3 we applied original parameters to CEECs and we saw that three
countries’ receipts do not lie between the boundaries. Because of these exceptions,
we corrected the boundaries found by original parameters. We will do same thing
for Turkey. For more decisive interval of pre-accession aid of Turkey, we will
widen the interval. We decrease lower bound by 15 percent and increase upper
bound by 10 percent. Hence, we get a new interval for Turkey’s expected pre-
accession aid for one year: (1570 M EUR, 2384.7 M EUR).
e) The Length of Accession Negotiations Period And the Amount of Pre-
Accession Aid?
Up to now, all calculations for pre-accession aid expectations are made for
one year. How many years can the accession negotiations period continue? Again,
we will make use of Poland’s experience. Poland started accession negotiations in
1998. In 2002, accession negotiations ended. However, Sapard and Ispa budgets
were prepared for a 7-year period (2000-2006). That is, although Poland’s accession
negotiations ended in 2002 it can still benefit from pre-accession aid. Hence, we can
say that Poland will have benefited from pre-accession aid for 9-year.
If Turkey’s accession negotiations continue 9-year, what will be the amount
of total pre-accession aid for 9-year period? We can calculate the 9-year pre-
accession aid by the intervals we found above. In part c) we said that Turkey’s pre-
accession aid should be in the interval (1847.025 M EUR, 2167.86 M EUR). If we
take the average of lower and upper bound we get nearly 2007 M EUR for one year.
So, for a 9-year period EU should give Turkey an average of 18 billion euro13.
13 If we use the interval with the corrected boundaries found in d), then we get 17.8 billion euro for a 9-year period
71

5.5 Conclusion
EU distributes pre-accession aid according to area, population and GDP per
head. However, these criteria are not valid for Turkey. Because Turkey has not
started yet accession negotiations. In this chapter we tried to make some
expectations about EU’s possible financial transfers to Turkey when Turkey starts
accession negotiations.
By making use of the Poland’s experiences during its accession negotiations
period, we formed expectations for Turkey’s pre-accession aid. We found that EU
should give Turkey approximately 2 billion euro per year. Since, Poland will have
benefited from pre-accession aid for 9 years, we will expect the same length of the
period. Hence, for a 9-year period Turkey should be given 18 billion euro totally.
These aids include agriculture, rural development and for all investment projects.
Because, the financial transfers made through Phare, Sapard and Ispa are given for
these purposes. And, we formed our expectations by taking into account Poland’s
receipts from Phare, Sapard and Ispa. Hence, with 2 billion euro grant per year,
Turkey should prepare for EU membership.
Now, we should look at this amount from two perspectives: from Turkey’s
and from EU’s. Does Turkey need such an aid? According to economic situation of
Turkey in terms of Copenhagen Criteria, presented in Appendix A, Turkey
absolutely needs this financial help. However we should also ask whether or not EU
can afford to pay this amount to Turkey. We will answer this question in the next
chapter.
72

CHAPTER 6
THE RELATION BETWEEN TURKEY’S PRE-ACCESSION AID AND
REFORMS OF EU ON STRUCTURAL AND AGRICULTURAL POLICIES
6.1 Introduction
As in pre-accession period, EU needs reforms also for accession period. For
accession period reforms are needed for agricultural and structural policies. As said
in Chapter 2, these funds compromise the most important part of the budget.
Because of this the distribution of these funds will cause problems after joining of
new members. Since new members are much poorer and much more agricultural
than the present EU members, they will entitled to major financial transfers from
the EU budget. This situation will not be accepted by the current members of the
Union. Also, a differentiated treatment in the Union for keeping the old members’
transfers level is not acceptable for the new members. In 2000-2006 budget we can
see such a differentiated treatment.
2000-2006 budget was the first budget in which fifth enlargement was taken
into consideration. Before the preparation of this budget no reforms was done on
Union’s policies. And, current members wanted to maintain their budgetary
positions. Because of this, 2000-2006 budget includes a dual treatment between old
and new members. However this situation cannot continue. For an equal treatment
in the Union, EU should make reforms before the preparation of 2007-2013 budget.
Although EU decided to make some reforms on agricultural and structural policies,
no concrete reform has been undertaken so far. Because of this, we will consider
some scenarios for 2007-2013 budget. We will use Christian Weises’s (2001)
scenarios for this purpose.
73

Why are we dealing with the reforms of EU’s Structural and Agricultural
policies? What is the relation of Turkey’s pre-accession aid and these reforms?
There is an important relation between Turkey’s pre-accession aid and the reforms
of EU. Because, when Turkey started accession negotiations at least ten candidate
country will have joined the Union. This means that EU’s budget will be burdened
by the transfers to new members. In such a situation, can EU afford to meet
Turkey’s demands? In Chapter 5 we calculated an amount for Turkey’s pre-
accession aid. Can EU pay this amount to Turkey? Reforms becomes important for
Turkey in this stage. Because, reforms decrease the burden of the members on
Union budget. So, in reform scenarios Turkey’s expectations’ possibility increases.
Hence, in order to look at from EU’s perspective to Turkey’s expected pre-
accession aid, we should consider budgetary situation of EU in the case of reform
and no reform. By making use of the scenarios for EU budget we will try to answer
the question of whether or not EU can afford to meet the demands of Turkey during
Turkey’s accession negotiations. The purpose of this chapter is to answer this
question.
In the second part, we will present 2000-2006 budget of Union. Because, by
this we can observe the remarkable differences in the financial transfers to current
and future member states. Since this situation does not continue EU needs reforms.
In the third part, we will give the scenarios for EU budget. In the fourth part, we
will analyze the possibility of Turkey’s financial transfers according to these
scenarios.
6.2 2000-2006 Budget of European Union
Before reforms, EU’s last financial framework is 2000-2006 budget. In this
part, we try to give 2000-2006 budget of EU. We do this to see the differentiated
treatment of EU between new members and old members. The aim of this part is to
conclude that EU cannot follow this policy in another budget. First we try to present
the 2000-2006 budgetary framework. Second we present the differentiated
treatment in this budget.
74

6.2.1 2000-2006 Budgetary Framework of EU
In its document Agenda 2000 (1997), the European Commission tried to
overcome the financial difficulties of the current enlargement, showing that pre-
accession and accession appropriations for the candidate countries could be
included in the new 2000-2006 budgetary framework. The Agenda 2000 proposals
were at the heart of discussions, which led to the financial framework approved by
the Berlin European Council in March 1999. That is, the 2000-2006 budget was
prepared at Berlin European Council in 1999, by considering six new members
(Poland, Hungary, Czech, Slovenia, Estonia and Cyprus) will accede EU in 2002.
However, by the recent change, not six but ten new members will accede to EU not
in 2002 but in 2004. Romania and Bulgaria are expected to join the Union in 2007.
So, in 2000-2006 budget, only six new members were thought and their accession
date was expected as 2002.
If we look at 2000-2006 budgetary framework, we can see that own
resources ceiling is intangible (as mentioned in Chapter 2, member states’
budgetary contributions’ ceiling is some proportion of their GNP and in 2000-2006
budget, this proportion, 1,27% of GNP, was said as intangible). EU did not change
this ceiling for this enlargement. From contributions side, the only comment is this.
There are two cases for the contributions: the new members contributed from the
beginning to the Union financing or the new members are granted derogations on
their budgetary contributions. Which case will be used has not been decided yet.
Luisa Giuriato (2002) found that if the new members started to contribute from the
beginning to the Union financing, the net cost to be met by own resources would
imply about a 5,9 per cent rise in the budget contributions of the EU incumbents,
corresponding to nearly 0,06 per cent of the EU’s GDP. If the new members were
granted derogations on their budgetary contributions, the increased burden for the
current members would be much greater, 27,6 per cent, i.e. nearly 0,28 per cent of
the EU’s GDP. And, Baldwin et al.’s (1997) obtained the benefit of enlargement by
a general equilibrium model: the accession of seven candidates14 should grant the
EU a 0.2 per cent real product gain. However, according to Baldwin’s model results
this gain is distributed in a very uneven fashion. Germany, France and UK receive
14 The countries are: the Czech Republic, Hungary, Poland, Slovenia, Slovakia, Romania, Bulgaria
75

largest part from the gain, Portugal, however, is estimated to lose. This conclusion
is also supported by other studies. For example C.Keuschnigg, M.Keuschnigg and
W.Kohler (2000) employ a dynamic general equilibrium model to estimate the
effects of enlargement on Germany. Although Germany’s contributions to the
Union budget will increase with this enlargement, they reached a conclusion that
‘Eastern enlargement of EU may largely be self-financing and promises
considerable welfare gains for present member states even under a narrow self-
interested economic calculus’. Because they say that Germany is more exposed to
the opportunities as well as risks that Eastern enlargement holds for present member
countries. Luisa Giuriato (2002) found that if no transitory regime on the EU budget
financing were granted to new members, the financial framework of the Berlin
Council would make enlargement largely positive for all the members except
Greece, Ireland and Portugal.
In Berlin Council, 1999, in order to make a clear distinction between the
amounts available to the incumbents and those reserved for the candidate countries
two new headings were created, which are for pre-accession aid and for the
enlargement expenditures. The 1999 Interinstitutional Agreement states in fact (art.
21 no: 3 and 4) the amounts reserved for the EU-15 can not at any time be used for
pre-accession and accession assistance and vice versa (Luisa Giuriato, 2002).
6.2.2 Some Considerations on the Enlargement Budget
Above we concluded that if no transitory regime on the EU budget financing
were granted to the new members, the new financial framework of the Berlin
Council (2000-2006 budget) would make enlargement largely positive.
In Table 6.1 below, we can see the distribution of 2000-2006 budget
expenditures among new and old member states. When we look at Table 6.1, we
can see that lion share goes to EU-15 from 2000-2006 budget. And, in Table 6.1 we
can see the pre-accession aid allocations to CEECs and accession share to five
candidate countries. As seen in Table 6.1, 8.25 per cent of total budget allocation
goes to new members in 2002-2006 period but they also eligible from pre-accession
funds during that period.
76

Table 6.1 Distribution of the Expenditures in the Enlarged Union
(shares of the enlarged EU budget-commitment appropriations)
2000 2001 2002 2003 2004 2005 2006 Total
EU-15 96.6 96.7 90.5 88.1 85.8 83.6 81.5 88.7
Pre-accession 3.4 3.3 3.1 3.1 3.0 3.0 2.9 3.0
Accession 6.4 8.8 11.2 13.4 15.6 8.3
TOTAL 100 100 100 100 100 100 100 100
Source: Financing the eastern enlargement of the EU, Luisa Giuriato (2002)
EU-15 total population is 376.4 million and the total population of the five
candidate countries, first wave countries, Poland, Hungary, Czech, Slovenia,
Estonia, is 62.4 million i.e nearly 14.2 per cent of total EU-20 (EU-15 plus five
candidates) population. And, EU-15 comprises 85.3 per cent of total area of EU-20
and five candidate countries comprise 14.7 per cent.
Table 6.2. Distribution of Expenditures in EU-20
Population as a
percentage of EU-20
Area as a
Percentage of EU-20
Distribution share
total in 2000-2006
EU-15 85.8 85.3 88.7
First wave
candidate
countries
14.2
14.7
9.8*
Source: Chapter 3 and Table 6.1 *: includes both pre-accession aid in 2000-2006 and enlargement allocation after 2002
In Table 6.2, we see the total distribution shares from 2000-2006 budget to
EU-15 and to five new members. The proportion left from 88.65 and 9.79 is 1.65
and this proportion is for other candidate countries’ pre-accession aid. When we
look at Table 6.2, EU-15 receives 88.65 per cent totally from 2000-2006 budget and
this proportion is nearly EU-15’s population share (85.8 per cent) in EU-20. The
77

first wave countries’ receipts share, 9.79, is less than their population and area share
in EU-20.
Besides, the allocation of the agricultural funds is completely different in the
EU-15 and in the candidate countries: only 10 per cent of the EU-15 agricultural
budget is reserved to rural development, while nearly 70 per cent of the transfers to
the candidate countries are reserved to this aim (Luisa Giuriato, 2002). This
disproportion is the consequence of the exclusion of the candidate countries from
direct compensation payments. This means that the direct payments will grant a
competitive advantage to the EU incumbents’ farmers, reducing their fixed costs.
If we look at structural expenditures, more than 80 per cent of the total financing is
reserved to the EU incumbents, while the share of the first wave candidate countries
is 15,3 per cent, a value nearly corresponding to their population’s share in the EU
(14,3 per cent) (Luisa Giuriato, 2002). However, if we compare the per capita
transfers to the candidates and those to the poorest EU incumbents, we observe a
dual treatment. While the first wave countries receive on average 93,5 per capita in
2000-2006 period, Portugal and Greece receive 156 and 285 euro per capita
respectively (Luisa Giuriato, 2002).
Luisa Giuriato, 2002, compares per capita GDP levels, population shares and
Structural Funds’ appropriations shares: the first wave countries, with their 14,3 per
cent in the population of the enlarged EU (EU-20) and with their 47,3 per cent of
the EU average per capita GDP, will receive 15,2 per cent of structural financing
available in the period 2000-2006. On the other hand, the EU poorest incumbents,
with their smaller population share and higher per capita GDP, will benefit from a
much higher relative level of structural financing. Greece, whose GDP per capita is
72,8 percent the EU-20 average and whose population is 2,4 percent of the enlarged
Union’s population, will benefit from 8,6 percent of the total Structural Funds. In
fact as said in Chapter 1, Greece is the largest beneficiary of EU budget and the
share of Greece’s receipts from structural funds in 1998 was amounted to 11.4 per
cent of total.
The low level of GDP per capita in the CEECs poses a challenge to the
system of EU cohesion policy, which has not been designed to cope with such large
income gaps. Upon its accession, the entire region would qualify as an Objective-1
area for the structural funds (as said in Chapter 2, the eligibility criteria being less
than 75 per cent of EU average GDP per capita) and for the cohesion fund (the
78
eligibility criteria being less than 90 per cent of EU average GDP per capita).
Because of this, in Berlin Council, a ceiling was put on structural aid equal to 4 per
cent of the receiving country’s GDP, this should limit the financing to the new
accession countries. Because, given their low GDP, the candidate countries will
reach the 4 per cent ceiling without equaling the incumbent members’ per capita
transfers.
Hence, we can see the differentiated treatment of EU in 2000-2006
budgetary framework. However, this situation cannot continue. Because this
contradicts basic principles of equality of member states in an enlarged Union. So,
these contradictions would have to be solved before the end of the current financial
perspective, 2000-2006 budget. In the next part we will focus on the needs of
reforms for this purpose. For an equal treatment reforms on agricultural and
structural policies are necessary for EU.
6.3 Reforms on Agricultural and Structural Policies of EU
The dual treatment in 2000-2006 budget of EU cannot continue. Because of
this EU needs a new policy for an equal treatment. In fact, for an equal treatment,
EU needs reforms on agricultural and structural policies. In this part, we will
concentrate on reforms on these policies. First we will give reasons for reforms.
Second we will present scenarios for EU’s policies (Since there is no concrete
decision about reforms in EU, we will give some scenarios). Third we will give the
scenario results on the Union budget. Fourth, we will discuss possibility of these
scenarios.
6.3.1 Need for Reforms
The debate on financing eastern enlargement is marked by clashes between
various conflicting interests. First, the new members expect to benefit equally from
EU policies that result in funding for member states. Given the gap in development
between the current EU members and the accession candidates, it can be expected
from the outset that the new members will receive a net transfer. Second, those
countries, in particular, that are currently net contributors to the EU budget (these
countries are given in Chapter 2) are keen to avoid a significant increase in their
burden as a result of eastern enlargement. Third, the countries currently in receipts
79
of transfers are opposed to the possibility of reduced funding following
enlargement. A compromise must be found between these positions, because it is
clearly impossible to make net payments to the new members, continue providing
the same amount of support to all current beneficiaries and at the same time
maintain the level of the burden on those paying into the budget.
Hence, Christian Weise (2001) says that before enlargement commences,
the EU should initiate a fundamental reform of its agricultural and structural
policies, in order that both will be sustainable in the long term in a 27-member EU.
Jovanovic (1999) says that reform in agricultural policy and institutional reform
must precede any enlargement. Also, Lowe and Ward (1998) says that: ‘The
commitment to enlarging the EU and the next round of the world trade
organizations mean that the Common Agricultural Policy is economically and
politically unsustainable in its current form.’
6.3.2 Required EU Policy Reforms
Although EU first mentioned about reforms on agricultural and structural
policies in Agenda 2000, which was presented by the Commission in 1997, there is
no concrete decision about the Union policies up to now. Because of this we will
present required EU policy reforms according to Christian Weise’s scenarios
(2001).
Over 80 percent of the EU budget is allotted to the Common Agricultural
Policy and EU’s Structural Policy. The primary aim of the structural policy is to
remove the disparities between different regions of EU; however, only 60 per cent
of total structural expenditures are made to the member states whose per capita
GDP is well below average (less than 75% of EU average). According to Christian
Weise, all transfers from structural funds, not only 60 per cent, should be paid only
to member states whose per capita GDP is well below average. The entry of much
poorer member states will reduce the EU’s average GDP per capita. Measured
against this new average, the relative prosperity of the current EU will increase and
many regions will become ineligible for aid. For example, Spain receives transfers
11 of its 17 regions from European Regional Development Fund (ERDF). When 10
new members join the Union the number of the regions receiving transfers from
80

ERDF will be reduced to 6. In the case 12 new members accede the Union, this
number will be decreased to only 2 (Nurettin Bilici, 2002).
In EU’s agricultural policy, there are direct income-support transfers. And,
these payments are the only transfers from the EU budget that are not yet
conditional on national co-financing. When the EU is enlarged it will not be
possible to deny the new members these income-support payments from the EU
budget in the long term (because, in 2000-2006 budget only 10 per cent of
agricultural budget can be spent on direct income support transfers for new
members).
Because of these weaknesses in structural policy and agricultural policy of
EU, EU should reform its budget. Now, we will present four scenarios for the 2007
and 2013 budgets from Christian Weise:
a) First Scenario: The first scenario stimulates how the EU budget would
develop if the EU were not enlarged and if no reforms were carried out (Status Quo
EU-15).
b) Second Scenario: In the second scenario, the financial effect of the entry
of all 12 partners is calculated accepting the assumption that all the current
regulations would apply in exactly the same form in the enlarged EU (Status Quo
EU-27). That is, there is an enlargement with 12 new members but no reforms.
Thus, under the EU’s structural policy, the only regions to qualify for maximum
support would be those with a per capita GDP at purchasing power parities (PPP) of
up to 75% of the EU average, as is the case today.
c) Third Scenario: The third scenario is based on a moderate reform of
both structural and agricultural policy in an enlarged EU (Moderate Reform EU-
27). The structural policy is adjusted to account for the fact that many regions
receiving substantial support today would lose their eligibility for funding in the
enlarged EU. This scenario increases the income threshold for maximum support
from 75% to 80% of the EU average. And, the share of the structural fund allotted
to other types of support, mentioned in Chapter 2, is reduced from over 30% to
10%. As regards agricultural policy, the direct income-support transfers are
maintained. However, in this scenario half of the sum allotted must be funded by
the national budgets. Thus, the share of the EU budget used to pay direct transfers
decreases and the specific distribution of agricultural policy burdens on the member
states is modified.
81

d) Fourth Scenario: The fourth scenario assumes that both policies are
substantially reformed in an enlarged EU (Substantial Reform EU-27). As regards
structural policy, this means that only member states whose national GDP per capita
is less than 90% of the EU average will now receive maximum support. The
reduction of regional disparities within a member state is seen accordance with the
principle of subsidiarity as being a national problem. The substantial reform of
agricultural policy consists in decoupling direct transfers from production and
gradual abolition of these transfers.
If we summarize all scenarios we can obtain the matrix below:
First Scenario (Status Quo EU-15) no enlargement, no reform
Second Scenario (Status Quo EU-27) enlargement, no reform
Third Scenario (Moderate Reform EU-27) enlargement, a moderate reform
Fourth Scenario (Substantial reform EU-27) enlargement, a substantial reform
6.3.3 Scenario Results
The share of operational expenditure15 laid down in 2000-2006 budget
amounts to 1.02% of the EU’s GDP, or euro 96.5 billion (all figures at 1999 prices).
Table 6.3 presents the operational expenditure and its components for each of the
scenarios.
Table 6.3 Simulation of EU Expenditure 2007 and 2013 (% of EU’s GDP) 2007 2013
of which of which
Scen
ario
Total
operational expenditure st
ruct
ura
l po
licy
agri
cul
tura
l po
licy
Total
operational expenditure st
ruct
ura
l po
licy
agri
cul
tura
l po
licy
First 0.8 0.3 0.5 0.6 0.2 0.4 Second 0.9 0.3 0.6 0.8 0.3 0.5
Third 0.8 0.3 0.4 0.7 0.3 0.3
15 Operational expenditure is sum of total structural expenditures, agricultural expenditures and expenditures on internal policy
82

Table 6.3 (cont.) Fourth 0.8 0.3 0.5 0.6 0.2 0.3
Source: Christian Weise, Economic Bulletin 10/2001
As seen in Table 6.3, the share of the EU’s GDP allotted to operational
expenditure was lower, in some cases considerably so, in all scenario calculations.
The estimates for the EU budget would be relatively low, especially if the old and
new member states were willing to accept well-justified limits on transfers.
Otherwise the future EU budget would be much more extensive.
In addition to the scenarios, there is also a possible case, which is the worst
one. In this case the estimates for agricultural and internal policies from the Status
Quo EU-27 scenario would have to be applied to the EU in 2013. If the current
recipients of structural policy transfers successfully oppose any reduction of funds,
the level of spending planned for 2006 in this policy area would have to be
maintained. Total operational expenditure would then amount to 1.16% of the EU-
27’s GDP in 2013 (Christian Weise, 2001).
In Table 6.4 we can see the simulation of EU expenditures in 2013. From
Table 6.4, it can be observed that, today’s member states (EU-15) receive much
fewer payments from the EU budget in all three enlargement scenarios than in the
scenario with no enlargement and no reform (first scenario). In the case of no
enlargement and no reform EU-15 would benefit over 21 billion euro from
structural funds, however in the case of substantial reform scenario EU-15 can
benefit only 4.4 billion euro from structural funds.
Table 6.4 Simulation of EU Budget Expenditures in 2013 (millions euro)
Receipts of 12 accession
candidates Receipts of EU-15
Scen
ario
from structural
funds
from agricultur
al funds
total operational expenditure
receipts
from structural
funds
from agricultur
al funds
total operational expenditure
receipts First 21384 38345 65779
83

Table 6.4 (cont.) Second 22100 13805 37296 5898 38239 49186
Third 22100 9227 32718 10657 27702 43407
Fourth 21500 7021 29912 4414 24333 33795
Source: Christian Weise, Economic Bulletin 10/2001
If we look at the new members’ receipts, we can see that in each scenario,
around 22 billion euro is allotted to the structural funds. The agricultural policy
payments vary depending on the design of the direct transfer instrument. In the
absence of any reform they amount to a total of almost euro 14 billion, in the event
of a moderate reform to over euro 9 billion and in the event of substantial reform to
euro 7 billion.
As we know, in second scenario there is an enlargement but there is no
reform and in fourth scenario there are both enlargement and reform and the reform
is a substantial reform. If we compare second and fourth scenarios, we can easily
see that, difference between the agricultural funds allocations are much more than
the difference between he structural fund allocations although both of them are less
in the fourth scenario case. The decrease in agricultural transfers is due to the
simulated abolition of direct payments and thus not directly to enlargement. In
structural policy, by contrast, even without reform enlargement leads to similarly
large reductions in funding. The main benefit of the substantial reform is thus to
concentrate the EU-15’s remaining support on the neediest member states. In the
case of substantial reform total operational expenditures is 63.7 billion euro while in
the case of no enlargement, first scenario, total operational expenditure is 65.8
billion euro. Thus, although in substantial reform scenario there is an enlargement,
EU expenditures would be lower than the case in no enlargement scenario.
6.3.4 Can These Reforms Really Be Made?
In order to discuss the possibility of introducing these reforms, we should
look at the situations of the current members in the case of each scenario. Their
84

situation is important because they will decide whether or not there will be a reform
or if there would a reform which type it will be. Again from Christian Weise’s
paper (2001), we can see that the reform measures and EU enlargement have
different consequences for the various member states. Christian Weise calculates
net positions of member states for each scenario. Since, as said above, all current
member states receive much fewer payments from the EU budget in all three
enlargement scenarios than in the scenario with no enlargement and no reform, their
net position becomes worse off. Based on their net positions in 2007, all the big
member states of EU-15 (Germany, France, UK, Italy, Spain) will have a –greater
or smaller- interest in reforms if the EU is enlarged. If consensus and majorities are
to be reached in the enlarged EU, then early agreement among this group of large
and medium-sized members essential. In Chapter 2, we saw that Germany is the
largest contributor of the budget because of its high GNP. And, in all scenarios,
Germany has the largest overall net burden. The second scenario is most beneficial
for France in 2013, while the third scenario favors Spain and Italy. Germany and the
UK have the greatest interest in the fourth scenario (substantial reform scenario).
However, second scenario, no reform scenario, will prove not to be sustainable. Of
the two reform scenarios, France is also more likely to support the fourth scenario
than the third scenario. Fourth scenario is the worst solution for Spain. The other 10
current member states would largely profit from the fourth scenario. If we think of
the new members, it is obvious that the second scenario is most beneficial for them.
The 12 accession candidates would receive lower net transfers under the reform
scenarios than under the no reform scenario (second scenario).
The second scenario results in significant reductions in the structural policy
transfers to the regions receiving very substantial support in the EU-15 today,
because EU average GDP will decrease when 12 candidates accede to the Union.
As said above Spain’s number of regions receiving transfers from structural funds
will decreased from eleven to two in the case of joining 12 new members. This
causes conflicting approaches to the redesign of this policy. One side seeks to
maintain the levels of support in the EU-15, while the other seeks increased
concentration of overall reduced funds on the neediest beneficiaries.
It is only natural that today’s beneficiaries wish to see a loosening up of the
eligibility criteria, which would secure them further aid for the immediate future. In
the medium and long term, however, this would prove to be a costly solution for
85

these countries as well, because more generous regulations would perforce then
apply to all member states, and following enlargement they could very probably not
be reversed again. This would increase the transfers to the new members, which
sooner or later would also be substantially financed by today’s EU-15 net
beneficiaries of structural funds. A substantial reform of structural policy is thus
also in the well-understood self-interest of the current beneficiaries.
There is currently latent but unfocused willingness in the EU-15 to introduce
agricultural reforms. Of the options available for reducing agricultural expenditure,
more member states are in favor of a gradual reduction of direct subsidies than a
transition to national co-financing. The accession candidates are also opposed to the
additional burden on their national budgets that comes with co-financing option.
They could thus also be won over the idea of a substantial reform.
The enlargement of the EU by the 12 candidates can be financed within the
framework of the maximum limits currently imposed on the EU budget. The
prospect of enlargement increases the need to introduce EU policy reforms, which
are long overdue anyway. The essential elements of such reforms, as mentioned
above, are reducing income support in agricultural policy and concentrating
structural funds on member states that are in need. The reforms proposed here
would mean that the distribution of net burdens would be based to a greater extent
than today on the relative incomes of the EU member states. The burden on net
contributors would be kept within limits, the needy members of today’s EU would
continue to receive support, and the new members would benefit equally from the
policies leading to funding.
Hence, we can conclude that if the current EU-15 do not focus on short term
interests, they should come to an early agreement on the basic elements of reforms
and, as far as possible, take the initial steps before enlargement. The political
inclusion of the accession candidates in the quest of consensus is unavoidable
before enlargement, however.
6.4 Evaluation of Expected Pre-Accession Aid to Turkey
In this part, we will try to evaluate the realism of the expectation of pre-
accession aid for Turkey we made in Chapter 5. Under which conditions our
expectations are more real? For this purpose we will use 2000-2006 budget and
86
scenarios for 2007-2013 budget. We will think total operational expenditure as a
constraint for pre-accession aid. First we will find what was the amount of this
constraint in 2000 while EU was giving some amount of pre-accession aid to
CEECs in that year. This will give us the relation between pre-accession aid and
operational expenditures in 2000. Then we will find the relation between total
operational expenditures and Turkey’s pre-accession aid in 2007 and 2013. Then we
will compare the relation we found for 2000 and 2007.
In section a) we will find the relation between total operational expenditures
and pre-accession aid in 2000 and 2001 from 2000-2006 budget. In section b) we
will find relation between total operational expenditures under different four
scenarios in 2007 and 2013 and expected pre-accession aid for Turkey. In section
c) we will evaluate our expectations according to a) and b).
a) Total operational expenditures and pre-accession aid in 2000 and
2001: While preparing 2000-2006 budget, EU planned to let 6 new members enter
the Union in 2002. That is, besides making operational expenditures to current EU-
15 it also planned to transfer pre-accession aid to candidate countries in 2000 and
2001. From 2000-2006 budget, we can observe that the total operational
expenditure to EU-15 in 2000 was planned as 0.94 per cent of EU-15’s GDP. From
Table 6.5 below, we can also see that the pre-accession aid to CEECs in 2000, also
in 2001, was 0.037 per cent of the EU-15’s GDP. From this amount, 0.01 per cent
belongs to Poland.
Table 6.5 Financial Perspectives in 2001 and 2002 (before the planned enlargement
in 2002) percentage of EU-15’s GDP
Years
Total Operational
Expenditure to EU-15
Pre-accession aid
to CEECs
Pre-accession aid
to Poland
2000 0.94 0.04 0.01
2001 0.94 0.04 0.01
Source: EUROSTAT, 2000-2006 budget and the tables in Chapter 4
87

b) Total operational expenditures under the scenarios and pre-accession
aid for Turkey in 2007 and 2013: As explained in part 3 of this chapter, some
reforms are expected to be made before 2007. In 2007, 12 current candidate
countries will have joined the Union. We will use reform scenarios given in part 3
of this chapter for the expectations of operational expenditures of EU to EU-27 in
2007 and 2013. Then we will look at the pre-accession aid for Turkey as a
percentage of Union’s GDP. At the end, we will have operational expenditure and
pre-accession aid of EU in 2007 and 2013.
In Table 6.6 below, we can see the total operational expenditures of EU to
27 members as a percentage of the EU-27’s GDP16 in each scenario in 2007 and
2013. We can observe from this table that, total operational expenditures in all
scenarios are less than the total operational expenditures in 2000 and 2001. Only,
total operational expenditure the second scenario is close to the total operational
expenditure in 2000. According to second scenario, total operational expenditures
will be 90 260 million euro in EU-27 in 2007. Total operational expenditures in
2013 will be lower in the fourth scenario and higher in the second scenario. In fact,
the scenarios which include reforms will decrease operational expenditure
especially in 2013.
Table 6.6 Total Operational Expenditures in 2007 and 2013(% of EU GDP)
Total operational
expenditure in 2007
Total operational
expenditure in 2013
First Scenario 0.8 0.6
Second Scenario 0.9 0.8
Third Scenario 0.8 0.7
Fourth Scenario 0.8 0.6
Source: Table 7.3
16 These GDPs are the GDPs of EU-27 in 2007 and 2013, not the current GDP. These GDP’s are calculated in Christian Weise (2001)
88
In Chapter 5 we found Turkey’s financial transfer nearly 2 billion euro for
one year. If we calculate this amount as a percentage of EU-27’s GDP we will get
0.02 percent in 2007 and 0.018 in 201317.
c) Evaluation of Turkey’s pre-accession aid by using a) and b): As said
in a), while EU’s total operational expenditures were 0.94 per cent of the Union’s
GDP in 2000, EU transferred pre-accession aid to Poland amounted to 0.01 per cent
of Union’s GDP. In b) we saw that total operational expenditure of EU will be at
most 0.92 percent of Union’s GDP in 2007 if one of the scenarios become true.
And, Turkey’s expected pre-accession aid is 0.02 percent of Union’s GDP in 2007.
While EU’s total operational expenditures are less than 0.92 percent of Union’s
GDP, can EU transfer pre-accession aid, which is amounted to 0.02 of its GDP, to
Turkey? By looking at Poland’s case, Turkey’s pre-accession aid seems realistic.
Hence, EU’s can afford to pay Turkey’s pre-accession aid, calculated in Chapter 5,
if one of the scenarios, given in part 3, becomes true. First scenario is unrealistic
because it is certain that there will be enlargement. In part 3 we saw that the fourth
scenario can take more support than other scenarios. In the fourth scenario
operational expenditures is 0.81 percent of Union’s GDP in 2007 and 0.57 percent
of the Union’s GDP in 2013. If fourth scenario becomes true then Turkey’s pre-
accession aid may be paid by EU easily.
However, when we mentioned from the scenarios, we also said the worst
possible case at which the current recipients of structural policy transfers
successfully oppose any reduction of funds, the level of spending planned for 2006
in this policy area would have to be maintained. So, total operational expenditure
would then amount to 1.16% of the EU-27’s GDP in 2013. If such a case occurs
then our expectations may be high for EU. In such a case, Turkey’s pre-accession
aid may be lower than the amounts we calculated and then the length of the
accession negotiation period may be longer.
6.5 Conclusion
The first budget in which fifth enlargement was taken into account was
2000-2006 budget of EU. When this budget was prepared, 6 candidate countries
17 Average of the maximum and minimum values for Turkey’s expected financial transfers were taken for finding 0.02 and 0.018. And to calculate the percentage of Union’s GDP we use Union’s GDP in 2007 and 2013. These GDP’s are calculated in Christian Weise (2001)
89
were expected to join the Union in 2002. However in this budget we saw a dual
treatment between new members and current members of the Union. Because, the
current members did not want to decrease their receipts from the Union budget and
increase their payments to the budget with this enlargement. Since no reform was
done for Union policies before the preparation of this budget, such a differentiated
treatment is unavoidable under these conditions.
For an equal treatment in the EU-27, EU thinks to make some reforms on
Union’s agricultural and structural policies before the preparation of next budget
(2007-2013 budget). Although there has been no concrete decision about the form
and ingredients of these reforms, there are some scenarios for these reforms. In this
chapter we used Christian Weise’s scenarios for these reforms. These reform
scenarios important for Turkey’s pre-accession aid. In fact, budget situation of EU
when Turkey starts accession negotiations is important for Turkey. And, reforms
change budget situation of EU.
In order to discuss the realism of Turkey’s pre-accession aid, first we looked
at Poland’s pre-accession aid in 2000 while looking at Union budget transfers to
EU-15 in 2007. Then we looked at Turkey’s pre-accession aid in 2007 while
looking at Union budget transfers to EU-27 in 2007. When we compare these two
situations, we concluded that Turkey’s expected pre-accession aid is not so much
for EU in the Christian Weise’s scenarios. In the reform scenarios since the burden
of members on budget decreases, Turkey’s pre-accession aid becomes more
realistic to be paid. However except these scenarios there is a worst possible case at
which the current recipients of structural policy transfers successfully oppose any
reduction of funds, the level of spending planned for 2006 in this policy area would
have to be maintained. This situation increases operational expenditures of EU to
EU-27 so decreases the possibility of Turkey’s pre-accession aid payment.
90

CHAPTER 7
CONCLUSION
Second and third enlargements of EU (Greece, Spain and Portugal) have
caused big problems in the Union. They have been big burden on the Union budget
since their accession date. Because they were not ready for membership when they
joined the Union. We saw this by looking at accession criteria and pre-accession
periods of these enlargements.
When fifth enlargement came to the agenda of EU, EU needed to make
some reforms on its policies. Because this is the largest enlargement of EU, it
consists of 12 candidate countries besides Turkey. And, the candidate countries
income levels are below the EU’s average. If EU used the same policy it used in
previous enlargements then this enlargement would cause more problems than
second and third enlargement countries did. In fact, the idea behind these reforms is
to prepare these countries well for membership. EU doesnot want to experience
same thing with more largely. In order to not bring big burdens to the budget EU
targeted to prepare candidate countries well for membership and make some
reforms on Union funds. That is reforms were seen necessary both for pre-accession
and accession periods.
For accession period, EU has thought reforms on agricultural and structural
policies, which compromise the most important part of the Union budget. With
reforms on agricultural and structural policies the burden on net contributers would
be kept within limits, the needy members of today’s EU would continue to receive
support and the new members would benefit equally from the policies leading to
funding. Although EU decided to make reforms on these policies, no concrete
decision has been taken up to now. Because of this we have taken into account
some scenarios for the Union policies in our work.
91
For pre-accession period, EU made important reforms for this enlargement.
It announced new conditions for membership, namely Copenhagen Criteria. It
introduced new pre-accession strategies to prepare candidate countries for
membership. The new conditions for membership are hard to fulfill, however, EU
helps candidate countries for their preparation through pre-accession strategies. We
saw pre-accession aid in our work one of the component of pre-accession
strategies. EU supports candidate countries financially by pre-accesison aid. Since
CEEC’s income levels are below the Union average and the conditions for
membership are hard to fulfill, CEECs have needed financial help to implement the
law and rules of EU membership during their candidacy period.
We derived that EU distributes pre-accesison aid according to area,
population, agricultural area, employment in agriculture and GDP per head. Poland
is the largest beneficiary of the total pre-accession aid with its highest population
and largest area. Turkey have also benefited from pre-accession aid since Helsinki
Summit. However when we compare other countries’ receipts with Turkey’s
receipts, Turkey’s receipts are so small by taking into account its population and
area. These criteria are not valid for Turkey because Turkey has not started
accession negotiations yet.
To calculate the pre-accession aid for Turkey during its accession
negotiations, we proceded in the following manner. First we chose one of the
candidate countries, Poland. By looking at Poland’s receipts from pre-accesison
funds and taking into account the distribution criteria of EU these funds we
calculated an interval for Turkey’s pre-accession aid. Since EU distributes pre-
accession aid according to area, population, agricultural area and agricultural
population we found aid per capita, per km2, per agricultural population and per
agricultural employment for Poland. Then multiplying Turkey’s population and
Turkey’s agricultural population with aid per capita and aid per agricultural
population respectively we reached the lower bound for Turkey’s pre-accession aid.
By multiplying Turkey’s area and agricultural area with aid per km2 and aid per km2
of agricultural area we reached the upper bound for Turkey’s pre-accession aid.
Hence we reached the interval for Turkey’s pre-accession aid which was: (1847.025
M EUR, 2167.86 M EUR). We applied same procedure to other CEEC by using
again Poland’s receipts. Except three countries all other Central and Eastern
European Countries’ receipts lie in the interval we found. Because of these
92
exceptions we widened the boundaries of the interval we found for Turkey and we
got: (1570 M EUR, 2384.7 M EUR). In fact in both cases Turkey is expected to
receive an average of 2 billion euro per year. Again from Poland’s experiences this
aid should be paid to Turkey for a 9-year period.
In our study we also attempted to discuss the realism of our expectation
about pre-accession aid of Turkey. It was necessary to discuss the realism of this
expectation because when Turkey starts accession negotiations at least ten current
candidate countries will have joined the Union. The demands from EU budget will
not be only from Turkey also from new members. We reached the conclusion that if
one of the scenarios which are mentioned in Chapter 6 becomes real, then for
Turkey, the probobility of receiving 2 billion euro per year from pre-accession aid
during accession negotiations will increase. However, some members, currently
recipients of transfers from these funds, are opposed to the possibility of reduced
funding following enlargement. In such a situation if no reforms are made then
Turkey’s expectations may be higher for EU. We reached these conclusions by
making use of the scenarios for Union policies in 2007-2013 budget.
93

REFERENCES
Baldwin R.E., J.F. Francois and R.Portes (1997), The Cost and Benefits of Eastern Enlargement: the Impact on the EU and Central Europe, Economic Policy, April, pp.127-176.
Bilici N. (1996), Türkiye Avrupa Birligi İliskileri (İspanya Deneyimi Isığında), Turhan Kitabevi Yayınları, Ekonomik ve Sosyal Araştırmalar: 6, Ankara.
Bilici N. (1997), Avrupa Birliği Mali Yardımları ve Türkiye, Akçağ Yayınları, Ekonomik ve Mali Araştırmalar: 1, Ankara.
Bilici N. (2002), Avrupa Birliği’nde Mali Yardım Kavgası, Türkiye’de Başka Kavgalar, Asomedya Dergisi, Nisan, pp. 33-56.
Commission Decision of 20 July 1999 (1999), on the indicative allocation of the annual Community financial contribution to pre-accession measures for agriculture and rural development, Official Journal L 226, pp. 23-25.
Council Regulation (EEC) No 3906/89 of 18 December 1989 (1989), on economic aid to the Republic of Hungary and the Polish People’s Republic, Official Journal L 375, pp. 11-13.
Council Regulation (EC) No 1266/1999 of 21 June 1999 (1999a), on coordinating aid to the applicant countries in the framework of the pre-accession strategy and amending Regulation (EEC) No 3906/89, Official Journal L 161, pp. 68-71.
Council Regulation (EC) No 1268/1999 of 21 June 1999 (1999b), on Community support for pre-accession measures for agriculture and rural development in the applicant countries of central and eastern Europe in the pre-accession period, Official Journal L 161, pp. 87-93.
Council Regulation (EC) No 1267/1999 of 21 June 1999 (1999c), establishing an Instrument for structural policies for pre-accession, Official Journal L 161, pp. 73-86.
Council Regulation (EC) No 555/2000 of 13 March 2000 (2000), on the implementation of operations in the framework of the pre-accession strategy for the Republic of Cyprus and Republic of Malta, Official Journal L 68, pp. 3-6.
94

Council Regulation (EC) No 390/2001 of 26 February 2001 (2001), on assistance to Turkey in the framework of the pre-accession strategy, and in particular on the establishment of an Accession Partnership, Official Journal L 58, pp. 1-4.
Dilekli S., K. Yeşilkaya (2002), Maastricht Kriterleri, Avrupa Birliği ile İlişkiler Genel Müdürlüğü DPT (http://ekutup.dpt.gov.tr/).
Europe Server, http://europe.eu.int.
European Commission (1997a), Commission Opinion on Poland’s Application for Membership of the European Union, Brussels.
European Commission (1997b), Agenda 2000: For a Stronger and Wider Union, Information Programme for the European Citizen, Brussels.
European Commission (1999a), Allocation of 1998 EU Operating Expenditure by Member State, Brussels.
European Commission (1999b), 1999 Regular Reports on Candidate Countries’ Progress Towards Accession, Brussels.
European Commission (1999c), The Structural Funds in 1998, Luxembourg.
European Commission (2000), 2000 Regular Reports on Candidate Countries’ Progress Towards Accession, Brussels.
European Commission (2001), 2001 Regular Reports on Candidate Countries’ Progress towards Accession, Brussels.
European Commission (2002), 2002 Regular Reports on Candidate Countries’ Progress towards Accession, Brussels.
Eurostat (2002), Key Structural Data for the 10 Acceding Countries, Statistics in Focus (General Statistics), No 143, Luxembourg; Office for Official Publications of the European Communities.
Georgakopoulos T., Overprotected and Unprepared: EU Accession, the Greek Way, (unpressed) available at: http://www.fesportal.fes.de/pls/portal30/docs/FOLDER /POLITIKANALYSE/COHGEORGAKOPOULOS.PDF. Giuriato L. (2002), Financing the Eastern Enlargement of the European Union, Working Paper No: 47, Roma.
İktisadi Kalkınma Vakfı, Üçer O. (1997), Maastricht Kriterleri Çerçevesinde Türkiye Mali Disiplinin Neresinde?, İKV Dergisi, No: 134, pp. 25-36.
İktisadi Kalkınma Vakfı, Erçin E. (2002), Avrupa Birliği Genişleme Süreci ve Türkiye, İKV Dergisi, No: 170, pp. 2-126.
Jovanovic M.N. (1999), Eastern Enlargement of the EU Sweet Lemon or Sour Grapes?, Brown Economic Review, pp. 15-19.
95

Keuschnigg C., M. Keuschnigg and W. Kohler (2000), The German Perspective on eastern EU Enlargement, Economic Series No: 0007, University of Saarland, Germany.
Lowe P. and Ward N. (1998), Regional Policy, CAP Reform and Rural Development in Britain: The Challenge of New Labor, Regional Studies, Vol. 32, No. 5.
Republic of Turkey (2001), Pre-Accession Economic Programme 2001, Ankara.
Republic of Turkey (2002), Pre-Accession economic Programme 2002, Ankara.
State Institute of Statistics Primary Ministry, Labour Force Database, Turkey.
Uygur E. (2001), Krizden Krize Türkiye: 2000 Kasım ve Şubat Krizleri, Türkiye Ekonomi Kurumu Tartışma Metni, No 2001/1.
Weise C. (2001), EU Eastern Enlargement Can Be Financed-Increased Need For Reforms Scenarios for the 2007 and 2013 EU Budgets, Economic Bulletin No: 10/2001.
Zanias G.P, Greece and the Eastern Enlargement of the European Union, Chapter 11 of Globalization and the Political Economy of Trade Policy Edited by C. Paraskevopoulos, A. Kintis and A. Kondonassis (this book is in press, available at http://www.apforess.com/book2/book2.htm).
96

APPENDIX A
TURKISH ECONOMY AFTER HELSINKI EUROPEAN COUNCIL
A.1 Introduction
Data is taken from Turkey’s Regular Report 2002, unless stated otherwise.
The Helsinki European Council, 1999, concluded that "Turkey is a candidate State
destined to join the Union on the basis of the same criteria as applied to the other
candidate States. Building on the existing European Strategy, Turkey, like other
candidate States, will benefit from a pre-accession strategy to stimulate and support
its reforms." And, Turkey is expected to start accession negotiations as soon as
possible. What has Turkey done for EU membership? Where is Turkey in
Copenhagen Economic Criterion? The purpose of this work is to look at
developments in Turkish economy between 1999 and 2001. We will evaluate
Turkey’s economic situation in terms of Copenhagen Economic Criterion and
Maastricht Criteria after Helsinki Council.
The most important events in Turkey after Helsinki are financial crises.
After Helsinki European Council, 1999, Turkey confronted with two financial
crises. In the first part we will look at these crises more closely. In the second part
we will evaluate Turkish economy between 1999 and 2001 in terms Copenhagen
Economic Criterion. In the third part, we will evaluate Turkish economy in terms of
Maastricht Criteria.
At the end we saw that although Turkey has done important reforms for
membership its economy is not ready for membership. Turkey has not satisfied yet
Copenhagen Economic Criterion. This situation is mainly resulted from financial
crisis.
97
A.2 Financial Crises in 2000 and 2001
The most important reasons for the instability of Turkish economy after
1999 are financial crises in 2000 and 2001. In this part we will give briefly these
crises. First we will present 2000 stabilization programme. Second we will present
financial crisis in December 2000. Third we will present financial crisis in February
2001.
A.2.1 The 2000 Stabilization Programme
In response to unsustainable trends in public finance and substantially high
real interest rates during 1999, a comprehensive macroeconomic programme
covering the 2000-2002 period was launched at the end of 1999. The IMF, through
a three-year Stand-by Arrangement, supported this programme.
The main goals of the programme were to:
- lower inflation rates to single digit levels by the end of 2002,
- put public finance on a sustainable path,
- put the economy on a higher and a more stable growth path,
- implement the structural reforms that are needed to achieve a more efficient,
productive and flexible economic structure.
The programme was based on the following four pillars:
- tight fiscal policy, which aims at a considerable improvement in the primary
surplus of the total public sector,
- forward looking incomes policy,
- rule based credible monetary policy in combating inflation,
- structural reforms in areas of agricultural support system, social security,
privatization, fiscal transparency and regulation and supervision of the financial
sector.
In order to break the inflationary expectations and to decrease real interest
rates, exchange rate was chosen as a nominal anchor, and daily values of the
exchange rate basket consisting of 1 USD+0.77 EURO consistent with the inflation
target were announced.
98

A.2.2 What Caused the Crises?
After Mexican crisis, 1994, Dornbush said that: the stabilization
programmes based on exchange rate consists of three stages. First stage is useful;
the stability in exchange rate provides a general stability in economy. In the second
stage, the overvaluation of money is clear and it becomes obvious later, but it is not
seen appropriate for doing something. When we come to third stage, it is too late to
doing something. The real valuation of money requires devaluation. But, politics
will not permit this. They will refute the conditions then one more time will pass
and foreign exchange crisis begins. That is, most exchange rate-based stabilization
programs end with a currency crisis (Uygur, 2001). Turkey experienced same thing
in 2000.
Uygur (2001) argued that a general opinion about the financial crises is valid
in most of the cases, which is there are circumstances and indicators of a crises, but
it is not possible to say the occurring of a crises and the time when the crises will
occur. However, it is known that the pressure of the financial crises is come from
the unreliability and panic. When Turkey starts this programme, there were some
doubts about the programme, but these were encouraged by the some obstinacies
occurred during the implementation of the programme.
Just after the initiation of the stabilization program, interest rates fell down
sharply from 90 percent in December 1999 to 35 percent in January 2000. This
made the banking system become more vulnerable to increases in interest rates.
Because of this vulnerability, banks financed T-bills with short-term resources, such
as overnight repos. Furthermore, sharply decreasing interest rates revoked the
lagged consumption and investment demand, which led to a slowing down in TL
deposits, a boom in credit demand and also increasing import demand due to the
overvalued TL, which caused unsustainable levels of current account balance.
Related with these reasons, credit volume of the banking sector increased and its
date of maturity extended.
From the standpoint of international markets, in 2000 Turkey was the
second trustworthy market after Mexico among the emerging markets. However,
signals of a slowdown in the US economy, discouraging oil price trends and related
global economic slowdown sentiments made international investors prefer to hold
99

liquid positions. Moreover, it was observed that the risk premiums of the emerging
markets were increasing.
Hence, interest rates on emerging market-debt instruments started to
increase in international financial markets, which caused foreign borrowing become
more costly. As a matter of fact, whereas spread for Turkey in September 2000 was
around 490 basis points (bps), it became 560 bps in October. Meanwhile, the risk
premium of emerging markets increased sharply due to the problems occurred in
Argentina. Therefore, at the end of October 2000, spread for Turkey increased to
620 bps, reflecting a more costly foreign borrowing and a need to meet margin calls
for the collaterals of the syndicated loans (Pre-Accession Economic Program 2001).
A.2.3 Crisis in December 2000
For the period January-October 2000, the announced programme was
successfully executed. However, in November 2000, Turkish financial markets had
a crisis due to internal negative impacts and distortions at international financial
markets, as well as facing a liquidity squeeze arising in the domestic money markets
due to the sudden jump in the FX demand of the market participants.
Increased liquidity congestion led the Central Bank to fund the market.
However, this funding turned out to satisfy the foreign currency demand, which
threatened the level of international reserves, instead of eliminating the rapidly
developing liquidity crunch. Hence, at the end of November 2000, considering the
reserves, the CBRT let interest rates to be high, which caused overnight interbank
interest rates to be as high as 999 percent. Net Foreign Exchange Reserves
decreased from 24.1 billion dollars on November 16 to 17.9 billion dollars on
December 5th, 2000. Between the 6th and the19th of December, the Central Bank
recovered part of its reserves and bought back 1.9 billion dollars. In this process, the
Supplementary Reserve Facility (SRF) extended to Turkey by the IMF constituted
the crucial part of the newly gained reserves. In the last 5 working days of
December, the Bank accommodated the surge in currency demand due to the long
holiday and end-year closing books of the banking sector (Pre-Accession Economic
Program 2001).
As a consequence of the crisis, basic magnitudes of monetary programme,
namely NDA and NFA, were revised. The radical change was the termination of the
100
corridor band application for NDA. The other change was that the TL required
reserves were reduced from 6 to 4 percent on the 12th of January 2001, which
provoked a sharp shrinkage in base money which was around 18 percent in nominal
terms as of 8th of February (Pre-Accession Economic Program 2001).
A.2.4 Crisis in February 2001
Turkey overcame from the large speculative attack to foreign exchange in
November 2000 by (i) high interest rate (ii) important loss of foreign exchange
reserve, and (iii) 7.5 billion dollars of additional IMF credits (Uygur, 2001).
However, its defense for a similar situation decreased by an important amount.
The programme performance aggregates values were revised after the
November 2000 crisis. In addition, due to the surge in capital inflows more than
expected, the gap between the realized NDA stock and the NDA ceiling was
widened. Accordingly, in order to increase the operational predictability of
monetary policy, the NDA ceilings were readjusted downwards. Similarly, the NIR
floors were readjusted upwards.
However, the fragile state of confidence in the financial markets gave way
to a second financial crisis in February 2001; exchange rates boosted to very high
levels and average overnight interest rates climbed to 4,019 percent on 21 February
2001. During the first two days of the crisis, the Central Bank lost 5 billion dollars
in FX reserves. Increase in interest rate could not prevent the demand for foreign
exchange. Consequently, the CB has abandoned monetary and exchange rate
policies and shifted to a floating exchange regime on 22 February 2001 (Pre-
Accession Economic Programme 2001).
Following the financial crises in November 2000 and February 2001, the
crawling peg proved to be unsustainable and was replaced with a floating exchange
rate regime. Nevertheless external developments, in addition to the problems in the
banking sector, the payment system and the public finance, increased the
uncertainty in the Turkish economy and adversely affected the future expectations
in 2001.
101

A.3 Assessment of Turkish Economy in Terms of Copenhagen Criteria
In this part, we will evaluate Turkish economy between 1999 and 2001 in
terms of Copenhagen Criteria. The assesment and the interpretation of Turkish
economy are taken from Turkey’s Regular Report (2002). Copenhagen Economic
Criteria consist of two parts: existence of a functioning economy and the capacity to
cope with competitive pressure and market forces within the Union. We will look at
these two parts for Turkish economy separately.
A.3.1 The existence of a functioning economy
This criterion consists of five parts. And, each of these parts consists of sub-
parts.
a) Macroeconomic stability should be achieved including adequate price
stability and sustainable public finances and external accounts
1) Real GDP growth: Average real GDP growth was at around only 1% during
1997-2001. Real GDP growth was very volatile around o low trend after especially
1999.
Table A.1 Growth Rates and Demand Components (percentage change)
1999 2000 2001
GDP -4.7 7.4 -7.4
GNP -6.1 6.3 -9.4
Total Consumption -1.7 6.3 -8.9
Gross Fixed Capital Formation -15.7 16.9 -31.7
Total Domestic Demand -3.7 9.8 -18.4
Source: Pre-Accession Economic Programme 2001 and 2002
As seen in Table A.1 above, total domestic demand, which decreased by 3.7
percent in 1999, increased by 9.8 percent in 2000 due to a more stable political and
economic outlook, falling interest rates, and a sizeable real interest payments
shifting from the last year. Nevertheless, following the financial crises; the external
102

developments, in addition to the problems in the banking sector, the payment
system and the public finance increased the uncertainty in the Turkish economy and
adversely affected the future expectations in 2001. So as seen in Table A.1 above,
total domestic demand decreased by 18.4 percent in 2001. And, due to the
contraction in domestic demand, GDP declined by 7.4 percent in 2001, although it
increased by 7.4% percent in 2000.
Although it increased by 16.9 percent in 2000, gross fixed capital
investment declined by 31.7 percent in 2001 as seen in Table A.1 above. In fact,
gross fixed capital formation declined on average by 5.8% per year during 1997-
2001. These considerable fluctuations were to a large extent responsible for the high
volatility of output growth and reflect particularly short planning horizon of agents
in Turkey.
2) External accounts: Exports, growing by an annual average rate of 4.6 percent
during 1996-2000, increased by 12.8 percent in 2001 and reached 31.3 billion
dollars. The real depreciation of the Turkish Lira, a decline of 30.9 percent in dollar
terms in the unit wage index and a contraction in domestic demand were the factors
contributing to the rapid increase in exports.
Table A.2 Balance of Payments (million dollars)
1999 2000 2001
Exports (Fob) 31,667 35,528
Imports (Fob) -54,042 -39,748
TRADE BALANCE -10,443 -22,375 -4,490
CURRENT ACCOUNT BALANCE -1,360 -9,819 3,396
Source: Pre-Accession Economic Programme 2001 and 2002
In 2000, imports increased by 35.9 percent due to the real appreciation of
TL, the rise in domestic demand, and the increase in energy prices like crude oil and
natural gas. Thus, the trade deficit for 2000 increased by 12 billion dollars with
respect to 1999, recorded as 22.4 billion dollars, as seen in Table A.2 above.
Imports decreased by 25.9 percent in 2001. The contraction in domestic demand
103

and the real depreciation of TL were the main reasons for this sharp drop. As seen
in Table A.2, trade deficit decreased from 22.4 billion dollars in 2000 to 4.5 billion
dollars in 2001.
So, we can say that despite strong output fluctuations, the current account
imbalances remained limited reaching a deficit of 5.3 percent of GDP when
economy was growing strongly in 2000 and a surplus of 2.3 percent of GDP during
2001 recession. During the first half of 2002, the current account was close to
balance. The gap between the current account balance and the trade deficit
amounted to about 6% of GDP during 1997-2001 and was usually filled in nearly
equal parts by tourism revenues and workers remittances.
3) Unemployment: In 2001, population growth is significantly above the economic
growth, leading to a marked decline in per capita income. GDP per capita in
purchasing power standards was only 22% of the EU average in 2001.
TABLE A.3 Developments in Labor Market (Thousands) URBAN RURAL TOTAL
2000 2001 2000 2001 2000 2001
1. Non-institutional civilian
population 39047 40232 25012 24806 64059 65038
2.Non-institutional civilian
population (15+age) 27647 28608 17118 17094 44765 45702
3. Labor force (thousand people) 12071 12380 9960 9889 22031 22269
3.1. Employment 11013 10953 9566 9414 20579 20367
3.1.1 Underemployed 894 807 626 531 1520 1338
3.2. Unemployed 1059 1427 394 475 1452 1902
4.Population not in labor
force (thousand people) 15576 16228 7158 7205 22734 23433
5. Labor force participation rate 43.7 43.3 58.2 57.9 49.2 48.7
6. Unemployment rate (per cent) 8.8 11.5 4.0 4.8 6.6 8.5
6.1. Of persons<25 years 8.4 13.2 16.6
6.2. Of persons>=25 years 2.5 4.5
Source: SIS
104

According to the results of the Household Labor Force Survey by the State
Institute of Statistics (SIS), as seen in Table A.3, the labor force participation rate,
which was 49.2 per cent in 2000, decreased to 48.7 in 2001. Also it can be observed
from the table that, in 2001 total employment decreased by 212 thousand people, 60
thousand of which was from urban areas, 152 thousand was from rural areas.
The unemployment rate increased from 6.6 per cent in 2000 to 8.5 in 2001.
If we look at the Table A.3, it can be observed that, unemployment in rural areas
remained relatively low between 2000-2001, 4-5% on average with strong seasonal
fluctuations. For example, in the first quarter of 2001, unemployment in rural areas
was 5.6 per cent while in the second and third quarters it was 2.7 and 3.9 per cent
respectively. But, again from the results of Household Labor Force Survey by the
SIS, seasonal workers in the first quarter of 2001 was 1120 thousand people while it
was 166 and 175 thousand people in the second and third quarters of the same year.
Since, seasonal workers are in the group of ‘population not in labor force’, in the
first quarter of 2001 the unemployment rate was higher than the in other quarters of
the same year.
The unemployment rate increased in 2001 in urban areas, where industrial
activities are concentrated, particularly due to the lay-offs, and the rate became 11.5
per cent. That is, unemployment increased in urban areas more than the increase in
rural areas in 2001.
Youth employment (below the age 25) rose to 16.6 per cent in 2001, while it
was 13.2 per cent in 2000. In the EU’s evaluation for Turkey, it is said that the main
factor behind this rise in unemployment is the sharp economic crisis in combination
with restructuring interbanking sector and the state-owned enterprises.
4) Inflation: In 2002 Regular Report for Turkey, it is said that ‘despite some recent
progress, inflationary pressures have remained high and volatile’. Persistently high
inflation has been one of the major weakness of the Turkish economy. Average
inflation stood at close to 70% between 1997 and 2001. In 2000, the disinflation
initiative using a crawling peg exchange rate regime as a nominal anchor and
linking public sector wages to inflation targets helped to bring down inflation to
33% by February 2001. After the breakdown of the exchange rate regime, inflation
started to increase. The 12-month increases in the Wholesale Price Index (WPI) and
the Consumer Price Index (CPI) were 88.6 per cent and 68.5 per cent respectively,
in 2001. The main reasons behind the substantial rise in inflation rates with respect
105

to the previous year could be stated as: the failure to restore confidence in the
markets after the switch to the floating exchange arte regime following the February
2001 crisis, the long duration of uncertainty and its impact on exchange and interest
rates, and the high rate of price adjustments made by the government.
5) Sustainability of public finances: In 2002 Regular Report for Turkey, it is said
that ‘attempts to achieve sustainable public finances were impeded by rising
financing costs and extraordinary events, such as the earthquakes in 1999 and the
banking crisis in 2001’.
Table A.4 Consolidated Budget Balance (Per Cent of the GDP)
1999 2000 2001
Expenditures 36.3 37.7 44.3
Non-interest Expenditures 22.4 21.3 21.7
Current Expenditures 11.8 10.9 11.2
Investment 2.0 2.2 2.3
Transfers 22.4 24.6 30.8
Non-interest transfers 8.6 8.2 8.2
Interest Payments 13.8 16.4 22.6
Revenues 24.3 26.7 28.6
General Budget 24.0 26.4 28.2
Tax Revenues 19.1 21.3 21.9
Non-Tax Revenues 2.4 2.8 4.1
Special Revenues and Funds 2.5 2.4 2.2
Budget Deficit -12.0 -11.0 -15.7
Source: Pre-Accession Economic Programme 2002
The budget of 2001 was prepared with the aim of increasing the primary
surplus and ensuring debt sustainability. To this end, measures to increase revenues
and provide discipline on expenditures were introduced at the end of 2000 and
2001, in line with the economic programme. Within this framework, restrictive
measures, such as limiting public recruitment and decreasing non-interest
106

expenditures in real terms, were taken. In addition, the measures to increase
revenues put into force in 2000 were sustained in 2001. In view of rising financial
needs, tax rates have been increased, tax exemptions have been removed and
measures to reduce tax evasion and to increase the efficiency of the tax
administration have been adopted. So, as seen in Table A.4, the share of revenues in
GDP rose from 24.3% in 1999 to 28.2% in 2001.
However, despite successful measures, public finances have been
characterized by a very high and very volatile budget deficit, fluctuating between
12% and 15.7% of GDP. The sharp increase in the deficit in 2001 reflects mainly
the one-off impacts of financial crisis and of absorbing the accumulated costs of
agricultural support. Besides one-off effects, such as the fiscal costs of the
earthquakes in 1999 or of restructuring the banking sector after the financial crisis
in 2001, the most important structural factor behind this pattern has been interest
payments, fluctuating between 13.8% and 22.6% of GDP.
6) Government debt: Government debt has risen markedly after the financial
crises. According to the EU accounting standards the general government gross
debt, rose from 55.6% of GDP in 1997 to 102.4% in 2001. The sharp increase by 45
percentage points in 2001 is to a large extent the result of the costs of financial
crises. Besides a considerable deficit, the biggest impact on the debt level come
from the depreciation, which increased the weight of foreign currency debt by 17
percentage points. The costs of bailing out insolvent private banks added another
7.5 percentage points to the government gross debt.
7) Fiscal transparency: According to Turkey’s Regular Report for Turkey (2002),
the recently adopted laws on public procurement, financial management and
financial control are seen as a big step forward in order to bring Turkish legislation
in line with international standards. Public procurement law adopted on January 4,
2002 which (i) adopting the international standards, (ii) setting the framework for
international competition, (iii) establishing a public procurement agency mainly in
charge of preparing the legislation and investigating the complaints about any
tender until the signing of the contract (Pre-Accession Economic Programme 2002).
In 2002 Regular Report, it is said that ‘increased fiscal transparency has contributed
to a less favorable, but more realistic picture of the situation of public finances’.
The reforms led to the establishment a public procurement agency and of an office
for debt and risk management. Furthermore, previously extra-budgetary funds have
107
been re-integrated into the public sector and previously unrecorded financial
transactions are now explicitly treated. By 2002, the more than 60 extra-budgetary
funds have been reduced to only five (the Social Aid and Solidarity Fund, the
Defence Fund, the Promotion and Publicity Fund, the Savings Deposit and
Insurance Fund and the Privatization Fund) accounting about 1.5 of GDP.
b) Equilibrium between demand and supply is established by the free
interplay of market forces; prices, as well as trade, are liberalized
1) Free interplay of market forces: In the 2002 Regular Report for Turkey it is
said that the free interplay of market forces has improved in Turkey. Due to the
Turkey’s tradition of a state-guided development approach, state interventions and
state-owned enterprises tended to play important role in the economy, in particular
in basic industries and in the banking sector. During the last five years, the political
influence on state banks has been reduced, more prices are now based on supply
and demand, and the liberalization of important markets has started. Also, the
establishment of independent market regulatory and competition surveillance
institutions has increased the role of market forces for allocating scarce economic
resources. However, as said in the last regular report, these developments are not
enough, the process is not yet fully completed.
2) Price distortions: In Turkey, agricultural support prices created price distortions.
The system of agricultural support prices, which had led to major distortions in the
price structure has been largely eliminated. This is done by sugar and tobacco laws.
Tobacco Law No. 4733, effective as of 2002, (i) Facilitating the privatization of
state monopoly’s production, (ii) Establishing a new independent regulatory body,
(iii) No more purchasing by the state at official support prices and free
determination of the prices by the producers and the market. Sugar Law No. 4634,
effective as of 2001, (i) Facilitating the privatization of sugar production factories,
(ii) Establishing a new independent regulatory body, (iii) No more purchasing by
the state at official support prices and free determination of the prices by the
producers and the factories (Pre-Accession Economic Programme 2002).
3) Privatization: Turkey’s privatization process started back in the early 1980s.
Due to unfavorable market conditions and a lack of interest from potential
investors, recent attempts have had very limited success. Accumulated privatization
revenues since 1985 amounted to only about 3% of GDP. The legal framework for
privatization has been improved. Especially by the law to fully implement the
108

international arbitration amendment on June 21, 2001. The Constitution has been
amended to allow for international arbitration and the privatization of energy
companies. New laws to reform the sugar, tobacco, electricity and gas markets now
provide for the privatization of the former sector monopolies.
c) Significant barriers to market entry and exit are absent
Overall, the Turkish economy is characterized by rather high number of
market entries and exists. This points not only to the high flexibility of Turkish
entrepreneurs but also to a liberal regime of market access. However, prohibitively
high interest rates and the reluctance of banks to provide credit to the private sector
impede the establishment of SMEs. But, the process of being opened up to market
competition of the markets such as electricity, gas, tobacco, alcohol and sugar,
formerly state-dominated areas, is a big step in reducing the remaining market
barriers. Also, the disclosure of 19 non-viable banking institutions has made
positive effect on EU opinion about Turkey.
d) The legal system, including the regulation of property rights, as in place;
laws and contracts can be enforced
In 2002 Regular Report, it is said that the legal system, including the
regulation of property rights, is in place, however, the implementation of laws and
contracts needs to be improved. They find Turkey’s bureaucratic procedures slow.
Time lags between the adoption of framework legislation and of the actual
implementation regulations are very long and also impede the effectiveness and
predictability of the legal framework.
e) The financial sector is sufficiently well developed to channel savings
towards productive investment
1) According to EU’s opinion about Turkey, from last regular report, the financial
sector in Turkey has not finished the process of consolidation yet. In Turkey, the
banking sector expanded rapidly in 1990s, benefiting from high public-sector
financing requirements and loose financial market regulations and supervision.
Banking sector deposits rose from around 45% of GDP in 1997 to about 62% of
GDP in 2001, while banking sector assets rose from around 80% to close to 100%
of GDP. Since many of the private banks are part of family-owned enterprise
groups, compliance with prudential and transparency standards is difficult to assess.
Their lending inside the enterprise group is not always in line with market
principles.
109

2) During 2000, increasing tensions in the financial markets revealed major
systematic weakness. As we mentioned in section 2 above, two major financial
crises erupted in 2000-2001. In order to address the banking sector’s weakness, a
major financial effort was necessary to restructure the financing profile of the
troubled banks and to strengthen the sector’s capital base. Political interference with
the lending of state banks to specific sectors, such as agriculture and SMEs, was
reduced last year. Because the law on state banks, July 3, 2001, removes all
legislation permitting state banks directly carrying out social policies without prior
and adequate funding from the budget. The costs of bailing out the banking sector
have led to a sharp increase in the public sector debt ratio. The authorities are
restructuring the state banks and prepare them for privatization.
3) According to 2002 regular report for Turkey, the non-banking financial sector
plays a very limited role. It consists of 70 insurance companies. Furthermore, there
are some 30 investment companies and about 270 funds.
A.3.2 The Capacity to Cope with Competitive Pressure and Market Forces
within the Union
a) The existence of a functioning market economy, with a sufficient degree
of macroeconomic stability for economic agents to make decisions in a climate of
stability and predictability
In 2002 Regular Report for Turkey, it is said that ‘despite progress in
strengthening the functioning markets and institutions, macroeconomic stability has
not been achieved’. In order to achieve a macroeconomic stability, political stability
is necessary. However, in Turkey, political instability has hindered economic
stabilization. Inflationary pressures and overall economic volatility are still high to
allow economic agents to make decisions in a climate of stability and predictability.
b) A sufficient amount, at an appropriate cost, of human and physical
capital, including infrastructure, education and research, and future
developments in this field
1) Investment in human capital is insufficient in Turkey. In Turkey, population
growth is high but, the budgetary allocations for meeting the need for education and
health care is limited. Annual public spending on education was around only 4% of
GDP during 1997-2001. This is mainly because of the crowding out of budgetary
110

expenditures by interest payments. However, despite fiscal constraint, important
efforts to improve basic education have been made in recent years. For example, the
period of compulsory schooling was increased from 5 to 8 years in 1997.
2) The share of investment in GDP declined from 26.4% in 1997 to 17.8% of GDP
in 2001. This development could have a negative impact on Turkey’s economic
growth potential.
3) According to 2002 Regular Report, infrastructure investment in Turkey is very
much unevenly distributed. Turkey’s infrastructure is characterized by a rather well
developed road network, in particular in industrial core areas in the western part of
the country.
4) Turkey’s transition from an agricultural to a service-oriented economy has
continued.
Table A.5 Structure of Production (% of gross value added)
1999 2000 2001
Agriculture 14.5 13.6 12.1
Industry (excluding construction) 22.0 22.6 23.8
Construction 5.3 5.0 4.8
Services 58.2 58.8 59.3
Source: 2002 Regular Report for Turkey
As seen in Table A.5 above, percentage of agriculture in gross value added
decreased from 14.5% in 1999 to 12.1% in 2001. If we look at services sector we
can see that its share rose from 58.2% in 1999 to 59.3% in 2001.
A similar pattern can be observed in terms of employment, although the
share of employment in agriculture is still high. As seen in Table A.6 below, during
1999-2001 period, employment in agricultural sector declined from 41.4% in 1999
to 32.6% in 2001, while the share of employment in the service sector rose from
41.9% in 1999 to 48.5% in 2001 and share of industry rose from 16.7% in 1999 to
18.9% in 2001.
111

Table A.6 Developments in Domestic Labor Market
1999 2000 2001
(000) % of total (000) % of total (000) % of total
Agriculture 8872 41.4% 7187 34.9% 6639 32.6%
Industry 3580 16.7% 3733 18.1% 3849 18.9%
Services 8962 41.9% 9658 46.9% 9878 48.5%
Employment 21413 100% 20579 100% 20367 100%
Source: Pre-Accession Economic Programme 2001 and 2002
c) The proportion of small firms, partly because small firms tend to
benefit more from improved market access, and partly because a dominance of
large firms could indicate a greater reluctance to adjust
Despite the importance of big export-oriented companies and state
enterprises, small and very small enterprises, with less than 250 employees are the
core of the Turkish economy. Benefiting from cheap inputs from the informal
economy, these enterprises provide crucial overall stability for the high volatile
Turkish economy.
d) The extent to which government policy and legislation influence
competitiveness through trade policy, competition policy, state aid, etc.
State interference in the economy started to decline. From 2002 Regular
Report, we can see that EU also accepts this fact. Deregulation of important
markets, such as energy and telecommunication has led to significant reduction in
state interference.
e) The degree and the pace of integration a country achieves with the
Union before enlargement. This applies both to the volume and the nature of
goods already traded with member states
Turkey has made nearly half of its exports and imports with EU countries. In
fact, when preparing the establishment of the Customs Union between the EC and
Turkey, trade restrictions were dismantled gradually, which led to a marked
increase in bilateral trade. Imports with EU countries declined from 48.8% of total
imports to 45.2% in 2001. The decline in imports is largely related to the economic
crises in 1999 and 2000.
112

A.4 Evaluation of Economic Situation of Turkey in terms of Maastricht
Criteria
We mentioned from Maastricht Criteria in Chapter 3. Maastricht Criteria are
not prerequisites for the membership. However, for Turkey, which targeted the EU
membership, although it is not under such a responsibility, it tries to converge these
criteria. Because, these criteria are not only the expectation of EU membership, but
also, in terms of long-term benefits and necessity of functioning market economy.
In this part we will apply Maastricht Criteria to Turkey.
Table A.7 Maastricht Convergence Criteria in 2001 Countries
Inflation*
Nominal long
Term interest rate
National Deficit
(% of the GDP)
Gross Debt
(% of the GDP)
Belgium 2.4 5.1 -0.1 107.0
Denmark 2.4 5.1 2.2 43.2
Germany 2.4 4.8 -2.5 60.0
Greece 3.7 6.3 0.0 100.4
Spain 3.5 5.1 0.1 58.0
France 1.8 5.0 -1.5 57.1
Ireland 4.0 4.9 2.4 34.4
Italy 2.3 5.2 -1.2 108.2
Luxembourg 2.4 4.9 4.3 5.1
Netherlands 5.1 5.0 1.3 51.8
Austria 2.3 5.1 -0.2 62.3
Portugal 4.4 5.2 -2.0 53.5
Sweden 1.0 5.1 3.8 52.3
UK 2.1 4.9 1.2 39.3
TURKEY 45.6 94.6 15.1** 122.8
Source: State Planning Organization *: For Member States Adjusted Consumer Price Index, for Turkey Consumer Price Index **: Consolidated Budget, Local Government, Social Security Fund, Revolving Funds, Unemployment Funds
113

From State of Planning Organization publication (2002), Table A7, we can
see the Turkey’s and the Member States’ economic situations according to
Maastricht Criteria.
a) The first criterion: The average rate of inflation should not exceed by
more than 1.5% that of the three best-performing member states in terms of price
stability. For this criterion, the three best-performing member states in terms of
price stability are: France, Sweden and United Kingdom.
Their inflation rates average is: (1.8+1.0+2.1)/3=1.6
The reference value: 1.6+1.5=3.1
This means that the inflation rate of a country should not exceed 3.1 in order
to converge. As seen in TableA.4, member states’ inflation rates are close to this
number. Even Portugal’s inflation rate is 4.4. However, Turkey’s inflation rate is
much more than 3.1, which is 45.6.
Member States achieved these low inflation rates mainly by giving
importance to two things, which are: (i) the independence of Central Banks and (ii)
no extension of credit to public sector. For example, financing public sector by
central bank was prohibited in 1990 in Portugal, in 1992 in Italy by laws (IKV,
1997). In Turkey, in line with the changes in EU norms and international central
banking practices, a new Central Banking Law, no 4651, was enacted in May 2001
(Pre-Accession Economic Programme 2002). The major changes in the Central
Banking Law can be summarized as follows: Instrument Independence,
Accountability and Disclosure to the Public, The Monetary Policy Committee, No
Extension of Credit to the Public Sector, Lender of Last Resort and Supervision of
Financial and Payment Systems.
b) The second criterion: The national deficit should be no more than 3 %of
GDP. No country's outstanding debt should be more than 60 % of its GDP. If we
look at TableA.7, we can easily see that almost all member states’ national deficit
are no more than 3% of their GDP. However, in Turkey, in 2001, the national
deficit was 15.1% of GDP. That is, Turkey is very far away from this criterion too.
c) Third criterion: An average nominal long-term interest rate that does not
exceed by more than 2 % that of, at most, the three best performing member states
in terms of price stability. For evaluation of this criterion, 10-year government
bonds’ interest rates are taken. Their 12-month period average is taken into account.
For calculating the reference value, first of all, the three best performing member
114

states in terms of price stability are taken, which are: Sweden, France and United
Kingdom. Then, their long-term nominal interest rates average is taken, which is:
(5.0+4.9+5.1)/3=5
The reference value: 5+2=7
As seen in Table A.7, all member states satisfy this criterion, however if we
look at Turkey’s long-term nominal interest rate, which was 94.6, it is much more
higher than the reference value.
d) Fourth criterion: ‘No country’s outstanding debt should be more than
60% of its GDP’. As seen in TableA.7, except Belgium, Greece and Italy, all
member states satisfy this criterion. If we look at Turkey’s gross debt, it was 122.8
per cent of GDP in 2001. It is very high if we think the convergence criterion. That
is, Turkey is far away from this criterion.
A.5 Conclusion
Turkey has not yet fulfilled Copenhagen Economic Criteria. In 2002
Regular Report, it is said that ‘Turkey has made progress on the functioning of its
market economy which should improve its capacity to cope with competitive
pressure and market forces within the Union, but still undergoing the consequences
of the two deeply destabilizing financial crises’.
However, Turkey has adopted key structural reforms, which are likely to
contribute to future macroeconomic stabilization. But, in some areas,
implementation of these new laws and contracts are slow. Political interference, a
main source for Turkey’s economic instability, has been reduced and structural
weakness, such as fragile and distorted banking sector, are being addressed. As said
in 2002 Regular Report and as seen in evaluations above, financial crises have a big
impact on the deteriorated market situation. This deteriorated market situation of
Turkey can be seen from the application of Maastricht Criteria.
115