Praxis and politics of urban data: Building the Dublin Dashboard
19
Praxis and Politics of Urban Data: Building the Dublin Dashboard Rob Kitchin, Sophia Maalsen and Gavin McArdle NIRSA, Maynooth University
-
Upload
robkitchin -
Category
Technology
-
view
731 -
download
0
Transcript of Praxis and politics of urban data: Building the Dublin Dashboard

Praxis and Politics of Urban Data: Building the Dublin Dashboard
Rob Kitchin, Sophia Maalsen and Gavin McArdleNIRSA, Maynooth University

Data-driven urbanism
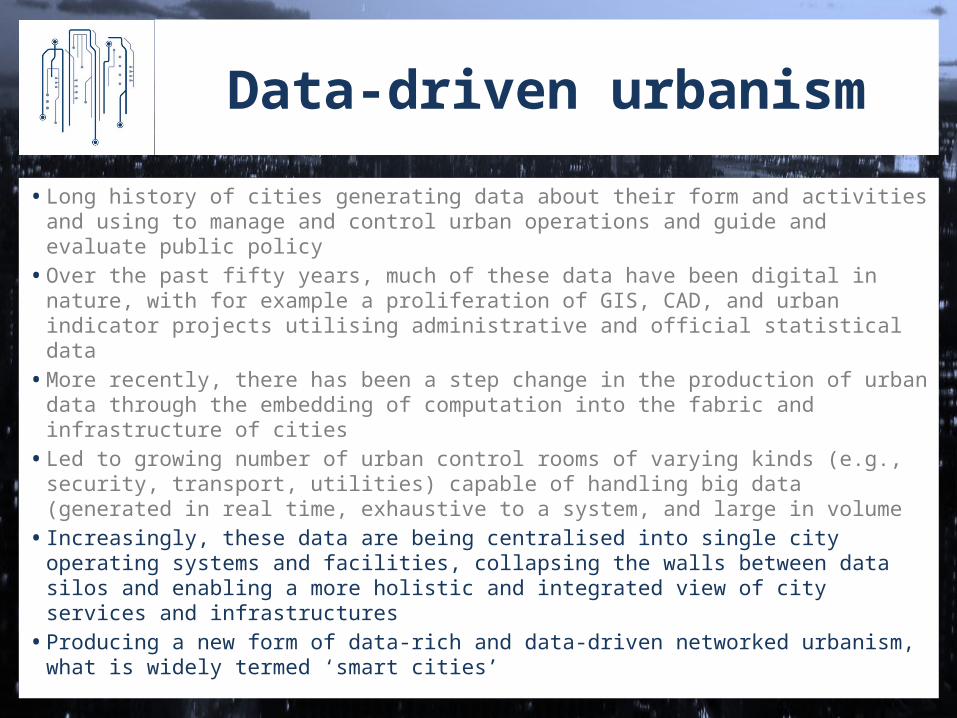
• Long history of cities generating data about their form and activities and using to manage and control urban operations and guide and evaluate public policy
• Over the past fifty years, much of these data have been digital in nature, with for example a proliferation of GIS, CAD, and urban indicator projects utilising administrative and official statistical data
• More recently, there has been a step change in the production of urban data through the embedding of computation into the fabric and infrastructure of cities
• Led to growing number of urban control rooms of varying kinds (e.g., security, transport, utilities) capable of handling big data (generated in real time, exhaustive to a system, and large in volume)
• Increasingly, these data are being centralised into single city operating systems and facilities, collapsing the walls between data silos and enabling a more holistic and integrated view of city services and infrastructures
• Producing a new form of data-rich and data-driven networked urbanism, what is widely termed ‘smart cities’

Data-driven urbanism
Data-driven urbanism
• Long history of cities generating data about their form and activities and using to manage and control urban operations and guide and evaluate public policy
• Over the past fifty years, much of these data have been digital in nature, with for example a proliferation of GIS, CAD, and urban indicator projects utilising administrative and official statistical data
• More recently, there has been a step change in the production of urban data through the embedding of computation into the fabric and infrastructure of cities
• Led to growing number of urban control rooms of varying kinds (e.g., security, transport, utilities) capable of handling big data (generated in real time, exhaustive to a system, and large in volume
• Increasingly, these data are being centralised into single city operating systems and facilities, collapsing the walls between data silos and enabling a more holistic and integrated view of city services and infrastructures
• Producing a new form of data-rich and data-driven networked urbanism, what is widely termed ‘smart cities’

Urban Dashboards
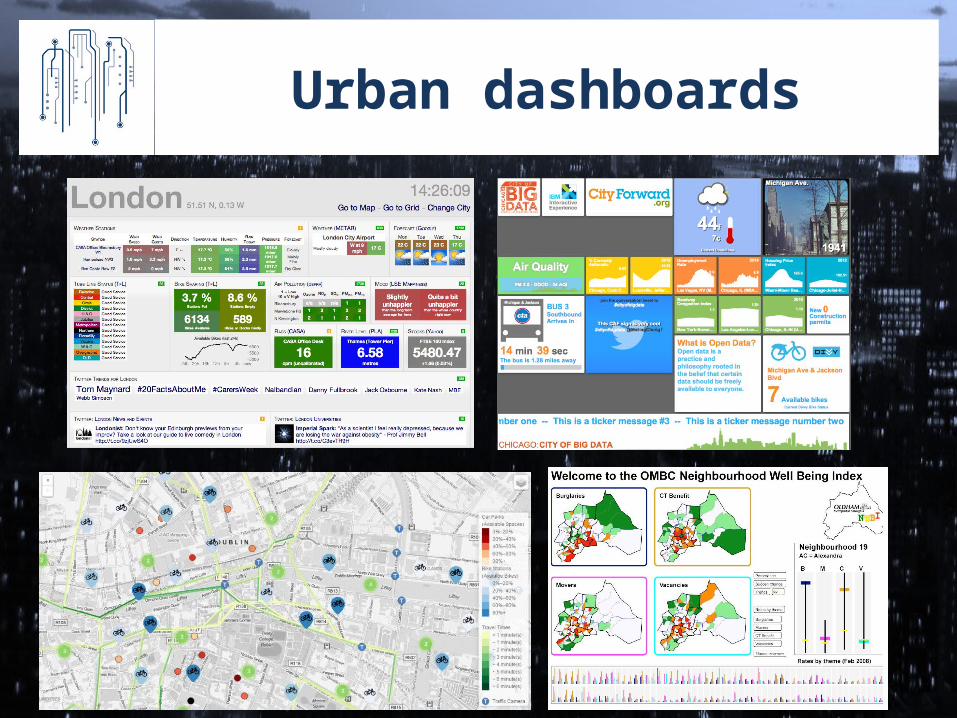
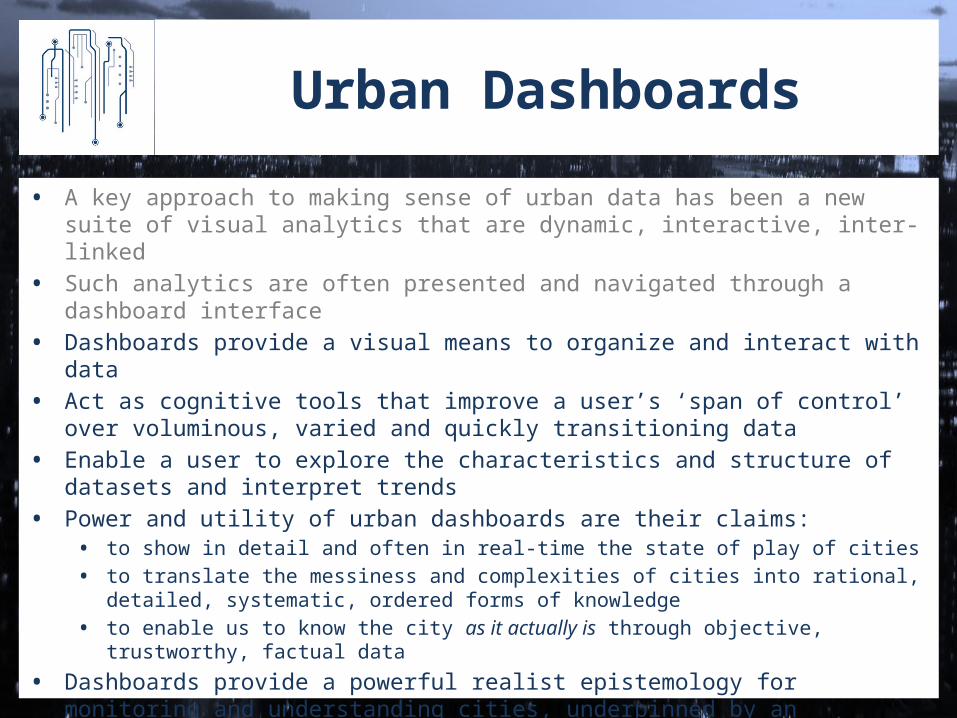
• A key approach to making sense of urban data has been a new suite of visual analytics that are dynamic, interactive, inter-linked
• Such analytics are often presented and navigated through a dashboard interface
• Dashboards provide a visual means to organize and interact with data• Act as cognitive tools that improve a user’s ‘span of control’ over
voluminous, varied and quickly transitioning data • Enable a user to explore the characteristics and structure of datasets and
interpret trends• Power and utility of urban dashboards are their claims:
• to show in detail and often in real-time the state of play of cities• to translate the messiness and complexities of cities into rational, detailed,
systematic, ordered forms of knowledge• to enable us to know the city as it actually is through objective, trustworthy,
factual data
• Dashboards provide a powerful realist epistemology for monitoring and understanding cities, underpinned by an instrumental rationality in which ‘hard facts’ trumps other kinds of knowledge and provide the basis for formulating solutions to urban issues
Urban dashboards
Urban Dashboards
• A key approach to making sense of urban data has been a new suite of visual analytics that are dynamic, interactive, inter-linked
• Such analytics are often presented and navigated through a dashboard interface
• Dashboards provide a visual means to organize and interact with data• Act as cognitive tools that improve a user’s ‘span of control’ over
voluminous, varied and quickly transitioning data • Enable a user to explore the characteristics and structure of datasets and
interpret trends• Power and utility of urban dashboards are their claims:
• to show in detail and often in real-time the state of play of cities• to translate the messiness and complexities of cities into rational, detailed,
systematic, ordered forms of knowledge• to enable us to know the city as it actually is through objective, trustworthy,
factual data
• Dashboards provide a powerful realist epistemology for monitoring and understanding cities, underpinned by an instrumental rationality in which ‘hard facts’ trumps other kinds of knowledge and provide the basis for formulating solutions to urban issues

Urban Dashboards
• Realist epistemology and instrumental rationality of urban dashboards has been critiqued from a number of perspectives. • First, dashboards are not neutral, technical, commonsensical tools, rather
dashboards are the product of a diverse set of ideas, instruments, practices, contexts, knowledges and systems; constitute a data assemblage
• Second, dashboards act as translators and engines rather than mirrors, deploying a communicative protocol that frames how data are visualised and thus what the user can see and engage with and what questions can be asked
• Third, dashboards are reductive, atomizing complex, contingent relationships into relatively simple visualized measures that obscures the multidimensional nature of cities and decontextualizes a city from its history, its political economy, its wider set of social, economic and environmental relations and interconnections/interdependencies
• In this paper we want to focus on the first, examining the contention that a dashboard constitutes a data assemblage that unfolds in contextual, contingent and iterative ways
• We do so through a detailed case study of the development of the Dublin Dashboard, an extensive, open, analytical dashboard launched in September 2014
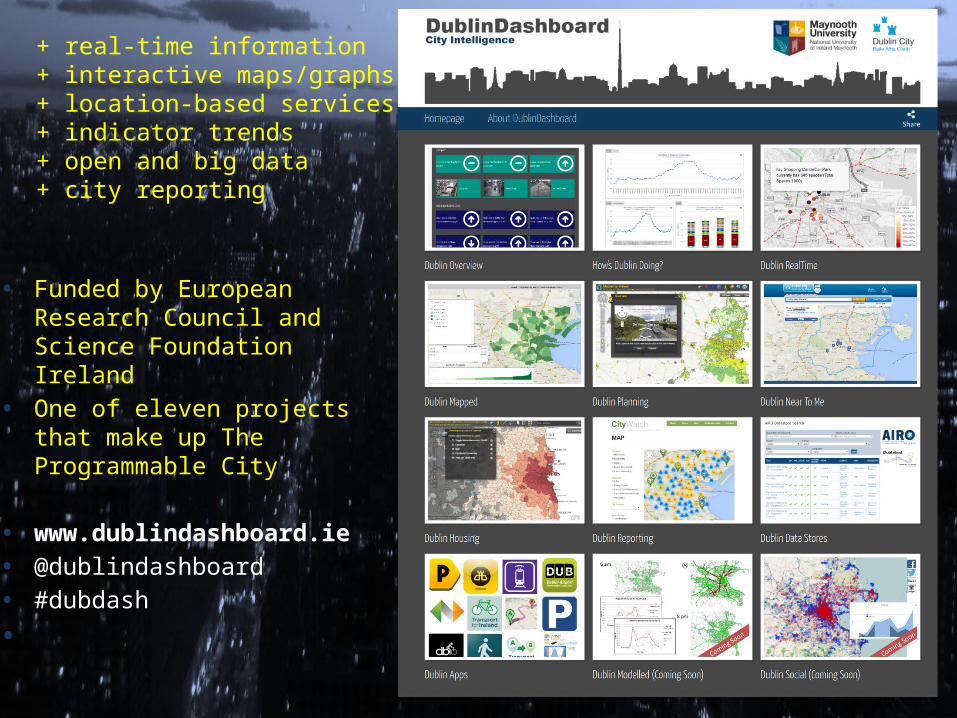
• Funded by European Research Council and Science Foundation Ireland
• One of eleven projects that make up The Programmable City
• www.dublindashboard.ie• @dublindashboard• #dubdash
•
+ real-time information+ interactive maps/graphs+ location-based services+ indicator trends+ open and big data+ city reporting

Method/empirical material
• Combination of participant observation (18 months; two lead developers) and ethnography (six months, ethnographer)
• Two developers attended all internal meetings (c. 20 mostly informal meetings arranged on an ad hoc basis) and external meetings (14 formally arranged meetings with stakeholders and interested parties)
• Ethnographer attended 7 external meetings and 6 internal meetings and conducted an interview with one of the lead developers
• In all cases, the ethnographer acted as an observer at meetings, taking notes with regards to the conversations and decisions taken, with just one internal meeting and the interview voice recorded
• All email exchanges between participants were archived• One paper presentation and whole of the launch event was video
recorded
Building the dashboard
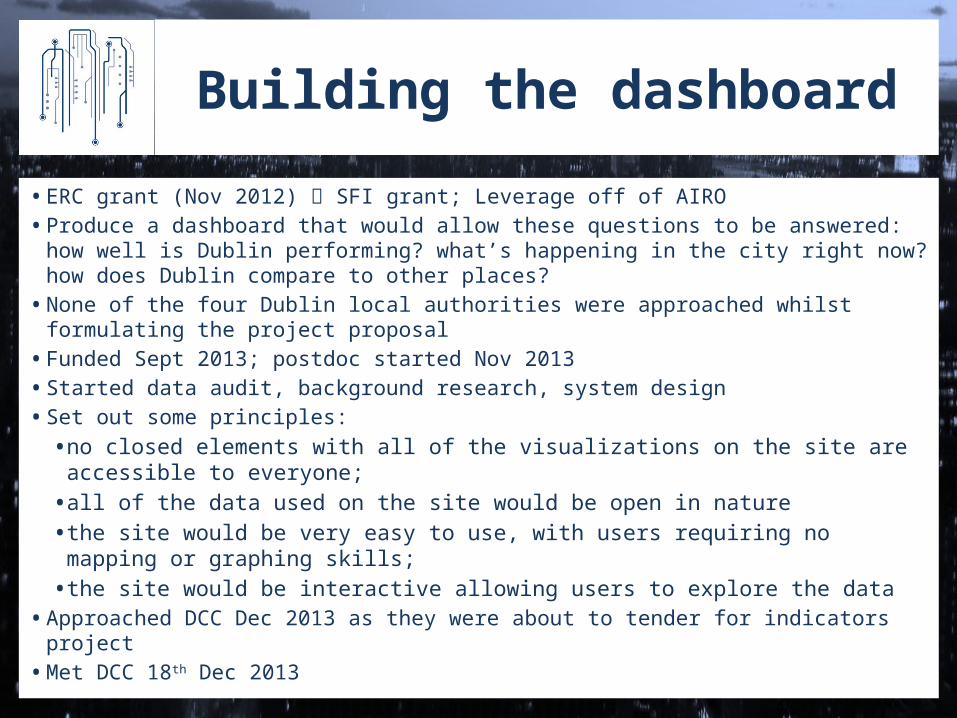
• ERC grant (Nov 2012) SFI grant; Leverage off of AIRO• Produce a dashboard that would allow these questions to be answered: how
well is Dublin performing? what’s happening in the city right now? how does Dublin compare to other places?
• None of the four Dublin local authorities were approached whilst formulating the project proposal
• Funded Sept 2013; postdoc started Nov 2013• Started data audit, background research, system design• Set out some principles:
• no closed elements with all of the visualizations on the site are accessible to everyone;
• all of the data used on the site would be open in nature• the site would be very easy to use, with users requiring no mapping or
graphing skills; • the site would be interactive allowing users to explore the data
• Approached DCC Dec 2013 as they were about to tender for indicators project• Met DCC 18th Dec 2013

Building the dashboard
• Reconvened with DCC in February; discussion concerning data, desired indicators, scope, etc
• Shortly afterwards reconfigured scope of dashboard to be able to answer these questions: where are the nearest facilities/services to me? what are the spatial patterns of different phenomena? what are the future development plans for the city? how do I report issues about the city? how can I freely access data about the city?
• Two new principles: • as much data as possible, regardless of source or type, would be made available
through the site; • existing resources and apps would be used if they did a good job to remove duplication
of effort
• Over next few months spent iteratively planning and building the dashboard. Included: • on-going negotiation and decision making with respect to data set inclusion• reworking of site organization and playing with the look and feel of the interface • Email, phone exchanges and meetings with data holders • liaising with DCC offices to try and source data sets or hunting through websites to
discover data or interesting existing data visualisation projects for the city• Meeting with other stakeholder and interested companies
• Launched Sept 2014

Building the dashboard

Unpacking the Dublin Dashboard
• The story of the initiation and building of the Dublin Dashboard reveals a number of things about the nature of dashboards, their development and operation
• First, the dashboard is not simply a technical assemblage of networked infrastructure, hardware, operating systems, assorted software, data and an interface achieved through neutral, objective processes of scientific conception, engineering and coding
• Rather, the dashboard is a complex socio-technical assemblage of actors and actants that work materially and discursively within a set of social and economic constraints, existing systems, and power geometries to assemble, produce and maintain the website

Unpacking the Dublin Dashboard
• Second, the production, maintenance and on-going research and development of dashboards unfold contingently and relationally
• Dashboards that provide partial, always incomplete solutions to relational problems
• They are ontogenetic in nature, constantly in a state of becoming, evolving through a series of individuations and transductions; emerge citationally through a series of provisional answers to relational questions
• Provisional answers are contingent on the wider context in which the dashboard is emerging, and are negotiated, contested, implemented, rescinded, re-instated and re-visioned
• Moreover solutions are enacted through the performativity of actors whom have varying subjectivities, personalities, knowledges and agendas, and are working together within specific social and institutional relations and settings, and are shaped by the capacities of other actants (e.g., the functionality and malleability of software; the data stock within repositories)

Unpacking the Dublin Dashboard
• Third, the praxis and politics of creating a dashboard has wider recursive effects
• Just as building the dashboard was shaped by the wider institutional landscape, producing the system inflected that landscape, sometimes in profound ways
• The discussions concerning the dashboard produced reflexivity within DCC about its data production and management and its wider smart cities strategy
• At the same time, our engagement with DCC and other state agencies altered our thinking with respect to the parameters, design and approach being taken and our perception of the issues and tasks at hand
• It also inflected our wider thinking on smart city technologies and most specifically their messy and contested visioning and deployment by and within local authorities

Unpacking the Dublin Dashboard
• Fourth, the data, configuration, tools, and modes of presentation of a dashboard produce a particularised set of spatial knowledges about the city
• Whilst the dashboard might seek to show the city as it actually is, it is inevitably partial and limited
• Dashboards only visualize a sample of the data that exists with respect to the city
• Further, how the data can be presented is mutable• Dashboards provide oligoptic views of the world: views from
certain vantage points, using particular tools, rather than an all-seeing view
• Moreover, even when seemingly fixed and static as a published website, the dashboard continues to be ontogenetic in nature. When one interacts with a dashboard its technicity is evoked in context and in conjunction with the user to generate a particular spatiality, an instance of code/space

Conclusion
• Urban data is proliferating, as are ways to make sense and act on those data
• Urban dashboards are one way to collate, process, visualize, analyze and share urban data, and are becoming more common
• Their power is their assumed realist epistemology and instrumental rationality, and their supposed ability to translate the messiness and complexities of cities into rational, detailed, systematic, ordered forms of knowledge; to enable us to know the city as it actually is
• This paper has provided a critique of such a view by unpacking the building of the Dublin dashboard, revealing the praxis and politics of urban data and dashboards
• Dashboards, it has been argued, are complex socio-technical assemblages that are contingently, relationally and contextually emergent
• However, rather than opposing dashboards, alternatively we advocate re-imagining, explicitly recognizing their inherent politics, praxes and contingencies
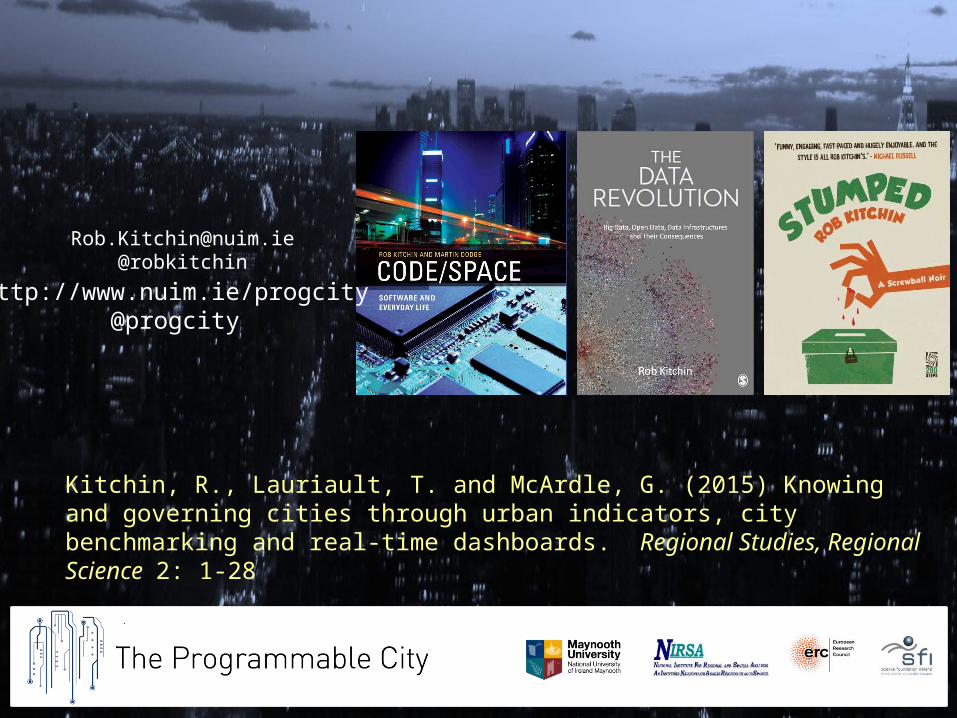
[email protected]@robkitchin
http://www.nuim.ie/progcity@progcity
Kitchin, R., Lauriault, T. and McArdle, G. (2015) Knowing and governing cities through urban indicators, city benchmarking and real-time dashboards. Regional Studies, Regional Science 2: 1-28