PRAMS 1993-1995 Surveillance Report Pregnancy Risk ... · PDF filePregnancy Risk Assessment...
50
1 PRAMS 1993-1995 Surveillance Report Pregnancy Risk Assessment Monitoring System
Transcript of PRAMS 1993-1995 Surveillance Report Pregnancy Risk ... · PDF filePregnancy Risk Assessment...

1
PRAMS 1993-1995 Surveillance Report
Pregnancy Risk Assessment Monitoring System

2
Table of Contents I. Introduction II. Overview of PRAMS Surveillance Report III. Questionnaire Design IV. PRAMS Highlights V. Unintended Pregnancy VI. Birth Control Use Before and After Pregnancy VII. Prenatal Care
a. Barriers to Prenatal Care b. Sources of Prenatal Care c. Method of Payment d. Educational Components
VIII. Health Risk Behaviors
a. Drinking Before and During Pregnancy b. Smoking Before and During Pregnancy c. Smoking After Delivery
IX. Psychosocial Stressors a. Stressors b. Social Support c. Violence
X. Well Baby Care a. Desired number of visits b. Source of Well Baby Care
XI. Breastfeeding a. Early Post-partum period b. Reasons for not breastfeeding
XII. Economic Status a. Sources of Family Income b. Medicaid Status – Beginning of Pregnancy and At time of Delivery
XIII. Technical Notes

3
a. Sampling Design b. Estimating standard errors c. Weighting of data d. Response Rates

4
Introduction
The Pregnancy Risk Assessment Monitoring System (PRAMS) was developed in 1988 by the
Centers for Disease Control and Prevention (CDC) to assess the impact of maternal behavior,
both before and during pregnancy, as well as access to and comprehensiveness of prenatal care
on pregnancy outcomes and the health of the newborn infant.
New York State received funding from a cooperative agreement with CDC and began data
collection in June 1993. The PRAMS survey is designed to collect data on live births to women
who live in New York State, excluding New York City. The PRAMS questionnaire is sent out
two to six months after delivery to a sample of approximately 200 mothers per month who are
selected from the state’s live birth registry. A stratified random sampling approach is followed
to ensure that the data are representative of the population and to permit comparisons among
certain population subgroups. In order to maximize the rate of response, each woman is sent up
to three copies of the questionnaire by mail. If a response is not received, attempts are made to
contact the mother by telephone.
A total of 4,679 surveys were sent out between 1993 and 1995, with a response rate of 72.2
percent, or 3,376 completed surveys. The rate of response has increased each year, starting at
70.4 percent in 1993 and reaching 73.5 percent in 1995, the final year of data covered in this
report.
PRAMS questionnaires are matched with corresponding birth certificates to create a PRAMS
analytic file. This file is weighted by CDC to adjust for various probabilities of sampling, as
well as nonresponse. For analysis of the PRAMS data, CDC uses a special statistical package
called SUDAAN (Software for Survey Data Analysis).

5
Overview of PRAMS Surveillance Report
New York State PRAMS data collection, as featured in this report, began in 1993 and
includes all data collected in 1993, 1994 and 1995. The surveillance report is divided into seven
main topic areas: Pregnancy Intention and Family Planning, Prenatal Care, Negative Health
Behaviors (Smoking and Drinking), Stress and Social Support During Pregnancy, Well Baby
Care, Breast-feeding and Socioeconomic Status.
Each topic area is organized in tables to present the prevalence of indicators based on
maternal demographic characteristics from all years, and a graphical presentation of indicators
and subgroup analysis in order to examine trends over time. The descriptive analyses use the
following maternal characteristics: race (white, black,other), age (< 20, 20 - 29,>= 30), education
(0 - 11 years, 12 years, > 12 years), marital status (married, other), and Medicaid status (on
Medicaid, not on Medicaid). Medicaid status is derived from three PRAMS Phase II
questionnaire questions that ask about Medicaid status at the beginning of pregnancy, during the
mother’s prenatal care and at the time of delivery (Appendix A). If a respondent indicates that
she was receiving Medicaid at any of these times, then she is considered to be on Medicaid.
Since a number of survey questions allow the mother to check more than one response, the
data will not necessarily add up to 100 percent. When this is the case, a reference is made
immediately following the table including this data.
Most of the data presented are simple descriptive statistics generated using the CDC-
developed PRAMS On-line Data for Epidemiologic Research (PONDER). Thus only basic
relationships among the data are reported. Much of the data available from PRAMS are not
obtainable from other sources and, therefore, provide unique insight into maternal and
6
infant health issues in our state.
Questionnaire Design
The PRAMS Questionnaire is divided into two parts: the core questions, which are included
in the surveys of all states taking part in PRAMS, and the state-specific questions, which differ
according to each state’s selected areas of need.
The core questions make up the first 54 questions of the survey and cover such topics as:
• desired timing of pregnancy;
• previous history of pregnancy;
• negative health behaviors (smoking and drinking), both before and during pregnancy;
• prenatal care access and satisfaction;
• health of the newborn infant (NICU status, breast-feeding, etc.);
• economic status of the mother before pregnancy and at time of delivery.
The state-specific section, made up of questions 55 through 68, includes topics such as:
• birth control use before pregnancy and at time of survey;
• educational content of prenatal care;
• infant safety issues (use of a car safety seat, having a smoke alarm in the home);
• support systems available to mother throughout pregnancy;
• abuse, both physical and verbal, during the 12 months before delivery;
• physical stressors during pregnancy (exercise, climbing stairs, carrying more than 20
pounds, standing for more than two hours);
• household income in the year before delivery.

7
PRAMS Highlights (1995)
• Approximately one-third of live births in Upstate New York were the result of unintended pregnancies.
• Twenty percent of Upstate New York women entered prenatal care after their first
trimester. • More than 30 percent of women reported that their doctor did not discuss the effects of
smoking or drinking during pregnancy, and how they could affect the baby. • Only about half of all women in New York reported that a doctor, nurse, or other health
care worker discussed the importance of getting their blood tested for HIV. • Twenty percent of New York women smoked while they were pregnant. • Fifty-six percent of women in New York drank at least one alcoholic beverage per week
in the three months before they became pregnant. • Just over 8 percent of New York women drank during the last three months of pregnancy. • Nine percent of Upstate New York women lost their jobs while pregnant despite a
willingness to continue working. • Eight percent of New York women were receiving public assistance during their most
recent pregnancy. The majority of these women were black, less than 20 years of age and had less than a high school education.
• Almost 87 percent of women not receiving Medicaid during pregnancy were using birth
control the three months prior to pregnancy, while only 12 percent of women on Medicaid during pregnancy reported using birth control at that time.
• Fifty-six percent of Upstate New York women breastfed their infants beyond the first
week and 40.2 percent continued to breastfeed beyond the first month. • The most commonly reported reason for not breastfeeding among New York women was
because “they didn’t want to.”

U nintended Pregnancies Data Highlights • An unintended pregnancy, as defined in this survey, consists of women giving birth to a
live infant who stated that they wanted to be pregnant at a later time, or did not want to be
pregnant at that time or at any time in the future. • About 33 percent of all women in New York stated that their pregnancy was unintended
(33.4% in 1993, 30.3% in 1994, and 34.6% in 1995). Sociodemographic Differences • Black mothers were twice as likely to report an unintended pregnancy than white
mothers. • Women younger than 20 years old reported an unintended pregnancy almost twice as
often as those aged 20 - 29, and almost three times as often as those women older than 30.
• Women who had not completed high school were almost twice as likely to report an
unintended pregnancy than women who had some education beyond high school. • Unmarried women reported an unintended pregnancy twice as often as those women who
were married. • Women on Medicaid at the time of their pregnancy were more than twice as likely to
report having an unintended pregnancy than women who were not on Medicaid.
8

Percent of Unintended * Pregnancies resulting in a Live Birth Among Upstate New York women Maternal 1993 1994 1995 Demographics % (SE) % (SE) % (SE) Total 33.4 (2.4) 30.3 (2.0) 34.6 (1.7) Race White 30.0 (2.4) 27.3 (2.1) 32.3 (1.8) Black 62.8 (7.5) 62.1 (6.6) 60.6 (6.1) Other 23.7 (14.5) 17.1 (8.5) 18.7 (7.9) Age <20 years old 72.3 (9.2) 66.5 (7.6) 71.5 (6.5) 20-29 years old 36.3 (3.3) 30.1 (2.8) 37.9 (2.6) >= 30 years old 24.4 (3.1) 21.9 (2.7) 25.0 (2.3) Education 0-11 years 55.7 (7.7) 49.7 (7.1) 51.7 (5.5) 12 years 36.6 (4.3) 35.9 (3.6) 38.2 (3.2) >12 years 26.4 (2.8) 22.0 (2.3) 26.7 (2.1) Marital Status Married 28.6 (2.5) 21.7 (2.0) 26.3 (1.8) Other 41.6 (4.7) 56.7 (4.7) 61.1 (3.9) Medicaid Status On Medicaid 49.4 (4.9) 48.0 (4.1) 56.3 (3.4) Not on Medicaid 26.6 (2.6) 21.8 (2.1) 25.1 (1.8) * An unintended pregnancy includes women stating they wanted to be pregnant later, or did not want to be pregnant at that time or at any time in the future. Birth Control Use - Three Months Before Pregnancy 9
10
Data Highlights • Just over one-third of women surveyed reported that they were using some form of birth
control in the three months prior to becoming pregnant. • Of those women who reported using birth control in 1995, the most common method
used was condoms (58.0%), followed by withdrawal (28.2%) and the pill (27.4%). • Among women who were not using birth control in 1995, the most common reasons
given were “ I wanted to get pregnant” (65.2%) and “I didn’t think I could get pregnant” (15.2%).
Sociodemographic Differences 1995 • A little more than one third of women (36.6% of white women and 35.6% of black
women) reported using birth control during the three months before becoming pregnant. . • Almost 42 percent of women less than 20 years old reported that they had been using
birth control, while only 31.8 percent of those aged 30 and older were doing so. • Thirty-three percent of women who completed high school reported using birth control
the three months prior to becoming pregnant, while 38.1 percent of women with more than a high school education used birth control in that time period.
• Married women reported birth control use less often than unmarried women. • Only 33.6 percent of women recieving Medicaid reported using birth control. Slightly
more women (36.1%) not receiving Medicaid were using birth control prior to becoming pregnant.

11
Percent of Women Using Birth Control in Three Months Before Pregnancy by Demographics Maternal 1993 1994 1995 Demographics % (SE) % (SE) % (SE) Total 35.4 (2.3) 33.9 (2.0) 35.9 (1.7) Race White 35.2 (2.5) 33.1 (2.1) 36.6 (1.8) Black 31.5 (6.8) 36.6 (6.7) 35.6 (5.6) Age < 20 years old 44.0 (10.7) 39.0 (8.1) 41.9 (6.5) 20-29 years old 34.5 (2.6) 34.4 (2.3) 35.9 (1.9) >= 30 years old 37.2 (6.0) 26.7 (4.9) 31.8 (4.3) Education <12 years 30.4 (6.7) 27.5 (6.0) 34.7 (5.0) 12 years 32.8 (4.1) 36.7 (3.6) 33.1 (2.9) >12 years 38.7 (3.2) 33.3 (2.6) 38.1 (2.2) Marital Status Married 35.9 (2.6) 32.8 (2.3) 34.9 (1.8) Other 34.6 (4.4) 37.3 (4.4) 38.6 (3.6) Medicaid Status On Medicaid 35.0 (5.9) 30.9 (5.1) 33.6 (4.6) Not on Medicaid 35.0 (2.5) 34.4 (2.2) 36.1 (1.8)

Birth Control Use - At Time of Survey Data Highlights • More women were using birth control at the time of the survey than in the period before
conception. After delivery, a little more than two thirds of women (67.8% in 1995) stated that they were using some method of birth control, almost double of what was reported prior to becoming pregnant.
Sociodemographic Differences • The percentage of white women who reported using birth control (69.6% in 1993, 69.8%
in 1994 and 68.5% in 1995) was higher than the percentage of black women (50.1% in 1993, 60.3% in 1994 and 60.8% in 1995).
• Educational attainment was moderately predictive of birth control use at the time of the
survey. Women with education beyond high school were more likely to report birth control use than women who had not completed high school (71.7% vs. 62% in 1995).
• In 1995, married women were more likely to report using birth control at the time of the
survey (70.0%) than women who were not married (60.9%). • In 1995, 69.1 percent of women not receiving Medicaid stated that they were using birth
control, while only 58.8 percent of women on Medicaid reported birth control use.
12

Percent of Women Using Birth Control at Time of Survey by Demographics Maternal 1993 1994 1995 Demographics % (SE) % (SE) % (SE) Total 66.8 (2.3) 68.8 (2.0) 67.8 (1.6) Race White 69.6 (2.4) 69.8 (2.1) 68.5 (1.7) Black 50.1 (7.6) 60.3 (6.7) 60.8 (5.9) Age < 20 years old 72.7 (9.1) 72.9 (7.0) 68.9 (6.4) 20-29 years old 69.1 (2.3) 69.6 (2.3) 68.2 (1.8) > 30 years old 51.3 (6.2) 60.2 (5.2) 64.8 (4.3) Education 0-11 years 64.6 (7.0) 55.6 (6.8) 62.0 (5.1) 12 years 64.8 (4.2) 72.8 (3.2) 64.7 (3.0) > 12 years 69.5 (3.1) 69.3 (2.6) 71.7 (2.1) Marital Status Married 69.7 (2.6) 70.9 (2.2) 70.0 (1.8) Other 61.9 (4.5) 62.4 (4.4) 60.9 (3.7) Medicaid Status On Medicaid 68.1 (5.6) 69.0 (5.4) 58.8 (4.8) Not on Medicaid 66.4 (2.6) 68.5 (2.1) 69.1 (1.7) Prenatal Care 13

14
Data Highlights • In 1995, only 68.1 percent of women with less than a high school education reported
obtaining prenatal care in their first trimester. Sociodemographic Differences • In 1995, 84.8 percent of white women reported entering prenatal care in their first
trimester of pregnancy, compared to 68.9 percent of black women. • Women 30 years of age and older were more likely to receive prenatal care in the first
trimester (85.2% in 1993, 86.1% in 1994 and 88.3% in 1995), than women less than 20 years of age (63.7% in 1993, 46.0% in 1994 and 64.9% in 1995).
• As a woman’s level of education increases, her probability of receiving prenatal care in
the first trimester also increases. In 1995, 68.1 percent of those with less than 12 years of education entered prenatal care in the first trimester, while 89.7 percent of those with greater than a high school education entered care early.
• In 1995, married women were more likely to report entering prenatal care in their first
trimester (87.7%) of pregnancy than women with other marital status (69.1%). • Women on Medicaid were less likely to enter care in the first trimester than non-
Medicaid women (67.9% vs 89.6%) in 1995.

15
Percent of Women Entering Prenatal Care During First Trimester of Pregnancy by Demographics Maternal 1993 1994 1995 Demographics % (SE) % (SE) % (SE) Total 80.0 (1.9) 77.0 (1.9) 83.0 (1.4) Race White 81.9 (2.0) 79.9 (1.9) 84.8 (1.4) Black 65.7 (6.9) 53.4 (6.8) 68.9 (5.6) Other 83.3 (10.6) 61.6 (16.0) 76.4 (8.4) Age <20 years old 63.7 (9.8) 46.0 (7.9) 64.9 (6.4) 20-29 years old 77.9 (2.8) 75.2 (2.8) 81.0 (2.1) >30 years old 85.2 (2.5) 86.1 (2.1) 88.3 (1.7) Education 0-11 years 59.6 (7.2) 55.9 (6.8) 68.1 (4.9) 12 years 81.3 (3.5) 70.5 (3.4) 79.8 (2.5) >12 years 83.9 (2.3) 87.7 (1.8) 89.7 (1.5) Marital Status Married 82.9 (2.1) 83.9 (1.8) 87.7 (1.3) Other 75.3 (3.8) 57.0 (4.5) 69.1 (3.5) Medicaid Status On Medicaid 65.4 (4.5) 55.2 (4.0) 67.9 (3.1) Not on Medicaid 86.5 (1.8) 87.6 (1.7) 89.6 (1.3)

P renatal Care - Barriers Data Highlights • When asked whether they received prenatal care as early in their pregnancy as they
wanted, the majority of women (87.9% in 1993, 84.7% in 1994 and 85.7% in 1995) responded that they had.
• In 1995, 91.8 percent responded that they had had as many prenatal care visits as they
wanted. • In 1995, 4.6 percent of women stated that they had wanted more prenatal care visits. Of
these, not having enough money to pay for the visit (16.8%) and having no transportation (13.4%) were the most frequently reported reasons for not receiving the desired number of visits.
16

P renatal Care - Sources Data Highlights • The most common source of prenatal care was a private doctor’s office or HMO, with
more than 70 percent of women reporting these sources as their primary care location. • There was an increasing trend over the three years in the percentage of mothers receiving
prenatal care at community health Centers. Sociodemographic Differences For the years 1993 -1995: • Black women were three times as likely as white women to use a hospital clinic as their
source of prenatal care, while white women were almost twice as likely as black women to go to a private MD or an HMO for prenatal care.
• Women who had higher levels of education were much more likely to receive their care
from an MD/HMO, while women with less than a high school education were more likely to attend a hospital clinic or community health center for their care.
• Married women were more likely to report seeing an MD/HMO than were unmarried
women.
17

18
Percent of Women Obtaining Prenatal Care from an MD/HMO or Hospital Clinic by Demographics Maternal MD/HMO Hospital Clinic Demographics 1993 1994 1995 1993 1994 1995 Total 79.1 (2.1) 74.5 (2.0) 76.5 (1.5) 12.0 (1.7) 16.3 (1.7) 11.9 (1.2) Race
White 83.6 (2.1) 79.0 (2.0) 81.2 (1.5) 9.3 (1.7) 13.7 (1.7) 9.3 (1.1) Black 46.6 (7.9) 39.3 (6.7) 38.0 (5.8) 29.9 (6.6) 40.6 (6.8) 35.5 (5.8) Other 56.5 (17.0) 42.4 (14.1) 68.2 (9.6) 32.2 (17.3) 19.8 (9.5) 15.6 (7.9) Age <20 63.3 (10.1) 36.6 (7.9) 38.6 (6.6) 6.1 (1.9) 38.1 (7.8) 30.4 (6.1) 20-29 73.9 (3.1) 71.4 (2.9) 69.6 (2.5) 16.5 (2.7) 18.9 (2.6) 15.2 (1.9) >= 30 88.5 (2.3) 86.4 (2.2) 90.1 (1.6) 6.1 (1.8) 8.4 (1.8) 5.3 (1.2) Education 0-11 years 50.1 (7.7) 36.2 (6.8) 45.8 (5.3) 30.4 (7.3) 46.0 (7.0) 21.7 (4.2) 12 years 73.8 (3.9) 67.1 (3.5) 67.7 (3.0) 14.0 (2.9) 20.2 (2.9) 16.6 (2.4) > 12 years 89.0 (2.2) 89.9 (1.7) 90.8 (1.4) 6.4 (1.8) 6.2 (1.4) 5.7 (1.2) Marital Status Married 86.5 (2.0) 86.4 (1.7) 86.7 (1.4) 7.3 (1.5) 8.5 (1.4) 6.4 (1.0) Other 66.7 (4.4) 39.5 (4.4) 45.1 (3.8) 19.7 (3.6) 39.1 (4.6) 28.7 (3.4) Medicaid On Medicaid 42.7 (4.7) 36.2 (3.9) 37.9 (3.3) 35.3 (4.5) 42.9 (4.0) 33.3 (3.1) Not on Medicaid 95.2 (1.2) 92.3 (1.5) 93.1 (1.1) 1.6 (.6) 3.9 (1.1) 2.6 (.7)

P renatal Care – Method of Payment Data Highlights • The major source of payment for prenatal care was insurance, with an increase seen over
the three years (65.4% in 1993, 67.9% in 1994 and 71.6% in 1995). • The second and third largest sources of payment were Medicaid and personal income. • There was a decline in the number of women reporting personal income as a method of
payment, from 24.6 percent in 1993 to 17 percent in 1995. • A decline was also seen in the percentage of mothers who reported they still owed money
for their prenatal care, from 7.9 percent in 1994 to 4.6 percent in 1995.
19

P renatal Care - Sources of Prenatal Care by Method of Payment Data Highlights • The majority of women whose prenatal care was paid for by insurance or personal
income received their care from an MD or HMO. • Of the women whose prenatal care was paid for by Medicaid, the largest source of care in
all three years of data was a hospital clinic; an MD or HMO was the second largest source of care for these women.
• In 1993, 76.2 percent of mothers who still owed for their prenatal care had received that
care from an MD/HMO and less than 1 percent reported attending a community health center. However, in 1995, a change in both of these numbers was observed when 59.1 percent of these women received their care from an MD/HMO and 13.8 percent from a community health center.
20

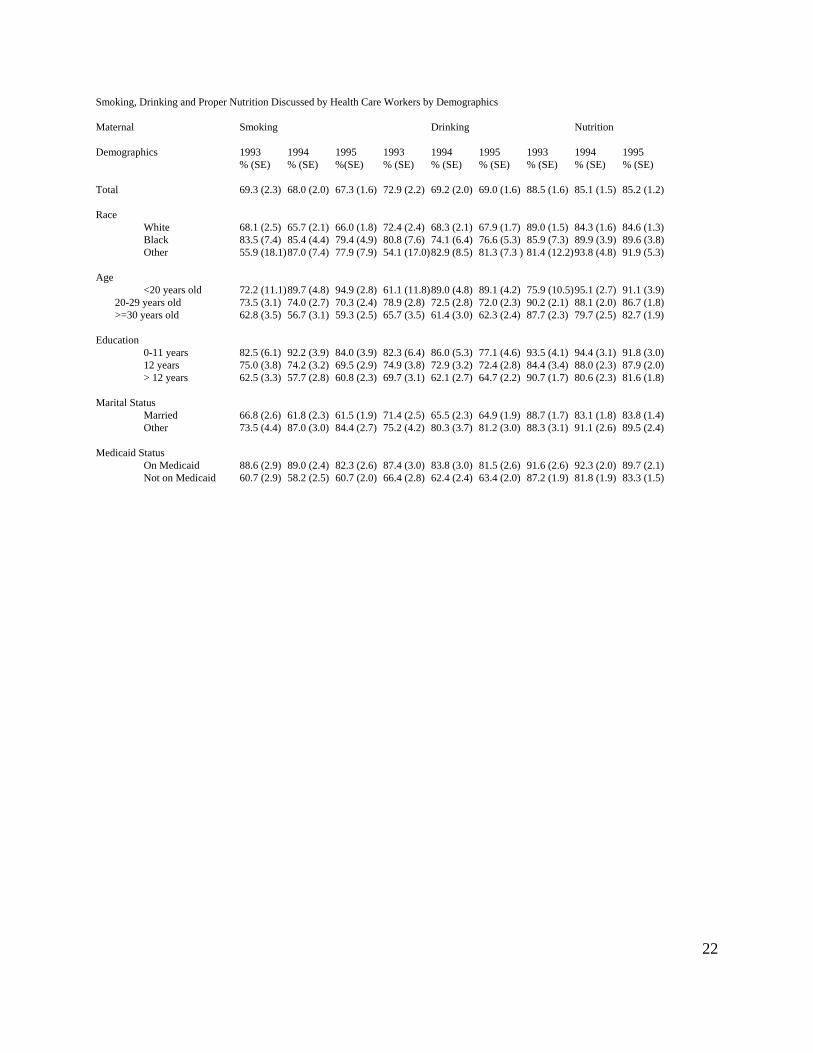
P renatal Care - Educational Components Data Highlights • Less than 70 percent of women reported that their doctor discussed the effects of
smoking during pregnancy, and only slightly more reported that their doctors discussed how alcohol could affect their baby.
• A large percentage of women (88.5% in 1993, 85.1% in 1994 and 85.2% in 1995)
reported that proper nutrition was discussed with them by their physician, nurse or other health care worker during prenatal care visits.
• Slightly more than half of Upstate New York women reported that their health care
worker talked to them about getting tested for HIV (54.5% in 1993, 50.5% in 1994 and 54.9% in 1995).
• Almost 100 percent of women reported that their doctor, nurse or other health care
worker discussed with them the importance of taking prenatal vitamins. Sociodemographic Differences • For 1994 and 1995, women who were older and more educated were less likely to report
that a health care worker discussed with her the effects of smoking and drinking during pregnancy.
• A slightly larger percentage of black women than white women reported that their
provider talked about the effects of smoking and drinking during pregnancy. • Women who were not married were more likely to report that their health care provider
discussed the effects of smoking, drinking and proper nutrition during pregnancy. • Women on Medicaid reported more often that their health care provider discussed
smoking, drinking and proper nutrition during pregnancy.
21
22
Smoking, Drinking and Proper Nutrition Discussed by Health Care Workers by Demographics Maternal Smoking Drinking Nutrition Demographics 1993 1994 1995 1993 1994 1995 1993 1994 1995 % (SE) % (SE) %(SE) % (SE) % (SE) % (SE) % (SE) % (SE) % (SE) Total 69.3 (2.3) 68.0 (2.0) 67.3 (1.6) 72.9 (2.2) 69.2 (2.0) 69.0 (1.6) 88.5 (1.6) 85.1 (1.5) 85.2 (1.2) Race White 68.1 (2.5) 65.7 (2.1) 66.0 (1.8) 72.4 (2.4) 68.3 (2.1) 67.9 (1.7) 89.0 (1.5) 84.3 (1.6) 84.6 (1.3) Black 83.5 (7.4) 85.4 (4.4) 79.4 (4.9) 80.8 (7.6) 74.1 (6.4) 76.6 (5.3) 85.9 (7.3) 89.9 (3.9) 89.6 (3.8) Other 55.9 (18.1) 87.0 (7.4) 77.9 (7.9) 54.1 (17.0) 82.9 (8.5) 81.3 (7.3 ) 81.4 (12.2) 93.8 (4.8) 91.9 (5.3) Age <20 years old 72.2 (11.1) 89.7 (4.8) 94.9 (2.8) 61.1 (11.8) 89.0 (4.8) 89.1 (4.2) 75.9 (10.5) 95.1 (2.7) 91.1 (3.9)
20-29 years old 73.5 (3.1) 74.0 (2.7) 70.3 (2.4) 78.9 (2.8) 72.5 (2.8) 72.0 (2.3) 90.2 (2.1) 88.1 (2.0) 86.7 (1.8) >=30 years old 62.8 (3.5) 56.7 (3.1) 59.3 (2.5) 65.7 (3.5) 61.4 (3.0) 62.3 (2.4) 87.7 (2.3) 79.7 (2.5) 82.7 (1.9)
Education 0-11 years 82.5 (6.1) 92.2 (3.9) 84.0 (3.9) 82.3 (6.4) 86.0 (5.3) 77.1 (4.6) 93.5 (4.1) 94.4 (3.1) 91.8 (3.0) 12 years 75.0 (3.8) 74.2 (3.2) 69.5 (2.9) 74.9 (3.8) 72.9 (3.2) 72.4 (2.8) 84.4 (3.4) 88.0 (2.3) 87.9 (2.0) > 12 years 62.5 (3.3) 57.7 (2.8) 60.8 (2.3) 69.7 (3.1) 62.1 (2.7) 64.7 (2.2) 90.7 (1.7) 80.6 (2.3) 81.6 (1.8) Marital Status Married 66.8 (2.6) 61.8 (2.3) 61.5 (1.9) 71.4 (2.5) 65.5 (2.3) 64.9 (1.9) 88.7 (1.7) 83.1 (1.8) 83.8 (1.4) Other 73.5 (4.4) 87.0 (3.0) 84.4 (2.7) 75.2 (4.2) 80.3 (3.7) 81.2 (3.0) 88.3 (3.1) 91.1 (2.6) 89.5 (2.4) Medicaid Status On Medicaid 88.6 (2.9) 89.0 (2.4) 82.3 (2.6) 87.4 (3.0) 83.8 (3.0) 81.5 (2.6) 91.6 (2.6) 92.3 (2.0) 89.7 (2.1) Not on Medicaid 60.7 (2.9) 58.2 (2.5) 60.7 (2.0) 66.4 (2.8) 62.4 (2.4) 63.4 (2.0) 87.2 (1.9) 81.8 (1.9) 83.3 (1.5)

H ealth Risk Behaviors - Drinking Before Pregnancy Data Highlights • Just over half of the mothers surveyed reported drinking alcohol in the three months
before becoming pregnant (56.6% in 1993, 55.8% in 1994 and 56.1% in 1995). Sociodemographic Differences • White women were more likely to report drinking (58.3% in 1995) in the three months
prior to pregnancy than black women (41.2% in 1995). • For all three years, about twice as many women 20 years of age and older reported that
they drank in the three months before becoming pregnant as women under 20. • As the number of years of education increase, the percentage of women reporting alcohol
use in the three months prior to pregnancy also increases. • A higher percentage of married women reported drinking than did women who were not
married (58.8% vs. 47.2% in 1995). • In 1995, the percentage of women on Medicaid who reported drinking prior to pregnancy
rose to 42.5 percent from 38.3 percent in 1994. Women not on Medicaid, however, were still more likely to report drinking at this time than women on Medicaid (61.8% in 1995).
23

24
Percent of Mothers Who Drank During Three Months Before Pregnancy by Demographics Maternal 1993 1994 1995 Demographics % (SE) % (SE) % (SE) Total 56.6 (2.5) 55.8 (2.2) 56.1 (1.8) Race White 60.0 (2.7) 57.9 (2.4) 58.3 (1.9) Black 37.6 (8.0) 44.0 (7.1) 41.2 (6.1) Other 26.7 (15.7) 15.5 (10.0) 35.8 (9.7) Age < 20 years old 34.6 (10.7) 23.3 (7.2) 28.5 (6.3) 20-29 years old 55.6 (3.5) 56.0 (3.3) 55.7 (2.6) >= 30 years old 60.8 (3.7) 62.4 (3.1) 61.1 (2.5) Education] 0-11 years 26.8 (6.7) 27.3 (6.0) 27.6 (4.8) 12 years 49.0 (4.5) 54.6 (3.9) 51.2 (3.2) > 12 years 68.1 (3.1) 64.7 (2.8) 66.1 (2.2) Marital Status Married 59.6 (2.8) 59.6 (2.5) 58.8 (2.0) Other 51.8 (4.8) 44.5 (4.9) 47.2 (3.9) Medicaid Status On Medicaid 37.0 (4.7) 38.3 (4.1) 42.5 (3.4) Not on Medicaid 65.3 (2.7) 63.4 (2.5) 61.8 (2.0)

H ealth Risk Behaviors - Drinking During Pregnancy Data Highlights • Less than 10 percent of women surveyed reported drinking during the last three months
of their pregnancy. Sociodemographic Differences • In 1995, women 30 years of age and older were more than twice as likely (12.1%) to
report drinking during pregnancy as younger women (4.6% among those <20 years old, and 4.7% among women 20-29 years old).
• Women not receiving Medicaid were up to three times more likely to report drinking
during the last three months of pregnancy than women who were receiving Medicaid.
25

26
Percent of Mothers Who Drank During the Last Three Months of Pregnancy by Demographics Maternal 1993 1994 1995 Demographics % (SE) % (SE) % (SE) Total 9.7 (1.5) 7.8 (1.2) 8.1 (.9) Race White 10.6 (1.7) 7.9 (1.2) 8.0 (1.0) Black 4.9 (2.5) 8.5 (5.1) 12.2 (4.1) Other .6 (.5) 0 (0) .2 (.2) Age < 20 years old 1.5 (.8) 1.0 (.4) 4.6 (2.9) 20-29 years old 7.4 (2.1) 4.2 (1.4) 4.7 (1.1) >= 30 years old 14.0 (2.4) 13.2 (2.1) 12.1 (1.7) Education 0-11 years 3.2 (2.2) 6.8 (3.6) .9 (.3) 12 years 6.4 (1.9) 4.3 (1.3) 5.5 (1.5)
12 years 13.3 (2.4) 10.0 (1.8) 12.0 (1.6) Marital Status Married 11.0 (1.7) 8.7 (1.4) 9.7 (1.2)
Other 7.6 (2.7) 4.9 (2.2) 3.2 (1.3) Medicaid On Medicaid 3.4 (1.4) 4.2 (1.8) 3.3 (1.1) Not on Medicaid 12.6 (2.0) 9.4 (1.5) 10.2 (1.3)

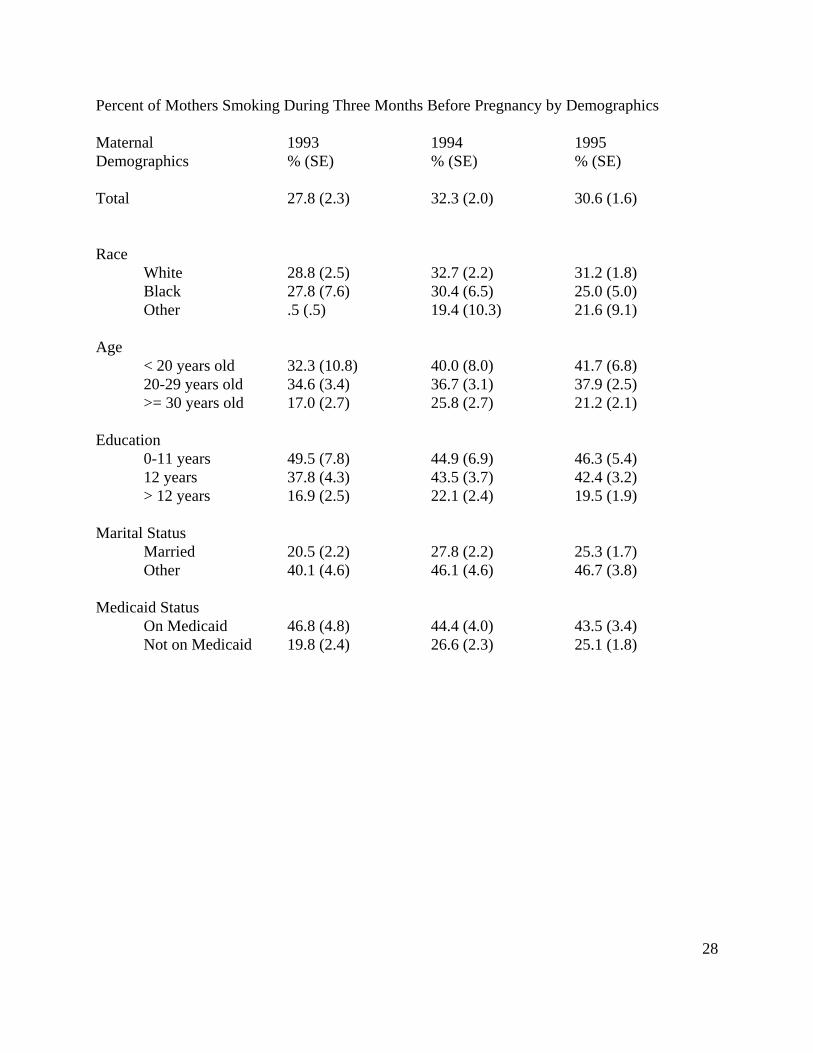
H ealth Risk Behaviors - Smoking Before Pregnancy Data Highlights • Just under one-third of women surveyed reported that they smoked in the three months
prior to becoming pregnant (27.8% in 1993, 32.3% in 1994 and 30.6% in 1995). Sociodemographic Differences • More women less than 20 years old reported smoking in 1995 than women age 30 and
older (41.7% vs. 21.2%). • Women with more than a high school education were half as likely to report smoking as
women who had less education. • Unmarried women reported that they smoked before becoming pregnant almost twice as
often as married women. • Women not on Medicaid were less likely to report smoking during the three months prior
to pregnancy than women who were receiving Medicaid.
27
28
Percent of Mothers Smoking During Three Months Before Pregnancy by Demographics Maternal 1993 1994 1995 Demographics % (SE) % (SE) % (SE) Total 27.8 (2.3) 32.3 (2.0) 30.6 (1.6) Race White 28.8 (2.5) 32.7 (2.2) 31.2 (1.8) Black 27.8 (7.6) 30.4 (6.5) 25.0 (5.0) Other .5 (.5) 19.4 (10.3) 21.6 (9.1) Age < 20 years old 32.3 (10.8) 40.0 (8.0) 41.7 (6.8) 20-29 years old 34.6 (3.4) 36.7 (3.1) 37.9 (2.5) >= 30 years old 17.0 (2.7) 25.8 (2.7) 21.2 (2.1) Education 0-11 years 49.5 (7.8) 44.9 (6.9) 46.3 (5.4) 12 years 37.8 (4.3) 43.5 (3.7) 42.4 (3.2) > 12 years 16.9 (2.5) 22.1 (2.4) 19.5 (1.9) Marital Status Married 20.5 (2.2) 27.8 (2.2) 25.3 (1.7) Other 40.1 (4.6) 46.1 (4.6) 46.7 (3.8) Medicaid Status On Medicaid 46.8 (4.8) 44.4 (4.0) 43.5 (3.4) Not on Medicaid 19.8 (2.4) 26.6 (2.3) 25.1 (1.8)

H ealth Risk Behaviors - Smoking During Pregnancy Data Highlights • Although the percentage of women reporting that they smoked during pregnancy was
lower than those who smoked before becoming pregnant, approximately 20 percent of the women continued to smoke during the last three months of their pregnancy (19.5% in 1993, 22.5% in 1994 and 19.7% in 1995).
Sociodemographic Differences • The percentage of black women who reported that they smoked during the last three
months of pregnancy decreased from 28.9 percent in 1994 to 15.1 percent in 1995, while the percentage of white women reporting smoking during the last three months of pregnancy remained about the same in all three years of data (19.1% in 1993, 22.3% in 1994 and 20.6% in 1995).
• Younger women (<30 years of age) smoked during and after pregnancy at a much higher
percentage than women 30 or older. • In 1995, a woman with less than a high school education was more than three times as
likely to smoke during pregnancy (35.3%) than a woman who attended some school beyond high school (11.1 %).
• Women receiving Medicaid reported smoking during pregnancy more than twice as often
than those who were not on Medicaid for all three years reported.
29

30
Percent of Mothers Who Smoked During the Last Three Months of Pregnancy by Demographics Maternal 1993 1994 1995 Demographics %(SE) %(SE) %(SE) Total 19.5 (2.0) 22.5 (1.9) 19.7 (1.4) Race White 19.1 (2.1) 22.3 (2.0) 20.6 (1.6) Black 27.9 (7.7) 28.9 (6.4) 15.1 (4.0) Other 0 (0) 6.5 (5.3) 5.2 (4.7) Age < 20 years old 28.2 (10.2) 27.5 (6.8) 28.8 (6.1) 20-29 years old 23.4 (3.0) 26.4 (2.9) 24.8 (2.3) >=30 years old 2.9 (2.5) 16.9 (2.4) 12.7 (1.7) Education 0-11 years 46.2 (7.6) 40.9 (6.5) 35.3 (5.0) 12 years 27.2 (4.0) 30.4 (3.4) 26.8 (2.8) > 12 years 8.4 (1.7) 12.6 (2.0) 11.1 (1.5) Marital Status Married 13.9 (2.0) 17.8 (1.9) 14.1 (1.4) Other 29.0 (4.1) 36.2 (4.4) 36.0 (3.6) Medicaid Status On Medicaid 39.5 (4.6) 34.7 (3.8) 34.2 (3.2) Not on Medicaid 11.1 (1.9) 16.6 (2.0) 13.2 (1.4)
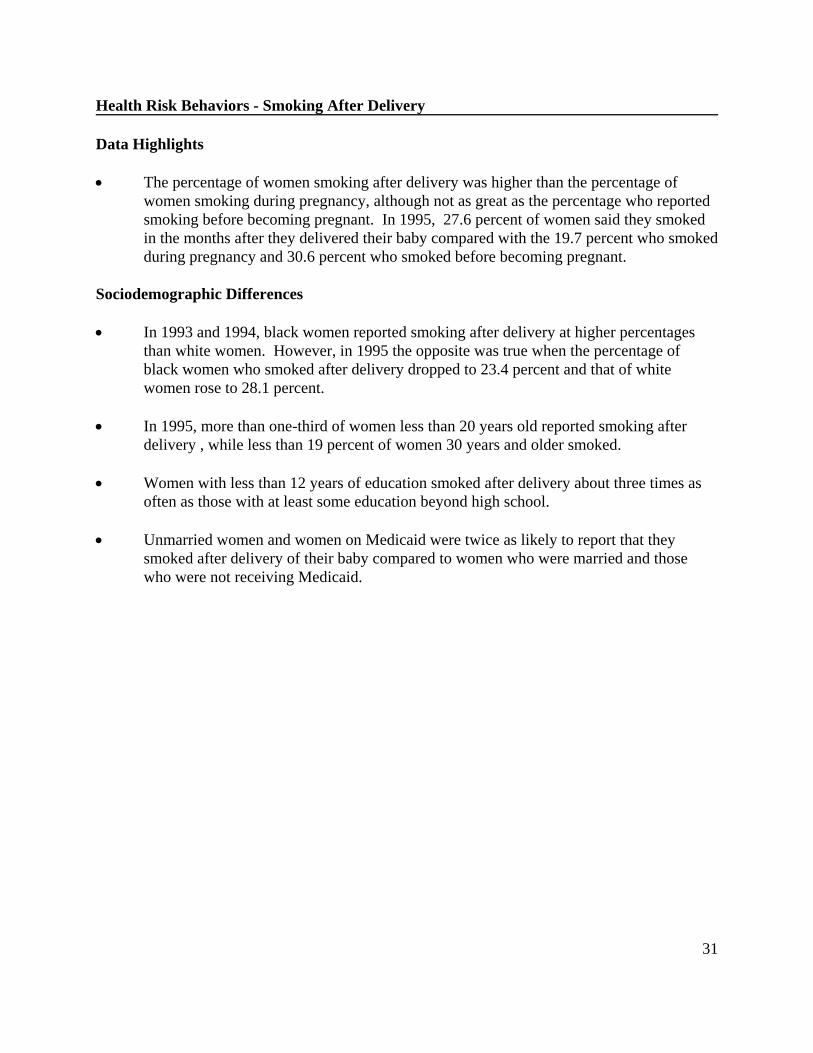
H ealth Risk Behaviors - Smoking After Delivery Data Highlights • The percentage of women smoking after delivery was higher than the percentage of
women smoking during pregnancy, although not as great as the percentage who reported smoking before becoming pregnant. In 1995, 27.6 percent of women said they smoked in the months after they delivered their baby compared with the 19.7 percent who smoked during pregnancy and 30.6 percent who smoked before becoming pregnant.
Sociodemographic Differences • In 1993 and 1994, black women reported smoking after delivery at higher percentages
than white women. However, in 1995 the opposite was true when the percentage of black women who smoked after delivery dropped to 23.4 percent and that of white women rose to 28.1 percent.
• In 1995, more than one-third of women less than 20 years old reported smoking after
delivery , while less than 19 percent of women 30 years and older smoked. • Women with less than 12 years of education smoked after delivery about three times as
often as those with at least some education beyond high school. • Unmarried women and women on Medicaid were twice as likely to report that they
smoked after delivery of their baby compared to women who were married and those who were not receiving Medicaid.
31

32
Percent of Mothers Who Smoked After Delivery by Demographics Maternal 1993 1994 1995 Demographics % (SE) % (SE) % (SE) Total 24.2 (2.2) 26.4 (1.9) 27.6 (1.6) Race White 24.0 (2.3) 26.6 (2.1) 28.1 (1.7) Black 31.6 (7.5) 30.2 (6.4) 23.4 (4.9) Other .8 (.6) 6.0 (5.3) 25.4 (9.3) Age < 20 years old 32.9 (10.7) 36.1 (7.4) 37.8 (6.5) 20-29 years old 30.4 (3.3) 31.0 (3.0) 34.0 (2.5) >= 30 years old 14.1 (2.5) 19.0 (2.5) 18.9 (2.0) Education 0-11 years 45.2 (7.5) 46.3 (6.7) 44.8 (5.2) 12 years 33.8 (4.3) 36.1 (3.6) 38.0 (3.1) > 12 years 13.2 (2.3) 15.0 (2.0) 16.5 (1.8) Marital Status Married 17.7 (2.1) 21.1 (2.0) 22.5 (1.7) Other 34.9 (4.5) 41.5 (4.4) 42.5 (3.7) Medicaid Status On Medicaid 43.8 (4.7) 40.5 (3.9) 42.8 (3.3) Not on Medicaid 15.4 (2.3) 19.5 (2.1) 20.8 (1.7)

Data Highlights Stressors Women in New York State report an average of 2.5 stressors during pregnancy. The most commonly reported stressful events in 1995 were as follows: • 13.9 percent of women were separated from their husband or partner during their
pregnancy. • 12.7 percent reported being verbally abused by their husband or partner. • More than one-third of New York mothers had a family member who was very sick and
had to go into the hospital. • One out of every five women reported that someone close to them had died during their
pregnancy. • 16.2 percent of New York women reported that someone close to them had a serious
problem with drinking or drugs. • 13.7 percent of New York mothers experienced heavy debt while pregnant. • Approximately 30 percent of women stated that their household income decreased at
least 25 percent during their most recent pregnancy. • Almost 48 percent of NY women stated that they had to stand for more than 2 hours or
climb more than two flights of stairs at least four 4 times per week in the three months before delivery.
• Approximately one out of every ten women reported that her husband had lost his job, or
that she had lost her job despite a willingness to continue working. Social Support • In 1995, 85 percent of women reported that their husband or partner would be available
to help them if a problem came up. • Seventy-six percent stated that they could turn to their parents or in-laws, and 60 percent
would be able to call on friends or other relatives in their time of need. • Less than 1 percent of Upstate New York women reported that they had no one to turn to
for help during their pregnancy.
33

34
Percent of Women Experiencing Stressful Events During Pregnancy Stressful Event 1993 1994 1995 % (SE) % (SE) % (SE) Husband/Partner Divorce/Separated 11.6 (1.7) 11.8 (1.4) 13.9 (1.3) Jailed 2.8 (.8) 3.4 (.9) 3.8 (.7) Lost Job 11.1 (1.4) 9.0 (1.3) 9.9 (1.1) Verbally Abused 13.3 (1.7) 12.1 (1.5) 12.7 (1.2) Threatened Physical Abuse 7.3 (1.4) 4.8 (1.0) 6.4 (.9) Family Member Sick 37.2 (2.5) 37.5 (2.1) 35.3 (1.7) Death of 23.8 (2.1) 24.3 (1.9) 20.0 (1.4) Drinking/Drugs 13.9 (1.7) 12.4 (1.4) 16.2 (1.3) Suicide Attempt 2.1 (.7) 2.1 (.7) 3.0 (.6) Self Trouble with Law 1.4 (.6) .5 (.2) 1.3 (.4) Heavy Debt 13.3 (1.6) 12.1 (1.4) 13.7 (1.2) Loss of Job 11.2 (1.7) 9.5 (1.4) 9.1 (1.1) Homeless 1.1 (.4) 3.1 (.9) 3.1 (.7) Income down 25% 31.7 (2.3) 35.1 (2.0) 29.9 (1.6) Physical Stressors Exercise >20 minutes 25.4 (2.3) 25.2 (1.9) 29.7 (1.6) Stand > 2 hours 40.2 (2.4) 51.2 (2.1) 47.7 (1.7) Climb > 2 flights 41.4 (2.4) 47.4 (2.1) 47.6 (1.7) Carry >20 pounds 41.3 (2.4) 41.6 (2.1) 44.0 (1.7) Sources of Help Available to Women in Twelve Months Before Baby Was Born Sources of Help 1993 1994 1995 %(SE) % (SE) % (SE) Husband/Partner 86.2 (1.7) 84.2 (1.6) 85.2 (1.3) Parents/In-Laws 73.2 (2.2) 74.6 (1.9) 75.9 (1.5) Relatives 61.0 (2.4) 61.1 (2.1) 59.0 (1.7) Friends 58.0 (2.4) 61.6 (2.1) 60.3 (1.7) Other 5.6 (1.2) 7.5 (1.1) 6.1 (.8) No One .4 (.2) .4 (.2) .6 (.3)

V iolence Data Highlights • In 1995, 8.4 percent of New York women reported that they had been a victim of
physical violence by their husband or partner in the year before delivery of their baby. Sociodemographic Differences • Black women were three times more likely to report being victims of violence than white
women (21.0% vs. 7.3% 1995). • Women less than 20 years of age were at least twice as likely to experience violence
(32.3% in 1993, 20.8% in 1994 and 34.1% in 1995) as women aged 20 - 29 (12.0% in 1993, 9.6% in 1994 and 10.2% in 1995).
• Two percent of women 30 years old and older reported experiencing violence in the year
before delivery. • Women with an education beyond high school were less likely to report being victims of
violence than those who had not completed high school (3.9% vs. 16.0% in 1995). • While the percentage of married women reporting violence remained constant, at 3.2
percent across all three years of data, the percentage of unmarried women reporting violence increased to 23.9 percent in 1995, from 18.6 percent in 1994 and 18.4 percent in 1993.
• In 1995, women on Medicaid were seven times more likely to report experiencing
violence during pregnancy than women not receiving Medicaid (20.9% vs. 2.8%).
35

36
Percent of Women Who Experienced Violence in the Year Before Delivery by Demographics Maternal 1993 1994 1995 Demographics % (SE) % (SE) % (SE) Total 9.0 (1.6) 7.2 (1.2) 8.4 (1.0) Race White 6.6 (1.4) 5.9 (1.1) 7.3 (1.1) Black 29.9 (7.6) 15.1 (4.9) 21.0 (4.8) Other 1.1 (.7) 22.1 (17.1) 5.1 (4.7) Age < 20 years old 32.3 (9.6) 20.8 (6.8) 34.1 (6.4) 20-29 years old 12.0 (2.5) 9.6 (1.9) 10.2 (1.6) >= 30 years old 1.5 (.7) 1.4 (.6) 2.0 (.7) Education 0-11 years 14.1 (4.6) 15.6 (4.8) 16.0 (3.9) 12 years 13.9 (3.3) 7.3 (1.9) 12.3 (2.2) > 12 years 4.9 (1.8) 3.9 (1.1) 3.9 (1.0) Marital Status Married 3.2 (1.0) 3.2 (.9) 3.2 (.7)
Other 18.4 (3.6) 18.6 (3.6) 23.9 (3.2) Medicaid Status On Medicaid 19.2 (3.8) 18.0 (3.1) 20.9 (2.7) Not on Medicaid 4.4 (1.4) 1.9 (.7) 2.8 (.8)

W ell Baby Care Data Highlights • Approximately 95 percent of mothers in Upstate New York reported that their baby had
gone for routine well baby care as often as they would have liked. • The most common source of well baby care was a private doctor or HMO, with 77.4
percent of women in 1993, 75.7 percent in 1994, and 78.8 percent in 1995 reporting this as their location of choice.
• Among those women whose babies did not receive the desired number of well baby care
visits, the most common reason was a lack of money to pay for the appointment (19.4% in 1995), followed by having no transportation (11.5% in 1995) and inability to obtain an appointment (11.2% in 1995).
Sociodemographic Differences • Slightly higher percentages of women aged 30 years and older reported that they were
able to take their infant to their desired number of well baby care visits, compared to women less than 20.
• Mothers who had not completed high school were less likely to take their infant for as
many routine well baby care visits as they wanted than women with greater than a high school education.
37

38
Percent of Mothers Who Reported That Their Babies had Received the Desired Number of Well Baby Care Visits Maternal 1993 1994 1995 Demographics % (SE) % (SE) % (SE) Total 95.9 (.9) 95.4 (.9) 94.4 (.9) Race White 96.2 (.9) 95.2 (1.1) 94.9 (.9) Black 92.0 (4.4) 96.9 (1.0) 94.3 (2.8) Other 100.0 (0) 94.4 (4.8) 90.2 (6.4) Age < 20 years old 95.2 (3.4) 90.6 (4.8) 88.8 (4.3) 20-29 years old 95.1 (1.4) 96.3 (1.1) 93.8 (1.4) >= 30 years old 97.2 (1.0) 95.4 (1.4) 96.1 (1.0) Education 0-11 years 95.4 (2.5) 94.5 (2.9) 87.6 (3.7) 12 years 93.8 (2.0) 94.0 (1.8) 94.7 (1.5) > 12 years 97.8 (.8) 96.3 (1.2) 96.4 (.9) Marital Status Married 96.2 (1.0) 95.3 (1.1) 95.8 (.8) Other 95.5 (1.7) 95.7 (1.8) 90.4 (2.4) Medicaid Status On Medicaid 93.0 (2.3) 92.8 (2.1) 91.2 (2.0) Not on Medicaid 97.2 (.8) 96.6 (.9) 95.8 (.9)

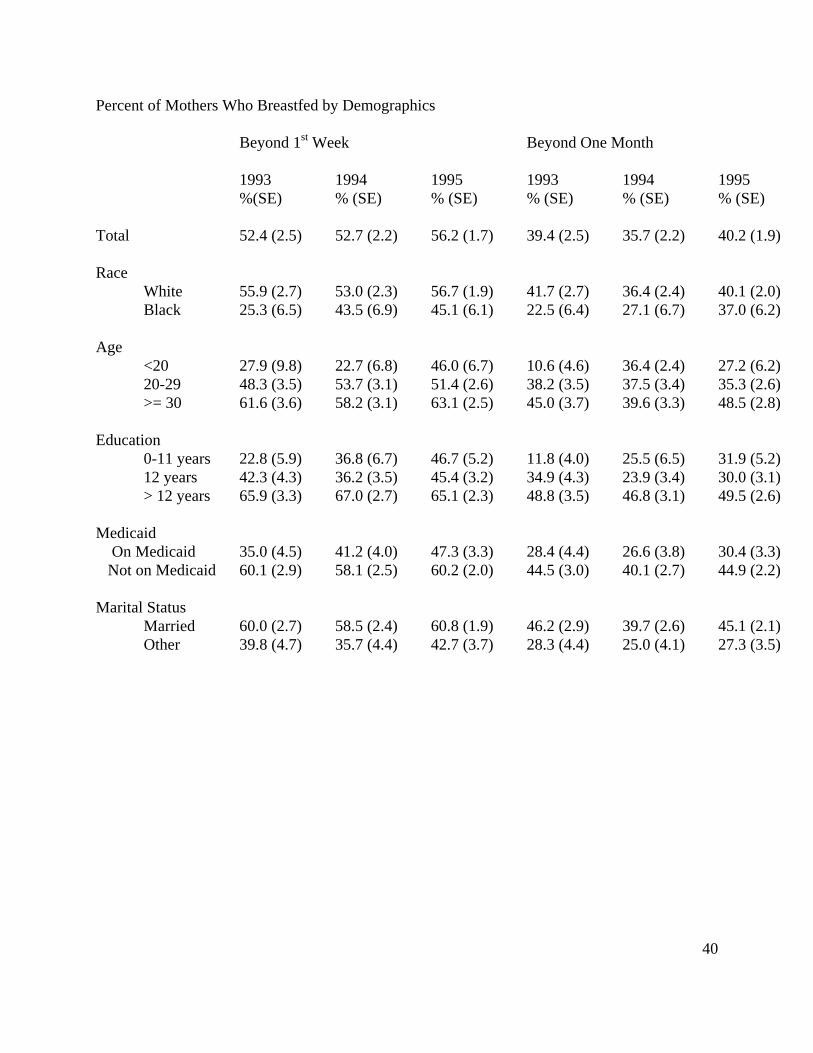
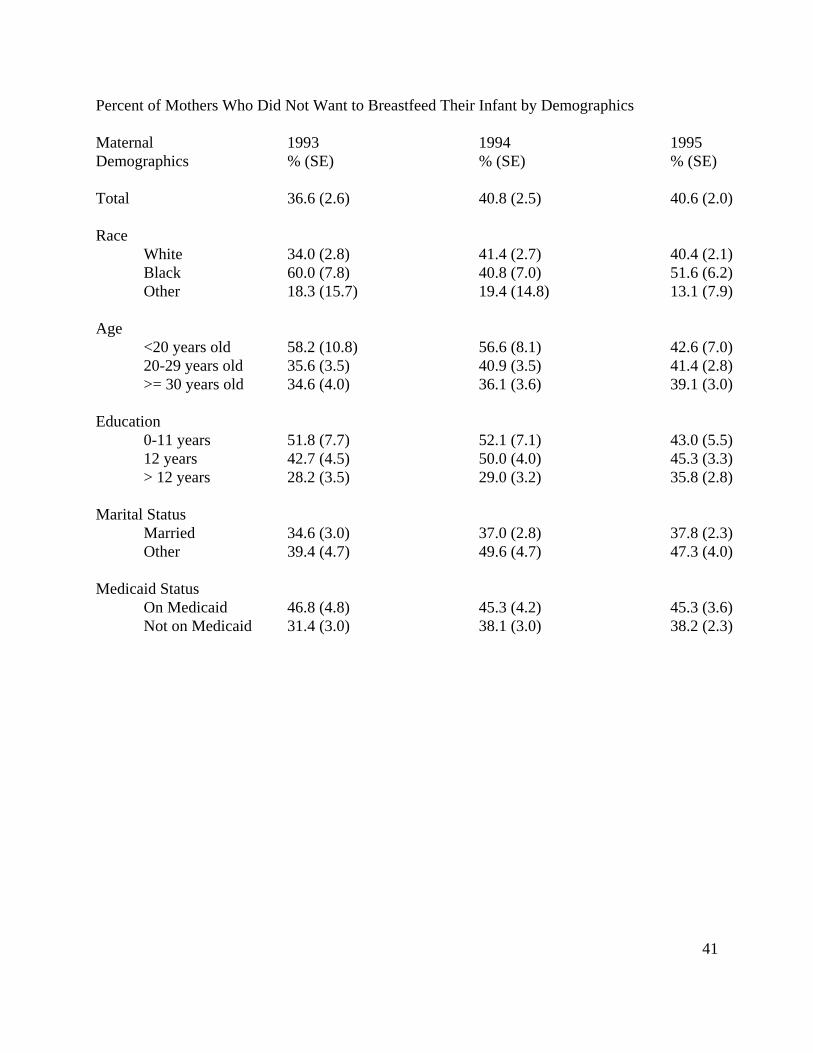
Breastfeeding Beyond the First Week Data Highlights • In 1995, 56.2 percent of women reported breastfeeding their infant beyond the first week
of life, an increase from 52.7 percent in 1994. • Among those women who did not breastfeed, the most common reason by far was
preference, with approximately 40 percent of women reporting they did not want to breastfeed in 1995. The second most popular reason was employment, reported by 19.1 percent in 1995.
Sociodemographic Differences • Although the percentage of black mothers who breastfed during the early postpartum
period increased substantially over time from 25.3 percent in 1993 to 45.1 percent in 1995, white women were still more likely to breastfeed (55.9% in 1993, 53.0% in 1994 and 56.7% in 1995).
• Women 30 years of age and older were the most likely to report breastfeeding in all
survey years. However, the percentage of women less than 20 years old who reported breastfeeding beyond the first week doubled from 22.7 percent in 1994 to 46 percent in 1995.
• Despite increasing numbers of women with less than a high school education reporting
breastfeeding (22.8% in 1993, 36.8% in 1994 and 46.7% in 1995), women who attended at least some college were still more likely to breastfeed (65.9% in 1993, 67.0% in 1994 and 65% in 1995).
• A greater percentage of married women reported breastfeeding their babies than women
who were not married (60.8% vs. 42.7% in 1995). • Women receiving Medicaid were less likely to breastfeed their infants than women not
receiving Medicaid (47.3% vs. 60.2% in 1995)
39
40
Percent of Mothers Who Breastfed by Demographics Beyond 1st Week Beyond One Month
1993 1994 1995 1993 1994 1995 %(SE) % (SE) % (SE) % (SE) % (SE) % (SE)
Total 52.4 (2.5) 52.7 (2.2) 56.2 (1.7) 39.4 (2.5) 35.7 (2.2) 40.2 (1.9) Race White 55.9 (2.7) 53.0 (2.3) 56.7 (1.9) 41.7 (2.7) 36.4 (2.4) 40.1 (2.0) Black 25.3 (6.5) 43.5 (6.9) 45.1 (6.1) 22.5 (6.4) 27.1 (6.7) 37.0 (6.2) Age <20 27.9 (9.8) 22.7 (6.8) 46.0 (6.7) 10.6 (4.6) 36.4 (2.4) 27.2 (6.2) 20-29 48.3 (3.5) 53.7 (3.1) 51.4 (2.6) 38.2 (3.5) 37.5 (3.4) 35.3 (2.6) >= 30 61.6 (3.6) 58.2 (3.1) 63.1 (2.5) 45.0 (3.7) 39.6 (3.3) 48.5 (2.8) Education 0-11 years 22.8 (5.9) 36.8 (6.7) 46.7 (5.2) 11.8 (4.0) 25.5 (6.5) 31.9 (5.2) 12 years 42.3 (4.3) 36.2 (3.5) 45.4 (3.2) 34.9 (4.3) 23.9 (3.4) 30.0 (3.1) > 12 years 65.9 (3.3) 67.0 (2.7) 65.1 (2.3) 48.8 (3.5) 46.8 (3.1) 49.5 (2.6) Medicaid On Medicaid 35.0 (4.5) 41.2 (4.0) 47.3 (3.3) 28.4 (4.4) 26.6 (3.8) 30.4 (3.3) Not on Medicaid 60.1 (2.9) 58.1 (2.5) 60.2 (2.0) 44.5 (3.0) 40.1 (2.7) 44.9 (2.2) Marital Status Married 60.0 (2.7) 58.5 (2.4) 60.8 (1.9) 46.2 (2.9) 39.7 (2.6) 45.1 (2.1) Other 39.8 (4.7) 35.7 (4.4) 42.7 (3.7) 28.3 (4.4) 25.0 (4.1) 27.3 (3.5)
41
Percent of Mothers Who Did Not Want to Breastfeed Their Infant by Demographics Maternal 1993 1994 1995 Demographics % (SE) % (SE) % (SE) Total 36.6 (2.6) 40.8 (2.5) 40.6 (2.0) Race White 34.0 (2.8) 41.4 (2.7) 40.4 (2.1) Black 60.0 (7.8) 40.8 (7.0) 51.6 (6.2) Other 18.3 (15.7) 19.4 (14.8) 13.1 (7.9) Age <20 years old 58.2 (10.8) 56.6 (8.1) 42.6 (7.0) 20-29 years old 35.6 (3.5) 40.9 (3.5) 41.4 (2.8) >= 30 years old 34.6 (4.0) 36.1 (3.6) 39.1 (3.0) Education 0-11 years 51.8 (7.7) 52.1 (7.1) 43.0 (5.5) 12 years 42.7 (4.5) 50.0 (4.0) 45.3 (3.3) > 12 years 28.2 (3.5) 29.0 (3.2) 35.8 (2.8) Marital Status Married 34.6 (3.0) 37.0 (2.8) 37.8 (2.3) Other 39.4 (4.7) 49.6 (4.7) 47.3 (4.0) Medicaid Status On Medicaid 46.8 (4.8) 45.3 (4.2) 45.3 (3.6) Not on Medicaid 31.4 (3.0) 38.1 (3.0) 38.2 (2.3)

E conomic Status - Sources of Family Income Data Highlights • Wages from a job or business was the most common source of income reported in all
three years of the survey (81.8% in 1993, 82.8% in 1994 and 86.8% in 1995). • Approximately one out of every five mothers (20.4% in 1993, 19.2% in 1994 and 18.0%
in 1995) received some sort of financial assistance (AFDC, welfare, public assistance, or SSI) during the most recent pregnancy.
• In 1995, 8.7 percent of women surveyed reported that they received unemployment
benefits. • In 1995, less than 6 percent of New York women reported that their family income
included some form of child support or alimony in the 12 months prior to the survey. • In 1995, 8.6 percent of women reported that their income included rental income, fees or
dividends and 5 percent reported receiving Social Security payments. Sociodemographic Differences • The percentage of black women reporting that their family income included money from
a job or business increased to 67.0 percent in 1995, from 50.3 percent in 1994. However, this percentage was still much lower than the 89.4 percent of white women who reported this type of income.
• Almost three times as many black women as white women reported receiving some form
of public assistance. • Women less than 20 years of age reported receiving public assistance more than twice as
often as those aged 20 - 29 and almost 10 times more often than women 30 years and older.
• The percentage of women receiving public assistance was eight times greater among
those with less than a high school education than among women who continued beyond high school.
• Approximately one half of the unmarried women and women on Medicaid reported on
the survey that they had received some form of public assistance, while only 7 percent of married women and 1 percent of those not on Medicaid reported that they had received assistance.
42

43
Distribution of Total Family Income in Twelve Months Before Delivery Income 1993 1994 1995 % (SE) % (SE) % (SE) < $8,000 12.2 (1.8) 13.6 (1.7) 11.6 (1.3) $8000-$11999 6.1 (1.3) 5.3 (1.0) 4.5 (.8) 2000-$15999 5.5 (1.3) 4.8 (1.0) 4.8 (.8) 16000-$19999 4.4 (1.2) 4.9 (1.0) 4.7 (.8) 20000-$24999 7.5 (1.4) 5.7 (1.1) 5.1 (.8) $25000-$29999 7.0 (1.3) 4.9 (.9) 7.6 (1.0) $30000-$39999 14.6 (1.7) 14.7 (1.5) 13.4 (1.2) >= $40000 42.8 (2.5) 46.2 (2.2) 48.4 (1.8)
Sources of Family Income in Twelve Months Before Delivery 1993 1994 1995 Wages 81.8 (2.0) 82.8 (1.7) 86.8 (1.2) Public Assistance 20.4 (2.0) 19.2 (1.8) 18.0 (1.4) Unemployment Benefits 12.6 (1.7) 8.4 (1.2) 8.7 (1.0) Alimony 5.9 (1.2) 5.1 (.9) 5.8 (.9) Fees/Dividends 10.0 (1.5) 8.3 (1.2) 8.6 (.9) Social Security 4.8 (1.2) 3.6 (.8) 5.0 (.8) Other 7.4 (1.2) 9.5 (1.2) 9.0 (1.0)

44
Income from Wages by Maternal Demographics 1993 1994 1995 Total 82.7 (2.0) 83.4 (1.7) 87.8 (1.2) Race White 85.3 (2.0) 87.5 (1.6) 90.4 (1.1) Black 60.9 (7.3) 51.4 (6.7) 67.0 (5.3) Age <20 58.1 (10.9) 60.8 (7.8) 71.5 (5.9) 20-29 77.1 (3.1) 81.2 (2.6) 84.6 (1.9) >=30 93.6 (1.5) 90.8 (1.8) 93.7 (1.3) Education 0-11 years 56.5 (7.4) 44.7 (6.7) 69.4 (4.8) 12 years 74.7 (4.1) 83.9 (2.4) 85.1 (2.2) >12 Years 94.1 (1.5) 94.7(1.3) 95.2 (1.0) Marital Status Married 90.8 (1.7) 92.6 (1.4) 93.3 (1.0) Other 69.2 (4.3) 56.3 (4.5) 70.7 (3.4) Medicaid MA 55.6 (4.7) 55.9 (4.0) 65.6 (3.1) Not on Medicaid 94.5(1.5) 96.5 (1.0) 97.4 (.6)

45
Income from Public Assistance by Maternal Demographics 1993 1994 1995 Total 20.6 (2.1) 19.3 (1.8) 18.1 (1.4) Race White 15.6 (2.0) 15.3 (1.8) 15.4 (1.4) Black 58.6 (7.7) 51.9 (6.6) 44.1 (5.8) Age <20 years old 61.7 (11.3) 54.6 (8.0) 55.0 (6.7) 20-29 years old 26.5 (3.1) 23.4 (2.7) 24.9 (2.3) >=30 years old 7.2 (1.9) 6.8 (1.5) 5.0 (1.1) Education 0-11 years 62.8 (7.0) 64.6 (6.4) 52.6 (5.2) 12 years 29.4 (4.1) 21.0 (2.8) 22.2 (2.6) >12 years 5.2 (1.3) 5.1 (1.2) 5.9 (1.2) Marital Status Married 9.2 (1.7) 8.1 (1.5) 7.2 (1.1) Other 39.5 (4.5) 52.5 (4.5) 51.3 (3.8) Medicaid Status MA 61.8 (4.7) 56.9 (3.9) 57.4 (3.3) Not on Medicaid 2.6 (1.2) 1.4 (.6) 1.0 (.4)
Medicaid Status - Beginning of Pregnancy and at Time of Delivery Data Highlights • In 1995, 14.1 percent of New York women stated that they were receiving Medicaid at
the beginning of their most recent pregnancy, compared to 27.4 percent at the time of delivery.
Sociodemographic Differences • In 1995, the percentage of white women who were on Medicaid at the time of delivery
(23.9%) was almost double the percentage of white women on Medicaid at the beginning of their pregnancy (12.3%)]
• More that half (57.1%) of black women surveyed were on Medicaid at the time of
delivery. • The percentage of women under 20 years old who reported being on Medicaid when they
became pregnant decreased from 52.1 percent in 1994, to 38.2 percent in 1995, yet was still twice as great as the 19.6 percent of women aged 20 - 29.
• Three out of four women surveyed under the age of 20 were on Medicaid at the time of
delivery. • A large decrease was seen in the percentage of women with less than a high school
education who reported receiving Medicaid at the beginning of their pregnancy. Sixty-two percent stated in 1994 that they were on Medicaid, while only 38.5 percent did so in 1995.
• Two-thirds of the women with less than a high school education were on Medicaid at the
time of delivery. • Unmarried women were much more likely than married women (35.2% vs.6.9% in 1995)
to be receiving Medicaid at the beginning of their pregnancy and at the time of delivery (71.9% vs. 35.2%).
46
47
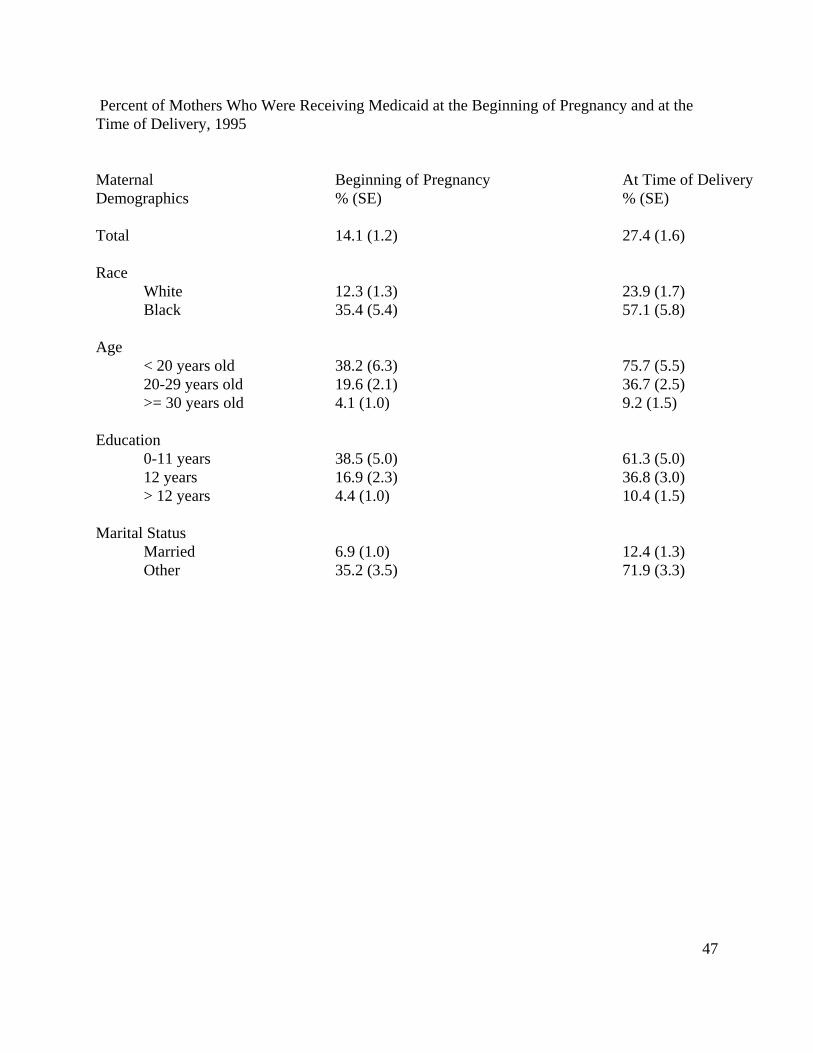
Percent of Mothers Who Were Receiving Medicaid at the Beginning of Pregnancy and at the Time of Delivery, 1995 Maternal Beginning of Pregnancy At Time of Delivery Demographics % (SE) % (SE) Total 14.1 (1.2) 27.4 (1.6) Race White 12.3 (1.3) 23.9 (1.7) Black 35.4 (5.4) 57.1 (5.8) Age < 20 years old 38.2 (6.3) 75.7 (5.5) 20-29 years old 19.6 (2.1) 36.7 (2.5) >= 30 years old 4.1 (1.0) 9.2 (1.5) Education 0-11 years 38.5 (5.0) 61.3 (5.0) 12 years 16.9 (2.3) 36.8 (3.0) > 12 years 4.4 (1.0) 10.4 (1.5) Marital Status Married 6.9 (1.0) 12.4 (1.3) Other 35.2 (3.5) 71.9 (3.3)

Technical Notes Sampling Design
When the PRAMS survey was begun in June 1993, a stratified systematic random sampling
approach was used to oversample low birthweight infants (< 2500 g). The sample was divided
into two strata : low birthweight and normal birthweight. Any records with missing or invalid
birthweight information were put in the low birthweight group in the sampling frame.*
Certain records were automatically excluded from the sampling frame, including records
received six or more months after delivery, adopted infants and all but one infant from a multiple
birth. Records were sampled using the following sampling fractions:
Low birthweight: 3/22
Normal birthweight : 1/121
Although the probability of being selected into the two strata differs, the number of women
from each stratum in the resulting sample is approximately equal.
Estimating Standard Errors for PRAMS Data
The probablility sampling method for obtaining PRAMS data results in population estimates
that are subject to sampling error. The standard error measures the sampling variability of an
estimator compared to all possible samples taken from the sampling frame.
The standard errors presented in this report were obtained from SUDAAN. These errors were
produced through the use of first-order Taylor Series linearization approximation to estimate
sampling variances and standard errors. * The original sampling design also stratified on prenatal care (Kessner Index), however, changes in the way prenatal care was recorded on the 1993 birth certificate resulted in an unacceptably large number of unknown adequacy of care received utilizing the Kessner Index. Prenatal care was, therefore, dropped as a stratification variable. Weighting of Data 48

49
All data presented in this surveillance report are weighted to account for a degree of
nonresponse and noncoverage. The SUDAAN software package, developed specifically for
weighting survey data, is required for all analyses.
The data from the PRAMS survey is used to make statewide estimates about the
characteristics of women giving birth to live babies. In order for these estimates to be possible, a
survey respondent must first be assigned an analysis weight to adjust for the sampling design,
non-response by certain groups of women, and non-coverage of certain areas in the sampling
frame. Thus, the analysis weight given to each mother is a product of three factors: sampling
weight, nonresponse weight and frame noncoverage weight.
The sampling weight is the reciprocal of the sampling fraction and is used to adjust for the
unequal probability of selection into each stratum. This number is calculated by dividing the
number of mothers in the sampling frame for a stratum, by the number of mothers actually
sampled for that stratum.
The nonresponse weight is used to account for the bias resulting when women with some
particular characteristic (age, race, education, etc.) respond at a greater or lesser rate than women
without that same characteristic. This factor is calculated by dividing the number of women
sampled for PRAMS in each stratum-specific response category by the number of mothers
actually responding to the survey in that category.
The final factor, frame noncoverage weight, reflects the overall rate of omission from the
sampling frame. By using this adjustment, corrections can be made for incomplete coverage of
the population and variability in estimates.
Response Rates

50
To ensure statistical reliability, CDC requires a response rate of 70 percent in a stratum before
the data are considered statistically reliable. Response rates for the low birthweight group have
been below 70 percent for all three years of data collection. Therefore, no stratum specific
analysis has been done.