Praise for Accelerate - devops-research.com · understood, DevOps is more than just a fad or a new...
93
Praise for Accelerate “This is the kind of foresight that CEOs, CFOs, and CIOs desperately need if their company is going to survive in this new software-centric world. Anyone that doesn’t read this book will be replaced by someone who has.” —Thomas A. Limoncelli, coauthor of The Practice of Cloud System Administration “‘Here, do this!’ The evidence presented in Accelerate is a triumph of research, tenacity, and insight, proving not just correlation but a causal link between good technical and management behaviors and business performance. It also exposes the myth of ‘maturity models’ and offers a realistic, actionable alternative. As an independent consultant working at the intersection of people, technology, process, and organization design this is manna from heaven! As chapter 3 concludes: ‘You can act your way to a better culture by implementing these practices in technology organizations’ [emphasis mine]. There is no mystical culture magic, just 24 concrete, specific capabilities that will lead not only to better business results, but more importantly to happier, healthier, more motivated people and an organization people want to work at. I will be giving copies of this book to all my clients.” —Dan North, independent technology and organization consultant “Whether they recognize it or not, most organizations today are in the business of software development in one way, shape, or form. And most are being dragged down by slow lead times, buggy output, and complicated features that add expense and frustrate users. It doesn’t need to be this way. Forsgren, Humble, and Kim shine a compelling light on the what, why, and how of DevOps so you, too, can experience what outstanding looks and feels like.” —Karen Martin, author of Clarity First and The Outstanding Organization “Accelerate does a fantastic job of explaining not only what changes organizations should make to improve their software delivery performance, but also the why, enabling people at all levels to truly understand how to level up their organizations.” —Ryn Daniels, Infrastructure Operations Engineer at Travis CI and author of Effective DevOps
Transcript of Praise for Accelerate - devops-research.com · understood, DevOps is more than just a fad or a new...
Praise for Accelerate“This is the kind of foresight that CEOs, CFOs, and CIOs desperately need iftheir company is going to survive in this new software-centric world.
Anyone that doesn’t read this book will be replaced by someone who has.”—Thomas A. Limoncelli, coauthor of
The Practice of Cloud System Administration
“‘Here, do this!’ The evidence presented in Accelerate is a triumph of research,tenacity, and insight, proving not just correlation but a causal link between goodtechnical and management behaviors and business performance. It also exposesthe myth of ‘maturity models’ and offers a realistic, actionable alternative. As anindependent consultant working at the intersection of people, technology, process,and organization design this is manna from heaven!
As chapter 3 concludes: ‘You can act your way to a better culture byimplementing these practices in technology organizations’ [emphasis mine]. Thereis no mystical culture magic, just 24 concrete, specific capabilities that will leadnot only to better business results, but more importantly to happier, healthier,more motivated people and an organization people want to work at. I will begiving copies of this book to all my clients.”
—Dan North, independent technology and organization consultant
“Whether they recognize it or not, most organizations today are in the businessof software development in one way, shape, or form. And most are being draggeddown by slow lead times, buggy output, and complicated features that add expenseand frustrate users. It doesn’t need to be this way. Forsgren, Humble, and Kimshine a compelling light on the what, why, and how of DevOps so you, too, canexperience what outstanding looks and feels like.”
—Karen Martin, author ofClarity First and The Outstanding Organization
“Accelerate does a fantastic job of explaining not only what changes organizationsshould make to improve their software delivery performance, but also the why,enabling people at all levels to truly understand how to level up theirorganizations.”
—Ryn Daniels, Infrastructure Operations Engineer at Travis CIand author of Effective DevOps
“The ‘art’ of constructing a building is a well-understood engineering practicenowadays. However, in the software world, we have been looking for patternsand practices that can deliver the same predictable and reliable results whilstminimising waste and producing the increasingly high performance our businessesdemand.
Accelerate provides research-backed, quantifiable, and real-world principlesto create world-class, high-performing IT teams enabling amazing businessoutcomes.
Backed by the two leading thought leaders (Kim and Humble) in the DevOpscommunity and world-class research from PhD Forsgren, this book is a highlyrecommended asset!”
—Jonathan Fletcher, Group CTO, Hiscox
“In their book Accelerate, Nicole Forsgren, Jez Humble, and Gene Kim don’tbreak any new conceptual ground regarding Agile, Lean, and DevOps. Instead,they provide something that might be even more valuable, which is a look insidethe methodological rigor of their data collection and analysis approach which ledthem to their earlier conclusions on the key capabilities that make IT organizationsbetter contributors to the business. This is a book that I will gladly be placing onmy bookshelf next to the other great works by the authors.”
—Cameron Haight, VP and CTO, Americas, VMware
“The organizations that thrive in the future will be those that leverage digitaltechnologies to improve their offerings and operations. Accelerate summarizesthe best metrics, practices, and principles to use for improving software deliveryand digital product performance, based on years of well-documented research. Westrongly recommend this book to anyone involved in a digital transformation forsolid guidance about what works, what doesn’t work, and what doesn’t matter.”
—Tom Poppendieck and Mary Poppendieck, authors ofthe Lean Software Development series of books
“With this work, the authors have made a significant contribution to theunderstanding and application of DevOps. They show that when properlyunderstood, DevOps is more than just a fad or a new name for an old concept.Their work illustrates how DevOps can improve the state of the art inorganizational design, software development culture, and systems architecture.And beyond merely showing, they advance the DevOps community’s qualitativefindings with research-based insights that I have heard from no other source.”
—Baron Schwartz, Founder and CEO of VividCortexand coauthor of High Performance MySQL

ACCELERATE


THE SCIENCE BEHIND DEVOPS
ACCELERATEBuilding and Scaling High Performing
Technology Organizations
Nicole Forsgren, PhDJez Humble and Gene Kim
IT RevolutionPortland, Oregon
25 NW 23rd Pl, Suite 6314Portland, OR 97210
Copyright © 2018 by Nicole Forsgren, Jez Humble, and Gene Kim.Chapter 16 Copyright © 2018 by Karen Whitley Bell and Steve Bell,
Lean IT Strategies, LLC.All rights reserved, for information about permission
to reproduce selections from this book, write toPermissions, IT Revolution Press, LLC, 25 NW 23rd Pl, Suite 6314, Portland, OR 97210
First EditionPrinted in the United States of America
22 21 20 19 18 1 2 3 4 5 6
Cover and book design by Devon Smith Creative, LLC
Library of Congress Catalog-in-Publication Data is available upon request.ISBN: 978-1942788331
eBook ISBN: 978-194278355Kindle ISBN: 978-194278362
Web PDF ISBN: 978-194278379
Publisher’s note to readers: Although the authors and publisher have made everyeffort to ensure that the information in this book is correct, the authors and publisherdo not assume and hereby disclaim any liability to any party for any loss, damage, or
disruption caused by errors or omissions, whether such errors or omissions resultfrom negligence, accident, or any other cause.
For information about special discounts for bulk purchases or for information onbooking authors for an event, please visit our website at www.ITRevolution.com.
ACCELERATE
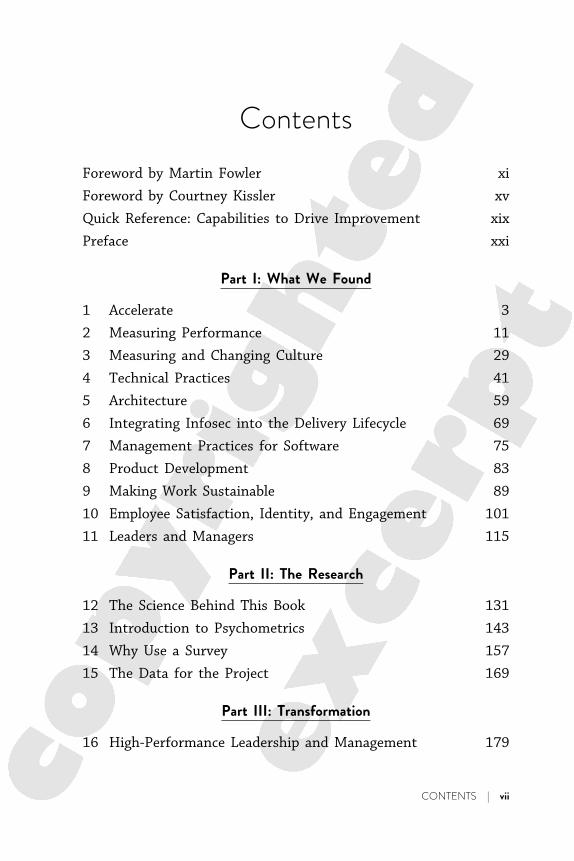
ContentsxiForeword by Martin FowlerxvForeword by Courtney Kissler
xixQuick Reference: Capabilities to Drive ImprovementxxiPreface
Part I: What We Found
3Accelerate111Measuring Performance229Measuring and Changing Culture341Technical Practices459Architecture569Integrating Infosec into the Delivery Lifecycle675Management Practices for Software783Product Development889Making Work Sustainable9
101Employee Satisfaction, Identity, and Engagement10115Leaders and Managers11
Part II: The Research
131The Science Behind This Book12143Introduction to Psychometrics13157Why Use a Survey14169The Data for the Project15
Part III: Transformation
179High-Performance Leadership and Management16
CONTENTS | vii

199Conclusion201Appendix A: Capabilities to Drive Improvement211Appendix B: The Stats223Appendix C: Statistical Methods Used in Our Research231Acknowledgments237Bibliography243Index257About the Authors
viii | CONTENTS
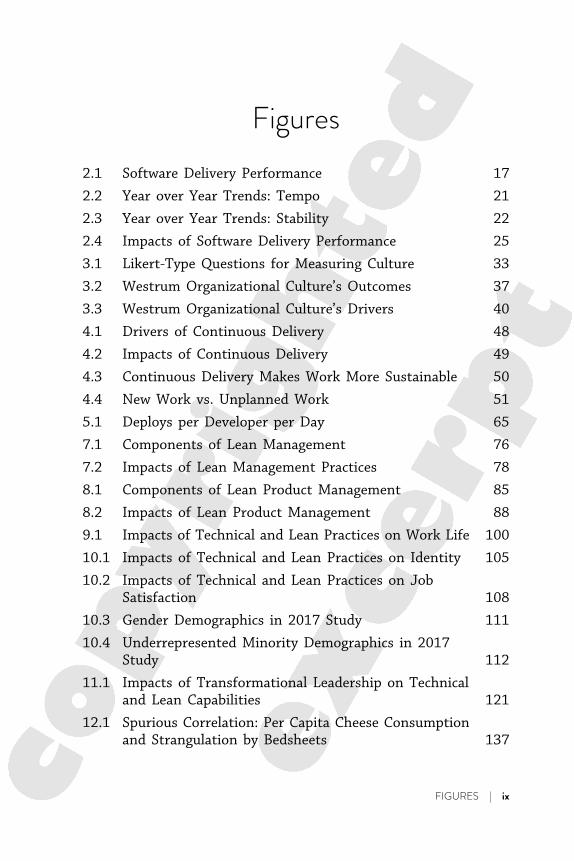
Figures17Software Delivery Performance2.121Year over Year Trends: Tempo2.222Year over Year Trends: Stability2.325Impacts of Software Delivery Performance2.433Likert-Type Questions for Measuring Culture3.137Westrum Organizational Culture’s Outcomes3.240Westrum Organizational Culture’s Drivers3.348Drivers of Continuous Delivery4.149Impacts of Continuous Delivery4.250Continuous Delivery Makes Work More Sustainable4.351New Work vs. Unplanned Work4.465Deploys per Developer per Day5.176Components of Lean Management7.178Impacts of Lean Management Practices7.285Components of Lean Product Management8.188Impacts of Lean Product Management8.2
100Impacts of Technical and Lean Practices on Work Life9.1105Impacts of Technical and Lean Practices on Identity10.1
108Impacts of Technical and Lean Practices on JobSatisfaction
10.2
111Gender Demographics in 2017 Study10.3
112Underrepresented Minority Demographics in 2017Study
10.4
121Impacts of Transformational Leadership on Technicaland Lean Capabilities
11.1
137Spurious Correlation: Per Capita Cheese Consumptionand Strangulation by Bedsheets
12.1
FIGURES | ix

182Leadership Obeya (360-Degree Panorama)16.1
184ING’s New Agile Organizational Model Has No FixedStructure—It Constantly Evolves
16.2
186Stand-up and Catchball Rhythm16.3
195High-Performance Team, Management, and LeadershipBehaviors and Practices
16.4
208Overall Research ProgramA.1
222Firmographics: Organization Size, Industry, Numberof Servers in 2017
B.1
Tables15Design vs. Delivery2.119Software Delivery Performance for 20162.219Software Delivery Performance for 20172.332Westrum’s Typology of Organizational Culture3.1
147Westrum’s Typology of Organizational Culture13.1214Manual Work PercentagesB.1
x | TABLES
FOREWORD
By Martin Fowler
Afew years ago I read a report that said, “We can now assertwith confidence that high IT performance correlates with
strong business performance, helping to boost productivity,profitability, and market share.” When I read something like that,my usual response is to toss it with great force into the rubbishbin, because that’s usually a tell for some bogus bullshit masquerad-ing as science. I hesitated this time, however, for this was the“2014 State of DevOps Report.” One of its authors was Jez Hum-ble, a colleague and friend who I knew was equally allergic to thiskind of twaddle. (Although I have to confess that another reasonfor not tossing it was that I was reading it on my iPad.)
So, instead I emailed Jez to find out what lay behind thisstatement. A few weeks later I was on a call with him and NicoleForsgren, who patiently walked me though the reasoning. WhileI’m no expert on the methods they used, she said enough to con-vince me there was some real analysis going on here, far morethan I usually see, even in academic papers. I followed the sub-sequent State of DevOps reports with interest, but also withgrowing frustration. The reports gave the results of their work butnever contained the explanation that Nicole walked through withme on the phone. This greatly undermined their credibility, asthere was little evidence that these reports were based on morethan speculation. Finally, those of us that had seen behind thecurtains convinced Nicole, Jez, and Gene to reveal their methods
FOREWORD | xi
by writing this book. For me, it’s been a long wait, but I’m glad Inow have something that I can genuinely recommend as a way tolook at IT delivery effectiveness—one that’s based on more thana few analysts’ scattered experiences.
The picture they paint is compelling. They describe how effectiveIT delivery organizations take about an hour to get code from“committed to mainline” to “running in production,” a journeylesser organizations take months to do. They, thus, update theirsoftware many times a day instead of once every few months, in-creasing their ability to use software to explore the market, respondto events, and release features faster than their competition. Thishuge increase in responsiveness does not come at a cost in stabil-ity, since these organizations find their updates cause failures ata fraction of the rate of their less-performing peers, and thesefailures are usually fixed within the hour. Their evidence refutesthe bimodal IT notion that you have to choose between speed andstability—instead, speed depends on stability, so good IT practicesgive you both.
So, as you may expect, I’m delighted that they’ve put this bookinto production, and I will be recommending it willy-nilly over thenext few years. (I’ve already been using many bits from its draftsin my talks.) However, I do want to put in a few notes of caution.They do a good job of explaining why their approach to surveysmakes them a good basis for their data. However, they are stillsurveys that capture subjective perceptions, and I wonder howtheir population sample reflects the general IT world. I’ll have moreconfidence in their results when other teams, using different ap-proaches, are able to confirm their reasoning. The book alreadyhas some of this, as the work done by Google on team culturesprovides further evidence to support their judgment on how im-portant a Westrum-generative organizational culture is for effective
xii | FOREWORD
software teams. Such further work would also make me less con-cerned that their conclusions confirm much of my advocacy—confirmation bias is a strong force (although I mostly notice it inothers ;-) ). We should also remember that their book focuses onIT delivery, that is, the journey from commit to production, notthe entire software development process.
But these quibbles, while present, shouldn’t distract us fromthe main thrust of this book. These surveys, and the careful analy-sis done on them, provide some of the best justification aroundfor practices that can significantly improve most IT organizations.Anyone running an IT group should take a good hard look at thesetechniques and work to use them to improve their practice. Anyoneworking with an IT group, either internally or from an IT deliverycompany like ours, should look for these practices in place and asteady program of continuous improvement to go with them.Forsgren, Humble, and Kim have laid out a picture of what effectiveIT looks like in 2017, and IT practitioners should be using this asa map to join the high performers.
Martin FowlerChief Scientist, ThoughtWorks
FOREWORD | xiii

FOREWORD
By Courtney Kissler
My journey started in the summer of 2011. I was working atNordstrom and we had made a strategic decision to focus
on digital as the growth engine. Up until that point, our IT orga-nization was optimized for cost; I shared in my DevOps EnterpriseSummit 2014 presentation that one of my “aha” moments was theshift to optimizing for speed. I made a lot of mistakes along theway and wish I had access to the information in this book backthen. Common traps were stepped in—like trying a top-downmandate to adopt Agile, thinking it was one size fits all, not focus-ing on measurement (or the right things to measure), leadershipbehavior not changing, and treating the transformation like aprogram instead of creating a learning organization (never done).
Throughout the journey, the focus was moving to outcome-based team structures, knowing our cycle time (by understandingour value stream map), limiting the blast radius (starting with oneto two teams vs. boiling the ocean), using data to drive actionsand decisions, acknowledging that work is work (don’t have abacklog of features and a backlog of technical debt and a backlogof operational work; instead, have a single backlog because NFRsare features and reducing technical debt improves stability of theproduct). None of this happened overnight, and it took a lot ofexperimentation and adjusting along the way.
FOREWORD | xv
What I know to be true based on my experience is thatadopting the guidance in this book will make your organizationhigher performing. It works for all types of software delivery andis methodology agnostic. I have personally experienced it and havemultiple examples of applying these practices within mainframeenvironments, traditional packaged software application deliveryteams, and product teams. It can work across the board. It takesdiscipline, persistence, transformational leadership, and a focus onpeople. After all, people are an organization’s #1 asset, but so oftenthat is not how organizations operate. Even though the journeywill not be easy, I can say that it is definitely worth it, and notonly will you see better results, your team will be happier. As anexample, when we started measuring eNPS, the teams practicingthese techniques had the highest scores throughout our technologyorganization.
Another thing I learned along the way is how critical it is tohave senior leadership support. And support in actions, not words.Senior leaders need to demonstrate their commitment to creatinga learning organization. I will share the behaviors I try to modelwith my teams. I believe passionately in honoring and extractingreality. If I am a senior leader and my team doesn’t feel comfort-able sharing risks, then I will never truly know reality. And, if I’mnot genuinely curious and only show up when there’s a failure,then I am failing as a senior leader. It’s important to build trustand to demonstrate that failure leads to inquiry (see the Westrummodel in this book).
You will encounter skeptics along the way. I heard things like“DevOps is the new Agile,” “Lean doesn’t apply to software deliv-ery,” “Of course this worked for the mobile app team. They are aunicorn.” When I encountered the skeptics, I attempted to useexternal examples to influence the discussion. I leveraged mentors
xvi | FOREWORD

along the way—without them, it would have been challenging tostay focused. Having the information in this book would have beenextremely helpful and I strongly encourage you to use it withinyour organization. I have spent most of my career in retail; in thatindustry, it has become more and more critical to evolve, andshipping software is now part of the DNA of every organization.Don’t ignore the science outlined in this book. It will help youaccelerate your transformation to a high-performing technologyorganization.
Courtney KisslerVP Digital Platform Engineering, Nike
FOREWORD | xvii

QUICK REFERENCE:CAPABILITIES TODRIVE IMPROVEMENT
Our research has uncovered 24 key capabilities that drive im-provements in software delivery performance. This reference
will point you to them in the book. A detailed guide is found inAppendix A. They are presented in no particular order.
The capabilities are classified into five categories:
• Continuous delivery• Architecture• Product and process• Lean management and monitoring• Cultural
CONTINUOUS DELIVERY CAPABILITIES
1. Version control: Chapter 42. Deployment automation: Chapter 43. Continuous integration: Chapter 44. Trunk-based development: Chapter 45. Test automation: Chapter 46. Test data management: Chapter 47. Shift left on security: Chapter 68. Continuous delivery (CD): Chapter 4
QUICK REFERENCE: CAPABILITIES TO DRIVE IMPROVEMENT | xix
ARCHITECTURE CAPABILITIES
9. Loosely coupled architecture: Chapter 510. Empowered teams: Chapter 5
PRODUCT AND PROCESS CAPABILITIES
11. Customer feedback: Chapter 812. Value stream: Chapter 813. Working in small batches: Chapter 814. Team experimentation: Chapter 8
LEAN MANAGEMENT AND MONITORINGCAPABILITIES
15. Change approval processes: Chapter 716. Monitoring: Chapter 717. Proactive notification: Chapter 1318. WIP limits: Chapter 719. Visualizing work: Chapter 7
CULTURAL CAPABILITIES
20. Westrum organizational culture: Chapter 321. Supporting learning: Chapter 1022. Collaboration among teams: Chapters 3 and 523. Job satisfaction: Chapter 1024. Transformational leadership: Chapter 11
xx | QUICK REFERENCE: CAPABILITIES TO DRIVE IMPROVEMENT
PREFACE
Beginning in late 2013, we embarked on a four-year researchjourney to investigate what capabilities and practices are im-
portant to accelerate the development and delivery of softwareand, in turn, value to companies. These results are seen in theirprofitability, productivity, and market share. We see similarly strongeffects in noncommercial outcomes of effectiveness, efficiency, andcustomer satisfaction.
This research fills a need that isn’t currently served in themarket. By using rigorous research methods traditionally onlyfound in academia, and making it accessible to industry, our goalis to advance the state of software development and delivery. Byhelping the industry identify and understand the capabilities thatactually drive performance improvements in a statistically mean-ingful way—more than just anecdote, and beyond the experiencesof one or a few teams—we can help the industry improve.
To conduct the research found in this book (in addition to re-search we still actively conduct), we use cross-sectional studies.The same methods are used in healthcare research (e.g., to inves-tigate the relationship between beer and obesity, Bobak et al.2003), workplace research (e.g., to study the relationship betweenthe work environment and cardiovascular disease, Johnson andHall 1988), and memory research (e.g., to investigate differencesin development and decline in memory, Alloway and Alloway 2013).As we want to truly investigate the industry and understand whatdrives improvement in software and organizational performancein a meaningful way, we use rigorous academic research design
PREFACE | xxi
methods and publish much of our work in academic peer-reviewedjournals. For more information about the methods used in ourresearch, check out Part II: The Research.
THE RESEARCH
Our research collected over 23,000 survey responses from aroundthe world. We heard from over 2,000 unique organizations, fromsmall startups of under five employees to large enterprises withover 10,000 employees. We collected data from startups andcutting-edge internet companies as well as highly regulated indus-tries, such as finance, healthcare, and government. Our data andanalysis includes software developed on brand new “greenfield”platforms as well as legacy code maintenance and development.
The findings in this book will apply whether you’re using atraditional “waterfall” methodology (also known as gated, structured,or plan-driven) and just beginning your technology transformation,or whether you have been implementing Agile and DevOps practicesfor years. This is true because software delivery is an exercise incontinuous improvement, and our research shows that year overyear the best keep getting better, and those who fail to improvefall further and further behind.
Improvement Is Possible for EveryoneOur quest to understand how to measure and improve soft-ware delivery was full of insights and surprises. The moral ofthe story, borne out in the data, is this: improvements insoftware delivery are possible for every team and in everycompany, as long as leadership provides consistent support—
xxii | PREFACE
including time, actions, and resources—demonstrating atrue commitment to improvement, and as long as teammembers commit themselves to the work.
Our goal in writing this book is to share what we have learnedso that we can help organizations excel, grow happier teams whodeliver better software faster, and help individuals and organiza-tions thrive. The rest of this preface briefly describes the research,how it began, and how it was conducted. More detail about thescience behind the study can be found in Part II of this book.
THE JOURNEY AND THE DATA
We are often asked about the genesis story of this research. It isbased on a compelling curiosity for what makes high-performingtechnology organizations great, and how software makes organiza-tions better. Each author spent time on parallel paths working tounderstand superior technical performance before joining forcesin late 2013:
• Nicole Forsgren has a PhD in Management InformationSystems. Prior to 2013, she spent several years researchingthe factors that make technology impactful in organizations,particularly among the professionals that make software andsupport infrastructure. She has authored dozens of peer-reviewed articles on the subject. Before her PhD, she was asoftware and hardware engineer and a sysadmin.
• Jez Humble is the coauthor of Continuous Delivery, LeanEnterprise, and The DevOps Handbook. His first job aftercollege was working at a startup in London in 2000, and
PREFACE | xxiii
then from 2005–2015 he spent a decade at ThoughtWorksdelivering software products and consulting as an infrastruc-ture specialist, developer, and product manager.
• Gene Kim has been studying high-performing technologyorganizations since 1999. He was the founder and CTO ofTripwire for thirteen years and is the coauthor of manybooks, including The Phoenix Project and The Visible OpsHandbook.
In late 2013, Nicole, Jez, and Gene started working togetherwith the team at Puppet in preparation for the 2014 State ofDevOps Report.1 By combining practical expertise and academicrigor, the team was able to generate something unique in the in-dustry: a report containing insights into how to help technologydeliver value to employees, organizations, and customers in predic-tive ways. Over the next four reports, Nicole, Jez, and Gene con-tinued collaborating with the Puppet team to iterate on researchdesign and continuously improve the industry’s understanding ofwhat contributes to great software delivery, what enables greattechnical teams, and how companies can become high-performingorganizations and win in the market by leveraging technology. Thisbook covers four years of research findings, starting with that re-port (2014 through 2017).
1 It is important to note that the State of DevOps Report got its start prior to 2014. In2012, the team at Puppet Inc. invited Gene to participate in the second iteration of astudy it was developing to better understand a little known phenomenon called DevOps,how it was being adopted, and the performance advantages organizations were seeing.Puppet had been a big proponent and driver of the movement as the idea of “DevOps”began to take shape following the first DevOpsDays, discussions on Twitter, and a seminaltalk by John Allspaw and Paul Hammond. Gene then invited Jez to join the study, andtogether they collected and analyzed 4,000 survey responses from around the world, makingit the largest survey of its kind.
xxiv | PREFACE
To collect the data, each year we emailed invitations to ourmailing lists and leveraged social media, including Twitter, LinkedIn,and Facebook. Our invitations targeted professionals working intechnology, especially those familiar with software developmentand delivery paradigms and DevOps. We encouraged our readersto invite friends and peers who might also work in software devel-opment and delivery to help us broaden our reach. This is calledsnowball sampling, and we talk about why this was an appropriatedata collection method for this research project in Chapter 15,"The Data for the Project."
The data for our project came from surveys. We used surveysbecause they are the best way to collect a large amount of datafrom thousands of organizations in a short amount of time. Fora detailed discussion of why good research can be conducted fromsurveys, as well as the steps we took to ensure the data wecollected was trustworthy and accurate, see Part II which coversthe science and research behind the book.
Here is a brief outline of the research and how it evolved overthe years.
2014: LAYING THE FOUNDATION.DELIVERY PERFORMANCE AND
ORGANIZATIONAL PERFORMANCE
Our research goals for the first year were to lay a foundation forunderstanding software development and delivery in organizations.Some key research questions were:
• What does it mean to deliver software, and can it bemeasured?
• Does software delivery impact organizations?
PREFACE | xxv
• Does culture matter, and how do we measure it?• What technical practices appear to be important?
We were pleasantly surprised by many of the results in thefirst year. We discovered that software development and deliverycan be measured in a statistically meaningful way, and that highperformers do it in consistently good ways that are significantlybetter than many other companies. We also found that throughputand stability move together, and that an organization’s ability tomake software positively impacts profitability, productivity, andmarket share. We saw that culture and technical practices matter,and found how to measure them. This is covered in Part I ofthis book.
The team also revised the way most of the data had beenmeasured in the past, moving from simple yes/no questions toLikert-type questions (in which respondents choose from a rangeof options from “Strongly Disagree” to “Strongly Agree”). Thissimple change in survey questions let the team collect more nu-anced data—shades of gray instead of black and white. This allowedfor more detailed analysis. For a discussion of the authors’ choiceto use surveys for this research project and why you can trusttheir survey-based data, see Chapter 14, "Why Use a Survey."
2015: EXTENDING THE WORK ANDDEEPENING THE ANALYSIS
Much like technology transformations and business growth, con-ducting research is all about iteration, incremental improvements,and revalidation of important results. Armed with our findingsfrom the first year, our goals in year two were to revalidate andconfirm some key findings (e.g., software delivery can be defined
xxvi | PREFACE
and measured in a statistically meaningful way, software deliveryimpacts organizational performance) while also extending themodel.
These were some of the research questions:
• Can we revalidate that software delivery impacts organiza-tional performance?
• Do technical practices and automation impact softwaredelivery?
• Do lean management practices impact software delivery?• Do technical practices and Lean management practices im-
pact aspects of work that affect our workforce—such asanxiety associated with code deployments and burnout?
Once again, we got some great confirmations and somesurprises. Our hypotheses were supported, confirming and extendingthe work we had done the previous year. These results can befound in Part I.
2016: EXPANDING OUR LOOK INTO TECHNICALPRACTICES AND EXPLORING THE FUZZY FRONT END
In year three, we again built on the core foundation of our modeland extended it to explore the significance of additional technicalpractices (such as security, trunk-based development, and test datamanagement). Inspired by conversations with colleagues workingin product management, we also extended our investigation furtherupstream, to see if we could measure the impact of the currentmove away from traditional project management practices to ap-plying Lean principles in product management. We extended our
PREFACE | xxvii
investigation to include quality measures such as defects, rework,and security remediation. Finally, we included additional questionsto help us understand how technical practices influence humancapital: employee Net Promoter Score (eNPS) and work identity—afactor that is likely to decrease burnout.
These were our research questions:
• Does the integration of security into software developmentand delivery help the process or slow it down?
• Does trunk-based development contribute to better softwaredelivery?
• Is a Lean approach to product management an importantaspect of software development and delivery?
• Do good technical practices contribute to strong companyloyalty?
2017: INCLUDING ARCHITECTURE, EXPLORINGTHE ROLE OF LEADERS, AND MEASURING SUCCESS
IN NOT-FOR-PROFIT ORGANIZATIONS
Year four of the research saw us moving into questions about howsystems are architected and the impact architecture has on teams’and organizations’ ability to deliver software and value. We alsoextended our research to include measures of value that extendedbeyond profitability, productivity, and market share, allowing theanalysis to speak to a not-for-profit audience. The research thisyear also explored the role of leaders to measure the impact oftransformational leadership in organizations.
Our driving research questions in year four were:
xxviii | PREFACE
• What architectural practices drive improvements in softwaredelivery performance?
• How does transformational leadership impact softwaredelivery?
• Does software delivery impact not-for-profit outcomes?
CONCLUSION
We hope that as you read this book you discover, as a technologistand technology leader, the essential components to making yourorganization better—starting with software delivery. It is throughimproving our ability to deliver software that organizations candeliver features faster, pivot when needed, respond to complianceand security changes, and take advantage of fast feedback to attractnew customers and delight existing ones.
In the chapters that follow, we identify the key capabilities thatdrive the software delivery performance (and define what softwaredelivery performance is) and briefly touch on the key points ineach. Part I of the book presents our findings, Part II discussesthe science and research behind our results, and finally, Part IIIpresents a case study of what is possible when organizations adoptand implement these capabilities in order to drive performance.
PREFACE | xxix

PART ONEWHAT WE FOUND
Armed with robust data-gathering and statistical analysistechniques (discussed in detail in Part II), we have been ableto discover significant and sometimes surprising results overthe past several years working on the State of DevOpsReport. We’ve been able to measure and quantify softwaredelivery performance, its impact on organizational perfor-mance, and the various capabilities that contribute to theseoutcomes.
These capabilities fall into various categories—such astechnical, process, and cultural. We’ve measured the impactof technical practices on culture, and the effect of cultureon delivery and organizational performance. For capabilitiesas disparate as architecture and product management, we’velooked at their contribution to these and other importantsustainability outcomes such as burnout and deployment pain.
In this part of the book we present our results.

CHAPTER 1
ACCELERATE
“Business as usual” is no longer enough to remain competi-tive. Organizations in all industries, from finance and
banking to retail, telecommunications, and even government, areturning away from delivering new products and services using bigprojects with long lead times. Instead, they are using small teamsthat work in short cycles and measure feedback from users to buildproducts and services that delight their customers and rapidlydeliver value to their organizations. These high performers areworking incessantly to get better at what they do, letting no ob-stacles stand in their path, even in the face of high levels of riskand uncertainty about how they may achieve their goals.
To remain competitive and excel in the market, organizationsmust accelerate:
• delivery of goods and services to delight their customers;• engagement with the market to detect and understand
customer demand;• anticipation of compliance and regulatory changes that
impact their systems; and• response to potential risks such as security threats or
changes in the economy.
CHAPTER 1: ACCELERATE | 3
At the heart of this acceleration is software. This is true oforganizations in any industry vertical. Banks no longer delivervalue by holding gold bars in vaults but by trading faster and moresecurely, and by discovering new channels and products to engagecustomers. Retailers win and retain customers by offering themsuperior selection and service, with service coming in the form ofa fast check-out experience, recommended goods at check-out, or aseamless online/offline shopping experience—all of which are en-abled by technology. Government organizations cite the ability toharness technology as the key to serving the public more effectivelyand efficiently while being parsimonious with taxpayer dollars.
Software and technology are key differentiators for organizationsto deliver value to customers and stakeholders. We’ve found it inour own research outlined in this book—and others have foundit, too. For example, a recent study by James Bessen of BostonUniversity found that the strategic use of technology explainsrevenue and productivity gains more than mergers and acquisitions(M&A) and entrepreneurship (2017). Andrew McAfee and ErikBrynjolfsson have also found a link between technology andprofitability (2008).
Software is transforming and accelerating organizations of allkinds. The practices and capabilities we talk about in this bookhave emerged from what is now known as the DevOps movement,and they are transforming industries everywhere. DevOps emergedfrom a small number of organizations facing a wicked problem:how to build secure, resilient, rapidly evolving distributed systemsat scale. In order to remain competitive, organizations must learnhow to solve these problems. We see that large enterprises withlong histories and decades-old technologies also gain significantbenefits, such as accelerated delivery and lower costs, throughadopting the capabilities we outline in this book.
4 | PART ONE
Although many organizations have achieved great success withtheir technology transformations (notable examples include web-scale tech giants such as Netflix, Amazon, Google, and Facebook,as well as more traditional large organizations including CapitalOne, Target, and the US Federal Government’s TechnologyTransformation Service and US Digital Service), there is still a lotof work to be done—both in the broader industry and within in-dividual organizations. A recent Forrester (Stroud et al. 2017) re-port found that 31% of the industry is not using practices andprinciples that are widely considered to be necessary for acceleratingtechnology transformations, such as continuous integration andcontinuous delivery, Lean practices, and a collaborative culture(i.e., capabilities championed by the DevOps movement). However,we also know that technology and software transformations areimperative in organizations today. A recent Gartner study foundthat 47% of CEOs face pressure from their board to digitallytransform (Panetta 2017).
Within organizations, technology transformation journeys areat different stages, and reports suggest there is more work to bedone than many of us currently believe. Another Forrester reportstates that DevOps is accelerating technology, but that organiza-tions often overestimate their progress (Klavens et al. 2017).Furthermore, the report points out that executives are especiallyprone to overestimating their progress when compared to thosewho are actually doing the work.
These findings about the disconnect between executive andpractitioner estimates of DevOps maturity highlight two consider-ations that are often missed by leaders. First, if we assume theestimates of DevOps maturity or capabilities from practitionersare more accurate—because they are closer to the work—the po-tential for value delivery and growth within organizations is much
CHAPTER 1: ACCELERATE | 5
greater than executives currently realize. Second, the disconnectmakes clear the need to measure DevOps capabilities accuratelyand to communicate these measurement results to leaders, whocan use them to make decisions and inform strategy about theirorganization’s technology posture.
FOCUS ON CAPABILITIES, NOT MATURITY
Technology leaders need to deliver software quickly and reliablyto win in the market. For many companies, this requires significantchanges to the way we deliver software. The key to success-ful change is measuring and understanding the right things witha focus on capabilities—not on maturity.
While maturity models are very popular in the industry, wecannot stress enough that maturity models are not the appropriatetool to use or mindset to have. Instead, shifting to a capabilitiesmodel of measurement is essential for organizations wanting toaccelerate software delivery. This is due to four factors.
First, maturity models focus on helping an organization “arrive”at a mature state and then declare themselves done with theirjourney, whereas technology transformations should follow a con-tinuous improvement paradigm. Alternatively, capability modelsfocus on helping an organization continually improve and progress,realizing that the technological and business landscape is ever-changing. The most innovative companies and highest-performingorganizations are always striving to be better and never considerthemselves “mature” or “done” with their improvement or transfor-mation journey—and we see this in our research.
Second, maturity models are quite often a “lock-step” or linearformula, prescribing a similar set of technologies, tooling, or capa-bilities for every set of teams and organizations to progress
6 | PART ONE
through. Maturity models assume that “Level 1” and “Level 2” lookthe same across all teams and organizations, but those of us whowork in technology know this is not the case. In contrast, capabil-ity models are multidimensional and dynamic, allowing differentparts of the organization to take a customized approach to improve-ment, and focus on capabilities that will give them the most benefitbased on their current context and their short- and long-termgoals. Teams have their own context, their own systems, theirown goals, and their own constraints, and what we should focuson next to accelerate our transformation depends on those things.
Third, capability models focus on key outcomes and how thecapabilities, or levers, drive improvement in those outcomes—thatis, they are outcome based. This provides technical leadership withclear direction and strategy on high-level goals (with a focus oncapabilities to improve key outcomes). It also enables team leadersand individual contributors to set improvement goals related tothe capabilities their team is focusing on for the current timeperiod. Most maturity models simply measure the technical profi-ciency or tooling install base in an organization without tying itto outcomes. These end up being vanity metrics: while they canbe relatively easy to measure, they don’t tell us anything aboutthe impact they have on the business.
Fourth, maturity models define a static level of technological,process, and organizational abilities to achieve. They do not takeinto account the ever-changing nature of the technology andbusiness landscape. Our own research and data have confirmedthat the industry is changing: what is good enough and even “high-performing” today is no longer good enough in the next year. Incontrast, capability models allow for dynamically changing environ-ments and allow teams and organizations to focus on developingthe skills and capabilities needed to remain competitive.
CHAPTER 1: ACCELERATE | 7
By focusing on a capabilities paradigm, organizations can con-tinuously drive improvement. And by focusing on the right capabil-ities, organizations can drive improvements in their outcomes,allowing them to develop and deliver software with improved speedand stability. In fact, we see that the highest performers do exactlythis, continually reaching for gains year over year and never settlingfor yesterday’s accomplishments.
EVIDENCE-BASED TRANSFORMATIONSFOCUS ON KEY CAPABILITIES
Within both capability and maturity model frameworks, there aredisagreements about which capabilities to focus on. Product vendorsoften favor capabilities that align with their product offerings.Consultants favor capabilities that align with their background,their offering, and their homegrown assessment tool. We haveseen organizations try to design their own assessment models,choose solutions that align with the skill sets of internal champions,or succumb to analysis paralysis because of the sheer number ofareas that need improvement in their organization.
A more guided, evidence-based solution is needed, and theapproach discussed in this book describes such a solution.
Our research has yielded insights into what enables both soft-ware delivery performance and organizational performance as seenin profitability, productivity, and market share. In fact, our researchshows that none of the following often-cited factors predictedperformance:
• age and technology used for the application (for example,mainframe “systems of record” vs. greenfield “systems ofengagement”)
8 | PART ONE
• whether operations teams or development teams performeddeployments
• whether a change approval board (CAB) is implemented
The things that do make a difference in the success of softwaredelivery and organizational performance are those that the highestperformers and most innovative companies use to get ahead. Ourresearch has identified 24 key capabilities that drive improvementin software delivery performance and, in turn, organizational per-formance. These capabilities are easy to define, measure, and im-prove.1 This book will get you started on defining and measuringthese capabilities. We will also point you to some fantasticresources for improving them, so you can accelerate your owntechnology transformation journey.
THE VALUE OF ADOPTING DEVOPS
You may be asking yourself: How do we know that these capabili-ties are drivers of technology and organizational performance, andwhy can we say it with such confidence?
The findings from our research program show clearly that thevalue of adopting DevOps is even larger than we had initiallythought, and the gap between high and low performers continuesto grow.
We discuss how we measure software delivery performance andhow our cohort performs in detail in the following chapter. Tosummarize, in 2017 we found that, when compared to low perform-ers, the high performers have:
1 These 24 capabilities are listed, along with a pointer to the chapter that discusses them,in Appendix A.
CHAPTER 1: ACCELERATE | 9
• 46 times more frequent code deployments• 440 times faster lead time from commit to deploy• 170 times faster mean time to recover from downtime• 5 times lower change failure rate (1/5 as likely for a change
to fail)
When compared to the 2016 results, the gap between highperformers and low performers narrowed for tempo (deploymentfrequency and change lead time) and widened for stability (meantime to recover and change failure rate). We speculate that this isdue to low-performing teams working to increase tempo but notinvesting enough in building quality into the process. The resultis larger deployment failures that take more time to restore service.High performers understand that they don’t have to trade speedfor stability or vice versa, because by building quality in theyget both.
You may be wondering: How do high-performing teams achievesuch amazing software delivery performance? They do this byturning the right levers—that is, by improving the right capabilities.
Over our four-year research program we have been able toidentify the capabilities that drive performance in software deliveryand impact organizational performance, and we have found thatthey work for all types of organizations. Our research investigatedorganizations of all sizes, in all industries, using legacy andgreenfield technology stacks around the world—so the findings inthis book will apply to the teams in your organization too.
10 | PART ONE
CHAPTER 2
MEASURING PERFORMANCE
There are many frameworks and methodologies that aim toimprove the way we build software products and services. We
wanted to discover what works and what doesn’t in a scientificway, starting with a definition of what “good” means in this con-text. This chapter presents the framework and methods we usedto work towards this goal, and in particular the key outcomemeasures applied throughout the rest of this book.
By the end of this chapter, we hope you’ll know enough aboutour approach to feel confident in the results we present in therest of the book.
Measuring performance in the domain of software is hard—inpart because, unlike manufacturing, the inventory is invisible.Furthermore, the way we break down work is relatively arbitrary,and the design and delivery activities—particularly in the Agilesoftware development paradigm—happen simultaneously. Indeed,it’s expected that we will change and evolve our design based onwhat we learn by trying to implement it. So our first stepmust be to define a valid, reliable measure of software deliveryperformance.
CHAPTER 2: MEASURING PERFORMANCE | 11
THE FLAWS IN PREVIOUS ATTEMPTS TOMEASURE PERFORMANCE
There have been many attempts to measure the performance ofsoftware teams. Most of these measurements focus on productivity.In general, they suffer from two drawbacks. First, they focus onoutputs rather than outcomes. Second, they focus on individual orlocal measures rather than team or global ones. Let’s take threeexamples: lines of code, velocity, and utilization.
Measuring productivity in terms of lines of code has a longhistory in software. Some companies even required developers torecord the lines of code committed per week.1 However, in realitywe would prefer a 10-line solution to a 1,000-line solution to aproblem. Rewarding developers for writing lines of code leads tobloated software that incurs higher maintenance costs and highercost of change. Ideally, we should reward developers for solvingbusiness problems with the minimum amount of code—and it’seven better if we can solve a problem without writing code at allor by deleting code (perhaps by a business process change). How-ever, minimizing lines of code isn’t an ideal measure either. Atthe extreme, this too has its drawbacks: accomplishing a task ina single line of code that no one else can understand is less desir-able than writing a few lines of code that are easily understoodand maintained.
With the advent of Agile software development came a newway to measure productivity: velocity. In many schools of Agile,problems are broken down into stories. Stories are then estimatedby developers and assigned a number of “points” representingthe relative effort expected to complete them. At the end of an
1 There’s a good story about how the Apple Lisa team’s management discovered that linesof code were meaningless as a productivity metric: http://www.folklore.org/StoryView.py?story=Negative_2000_Lines_Of_Code.txt.
12 | PART ONE
iteration, the total number of points signed off by the customeris recorded—this is the team’s velocity. Velocity is designed to beused as a capacity planning tool; for example, it can be used to ex-trapolate how long it will take the team to complete all the workthat has been planned and estimated. However, some managershave also used it as a way to measure team productivity, or evento compare teams.
Using velocity as a productivity metric has several flaws. First,velocity is a relative and team-dependent measure, not an absoluteone. Teams usually have significantly different contexts whichrender their velocities incommensurable. Second, when velocity isused as a productivity measure, teams inevitably work to gametheir velocity. They inflate their estimates and focus on completingas many stories as possible at the expense of collaboration withother teams (which might decrease their velocity and increasethe other team’s velocity, making them look bad). Not only doesthis destroy the utility of velocity for its intended purpose, it alsoinhibits collaboration between teams.
Finally, many organizations measure utilization as a proxy forproductivity. The problem with this method is that high utilizationis only good up to a point. Once utilization gets above a certainlevel, there is no spare capacity (or “slack”) to absorb unplannedwork, changes to the plan, or improvement work. This results inlonger lead times to complete work. Queue theory in math tellsus that as utilization approaches 100%, lead times approachinfinity—in other words, once you get to very high levels of uti-lization, it takes teams exponentially longer to get anything done.Since lead time—a measure of how fast work can be completed—isa productivity metric that doesn’t suffer from the drawbacks ofthe other metrics we’ve seen, it’s essential that we manage utiliza-tion to balance it against lead time in an economically optimal way.
CHAPTER 2: MEASURING PERFORMANCE | 13
MEASURING SOFTWARE DELIVERYPERFORMANCE
A successful measure of performance should have two key charac-teristics. First, it should focus on a global outcome to ensure teamsaren’t pitted against each other. The classic example is rewardingdevelopers for throughput and operations for stability: this is akey contributor to the “wall of confusion” in which developmentthrows poor quality code over the wall to operations, and opera-tions puts in place painful change management processes as a wayto inhibit change. Second, our measure should focus on outcomesnot output: it shouldn’t reward people for putting in large amountsof busywork that doesn’t actually help achieve organizational goals.
In our search for measures of delivery performance that meetthese criteria, we settled on four: delivery lead time, deploymentfrequency, time to restore service, and change fail rate. In thissection, we’ll discuss why we picked these particular measures.
The elevation of lead time as a metric is a key element of Leantheory. Lead time is the time it takes to go from a customermaking a request to the request being satisfied. However, in thecontext of product development, where we aim to satisfy multiplecustomers in ways they may not anticipate, there are two partsto lead time: the time it takes to design and validate a product orfeature, and the time to deliver the feature to customers. In thedesign part of the lead time, it’s often unclear when to start theclock, and often there is high variability. For this reason, Reinertsencalls this part of the lead time the “fuzzy front end” (Reinertsen2009). However, the delivery part of the lead time—the time ittakes for work to be implemented, tested, and delivered—is easierto measure and has a lower variability. Table 2.1 (Kim et al. 2016)shows the distinction between these two domains.
14 | PART ONE
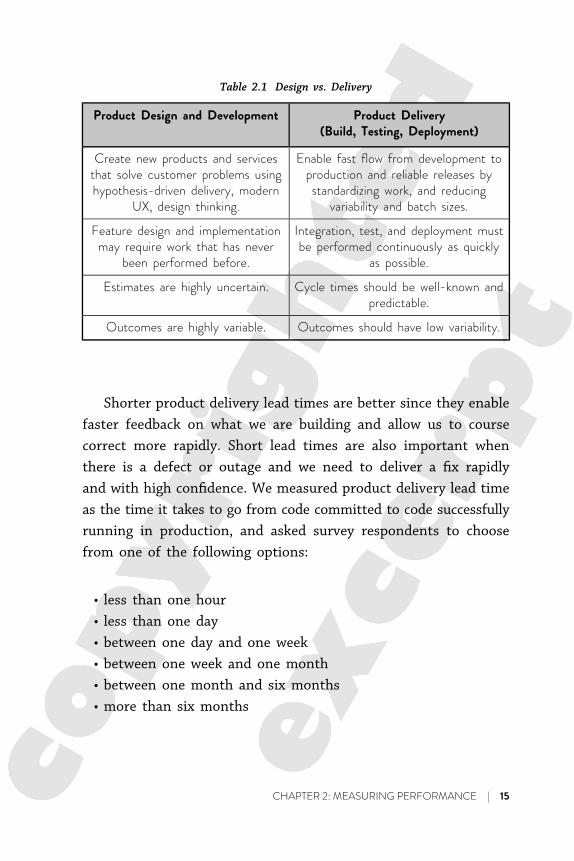
Table 2.1 Design vs. Delivery
Product Delivery(Build, Testing, Deployment)
Product Design and Development
Enable fast flow from development toproduction and reliable releases by
standardizing work, and reducingvariability and batch sizes.
Create new products and servicesthat solve customer problems usinghypothesis-driven delivery, modern
UX, design thinking.
Integration, test, and deployment mustbe performed continuously as quickly
as possible.
Feature design and implementationmay require work that has never
been performed before.
Cycle times should be well-known andpredictable.
Estimates are highly uncertain.
Outcomes should have low variability.Outcomes are highly variable.
Shorter product delivery lead times are better since they enablefaster feedback on what we are building and allow us to coursecorrect more rapidly. Short lead times are also important whenthere is a defect or outage and we need to deliver a fix rapidlyand with high confidence. We measured product delivery lead timeas the time it takes to go from code committed to code successfullyrunning in production, and asked survey respondents to choosefrom one of the following options:
• less than one hour• less than one day• between one day and one week• between one week and one month• between one month and six months• more than six months
CHAPTER 2: MEASURING PERFORMANCE | 15
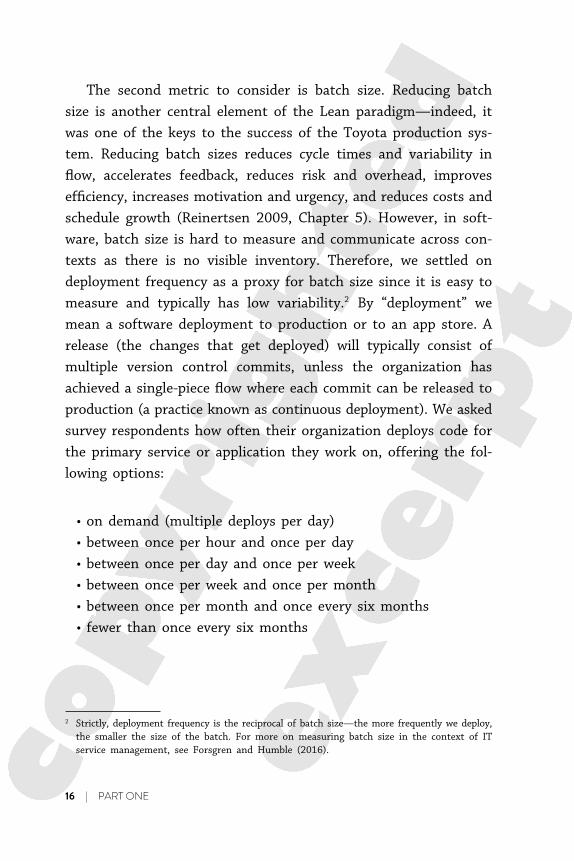
The second metric to consider is batch size. Reducing batchsize is another central element of the Lean paradigm—indeed, itwas one of the keys to the success of the Toyota production sys-tem. Reducing batch sizes reduces cycle times and variability inflow, accelerates feedback, reduces risk and overhead, improvesefficiency, increases motivation and urgency, and reduces costs andschedule growth (Reinertsen 2009, Chapter 5). However, in soft-ware, batch size is hard to measure and communicate across con-texts as there is no visible inventory. Therefore, we settled ondeployment frequency as a proxy for batch size since it is easy tomeasure and typically has low variability.2 By “deployment” wemean a software deployment to production or to an app store. Arelease (the changes that get deployed) will typically consist ofmultiple version control commits, unless the organization hasachieved a single-piece flow where each commit can be released toproduction (a practice known as continuous deployment). We askedsurvey respondents how often their organization deploys code forthe primary service or application they work on, offering the fol-lowing options:
• on demand (multiple deploys per day)• between once per hour and once per day• between once per day and once per week• between once per week and once per month• between once per month and once every six months• fewer than once every six months
2 Strictly, deployment frequency is the reciprocal of batch size—the more frequently we deploy,the smaller the size of the batch. For more on measuring batch size in the context of ITservice management, see Forsgren and Humble (2016).
16 | PART ONE
Delivery lead times and deployment frequency are both mea-sures of software delivery performance tempo. However, we wantedto investigate whether teams who improved their performance weredoing so at the expense of the stability of the systems theywere working on. Traditionally, reliability is measured as time be-tween failures. However, in modern software products and services,which are rapidly changing complex systems, failure is inevitable,so the key question becomes: How quickly can service be restored?We asked respondents how long it generally takes to restore servicefor the primary application or service they work on when aservice incident (e.g., unplanned outage, service impairment) occurs,offering the same options as for lead time (above).
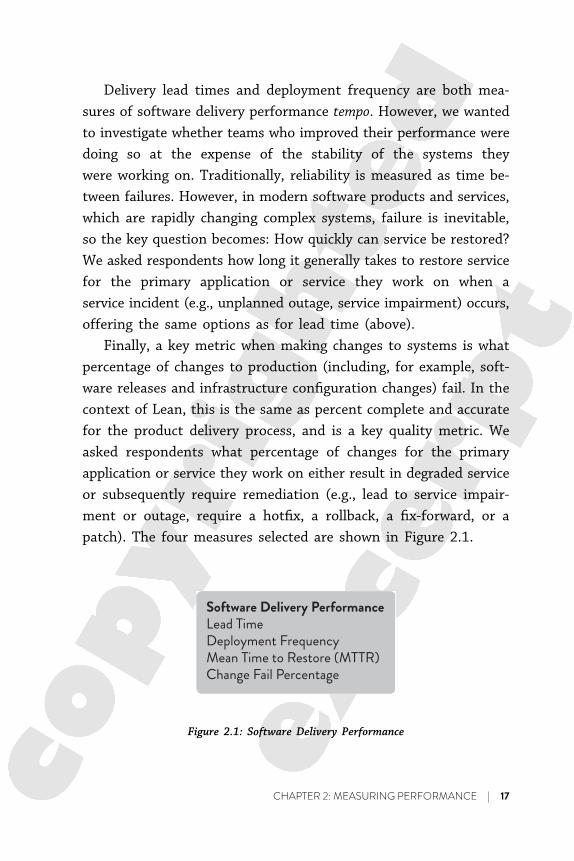
Finally, a key metric when making changes to systems is whatpercentage of changes to production (including, for example, soft-ware releases and infrastructure configuration changes) fail. In thecontext of Lean, this is the same as percent complete and accuratefor the product delivery process, and is a key quality metric. Weasked respondents what percentage of changes for the primaryapplication or service they work on either result in degraded serviceor subsequently require remediation (e.g., lead to service impair-ment or outage, require a hotfix, a rollback, a fix-forward, or apatch). The four measures selected are shown in Figure 2.1.
Software Delivery PerformanceLead TimeDeployment FrequencyMean Time to Restore (MTTR)Change Fail Percentage
Figure 2.1: Software Delivery Performance
CHAPTER 2: MEASURING PERFORMANCE | 17
In order to analyze delivery performance across the cohort wesurveyed, we used a technique called cluster analysis. Cluster analysisis a foundational technique in statistical data analysis that attemptsto group responses so that responses in the same group are moresimilar to each other than to responses in other groups. Eachmeasurement is put on a separate dimension, and the clusteringalgorithm attempts to minimize the distance between all clustermembers and maximize differences between clusters. This techniquehas no understanding of the semantics of responses—in otherwords, it doesn’t know what counts as a “good” or “bad” responsefor any of the measures.3
This data-driven approach that categorizes the data withoutany bias toward “good” or “bad” gives us an opportunity to viewtrends in the industry without biasing the results a priori.Using cluster analysis also allowed us to identify categories ofsoftware delivery performance seen in the industry: Are therehigh performers and low performers, and what characteristics dothey have?
We applied cluster analysis in all four years of the researchproject and found that every year, there were significantly differentcategories of software delivery performance in the industry. Wealso found that all four measures of software delivery performanceare good classifiers and that the groups we identified in theanalysis—high, medium, and low performers—were all significantlydifferent across all four measures.
Tables 2.2 and 2.3 show you the details for software deliveryperformance for the last two years of our research (2016 and2017).
3 For more on cluster analysis, see Appendix B.
18 | PART ONE
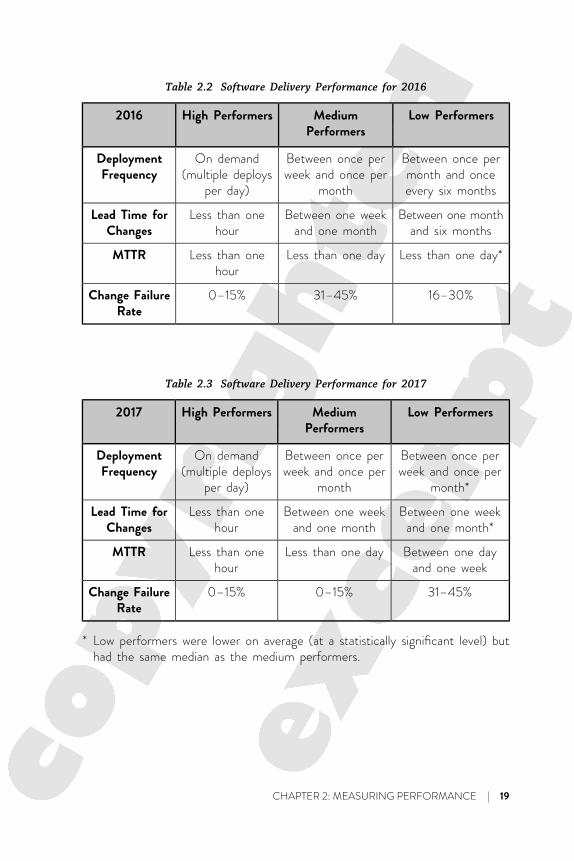
Table 2.2 Software Delivery Performance for 2016
Low PerformersMediumPerformers
High Performers2016
Between once permonth and onceevery six months
Between once perweek and once per
month
On demand(multiple deploys
per day)
DeploymentFrequency
Between one monthand six months
Between one weekand one month
Less than onehour
Lead Time forChanges
Less than one day*Less than one dayLess than onehour
MTTR
16–30%31–45%0–15%Change FailureRate
Table 2.3 Software Delivery Performance for 2017
Low PerformersMediumPerformers
High Performers2017
Between once perweek and once per
month*
Between once perweek and once per
month
On demand(multiple deploys
per day)
DeploymentFrequency
Between one weekand one month*
Between one weekand one month
Less than onehour
Lead Time forChanges
Between one dayand one week
Less than one dayLess than onehour
MTTR
31–45%0–15%0–15%Change FailureRate
* Low performers were lower on average (at a statistically significant level) buthad the same median as the medium performers.
CHAPTER 2: MEASURING PERFORMANCE | 19
Astonishingly, these results demonstrate that there is no trade-off between improving performance and achieving higher levels ofstability and quality. Rather, high performers do better at allof these measures. This is precisely what the Agile and Leanmovements predict, but much dogma in our industry still rests onthe false assumption that moving faster means trading off againstother performance goals, rather than enabling and reinforcingthem.4
Furthermore, over the last few years we’ve found that thehigh-performing cluster is pulling away from the pack. The DevOpsmantra of continuous improvement is both exciting and real,pushing companies to be their best, and leaving behindthose who do not improve. Clearly, what was state of the artthree years ago is just not good enough for today’s business envi-ronment.
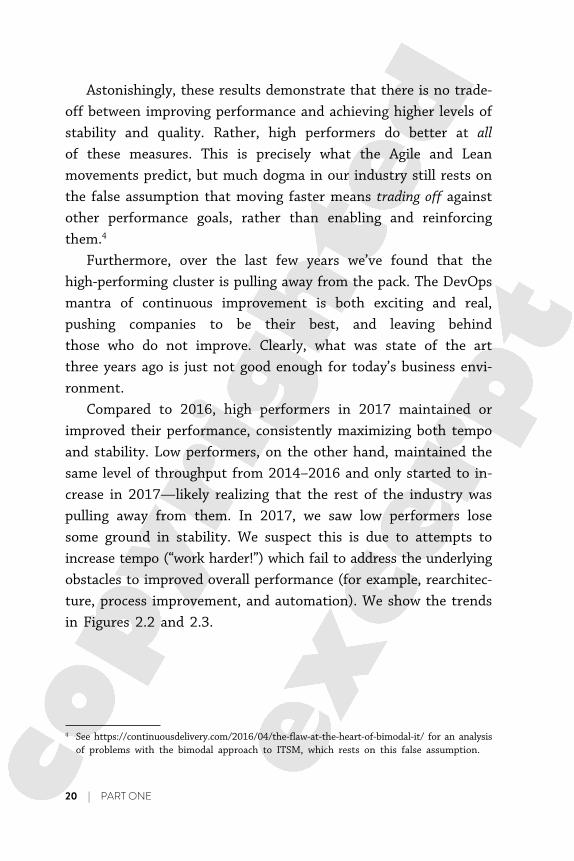
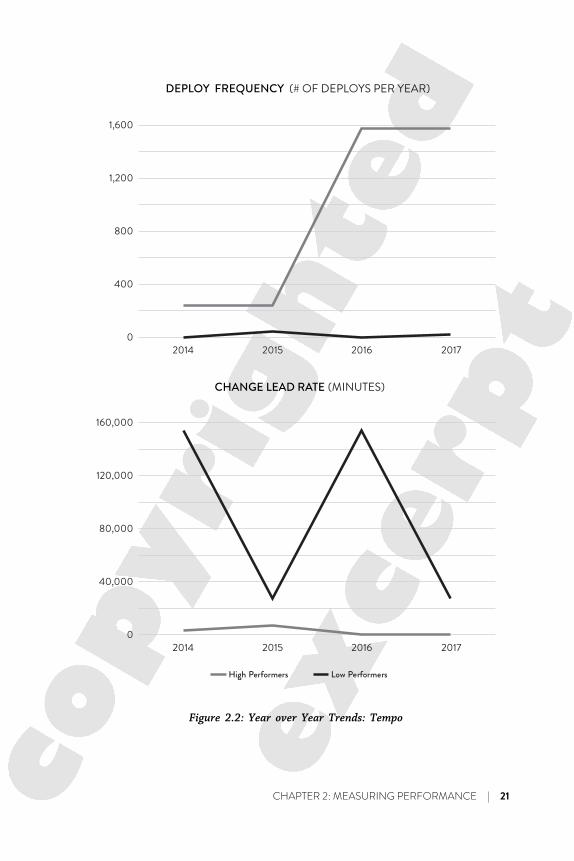
Compared to 2016, high performers in 2017 maintained orimproved their performance, consistently maximizing both tempoand stability. Low performers, on the other hand, maintained thesame level of throughput from 2014–2016 and only started to in-crease in 2017—likely realizing that the rest of the industry waspulling away from them. In 2017, we saw low performers losesome ground in stability. We suspect this is due to attempts toincrease tempo (“work harder!”) which fail to address the underlyingobstacles to improved overall performance (for example, rearchitec-ture, process improvement, and automation). We show the trendsin Figures 2.2 and 2.3.
4 See https://continuousdelivery.com/2016/04/the-flaw-at-the-heart-of-bimodal-it/ for an analysisof problems with the bimodal approach to ITSM, which rests on this false assumption.
20 | PART ONE
(MINUTES)
160,000
120,000
80,000
40,000
02014 2015 2016 2017
1,600
1,200
800
400
02014 2015 2016 2017
High Performers Low Performers
CHANGE LEAD RATE
DEPLOY FREQUENCY (# OF DEPLOYS PER YEAR)
Figure 2.2: Year over Year Trends: Tempo
CHAPTER 2: MEASURING PERFORMANCE | 21
(HOURS)
(PERCENTAGE)
60
40
50
30
20
10
02014 2015 2016 2017
1,600
1,200
800
400
02014 2015 2016 2017
High Performers Low Performers
CHANGE FAILURE RATE
MEAN TIME TO RECOVERY
Figure 2.3: Year over Year Trends: Stability
22 | PART ONE
Surprise!Observant readers will notice that medium performers doworse than low performers on change fail rate in 2016. 2016is the first year of our research where we see slightly incon-sistent performance across our measures in any of our perfor-mance groups, and we see it in medium and low performers.Our research doesn’t conclusively explain this, but we have afew ideas about why this might be the case.
One possible explanation is that medium performers areworking along their technology transformation journey anddealing with the challenges that come from large-scale re-architecture work, such as transitioning legacy code bases.This would also match another piece of the data from the2016 study, where we found that medium performers spendmore time on unplanned rework than low performers—because they report spending a greater proportion of time onnew work.
We believe this new work could be occurring at the ex-pense of ignoring critical rework, thus racking up technicaldebt which in turn leads to more fragile systems and, there-fore, a higher change fail rate.
We have found a valid, reliable way to measure software deliveryperformance that satisfies the requirements we laid out. It focuseson global, system-level goals, and measures outcomes that differentfunctions must collaborate in order to improve. The next questionwe wanted to answer is: Does software delivery performancematter?
CHAPTER 2: MEASURING PERFORMANCE | 23
THE IMPACT OF DELIVERY PERFORMANCEON ORGANIZATIONAL PERFORMANCE
In order to measure organizational performance, survey respondentswere asked to rate their organization’s relative performance acrossseveral dimensions: profitability, market share, and productivity.This is a scale that has been validated multiple times in prior re-search (Widener 2007). This measure of organizational performancehas also been found to be highly correlated to measures of returnon investment (ROI), and it is robust to economic cycles—a greatmeasure for our purposes. Analysis over several years shows thathigh-performing organizations were consistently twice as likely toexceed these goals as low performers. This demonstrates that yourorganization’s software delivery capability can in fact provide acompetitive advantage to your business.
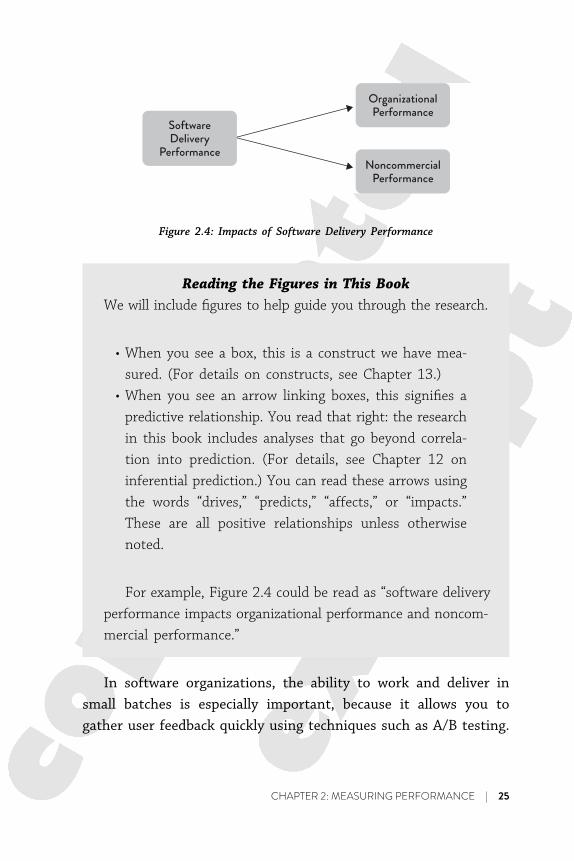
In 2017, our research also explored how IT performance affectsan organization’s ability to achieve broader organizationalgoals—that is, goals that go beyond simple profit and revenuemeasures. Whether you’re trying to generate profits or not, anyorganization today depends on technology to achieve its missionand provide value to its customers or stakeholders quickly, reliably,and securely. Whatever the mission, how a technology organizationperforms can predict overall organizational performance. To mea-sure noncommercial goals, we used a scale that has been validatedmultiple times and is particularly well-suited for this purpose(Cavalluzzo and Ittner 2004). We found that high performers werealso twice as likely to exceed objectives in quantity of goods andservices, operating efficiency, customer satisfaction, quality ofproducts or services, and achieving organization or mission goals.We show this relationship in Figure 2.4.
24 | PART ONE
SoftwareDelivery
Performance
OrganizationalPerformance
PerformanceNoncommercial
Figure 2.4: Impacts of Software Delivery Performance
Reading the Figures in This BookWe will include figures to help guide you through the research.
• When you see a box, this is a construct we have mea-sured. (For details on constructs, see Chapter 13.)
• When you see an arrow linking boxes, this signifies apredictive relationship. You read that right: the researchin this book includes analyses that go beyond correla-tion into prediction. (For details, see Chapter 12 oninferential prediction.) You can read these arrows usingthe words “drives,” “predicts,” “affects,” or “impacts.”These are all positive relationships unless otherwisenoted.
For example, Figure 2.4 could be read as “software deliveryperformance impacts organizational performance and noncom-mercial performance.”
In software organizations, the ability to work and deliver insmall batches is especially important, because it allows you togather user feedback quickly using techniques such as A/B testing.
CHAPTER 2: MEASURING PERFORMANCE | 25
It’s worth noting that the ability to take an experimental approachto product development is highly correlated with the technicalpractices that contribute to continuous delivery.
The fact that software delivery performance matters providesa strong argument against outsourcing the development of softwarethat is strategic to your business, and instead bringing this capa-bility into the core of your organization. Even the US FederalGovernment, through initiatives such as the US Digital Service andits agency affiliates and the General Services Administration’sTechnology Transformation Service team, has invested in bringingsoftware development capability in-house for strategic initiatives.
In contrast, most software used by businesses (such as officeproductivity software and payroll systems) are not strategic andshould in many cases be acquired using the software-as-a-servicemodel. Distinguishing which software is strategic and which isn’t,and managing them appropriately, is of enormous importance.This topic is dealt with at length by Simon Wardley, creator ofthe Wardley mapping method (Wardley 2015).
DRIVING CHANGE
Now that we have defined software delivery performance in a waythat is rigorous and measurable, we can make evidence-baseddecisions on how to improve the performance of teams buildingsoftware-based products and services. We can compare andbenchmark teams against the larger organizations they workin and against the wider industry. We can measure theirimprovement—or backsliding—over time. And perhaps most excit-ing of all, we can go beyond correlation and start testing prediction.We can test hypotheses about which practices—from managingwork in process to test automation—actually impact delivery
26 | PART ONE
performance and the strength of these effects. We can measureother outcomes we care about, such as team burnout and deploy-ment pain. We can answer questions like, “Do change managementboards actually improve delivery performance?” (Spoiler alert: theydo not; they are negatively correlated with tempo and stability.)
As we show in the next chapter, it is also possible to modeland measure culture quantitatively. This enables us to measurethe effect of DevOps and continuous delivery practices on cultureand, in turn, the effect of culture on software delivery performanceand organizational performance. Our ability to measure and reasonabout practices, culture, and outcomes is an incredibly powerfultool that can be used to great positive effect in the pursuit of everhigher performance.
You can, of course, use these tools to model your own perfor-mance. Use Table 2.3 to discover where in our taxonomy you fall.Use our measures for lead time, deployment frequency, time torestore service, and change fail rate, and ask your teams to settargets for these measures.
However, it is essential to use these tools carefully. In organi-zations with a learning culture, they are incredibly powerful. But“in pathological and bureaucratic organizational cultures, measure-ment is used as a form of control, and people hide informationthat challenges existing rules, strategies, and power structures. AsDeming said, ‘whenever there is fear, you get the wrong numbers’”(Humble et al. 2014, p. 56). Before you are ready to deploy a sci-entific approach to improving performance, you must first under-stand and develop your culture. It is to this topic we now turn.
CHAPTER 2: MEASURING PERFORMANCE | 27

PART TWOTHE RESEARCH
To establish what we presented in Part I, we had to go be-yond case studies and stories and into rigorous researchmethods. This allowed us to identify the practices that arethe strongest predictors of success for all organizations ofany size in any industry.
In the first part of the book, we discussed the results ofthis research program and outlined why technology is akey value driver and differentiator for all organizations today.Now, we present the science behind the research findingsin Part I.

CHAPTER 12
THE SCIENCE BEHINDTHIS BOOK
Every day, our news feeds are full of strategies designed tomake our lives easier, make us happier, and help us take over
the world. We also hear stories about how teams and organizationsuse different strategies to transform their technology and win inthe market. But how are we to know which actions we take justhappen to correspond to the changes we observe in our environ-ment and which actions are driving these changes? This is whererigorous primary research comes into play. But what do we meanby “rigorous” and “primary”?
PRIMARY AND SECONDARY RESEARCH
Research falls into two broad classes: primary and secondary re-search. The key difference between these two types is who collectsthe data. Secondary research utilizes data that was collected bysomeone else. Examples of secondary research you are probablyfamiliar with are book reports or research reports we all completedin school or university: we collected existing information, summa-rized it, and (hopefully) added in our own insights about what wasfound. Common examples of this also include case studies andsome market research reports. Secondary research reports can bevaluable, particularly if the existing data is difficult to find, the
CHAPTER 12: THE SCIENCE BEHIND THIS BOOK | 131
summary is particularly insightful, or the reports are delivered atregular intervals. Secondary research is generally faster and lessexpensive to conduct, but the data may not be well suited to theresearch team because they are bound by whatever data alreadyexists.
In contrast, primary research involves collecting new data bythe research team. An example of primary research includes theUnited States Census. The research team collects new data everyten years to report on demographic and population statistics forthe country. Primary research is valuable because it can report in-formation that is not already known and provide insights that arenot available in existing datasets. Primary research gives researchersmore power and control over the questions they can address,though it is generally more costly and time intensive to conduct.This book and the State of DevOps Reports are based on primaryresearch.
QUALITATIVE AND QUANTITATIVERESEARCH
Research can be qualitative or quantitative. Qualitative research isany kind of research whose data isn’t in numerical form. This caninclude interviews, blog posts, Twitter posts, long-form log data,and long-form observations from ethnographers. Many people as-sume that survey research is qualitative because it doesn’t comefrom computer systems, but that isn’t necessarily true; it dependson the kinds of questions asked in the survey. Qualitative data isvery descriptive and can allow for more insights and emergentbehavior to be discovered by researchers, particularly in complexor new areas. However, it is often more difficult and costly to
132 | PART TWO
analyze; efforts to analyze qualitative data using automatedmeans often codify the data into a numerical format, making itquantitative.
Quantitative research is any kind of research with data thatincludes numbers. These can include system data (in numericalformat) or stock data. System data is any data generated from ourtools; one example is log data. It can also include survey data, ifthe survey asks questions that capture responses in numericalformat—preferably on a scale. The research presented in this bookis quantitative, because it was collected using a Likert-type surveyinstrument.
What Is a Likert-Type Scale?A Likert-type scale records responses and assigns them anumber value. For example, “Strongly disagree” would be givena value of 1, neutral a value of 4, and “Strongly agree” a valueof 7. This provides a consistent approach to measurementacross all research subjects, and provides a numerical base forresearchers to use in their analysis.
TYPES OF ANALYSIS
Quantitative research allows us to do statistical data analysis. Ac-cording to a framework presented by Dr. Jeffrey Leek at JohnsHopkins Bloomberg School of Public Health (Leek 2013), there aresix types of data analysis (given below in the order of increasingcomplexity). This complexity is due to the knowledge required bythe data scientist, the costs involved in the analysis, and the timerequired to perform the analysis. These levels of analysis are:
CHAPTER 12: THE SCIENCE BEHIND THIS BOOK | 133
1. Descriptive2. Exploratory3. Inferential predictive4. Predictive5. Causal6. Mechanistic
The analyses presented in this book fall into the first threecategories of Dr. Leek’s framework. We also describe an additionaltype of analysis, classification, which doesn’t fit cleanly into theabove framework.
DESCRIPTIVE ANALYSIS
Descriptive analysis is used in census reports. The data is summa-rized and reported—that is, described. This type of analysis takesthe least amount of effort, and is often done as the first step ofdata analysis to help the research team understand their dataset(and, by extension, their sample and possibly population of users).In some cases, a report will stop at descriptive analysis, as in thecase of population census reports.
What Is a Population and Sample, and Why AreThey Important?
When talking about statistics and data analysis, the terms“population” and “sample” have special meanings. The popula-tion is the entire group of something you are interested inresearching; this might be all of the people undergoing tech-nology transformations, everyone who is a Site Reliability
134 | PART TWO
Engineer at an organization, or even every line in a log fileduring a certain time period. A sample is a portion of thatpopulation that is carefully defined and selected. The sampleis the dataset on which researchers perform their analyses.Sampling is used when the entire population is too big or noteasily accessible for research. Careful and appropriate samplingmethods are important to make sure the conclusions drawnfrom analyzing the sample are true for the population.
The most common example of descriptive analysis is the gov-ernment census where population statistics are summarized andreported. Other examples include most vendor and analyst reportsthat collect data and report summary and aggregate statistics aboutthe state of tool usage in an industry or the level of educationand certification among technology professionals. The percentageof firms that have started their Agile or DevOps journeys asreported by Forrester (Klavens et al. 2017), the IDC report on av-erage downtime cost (Elliot 2014), and the O’Reilly Data ScienceSalary Survey (King and Magoulas 2016) belong in this category.
These reports are very useful as a gauge of the current stateof the industry, where reference groups (such as populations orindustries) currently are, where they once were, and where thetrends are pointing. However, descriptive findings are only as goodas the underlying research design and data collection methods.Any reports that aim to represent the underlying population mustbe sure to sample that population carefully and discuss any limita-tions. A discussion of these considerations is beyond the scope ofthis book.
CHAPTER 12: THE SCIENCE BEHIND THIS BOOK | 135
An example of descriptive analysis found in this book is thedemographic information about our survey participants and theorganizations they work in—what countries they come from, howlarge their organizations are, the industry vertical they work in,their job titles, and their gender (see Chapter 10).
EXPLORATORY ANALYSIS
Exploratory analysis is the next level of statistical analysis. Thisis a broad categorization that looks for relationships amongthe data and may include visualizations to identify patterns in thedata. Outliers may also be detected in this step, though the re-searchers have to be careful to make sure that outliers are, in fact,outliers, and not legitimate members of the group.
Exploratory analyses are a fun and exciting part of the researchprocess. For those who are divergent thinkers, this is often thestage where new ideas, new hypotheses, and new research projectsare generated and proposed. Here, we discover how the variablesin our data are related and we look for possible new connectionsand relationships. However, this should not be the end for a teamthat wants to make statements about prediction or causation.
Many people have heard the phrase “correlation doesn’t implycausation,” but what does that mean? The analyses done in theexploratory stage include correlation but not causation. Correlationlooks at how closely two variables move together—or don’t—butit doesn’t tell us if one variable’s movement predicts or causes themovement in another variable. Correlation analysis only tells usif two variables move in tandem or in opposition; it doesn’t tellus why or what is causing it. Two variables moving together canalways be due to a third variable or, sometimes, just chance.
136 | PART TWO
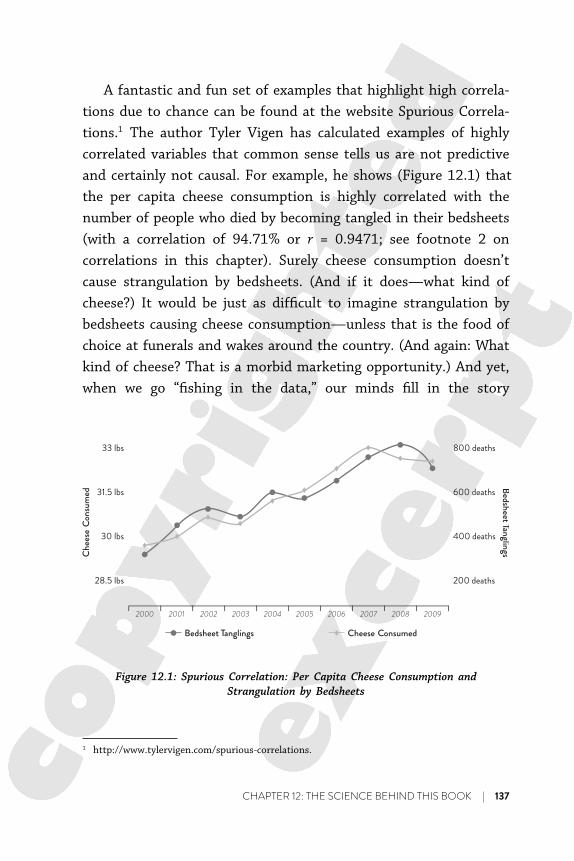
A fantastic and fun set of examples that highlight high correla-tions due to chance can be found at the website Spurious Correla-tions.1 The author Tyler Vigen has calculated examples of highlycorrelated variables that common sense tells us are not predictiveand certainly not causal. For example, he shows (Figure 12.1) thatthe per capita cheese consumption is highly correlated with thenumber of people who died by becoming tangled in their bedsheets(with a correlation of 94.71% or r = 0.9471; see footnote 2 oncorrelations in this chapter). Surely cheese consumption doesn’tcause strangulation by bedsheets. (And if it does—what kind ofcheese?) It would be just as difficult to imagine strangulation bybedsheets causing cheese consumption—unless that is the food ofchoice at funerals and wakes around the country. (And again: Whatkind of cheese? That is a morbid marketing opportunity.) And yet,when we go “fishing in the data,” our minds fill in the story
Bedsheet Tanglings
33 lbs
31.5 lbs
30 lbs
28.5 lbs
800 deaths
600 deaths
400 deaths
200 deaths
Cheese Consumed
2000 2001 2002 2003 2004 2005 2006 2007 2008 2009
Bedsheet TanglingsChee
se C
onsu
med
Figure 12.1: Spurious Correlation: Per Capita Cheese Consumption andStrangulation by Bedsheets
1 http://www.tylervigen.com/spurious-correlations.
CHAPTER 12: THE SCIENCE BEHIND THIS BOOK | 137
because our datasets are related and so often make sense. This iswhy it is so important to remember that correlation is only theexploratory stage: we can report correlations, and then we moveon to more complex analyses.
There are several examples of correlations that are reported inour research and in this book, because we know the importanceand value of understanding how things in our environment inter-relate. In all cases, we reported Pearson correlations,2 which is thecorrelation type most often used in business contexts today.
INFERENTIAL PREDICTIVE ANALYSIS
The third level of analysis, inferential, is one of the most commontypes conducted in business and technology research today. It isalso called inferential predictive, and it helps us understand impactsof HR policies, organizational behavior and motivation, and howtechnology impacts outcomes like user satisfaction, team efficiency,and organizational performance. Inferential design is used whenpurely experimental design is not possible and field experimentsare preferred—for example, in business, when data collectionhappens in complex organizations, not in sterile lab environments,and companies won’t sacrifice profits to fit into control groupsdefined by the research team.
To avoid problems with “fishing for data” and finding spuriouscorrelations, hypotheses are theory driven. This type of analysisis the first step in the scientific method. Many of us are familiar
2 Pearson correlations measure the strength of a linear relationship between two variables,called Pearson’s r. It is often referred to as just correlation and takes a value between −1and 1. If two variables have a perfect linear correlation, that is they move together exactly,r = 1. If they move in exactly opposite directions, r = −1. If they are not correlated at all,r = 0.
138 | PART TWO
with the scientific method: state a hypothesis and then test it. Inthis level of analysis, the hypothesis must be based on a well-developed and well-supported theory.
Whenever we talk about impacting or driving results in thisbook, our research design utilized this third type of analysis. Whilesome suggest that using a theory-based design opens us up toconfirmation bias, this is how science is done. Well, wait—almost.Science isn’t done by simply confirming what the research teamis looking for. Science is done by stating hypotheses, designingresearch to test those hypotheses, collecting data, and then testingthe stated hypotheses. The more evidence we find to support ahypothesis, the more confidence we have for it. This process alsohelps to avoid the dangers that come from fishing for data—findingthe spurious correlations that might randomly exist but have noreal reason or explanation beyond chance.
Examples of hypotheses tested with inferential analysis in ourproject include continuous delivery and architecture practicesdriving software delivery performance, software delivery positivelyaffecting organizational performance, and organizational culturehaving a positive impact on both software delivery and organiza-tional performance. In these cases, the statistical methods usedwere either multiple linear regression or partial least squaresregression. These methods are described in more detail inAppendix C.
PREDICTIVE, CAUSAL, AND MECHANISTIC ANALYSIS
The final levels of analysis were not included in our research, be-cause we did not have the data necessary for this kind of work.We will briefly summarize them here for the sake of completenessand to appease your curiosity.
CHAPTER 12: THE SCIENCE BEHIND THIS BOOK | 139
• Predictive analysis is used to predict, or forecast, futureevents based on previous events. Common examples includecost or utilities predictions in business. Prediction is veryhard, particularly as you try to look farther away into thefuture. This analysis generally requires historical data.
• Causal analysis is considered the gold standard, but is moredifficult than predictive analysis and is the most difficultanalysis to conduct for most business and technology situa-tions. This type of analysis generally requires randomizedstudies. A common type of casual analysis done in businessis A/B testing in prototyping or websites, when randomizeddata can be collected and analyzed.
• Mechanistic analysis requires the most effort of all methodsand is rarely seen in business. In this analysis, practitionerscalculate the exact changes to make to variables to causeexact behaviors that will be observed under certain condi-tions. This is seen most often in the physical sciences or inengineering, and is not suitable for complex systems.
CLASSIFICATION ANALYSIS
Another type of analysis is classification, or clustering, analysis.Depending on the context, research design, and the analysismethods used, classification may be considered an exploratory,predictive, or even causal analysis. We use classification in thisbook when we talk about our high-, medium-, and low-performancesoftware delivery teams. This may be familiar to you in othercontexts when you hear about customer profiles or market basketanalysis. At a high level, the process works like this: classificationvariables are entered into the clustering algorithm and significantgroups are identified.
140 | PART TWO
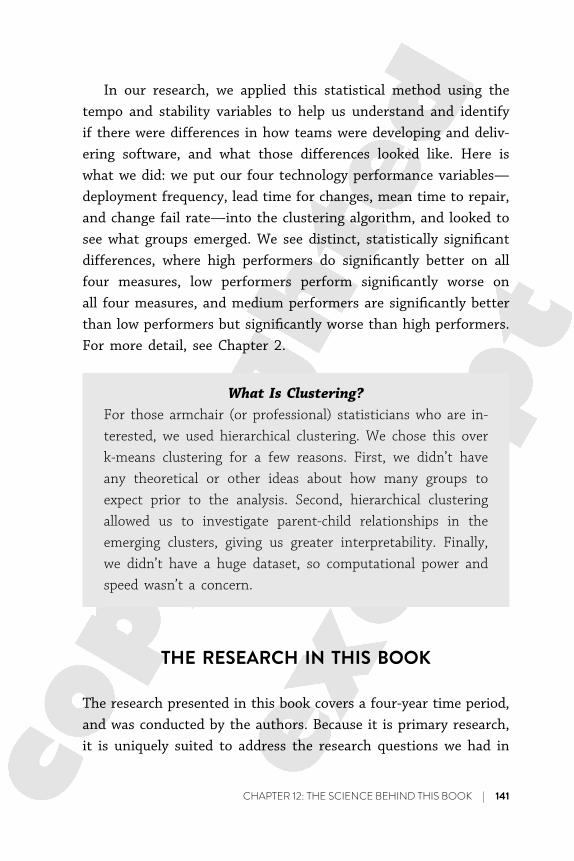
In our research, we applied this statistical method using thetempo and stability variables to help us understand and identifyif there were differences in how teams were developing and deliv-ering software, and what those differences looked like. Here iswhat we did: we put our four technology performance variables—deployment frequency, lead time for changes, mean time to repair,and change fail rate—into the clustering algorithm, and looked tosee what groups emerged. We see distinct, statistically significantdifferences, where high performers do significantly better on allfour measures, low performers perform significantly worse onall four measures, and medium performers are significantly betterthan low performers but significantly worse than high performers.For more detail, see Chapter 2.
What Is Clustering?For those armchair (or professional) statisticians who are in-terested, we used hierarchical clustering. We chose this overk-means clustering for a few reasons. First, we didn’t haveany theoretical or other ideas about how many groups toexpect prior to the analysis. Second, hierarchical clusteringallowed us to investigate parent-child relationships in theemerging clusters, giving us greater interpretability. Finally,we didn’t have a huge dataset, so computational power andspeed wasn’t a concern.
THE RESEARCH IN THIS BOOK
The research presented in this book covers a four-year time period,and was conducted by the authors. Because it is primary research,it is uniquely suited to address the research questions we had in
CHAPTER 12: THE SCIENCE BEHIND THIS BOOK | 141

mind—specifically, what capabilities drive software delivery perfor-mance and organizational performance? This project was based onquantitative survey data, allowing us to do statistical analyses totest our hypotheses and uncover insights into the factors thatdrive software delivery performance.
In the next chapters, we discuss the steps we took to ensurethe data we collected from our surveys was good and reliable.Then, we look into why surveys may be a preferred source of datafor measurement—both in a research project like ours and in yourown systems.
142 | PART TWO

PART THREETRANSFORMATION
We’ve presented our findings on which capabilities are impor-tant in producing better software delivery and organizationaloutcomes. However, taking this information and applying itto change your organization is a complex and daunting task.That’s why we’re delighted that Steve Bell and Karen WhitleyBell agreed to write a chapter on leadership and organiza-tional transformation, sharing their experience and insightsto guide readers in their own journey.
Steve and Karen are pioneers of Lean IT, applying princi-ples and practices through a method-agnostic approach,drawing on a variety of practices—DevOps, Agile, Scrum,kanban, Lean startup, Kata, Obeya, strategy deployment,and others—as appropriate to the culture and situation, tocoach and support leaders to develop high-performancepractices and organizational learning capabilities.
In Part III, they draw on their experiences at INGNetherlands, a global bank with over 34.4 million customersworldwide and with 52,000 employees, including more than
9,000 engineers, to show the why and how of leadership,management, and team practices that enable culture change.This, in turn, enables sustainable high performance in acomplex and dynamic environment.
Steve and Karen extend our view beyond the interrela-tionships of team, management, and leadership practices,beyond the skillful adoption of DevOps, and beyond thebreaking down of silos—all necessary, but not sufficient.Here we see the evolution of holistic, end-to-end organiza-tional transformation, fully engaged and fully aligned to en-terprise purpose.
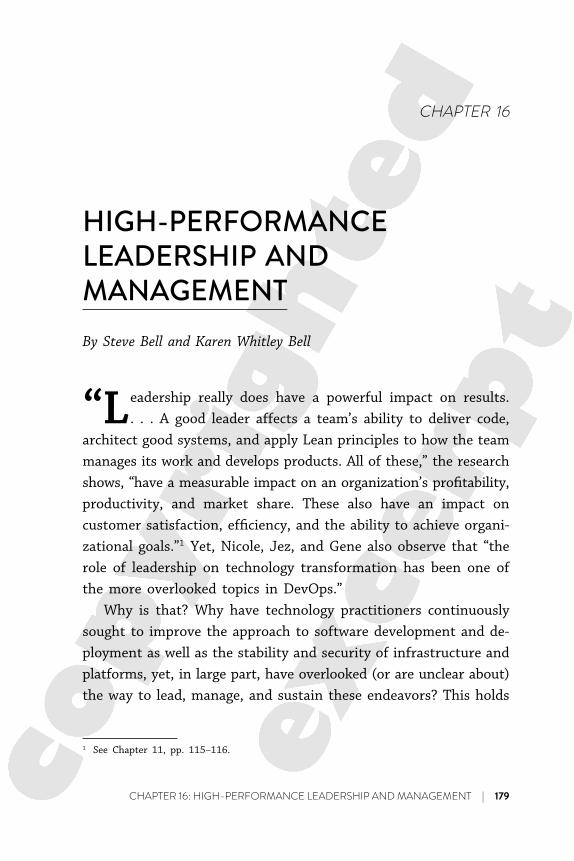
CHAPTER 16
HIGH-PERFORMANCELEADERSHIP ANDMANAGEMENTBy Steve Bell and Karen Whitley Bell
“Leadership really does have a powerful impact on results.. . . A good leader affects a team’s ability to deliver code,
architect good systems, and apply Lean principles to how the teammanages its work and develops products. All of these,” the researchshows, “have a measurable impact on an organization’s profitability,productivity, and market share. These also have an impact oncustomer satisfaction, efficiency, and the ability to achieve organi-zational goals.”1 Yet, Nicole, Jez, and Gene also observe that “therole of leadership on technology transformation has been one ofthe more overlooked topics in DevOps.”
Why is that? Why have technology practitioners continuouslysought to improve the approach to software development and de-ployment as well as the stability and security of infrastructure andplatforms, yet, in large part, have overlooked (or are unclear about)the way to lead, manage, and sustain these endeavors? This holds
1 See Chapter 11, pp. 115–116.
CHAPTER 16: HIGH-PERFORMANCE LEADERSHIP AND MANAGEMENT | 179
for large legacy enterprises as well as digital natives. Let’s considerthis question not in the context of the past—why we haven’t—butinstead for the present and future: why we must improve the waywe lead and manage IT2 and, indeed, reimagine the way everyoneacross the enterprise views and engages with technology.
We are in the midst of a complete transformation in the wayvalue is created, delivered, and consumed. Our ability to rapidlyand effectively envision, develop, and deliver technology-relatedvalue to enhance the customer experience is becoming a key com-petitive differentiator. But peak technical performance is only onepart of competitive advantage—necessary but not sufficient. Wemay become great at rapidly developing and delivering reliable,secure, technology-enabled experiences, but how do we know whichexperiences our customers value? How do we prioritize what wecreate so that each team’s efforts advance the larger enterprisestrategy? How do we learn from our customers, from our actions,and from each other? And as we learn, how do we share thatlearning across the enterprise and leverage that learning to contin-uously adapt and innovate?
The other necessary component to sustaining competitive ad-vantage is a lightweight, high-performance management frameworkthat connects enterprise strategy with action, streamlines the flowof ideas to value, facilitates rapid feedback and learning, and capi-talizes on and connects the creative capabilities of every individualthroughout the enterprise to create optimal customer experiences.What does such a framework look like—not in theory but inpractice? And how do we go about improving and transformingour own leadership, management, and team practices and behaviorsto become the enterprise we aspire to be?
2 Note from Nicole, Jez, and Gene. The term “IT” is used throughout this chapter to referto the software and technology process—much more than just a single function within thetechnology group at a company, like IT support or the helpdesk.
180 | PART THREE
A HIGH-PERFORMING MANAGEMENTFRAMEWORK IN PRACTICE
Throughout this book, Nicole, Jez, and Gene discuss several Leanmanagement practices that have been found to correlate with highorganizational performance—specifically, “profitability, marketshare, and productivity . . . [in addition to measures that capture]broader organizational goals—that is, goals that go beyond simpleprofit and revenue measures.”3 Each of these practices is, in someway, synergistic and interdependent with the others. To illustratehow these leadership, management, and team practices work to-gether, and to show the foundational thinking that enables them,we share the experiences of ING Netherlands, a global financialinstitution that pioneered digital banking and is recognized for itscustomer-centric technology leadership. Today, IT is leading ING’sdigital transformation effort.
“You have to understand why, not just copy the behaviors,”4
says Jannes Smit, IT Manager of Internet Banking and Omnichan-nel at ING Netherlands, who, seven years ago, decided to experi-ment with ways to develop organizational learning among histeams. There are many ways we could describe this managementpractice in action. Perhaps the best way is to take you on a virtualvisit—albeit from the pages of a book. (ING is happy to share thestory of their learning, but they’re not willing to show you what’son the walls!) We’ll share with you the sights and sounds and ex-periences of a day at ING, showing you how practices, rhythms,and routines connect to create a learning organization and deliverhigh performance and value.
3 See Chapter 2, p. 24.4 This and all other direct quotes from ING staff are personal communications with the
authors of this chapter.
CHAPTER 16: HIGH-PERFORMANCE LEADERSHIP AND MANAGEMENT | 181
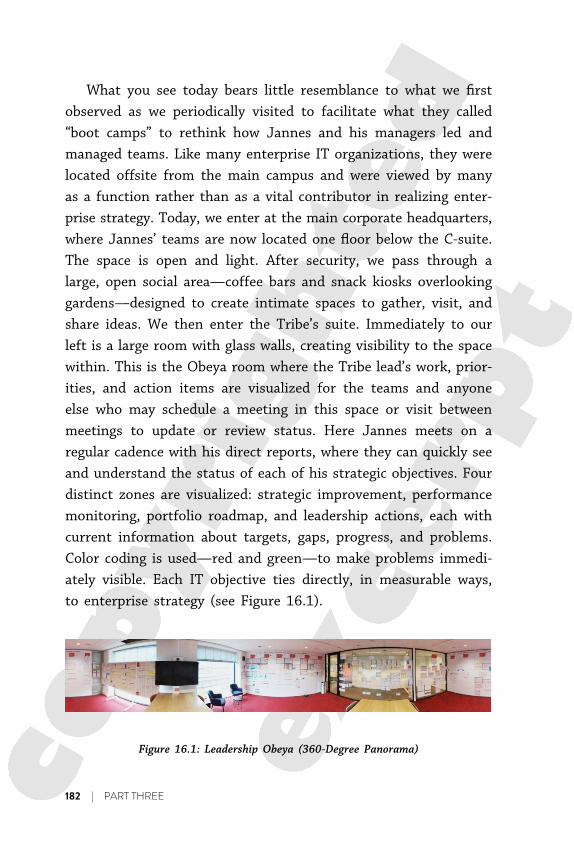
What you see today bears little resemblance to what we firstobserved as we periodically visited to facilitate what they called“boot camps” to rethink how Jannes and his managers led andmanaged teams. Like many enterprise IT organizations, they werelocated offsite from the main campus and were viewed by manyas a function rather than as a vital contributor in realizing enter-prise strategy. Today, we enter at the main corporate headquarters,where Jannes’ teams are now located one floor below the C-suite.The space is open and light. After security, we pass through alarge, open social area—coffee bars and snack kiosks overlookinggardens—designed to create intimate spaces to gather, visit, andshare ideas. We then enter the Tribe’s suite. Immediately to ourleft is a large room with glass walls, creating visibility to the spacewithin. This is the Obeya room where the Tribe lead’s work, prior-ities, and action items are visualized for the teams and anyoneelse who may schedule a meeting in this space or visit betweenmeetings to update or review status. Here Jannes meets on aregular cadence with his direct reports, where they can quickly seeand understand the status of each of his strategic objectives. Fourdistinct zones are visualized: strategic improvement, performancemonitoring, portfolio roadmap, and leadership actions, each withcurrent information about targets, gaps, progress, and problems.Color coding is used—red and green—to make problems immedi-ately visible. Each IT objective ties directly, in measurable ways,to enterprise strategy (see Figure 16.1).
Figure 16.1: Leadership Obeya (360-Degree Panorama)
182 | PART THREE
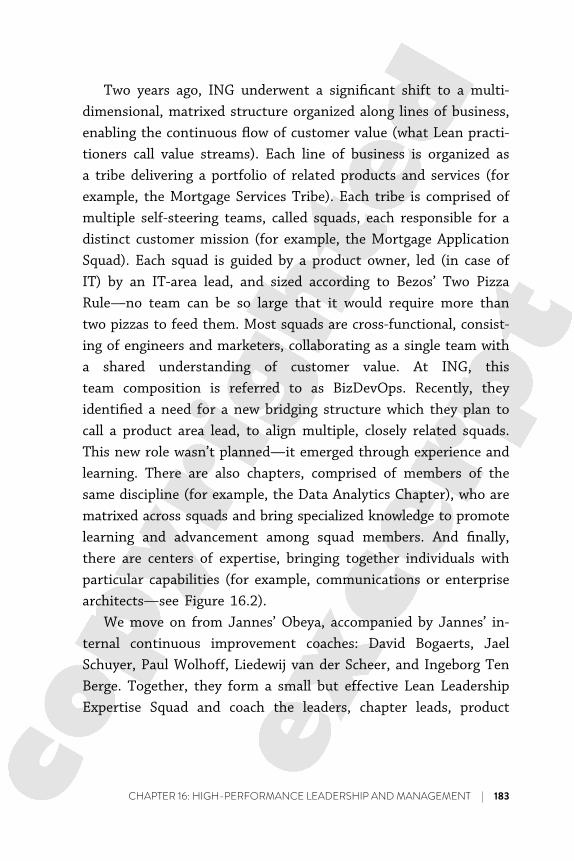
Two years ago, ING underwent a significant shift to a multi-dimensional, matrixed structure organized along lines of business,enabling the continuous flow of customer value (what Lean practi-tioners call value streams). Each line of business is organized asa tribe delivering a portfolio of related products and services (forexample, the Mortgage Services Tribe). Each tribe is comprised ofmultiple self-steering teams, called squads, each responsible for adistinct customer mission (for example, the Mortgage ApplicationSquad). Each squad is guided by a product owner, led (in case ofIT) by an IT-area lead, and sized according to Bezos’ Two PizzaRule—no team can be so large that it would require more thantwo pizzas to feed them. Most squads are cross-functional, consist-ing of engineers and marketers, collaborating as a single team witha shared understanding of customer value. At ING, thisteam composition is referred to as BizDevOps. Recently, theyidentified a need for a new bridging structure which they plan tocall a product area lead, to align multiple, closely related squads.This new role wasn’t planned—it emerged through experience andlearning. There are also chapters, comprised of members of thesame discipline (for example, the Data Analytics Chapter), who arematrixed across squads and bring specialized knowledge to promotelearning and advancement among squad members. And finally,there are centers of expertise, bringing together individuals withparticular capabilities (for example, communications or enterprisearchitects—see Figure 16.2).
We move on from Jannes’ Obeya, accompanied by Jannes’ in-ternal continuous improvement coaches: David Bogaerts, JaelSchuyer, Paul Wolhoff, Liedewij van der Scheer, and Ingeborg TenBerge. Together, they form a small but effective Lean LeadershipExpertise Squad and coach the leaders, chapter leads, product
CHAPTER 16: HIGH-PERFORMANCE LEADERSHIP AND MANAGEMENT | 183
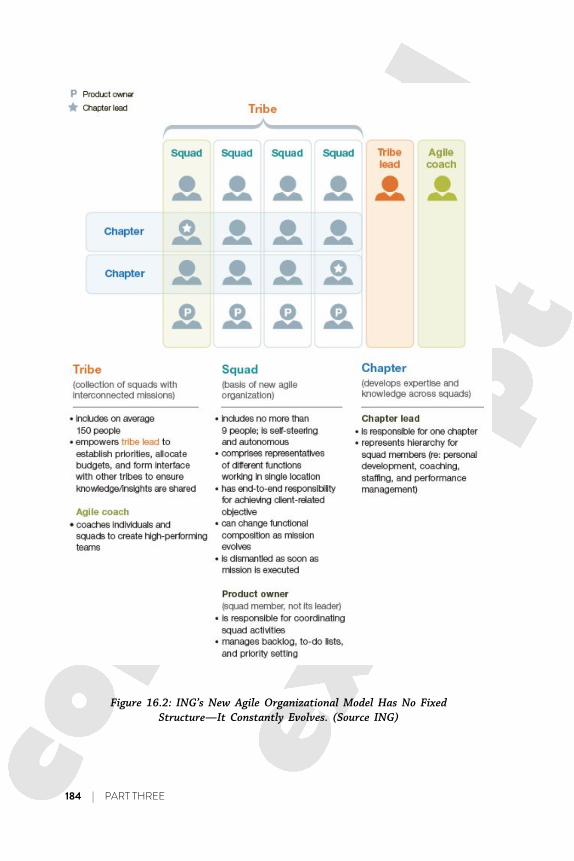
Figure 16.2: ING’s New Agile Organizational Model Has No FixedStructure—It Constantly Evolves. (Source ING)
184 | PART THREE
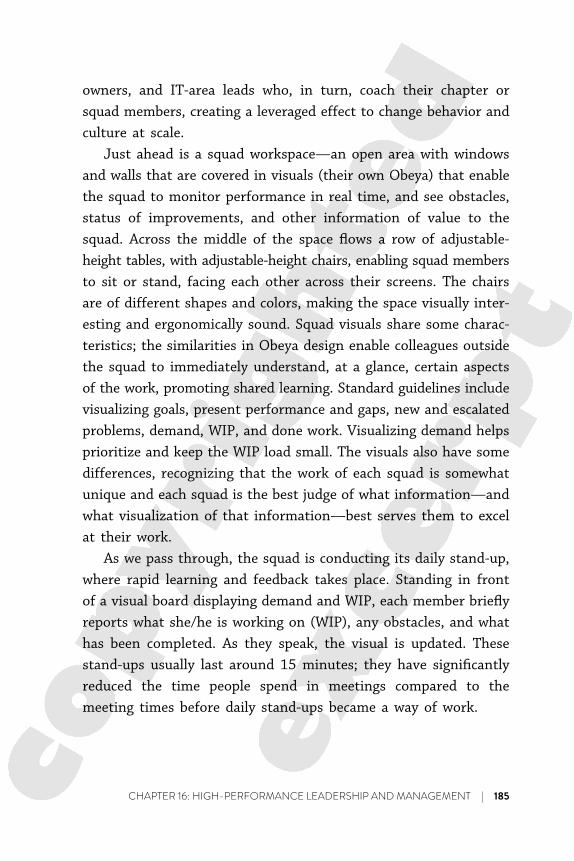
owners, and IT-area leads who, in turn, coach their chapter orsquad members, creating a leveraged effect to change behavior andculture at scale.
Just ahead is a squad workspace—an open area with windowsand walls that are covered in visuals (their own Obeya) that enablethe squad to monitor performance in real time, and see obstacles,status of improvements, and other information of value to thesquad. Across the middle of the space flows a row of adjustable-height tables, with adjustable-height chairs, enabling squad membersto sit or stand, facing each other across their screens. The chairsare of different shapes and colors, making the space visually inter-esting and ergonomically sound. Squad visuals share some charac-teristics; the similarities in Obeya design enable colleagues outsidethe squad to immediately understand, at a glance, certain aspectsof the work, promoting shared learning. Standard guidelines includevisualizing goals, present performance and gaps, new and escalatedproblems, demand, WIP, and done work. Visualizing demand helpsprioritize and keep the WIP load small. The visuals also have somedifferences, recognizing that the work of each squad is somewhatunique and each squad is the best judge of what information—andwhat visualization of that information—best serves them to excelat their work.
As we pass through, the squad is conducting its daily stand-up,where rapid learning and feedback takes place. Standing in frontof a visual board displaying demand and WIP, each member brieflyreports what she/he is working on (WIP), any obstacles, and whathas been completed. As they speak, the visual is updated. Thesestand-ups usually last around 15 minutes; they have significantlyreduced the time people spend in meetings compared to themeeting times before daily stand-ups became a way of work.
CHAPTER 16: HIGH-PERFORMANCE LEADERSHIP AND MANAGEMENT | 185
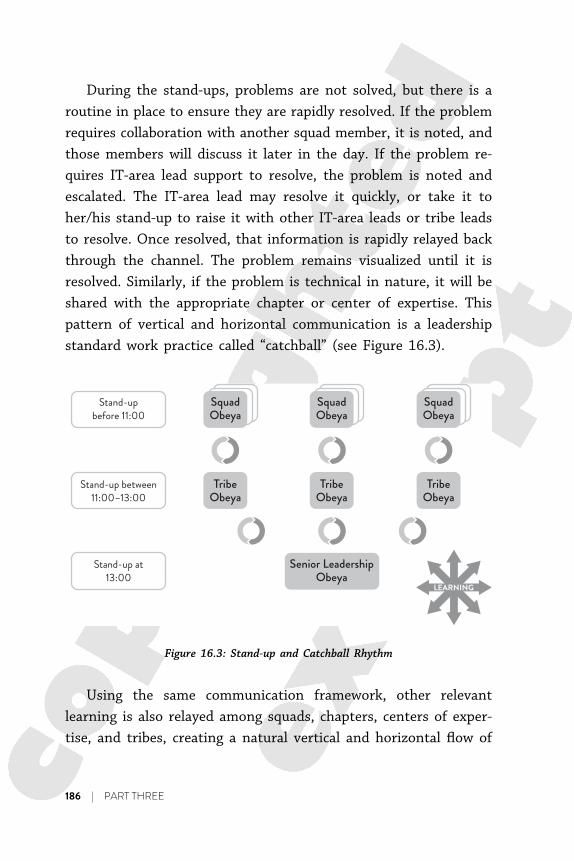
During the stand-ups, problems are not solved, but there is aroutine in place to ensure they are rapidly resolved. If the problemrequires collaboration with another squad member, it is noted, andthose members will discuss it later in the day. If the problem re-quires IT-area lead support to resolve, the problem is noted andescalated. The IT-area lead may resolve it quickly, or take it toher/his stand-up to raise it with other IT-area leads or tribe leadsto resolve. Once resolved, that information is rapidly relayed backthrough the channel. The problem remains visualized until it isresolved. Similarly, if the problem is technical in nature, it will beshared with the appropriate chapter or center of expertise. Thispattern of vertical and horizontal communication is a leadershipstandard work practice called “catchball” (see Figure 16.3).
SquadObeya
Stand-upbefore 11:00
Stand-up between11:00–13:00
Stand-up at13:00
TribeObeya
Senior LeadershipObeya
LEARNING
TribeObeya
TribeObeya
SquadObeya
SquadObeya
Figure 16.3: Stand-up and Catchball Rhythm
Using the same communication framework, other relevantlearning is also relayed among squads, chapters, centers of exper-tise, and tribes, creating a natural vertical and horizontal flow of
186 | PART THREE
learning across all dimensions of the organization. This enablesthe squads to self-determine how best to craft their work to sup-port overall enterprise strategy and enables effective prioritization.The tribe lead, in this case Jannes, also learns from the squadand chapter members, including lessons learned in their directinteraction with customers. This enables him to adapt hisstrategic thinking and goals and share insights with his peers andsuperiors.
This practice of rapid exchange of learning, enabling thefrontline teams to learn about strategic priorities and the leadersto learn about customer experience from frontline team customerinteraction, is a form of strategy deployment (Lean practitionersuse the term Hoshin Kanri). It creates, at all levels, a continuous,rapid feedback cycle of learning, testing, validating, and adjusting,also known as PDCA.
In addition to regular stand-ups with squads, product owners,IT-area leads, and chapter leads, the tribe lead also regularly visitsthe squads to ask questions—not the traditional questions like“Why isn’t this getting done?” but, rather, “Help me better under-stand the problems you’re encountering,” “Help me see what you’relearning,” and “What can I do to better support you and the team?”This kind of coaching behavior does not come easily to someleaders and managers. It takes real effort, with coaching, mentoring,and modeling (mentoring is being piloted within the Omni-channel Tribe, with plans for expansion) to change behavior fromthe traditional command-and-control to leaders-as-coaches whereeveryone’s job is to (1) do the work, (2) improve the work, and(3) develop the people. The third objective—develop the people—isespecially important in a technology domain, where automationis disrupting many technology jobs. For people to bring their bestto the work that may, in fact, eliminate their current job, they
CHAPTER 16: HIGH-PERFORMANCE LEADERSHIP AND MANAGEMENT | 187
need complete faith that their leaders value them—not just fortheir present work but for their ability to improve and innovatein their work. The work itself will constantly change; the organiza-tion that leads is the one with the people with consistent behaviorto rapidly learn and adapt.
Not far from that squad space in a glass-enclosed meeting spacewith whiteboard-covered walls, a telepresence monitor, easel pads,and colorful, comfy chairs, we visit with Jordi de Vos, a youngengineer whose entire career has been under Jannes’ new way-of-working. Jordi is a chapter lead who also leads the effort towardone of the way-of-work strategic improvement objectives (recallthat there are strategic improvement, performance monitoring,and portfolio roadmap strategic objectives). Jordi shares withothers what he’s learning about team security—the psychologicalsafety for individuals to openly discuss problems and obstacleswith no fear of harm or reprisal. He talks about this and otherresearch he’s discovering, how he’s experimenting to learn whatwill resonate most among the squads, and what measurable changesare created and sustained. A fixed percentage of each squad’s andchapter’s time is allocated for improvement. Jordi says that thesquads think of improvement activities as just regular work.
We ask Jordi what it’s like to work within this culture. Hereflects for a moment then shares a story. Jannes’ tribes had beenchallenged by senior leadership to be twice as effective. “There wasa tough deadline and lots of pressure. Our tribe lead, Jannes, wentto the squads and said, ‘If the quality isn’t there, don’t release. I’llcover your back.’ So, we felt we owned quality. That helped us todo the right things.”
Too often, quality is overshadowed by the pressure for speed.A courageous and supportive leader is crucial to help teams “slowdown to speed up,” providing them with the permission and safety
188 | PART THREE

to put quality first (fit for use and purpose) which, in the longrun, improves speed, consistency, and capacity while reducing cost,delays, and rework. Best of all, this improves customer satisfactionand trust.
After this visit, we walk past more squad workspaces andmore glass-enclosed meeting spaces, each with the sameelements but different in their colors, textures, and furnishings.Back in the Leadership Obeya, we meet up with the coaching teamfor a healthy lunch and reflect on the many positive changes we’veseen since our last visit. They share reflections on their currentchallenges and some of the approaches they are experimentingwith to continue to spread and grow a generative culture, focusingon “going deep before going wide.” Nevertheless, the pressure isthere to scale wide and fast. Right now, one of the coachingteam members is focusing on supporting culture change in justa few countries outside the Netherlands. Given that ING operatesin over 40 countries, the discipline to allow time and atten-tion for learning, rather than go for large scale change, is re-markable.
Another challenge the coaches are experimenting with is dis-persed teams. With recent restructuring, some squads now havemembers from more than one country, so the coaching team isexperimenting with, and measuring, ways to maintain the samehigh level of collaboration and learning among cross-border squads(it’s very hard to virtually share two pizzas).
Not surprisingly, several of the most senior leaders and severalother tribe lead peers want their own Obeya. The coaching teamis hoping to approach this slowly enough so that real learning canoccur. Transformational, generative leadership extends well beyondwhat is on the Obeya walls and the rhythm and routine of howyou talk about it. “As a leader, you have to look at your own
CHAPTER 16: HIGH-PERFORMANCE LEADERSHIP AND MANAGEMENT | 189
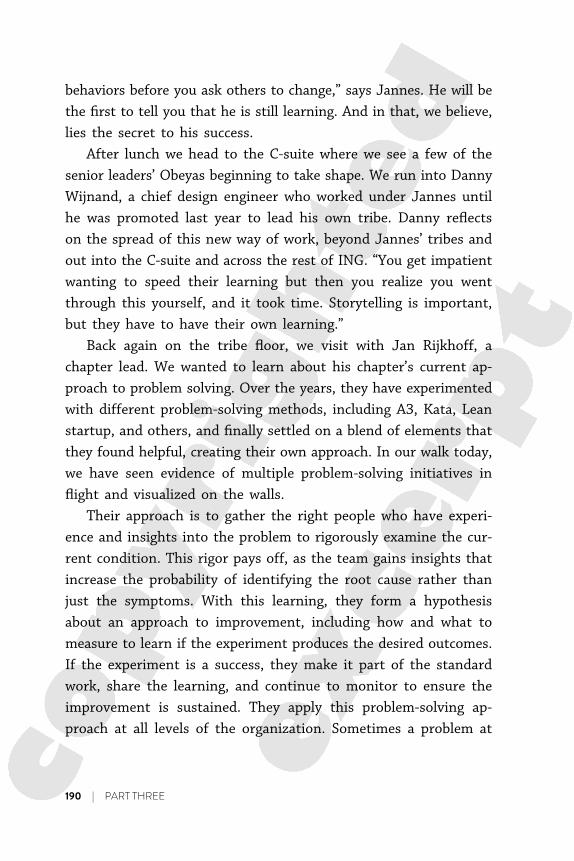
behaviors before you ask others to change,” says Jannes. He will bethe first to tell you that he is still learning. And in that, we believe,lies the secret to his success.
After lunch we head to the C-suite where we see a few of thesenior leaders’ Obeyas beginning to take shape. We run into DannyWijnand, a chief design engineer who worked under Jannes untilhe was promoted last year to lead his own tribe. Danny reflectson the spread of this new way of work, beyond Jannes’ tribes andout into the C-suite and across the rest of ING. “You get impatientwanting to speed their learning but then you realize you wentthrough this yourself, and it took time. Storytelling is important,but they have to have their own learning.”
Back again on the tribe floor, we visit with Jan Rijkhoff, achapter lead. We wanted to learn about his chapter’s current ap-proach to problem solving. Over the years, they have experimentedwith different problem-solving methods, including A3, Kata, Leanstartup, and others, and finally settled on a blend of elements thatthey found helpful, creating their own approach. In our walk today,we have seen evidence of multiple problem-solving initiatives inflight and visualized on the walls.
Their approach is to gather the right people who have experi-ence and insights into the problem to rigorously examine the cur-rent condition. This rigor pays off, as the team gains insights thatincrease the probability of identifying the root cause rather thanjust the symptoms. With this learning, they form a hypothesisabout an approach to improvement, including how and what tomeasure to learn if the experiment produces the desired outcomes.If the experiment is a success, they make it part of the standardwork, share the learning, and continue to monitor to ensure theimprovement is sustained. They apply this problem-solving ap-proach at all levels of the organization. Sometimes a problem at
190 | PART THREE
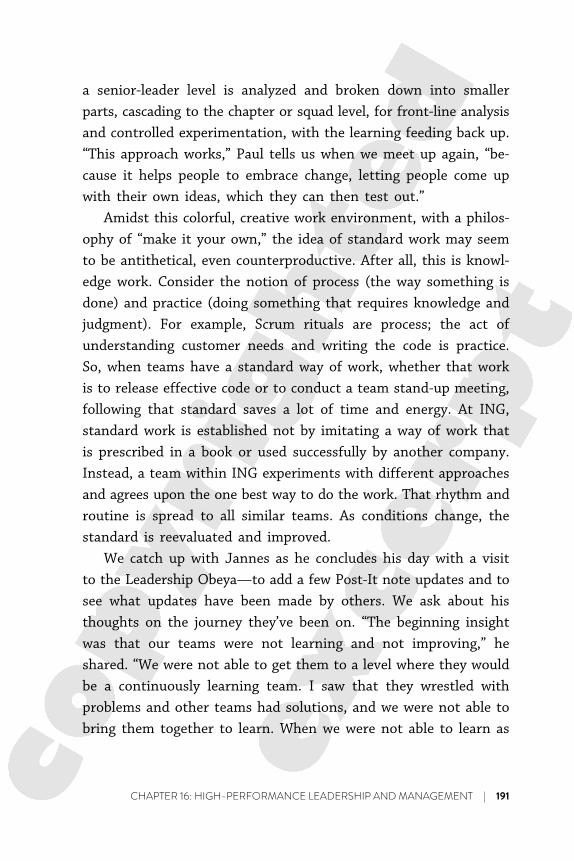
a senior-leader level is analyzed and broken down into smallerparts, cascading to the chapter or squad level, for front-line analysisand controlled experimentation, with the learning feeding back up.“This approach works,” Paul tells us when we meet up again, “be-cause it helps people to embrace change, letting people come upwith their own ideas, which they can then test out.”
Amidst this colorful, creative work environment, with a philos-ophy of “make it your own,” the idea of standard work may seemto be antithetical, even counterproductive. After all, this is knowl-edge work. Consider the notion of process (the way something isdone) and practice (doing something that requires knowledge andjudgment). For example, Scrum rituals are process; the act ofunderstanding customer needs and writing the code is practice.So, when teams have a standard way of work, whether that workis to release effective code or to conduct a team stand-up meeting,following that standard saves a lot of time and energy. At ING,standard work is established not by imitating a way of work thatis prescribed in a book or used successfully by another company.Instead, a team within ING experiments with different approachesand agrees upon the one best way to do the work. That rhythm androutine is spread to all similar teams. As conditions change, thestandard is reevaluated and improved.
We catch up with Jannes as he concludes his day with a visitto the Leadership Obeya—to add a few Post-It note updates and tosee what updates have been made by others. We ask about histhoughts on the journey they’ve been on. “The beginning insightwas that our teams were not learning and not improving,” heshared. “We were not able to get them to a level where they wouldbe a continuously learning team. I saw that they wrestled withproblems and other teams had solutions, and we were not able tobring them together to learn. When we were not able to learn as
CHAPTER 16: HIGH-PERFORMANCE LEADERSHIP AND MANAGEMENT | 191
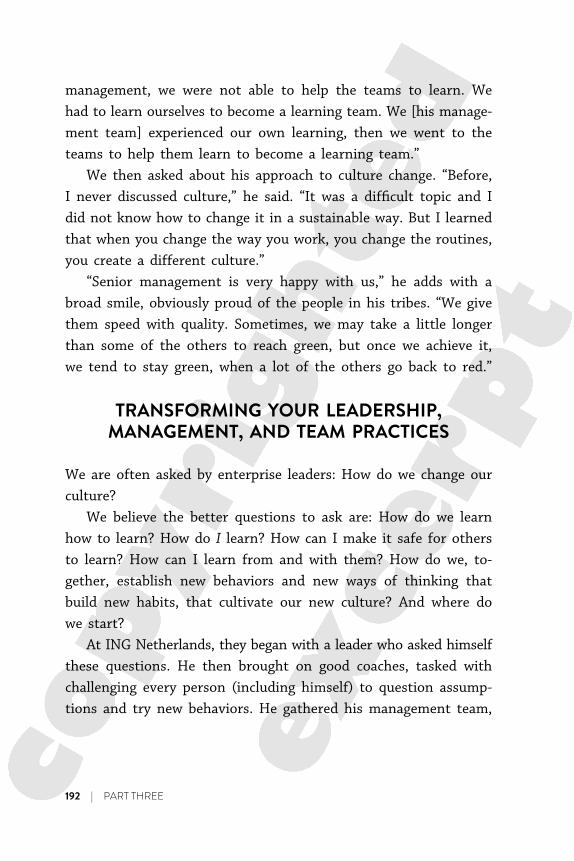
management, we were not able to help the teams to learn. Wehad to learn ourselves to become a learning team. We [his manage-ment team] experienced our own learning, then we went to theteams to help them learn to become a learning team.”
We then asked about his approach to culture change. “Before,I never discussed culture,” he said. “It was a difficult topic and Idid not know how to change it in a sustainable way. But I learnedthat when you change the way you work, you change the routines,you create a different culture.”
“Senior management is very happy with us,” he adds with abroad smile, obviously proud of the people in his tribes. “We givethem speed with quality. Sometimes, we may take a little longerthan some of the others to reach green, but once we achieve it,we tend to stay green, when a lot of the others go back to red.”
TRANSFORMING YOUR LEADERSHIP,MANAGEMENT, AND TEAM PRACTICES
We are often asked by enterprise leaders: How do we change ourculture?
We believe the better questions to ask are: How do we learnhow to learn? How do I learn? How can I make it safe for othersto learn? How can I learn from and with them? How do we, to-gether, establish new behaviors and new ways of thinking thatbuild new habits, that cultivate our new culture? And where dowe start?
At ING Netherlands, they began with a leader who asked himselfthese questions. He then brought on good coaches, tasked withchallenging every person (including himself) to question assump-tions and try new behaviors. He gathered his management team,
192 | PART THREE
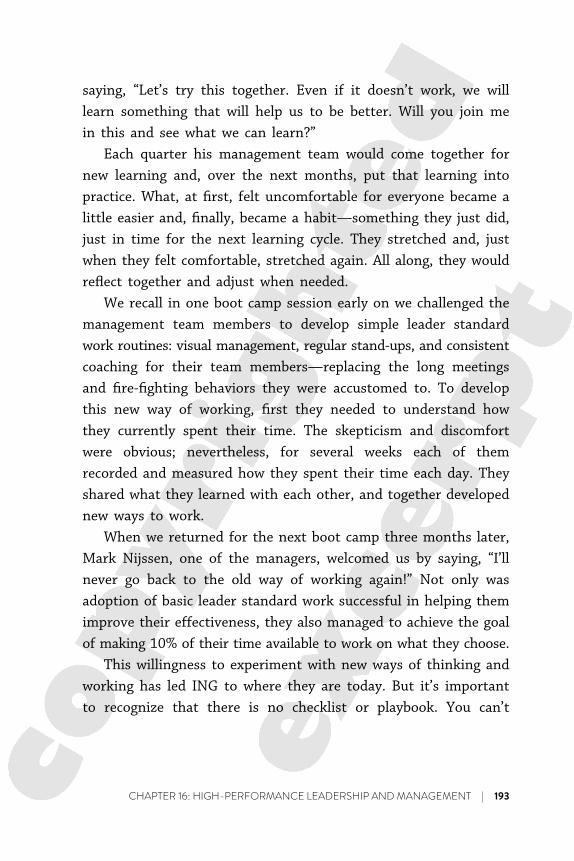
saying, “Let’s try this together. Even if it doesn’t work, we willlearn something that will help us to be better. Will you join mein this and see what we can learn?”
Each quarter his management team would come together fornew learning and, over the next months, put that learning intopractice. What, at first, felt uncomfortable for everyone became alittle easier and, finally, became a habit—something they just did,just in time for the next learning cycle. They stretched and, justwhen they felt comfortable, stretched again. All along, they wouldreflect together and adjust when needed.
We recall in one boot camp session early on we challenged themanagement team members to develop simple leader standardwork routines: visual management, regular stand-ups, and consistentcoaching for their team members—replacing the long meetingsand fire-fighting behaviors they were accustomed to. To developthis new way of working, first they needed to understand howthey currently spent their time. The skepticism and discomfortwere obvious; nevertheless, for several weeks each of themrecorded and measured how they spent their time each day. Theyshared what they learned with each other, and together developednew ways to work.
When we returned for the next boot camp three months later,Mark Nijssen, one of the managers, welcomed us by saying, “I’llnever go back to the old way of working again!” Not only wasadoption of basic leader standard work successful in helping themimprove their effectiveness, they also managed to achieve the goalof making 10% of their time available to work on what they choose.
This willingness to experiment with new ways of thinking andworking has led ING to where they are today. But it’s importantto recognize that there is no checklist or playbook. You can’t
CHAPTER 16: HIGH-PERFORMANCE LEADERSHIP AND MANAGEMENT | 193
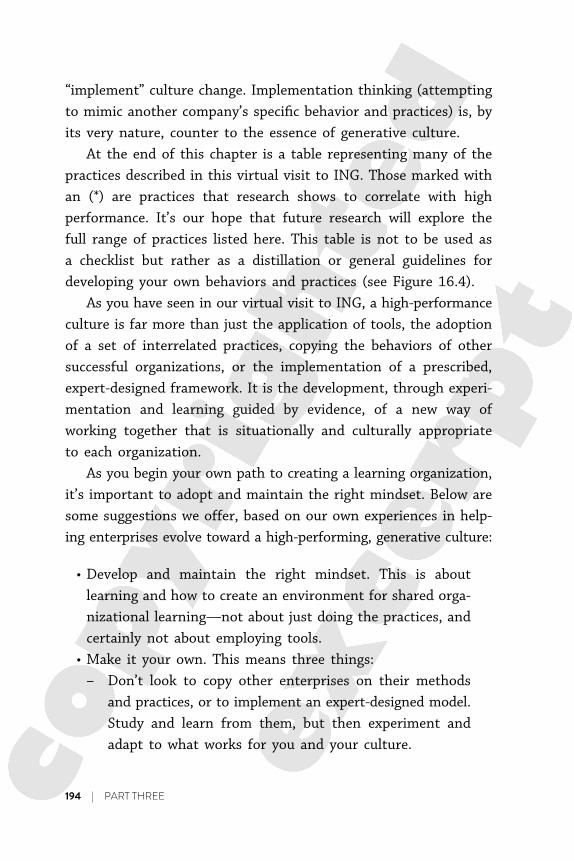
“implement” culture change. Implementation thinking (attemptingto mimic another company’s specific behavior and practices) is, byits very nature, counter to the essence of generative culture.
At the end of this chapter is a table representing many of thepractices described in this virtual visit to ING. Those marked withan (*) are practices that research shows to correlate with highperformance. It’s our hope that future research will explore thefull range of practices listed here. This table is not to be used asa checklist but rather as a distillation or general guidelines fordeveloping your own behaviors and practices (see Figure 16.4).
As you have seen in our virtual visit to ING, a high-performanceculture is far more than just the application of tools, the adoptionof a set of interrelated practices, copying the behaviors of othersuccessful organizations, or the implementation of a prescribed,expert-designed framework. It is the development, through experi-mentation and learning guided by evidence, of a new way ofworking together that is situationally and culturally appropriateto each organization.
As you begin your own path to creating a learning organization,it’s important to adopt and maintain the right mindset. Below aresome suggestions we offer, based on our own experiences in help-ing enterprises evolve toward a high-performing, generative culture:
• Develop and maintain the right mindset. This is aboutlearning and how to create an environment for shared orga-nizational learning—not about just doing the practices, andcertainly not about employing tools.
• Make it your own. This means three things:– Don’t look to copy other enterprises on their methods
and practices, or to implement an expert-designed model.Study and learn from them, but then experiment andadapt to what works for you and your culture.
194 | PART THREE
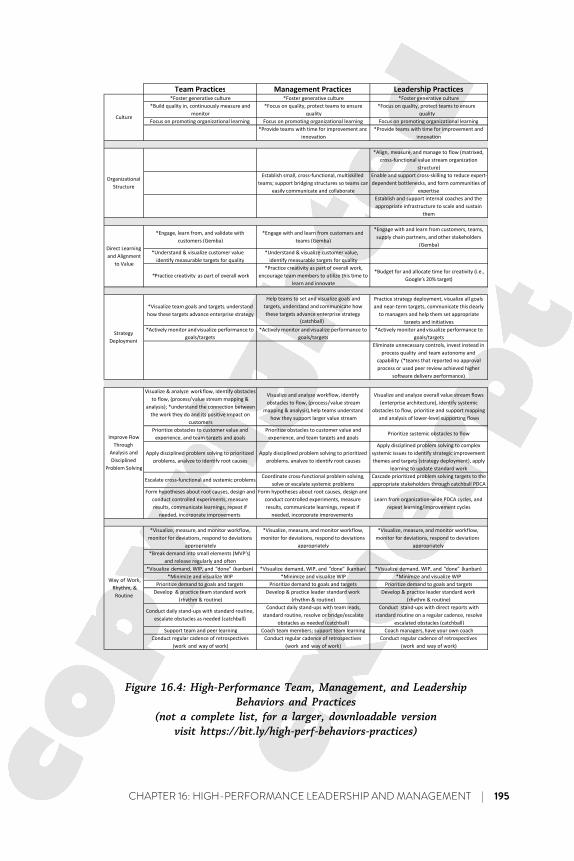
Team Practices Management Practices Leadership Practices*Foster generative culture *Foster generative culture *Foster generative culture
*Build quality in, continuously measure and
monitor
*Focus on quality, protect teams to ensure
quality
Focus on promoting organizational learning Focus on promoting organizational learning Focus on promoting organizational learning
*Provide teams with time for improvement and
innovation
*Provide teams with time for improvement and
innovation
*Align, measure, and manage to flow (matrixed,
cross-functional value stream organization
structure)
Establish small, cross-functional, multiskilled
teams; support bridging structures so teams can
easily communicate and collaborate
Enable and support cross-skilling to reduce expert-
dependent bottlenecks, and form communities of
expertise
Establish and support internal coaches and the
appropriate infrastructure to scale and sustain
them
*Engage, learn from, and validate with
customers (Gemba)
*Engage with and learn from customers and
teams (Gemba)
*Engage with and learn from customers, teams,
supply chain partners, and other stakeholders
(Gemba)
*Understand & visualize customer value,
identify measurable targets for quality
*Understand & visualize customer value,
identify measurable targets for quality
*Practice creativity as part of overall work
*Practice creativity as part of overall work,
encourage team members to utilize this time to
learn and innovate
*Budget for and allocate time for creativity (i.e.,
Google’s 20% target)
*Visualize team goals and targets, understand
how these targets advance enterprise strategy
Practice strategy deployment, visualize all goals
and near-term targets, communicate thisclearly
to managers and help them set appropriate
targets and initiatives
*Actively monitor and visualize performance to
goals/targets
*Actively monitor and visualize performance to
goals/targets
*Actively monitor and visualize performance to
goals/targets
Eliminate unnecessary controls, invest instead in
process quality and team autonomy and
capability (*teams that reported no approval
process or used peer review achieved higher
software delivery performance)
Visualize & analyze workflow, identify obstacles
to flow, (process/value stream mapping &
analysis); *understand the connection between
the work they do and its positive impact on
customers
Visualize and analyze workflow, identify
obstacles to flow, (process/value stream
mapping & analysis),help teams understand
how they support larger value stream
Visualize and analyze overall value stream flows
(enterprise architecture), identify systemic
obstacles to flow, prioritize and support mapping
and analysis of lower-level supporting flows
Prioritize obstacles to customer value and
experience, and team targets and goals
Prioritize obstacles to customer value and
experience, and team targets and goalsPrioritize systemic obstacles to flow
Apply disciplined problem solving to prioritized
problems, analyze to identify root causes
Apply disciplined problem solving to prioritized
problems, analyze to identify root causes
Apply disciplined problem solving to complex
systemic issues to identify strategic improvement
themes and targets (strategy deployment), apply
learning to update standard work
Escalate cross-functional and systemic problemsCoordinate cross-functional problem solving,
solve or escalate systemic problems
Cascade prioritized problem solving targets to the
appropriate stakeholders through catchball PDCA
Form hypotheses about root causes, design and
conduct controlled experiments, measure
results, communicate learnings, repeat if
needed, incorporate improvements
Learn from organization-wide PDCA cycles, and
repeat learning/improvement cycles
*Visualize, measure, and monitor workflow,
monitor for deviations, respond to deviations
appropriately
*Break demand into small elements (MVP’s)
and release regularly and often
*Visualize demand, WIP, and “done” (kanban)
*Minimize and visualize WIP *Minimize and visualize WIP *Minimize and visualize WIP
Prioritize demand to goals and targets Prioritize demand to goals and targets Prioritize demand to goals and targets
Develop & practice team standard work
(rhythm & routine)
Develop & practice leader standard work
(rhythm & routine)
Conduct daily stand-ups with standard routine,
escalate obstacles as needed (catchball)
Conduct daily stand-ups with team leads,
standard routine, resolve or bridge/escalate
obstacles as needed (catchball)
Conduct stand-ups with direct reports with
standard routine on a regular cadence, resolve
escalated obstacles (catchball)
Support team and peer learning Coach team members; support team learning Coach managers, have your own coach
Conduct regular cadence of retrospectives
(work and way of work)
Way of Work,
Rhythm, &
Routine
Strategy
Deployment
Improve Flow
Through
Analysis and
Disciplined
Problem Solving
Culture
Direct Learning
and Alignment
to Value
Organizational
Structure
Help teams to set and visualize goals and
targets, understand and communicate how
these targets advance enterprise strategy
(catchball)
*Visualize demand, WIP, and “done” (kanban) *Visualize demand, WIP, and “done” (kanban)
*Visualize, measure, and monitor workflow,
monitor for deviations, respond to deviations
appropriately
*Visualize, measure, and monitor workflow,
monitor for deviations, respond to deviations
appropriately
Conduct regular cadence of retrospectives
(work and way of work)
Conduct regular cadence of retrospectives
(work and way of work)
Develop & practice leader standard work
(rhythm & routine)
*Focus on quality, protect teams to ensure
quality
Form hypotheses about root causes, design and
conduct controlled experiments, measure
results, communicate learnings, repeat if
needed, incorporate improvements
Figure 16.4: High-Performance Team, Management, and LeadershipBehaviors and Practices
(not a complete list, for a larger, downloadable versionvisit https://bit.ly/high-perf-behaviors-practices)
CHAPTER 16: HIGH-PERFORMANCE LEADERSHIP AND MANAGEMENT | 195
– Don’t contract it out to a large consulting firm to expe-diently transform your organization or to implementnew methodologies or practices for you. Your teams willfeel that these methodologies (Lean, Agile, whatever) arebeing done to them. While your current processes maytemporarily improve, your teams will not develop theconfidence or capability to sustain, continue to improve,or to adapt and develop new processes and behaviors ontheir own.
– Do develop your own coaches. Initially you may need tohire outside coaching to establish a solid foundation, butyou must ultimately be the agent of your own change.Coaching depth is a key lever for sustaining and scaling.
• You, too, need to change your way of work. Whether youare a senior leader, manager, or team member, lead by ex-ample. A generative culture starts with demonstrating newbehaviors, not delegating them.
• Practice discipline. It was not easy for Jannes’ managementteam to record and reflect on how they spent their time ortry new things they weren’t initially comfortable with infront of the people who reported to them. Change takesdiscipline and courage.
• Practice patience. Your current way of work took decadesto entrench. It’s going to take time to change actions andthought patterns until they become new habits and, eventu-ally, your new culture.
• Practice practice. You just have to try it: learn, succeed, fail,learn, adjust, repeat. Rhythm and routine, rhythm and rou-tine, rhythm and routine . . .
196 | PART THREE
As you learn a new way of leading and working, you, and thoseyou bring along with you on this journey, will explore, stretch,make some mistakes, get a lot right, learn, grow, and keep onlearning. You’ll discover better and faster ways to engage, learn,and adapt to changing conditions. In doing so, you’ll improvequality and speed in everything you do. You’ll grow your ownleaders, innovate, and outperform your competition. You’ll morerapidly and effectively improve value for customers and the enter-prise. As the research shows, you’ll “have a measurable impact onan organization’s profitability, productivity, and market share.These also have an impact on customer satisfaction, efficiency, andthe ability to achieve organizational goals.”
We wish you all the best on your learning journey!
Steve and Karen
CHAPTER 16: HIGH-PERFORMANCE LEADERSHIP AND MANAGEMENT | 197