PRACTICE PACKET: TOPIC 8 CLIMATE Practice … › ... › topic_8_practice_packet.pdfPRACTICE...
52
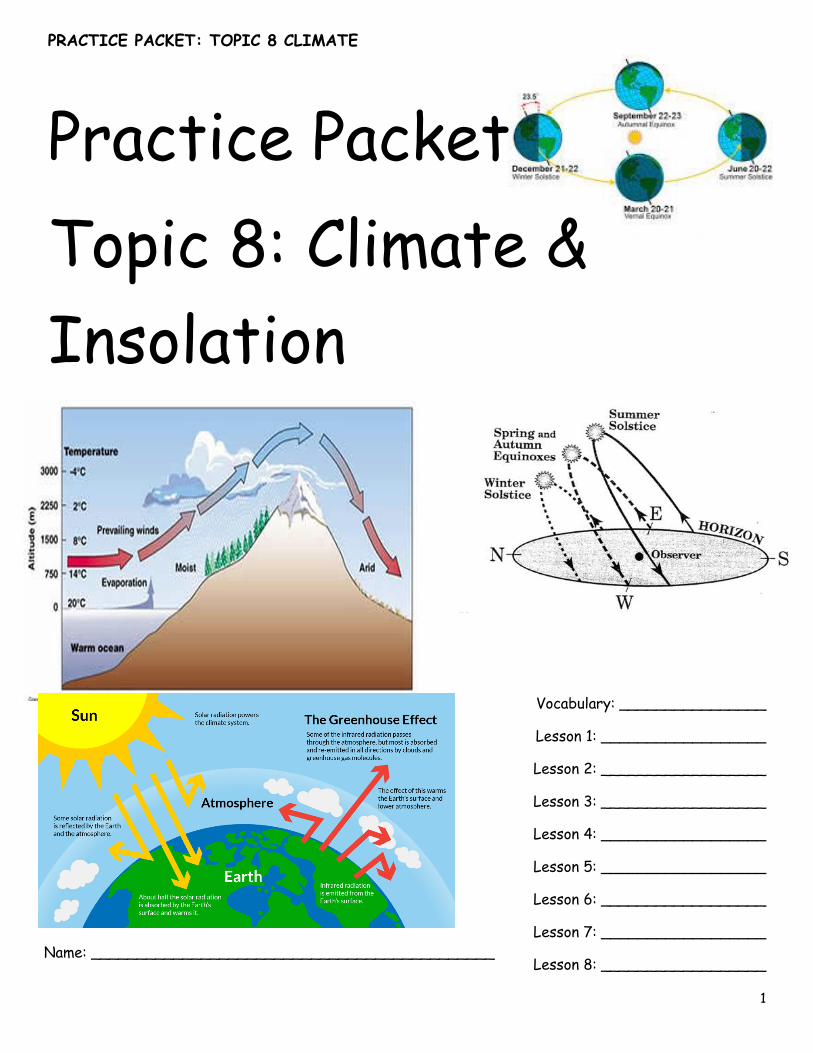
PRACTICE PACKET: TOPIC 8 CLIMATE 1 Practice Packet Topic 8: Climate & Insolation Vocabulary: ________________ Lesson 1: __________________ Lesson 2: __________________ Lesson 3: __________________ Lesson 4: __________________ Lesson 5: __________________ Lesson 6: __________________ Lesson 7: __________________ Lesson 8: __________________ Name: ____________________________________________
Transcript of PRACTICE PACKET: TOPIC 8 CLIMATE Practice … › ... › topic_8_practice_packet.pdfPRACTICE...
PRACTICE PACKET: TOPIC 8 CLIMATE
1
Practice Packet
Topic 8: Climate &
Insolation
Vocabulary: ________________
Lesson 1: __________________
Lesson 2: __________________
Lesson 3: __________________
Lesson 4: __________________
Lesson 5: __________________
Lesson 6: __________________
Lesson 7: __________________
Lesson 8: __________________ Name: ____________________________________________
PRACTICE PACKET: TOPIC 8 CLIMATE
2
VOCABULARY
For each word, provide a short but specific definition from YOUR OWN BRAIN! No boring textbook
definitions. Write something to help you remember the word. Explain the word as if you were explaining
it to an elementary school student. Give an example if you can. Don’t use the words given in your
definition!
Climate: _______________________________________________________________________
Annual Temperature Range: _________________________________________________________
Arid: __________________________________________________________________________
Humid: ________________________________________________________________________
Angle of Intensity: _______________________________________________________________
Marine Climate: __________________________________________________________________
Continental Climate: ______________________________________________________________
Monsoons: ______________________________________________________________________
El Niño: ________________________________________________________________________
La Niña: _______________________________________________________________________
Windward: _____________________________________________________________________
Leeward: _______________________________________________________________________
Insolation: _____________________________________________________________________
Infrared: ______________________________________________________________________
O-zone Layer: ___________________________________________________________________
Angle of Incidence: _______________________________________________________________
Greenhouse Effect: _______________________________________________________________
Global Warming: _________________________________________________________________
Duration of Insolation: ____________________________________________________________
Insolation Temperature Lag: ________________________________________________________
Parallelism: _____________________________________________________________________
Summer Solstice: ________________________________________________________________

PRACTICE PACKET: TOPIC 8 CLIMATE
3
Fall Equinox: ____________________________________________________________________
Winter Solstice: _________________________________________________________________
Spring Equinox: __________________________________________________________________
Apparent Motion: ________________________________________________________________
Real Motion: ____________________________________________________________________
Altitude of Polaris: _______________________________________________________________
Zenith: ________________________________________________________________________
Lesson 1 – What is Climate
Climate is the overall view of a region’s weather conditions over a long period of time. Factors that
affect climate include latitude, elevation, proximity to large bodies of water, ocean currents, prevailing
winds, mountain ranges, amount of cloud cover and vegetative cover. It is important to understand that
since so many factors affect climate no one factor acts alone. For example a location at the equator on
top of a mountain will have cold temperatures even though temperatures at the equator are generally
warmer.
1. What is climate: ____________________________________________________________
2. What are the 8 factors that affect climate? ______________________________________
________________________________ ______________________________________
________________________________ ______________________________________
________________________________ ______________________________________
________________________________
** Temperature & Seasons are opposite in the Sothern Hemisphere. **
1. What is the temperature like in NY in July? What about Argentina (42˚S)?
2. What is the temperature like in NY in January? What about Argentina
(42˚S)?
Objective:
• I can name the two properties that determine an areas climate
• I can explain Annual Temperature Range
• I can contrast Arid & Humid
• I can describe how latitude effects temperature & moisture

PRACTICE PACKET: TOPIC 8 CLIMATE
4
Latitude: The data table below shows yearly average temperatures
in degrees Fahrenheit for selected locations on a similar line of
longitude. Use the data given to answer the questions below. The
source of this information was www.worldclimate.com.
1. Which location was farthest North? ___________________
2. What is the yearly average temperature at this location? _____ ˚F
3. Which location was farthest South? ____________________________
4. What is the yearly average temperature of this location? ______˚F
Planetary Winds: The data below shows average rainfall of two locations at similar latitudes. Clearwater,
WA is located on the west coast of North America and Van Buren, ME is located on the east coast. The
source of this information was www.worldclimate.com.
Planetary winds help determine which way air masses and weather systems move. If an air mass
originates over the water, and the planetary winds carry the air mass over land, that location will have a
lot precipitation. If an air mass is carried over land to a location, there will not be as much precipitation.

PRACTICE PACKET: TOPIC 8 CLIMATE
5
Directions: Use the data and page 14 in your Earth Science Reference Tables to answer the following
questions.
1. What is the name of the planetary wind located at the latitude shown above? ______________
2. What is located to the west of Clearwater, WA? ____________________________________
3. What is the amount of rainfall in one year from Clearwater, WA? ________________________
4. What is located to the west of Van Buren, ME? _____________________________________
5. What is the amount of rainfall in one year from Van Buren, ME? _________________________
6. Explain why Clearwater has such a great amount of precipitation. ________________________
_________________________________________________________________________
Climate Clues The chart below shows climate statistics for some U.S. cities. Information like this is recorded so that
meteorologists can study and predict long-term weather patterns. Refer to the chart below to answer
the questions that follow.
Your Turn to Think
1. Which city has the highest average temperature in January? in July?
January: _______________________ July: ________________________
2. What climate factor or factors explain why the answer for highest temperature in January &
July is not the same city?
THINKING CRITICALLY

PRACTICE PACKET: TOPIC 8 CLIMATE
6
3. Which city has the lowest temperature in January? in July?
January: _______________________ July: ________________________
4. What climate factor or factors explain why the answer for lowest temperature in January & July
is not the same city?
5. Based on the July averages what city do you think is the furthest North (highest latitude)? The
furthest South (lowest latitude)? Explain your answers.
High Latitude: ______________________ Low Latitude: _________________________
6. Which city has the highest number of cloudy days? __________________________________
7. What climate factor or factors explains why it has the most cloudy days? (Look at a map if you need help)
8. If you like clear weather, which city would you prefer to live in? Explain your answer.
9. Which city has the largest range between its average January and July temperatures? What is
the temperature difference?
City: _______________________ Temperature Range: __________________________
10. Which city has the smallest range between its average January and July temperatures? What is
the temperature difference?
City: _______________________ Temperature Range: __________________________
Regents Questions:
1. The graph below shows the yearly air temperature
and precipitation of a location on Earth. This
location would be most likely at a latitude of
a. 0° b. 50° N c. 35° S d. 90° N
2. Which climate condition generally results from both
an increase in distance from the equator and an
increase in elevation above sea level?
a. cooler temperatures
b. warmer prevailing winds
c. increased precipitation
d. increased air pressure
PRACTICE PACKET: TOPIC 8 CLIMATE
7
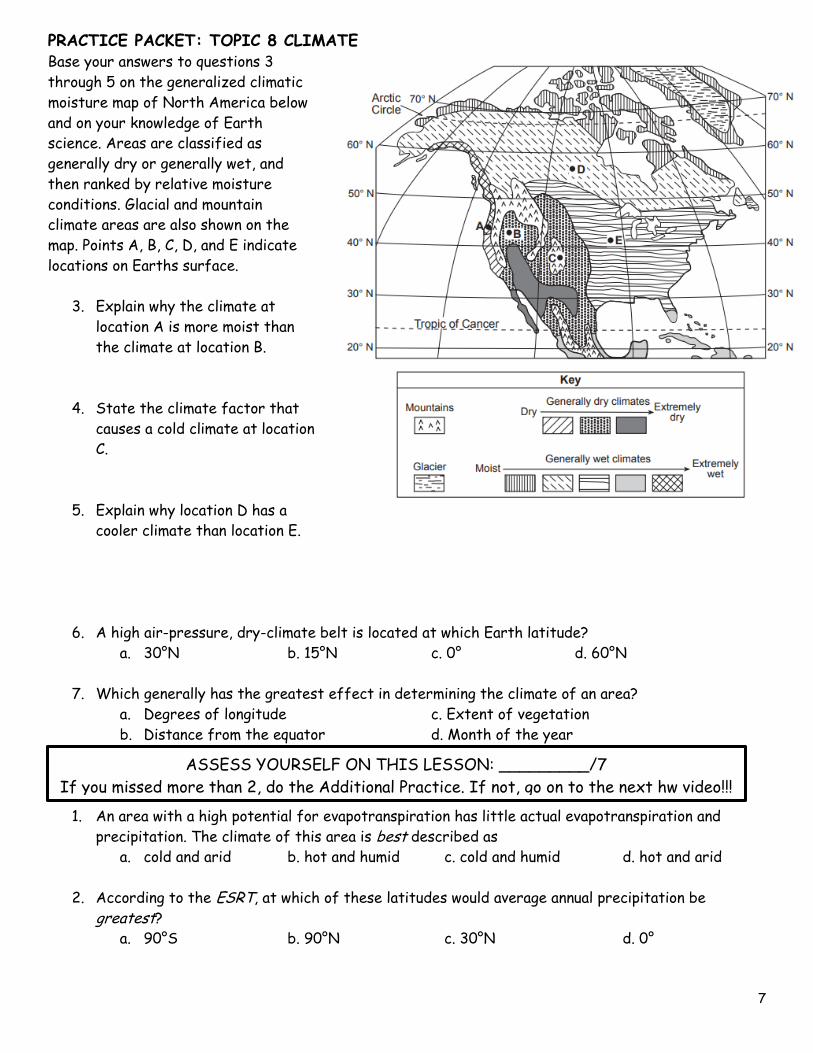
Base your answers to questions 3
through 5 on the generalized climatic
moisture map of North America below
and on your knowledge of Earth
science. Areas are classified as
generally dry or generally wet, and
then ranked by relative moisture
conditions. Glacial and mountain
climate areas are also shown on the
map. Points A, B, C, D, and E indicate
locations on Earths surface.
3. Explain why the climate at
location A is more moist than
the climate at location B.
4. State the climate factor that
causes a cold climate at location
C.
5. Explain why location D has a
cooler climate than location E.
6. A high air-pressure, dry-climate belt is located at which Earth latitude?
a. 30°N b. 15°N c. 0° d. 60°N
7. Which generally has the greatest effect in determining the climate of an area?
a. Degrees of longitude c. Extent of vegetation
b. Distance from the equator d. Month of the year
1. An area with a high potential for evapotranspiration has little actual evapotranspiration and
precipitation. The climate of this area is best described as
a. cold and arid b. hot and humid c. cold and humid d. hot and arid
2. According to the ESRT, at which of these latitudes would average annual precipitation be
greatest?
a. 90°S b. 90°N c. 30°N d. 0°
ASSESS YOURSELF ON THIS LESSON: _________/7
If you missed more than 2, do the Additional Practice. If not, go on to the next hw video!!!

PRACTICE PACKET: TOPIC 8 CLIMATE
8
3. The planetary wind & moisture belts indicate that large amounts of rainfall occur at Earth’s
equator because air at Earth’s surface is
a. Converging & rising c. Converging & sinking
b. Diverging & rising d. Diverging & sinking
Lesson 2 – Climate 2 Notes
Nearness to a Large body of Water:
Questions:
1. What happens to the average monthly temperature range as the distance from the lake
increases?
2. Why does this happen?
3. What happens to the number of frost-free days as the distance from the lake increases?
4. Why does this happen?
5. What happens to the annual precipitation as the distance from the lake increases?
6. Why does this happen?
Match the type of climate with its description.
Objective:
I can explain how distance from water affects climate
I can contrast Marine & Continental climates
I can explain how ocean currents affect climate
I can use the Planetary Wind chart in ESRT
I can explain El Niño & La Niña
ASSESS YOURSELF ON THIS ADDITIONAL PRACTICE: _________/3
If you missed more than 1 you should see me for extra help and/or re-watch the lesson
video assignment
PRACTICE PACKET: TOPIC 8 CLIMATE
9
7. Marine climate _____
8. Continental climate ___
a. Relatively warm winters and cool summers
b. Cold winters & warm or hot summers
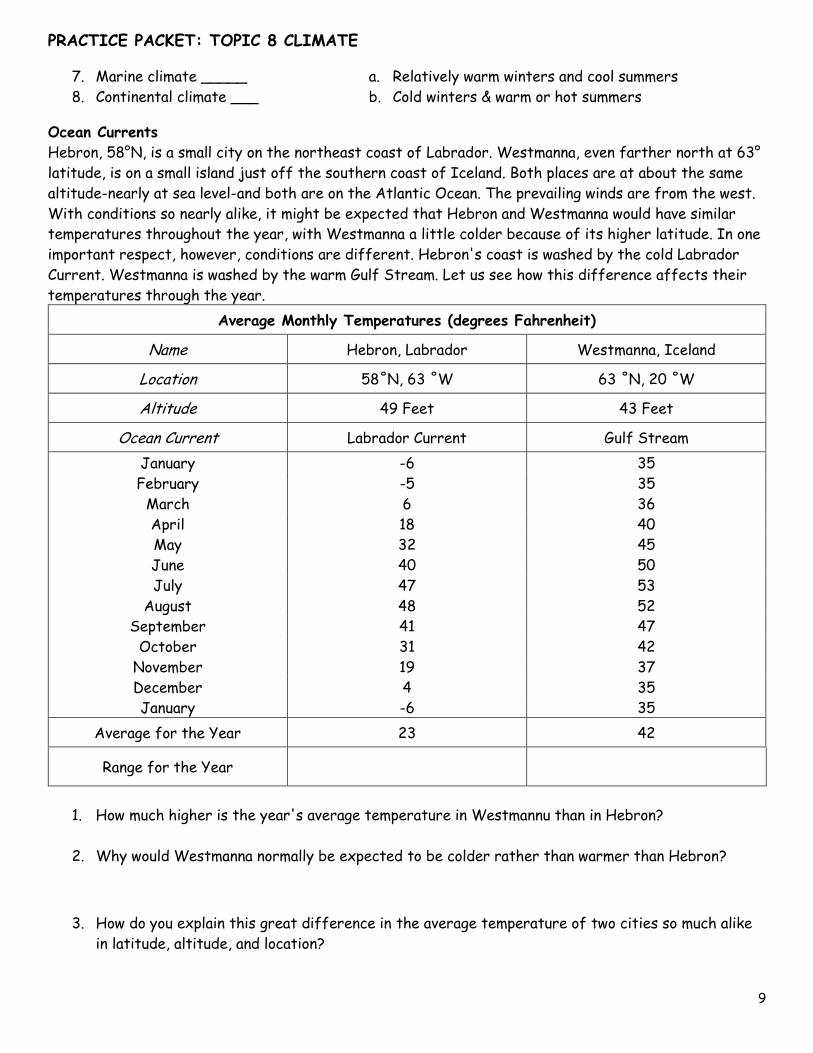
Ocean Currents
Hebron, 58°N, is a small city on the northeast coast of Labrador. Westmanna, even farther north at 63°
latitude, is on a small island just off the southern coast of Iceland. Both places are at about the same
altitude-nearly at sea level-and both are on the Atlantic Ocean. The prevailing winds are from the west.
With conditions so nearly alike, it might be expected that Hebron and Westmanna would have similar
temperatures throughout the year, with Westmanna a little colder because of its higher latitude. In one
important respect, however, conditions are different. Hebron's coast is washed by the cold Labrador
Current. Westmanna is washed by the warm Gulf Stream. Let us see how this difference affects their
temperatures through the year.
Average Monthly Temperatures (degrees Fahrenheit)
Name Hebron, Labrador Westmanna, Iceland
Location 58˚N, 63 ˚W 63 ˚N, 20 ˚W
Altitude 49 Feet 43 Feet
Ocean Current Labrador Current Gulf Stream
January -6 35
February -5 35
March 6 36
April 18 40
May 32 45
June 40 50
July 47 53
August 48 52
September 41 47
October 31 42
November 19 37
December 4 35
January -6 35
Average for the Year 23 42
Range for the Year
1. How much higher is the year's average temperature in Westmannu than in Hebron?
2. Why would Westmanna normally be expected to be colder rather than warmer than Hebron?
3. How do you explain this great difference in the average temperature of two cities so much alike
in latitude, altitude, and location?
PRACTICE PACKET: TOPIC 8 CLIMATE
10
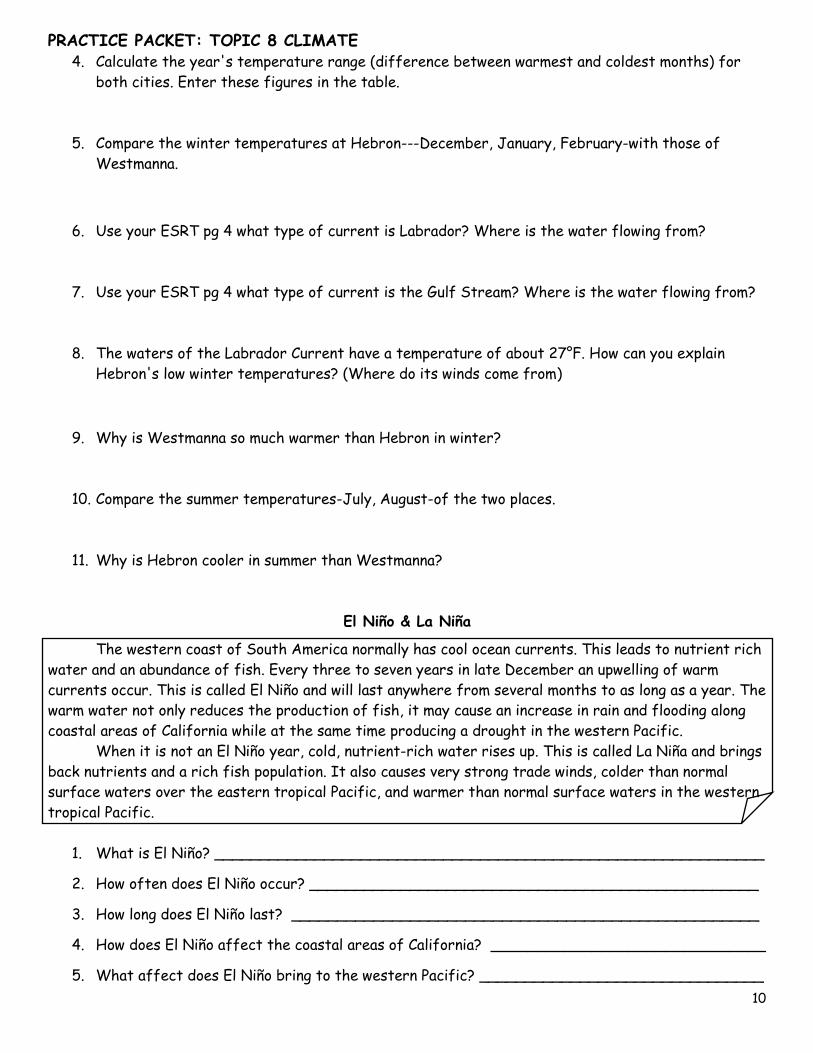
4. Calculate the year's temperature range (difference between warmest and coldest months) for
both cities. Enter these figures in the table.
5. Compare the winter temperatures at Hebron---December, January, February-with those of
Westmanna.
6. Use your ESRT pg 4 what type of current is Labrador? Where is the water flowing from?
7. Use your ESRT pg 4 what type of current is the Gulf Stream? Where is the water flowing from?
8. The waters of the Labrador Current have a temperature of about 27°F. How can you explain
Hebron's low winter temperatures? (Where do its winds come from)
9. Why is Westmanna so much warmer than Hebron in winter?
10. Compare the summer temperatures-July, August-of the two places.
11. Why is Hebron cooler in summer than Westmanna?
El Niño & La Niña
The western coast of South America normally has cool ocean currents. This leads to nutrient rich
water and an abundance of fish. Every three to seven years in late December an upwelling of warm
currents occur. This is called El Niño and will last anywhere from several months to as long as a year. The
warm water not only reduces the production of fish, it may cause an increase in rain and flooding along
coastal areas of California while at the same time producing a drought in the western Pacific.
When it is not an El Niño year, cold, nutrient-rich water rises up. This is called La Niña and brings
back nutrients and a rich fish population. It also causes very strong trade winds, colder than normal
surface waters over the eastern tropical Pacific, and warmer than normal surface waters in the western
tropical Pacific.
1. What is El Niño? ____________________________________________________________
2. How often does El Niño occur? _________________________________________________
3. How long does El Niño last? ___________________________________________________
4. How does El Niño affect the coastal areas of California? ______________________________
5. What affect does El Niño bring to the western Pacific? _______________________________
PRACTICE PACKET: TOPIC 8 CLIMATE
11
6. What economic impact may El Niño have? __________________________________________
7. When does La Niña occur? _____________________________________________________
8. What does La Niña cause in the eastern tropical Pacific? ______________________________
9. What does La Niña cause in the western tropical Pacific? ______________________________
REGENTS QUESTIONS:
1. Riverhead, New York, has a smaller average daily temperature range than Elmira, New York,
because Riverhead is located
a. near a large body of water c. at a lower latitude
b. at a higher elevation d. near a large city
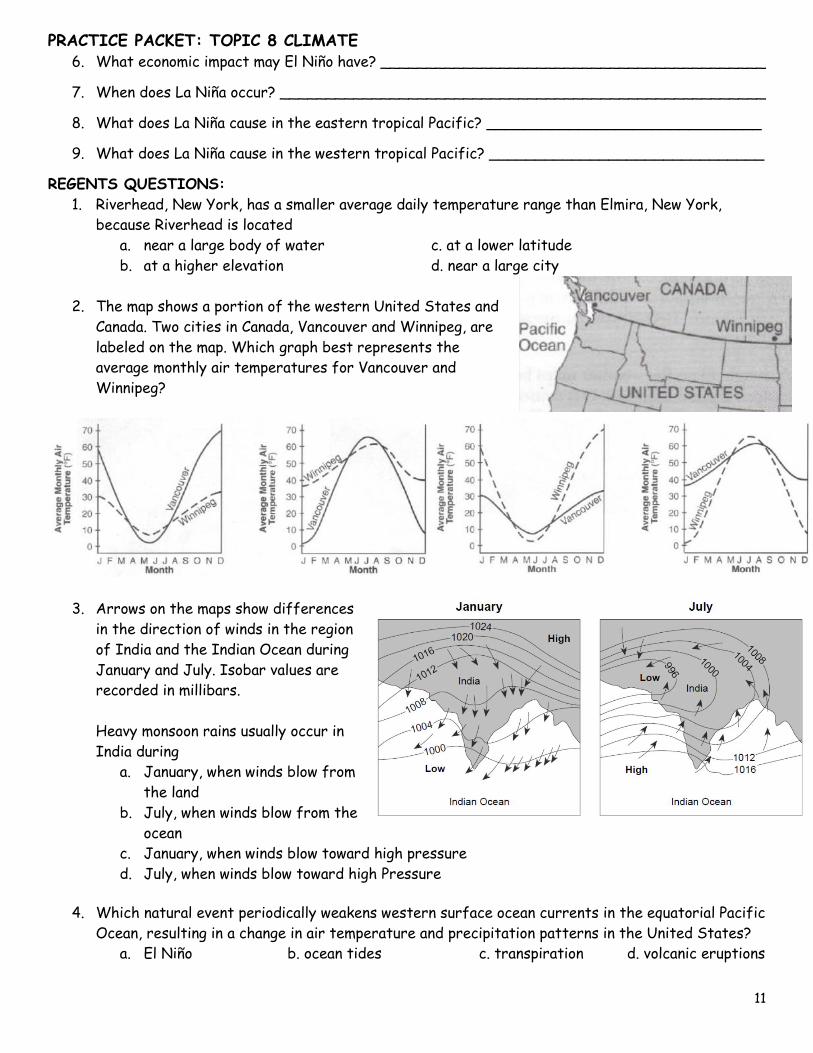
2. The map shows a portion of the western United States and
Canada. Two cities in Canada, Vancouver and Winnipeg, are
labeled on the map. Which graph best represents the
average monthly air temperatures for Vancouver and
Winnipeg?
3. Arrows on the maps show differences
in the direction of winds in the region
of India and the Indian Ocean during
January and July. Isobar values are
recorded in millibars.
Heavy monsoon rains usually occur in
India during
a. January, when winds blow from
the land
b. July, when winds blow from the
ocean
c. January, when winds blow toward high pressure
d. July, when winds blow toward high Pressure
4. Which natural event periodically weakens western surface ocean currents in the equatorial Pacific
Ocean, resulting in a change in air temperature and precipitation patterns in the United States?
a. El Niño b. ocean tides c. transpiration d. volcanic eruptions

PRACTICE PACKET: TOPIC 8 CLIMATE
12
5. A city located on the coast of North America has warmer winters and cooler summers than a city
at the same elevation and latitude located near the center of North America. Which statement
best explains the difference between the climates of the two cities?
a. Ocean surfaces change temperature more slowly than land surfaces.
b. Warm, moist air rises when it meets cool, dry air.
c. Wind speeds are usually greater over land than over ocean water.
d. Water has a lower specific heat than land.
6. Which two 23.5°-latitude locations are influenced by cool surface ocean currents?
a. the east coast of North America and the west coast of Australia
b. the east coast of Asia and the east coast of North America
c. the west coast of Africa and the east coast of South America
d. the west coast of North America and the west coast of South America
Base your answers to questions 7 through 10 on the graph and map below and on your knowledge of Earth
science. The average monthly temperatures for Eureka, California, and Omaha, Nebraska, are plotted on
the graph. The map indicates the locations of these two cities.
7. Calculate the rate of change in the average monthly temperature for Omaha during the two-
month period between October and December, as shown on the graph.
8. Explain why Omaha, which is farther inland, has a greater variation in temperatures throughout
the year than Eureka, which is closer to the ocean.
9. Identify the month with the greatest difference in the average temperature between these two
cities.
10. Identify the surface ocean current that affects the climate of Eureka.
ASSESS YOURSELF ON THIS LESSON: _________/10
If you missed more than 3, do the Additional Practice. If not, go on to the next hw video!!!
PRACTICE PACKET: TOPIC 8 CLIMATE
13
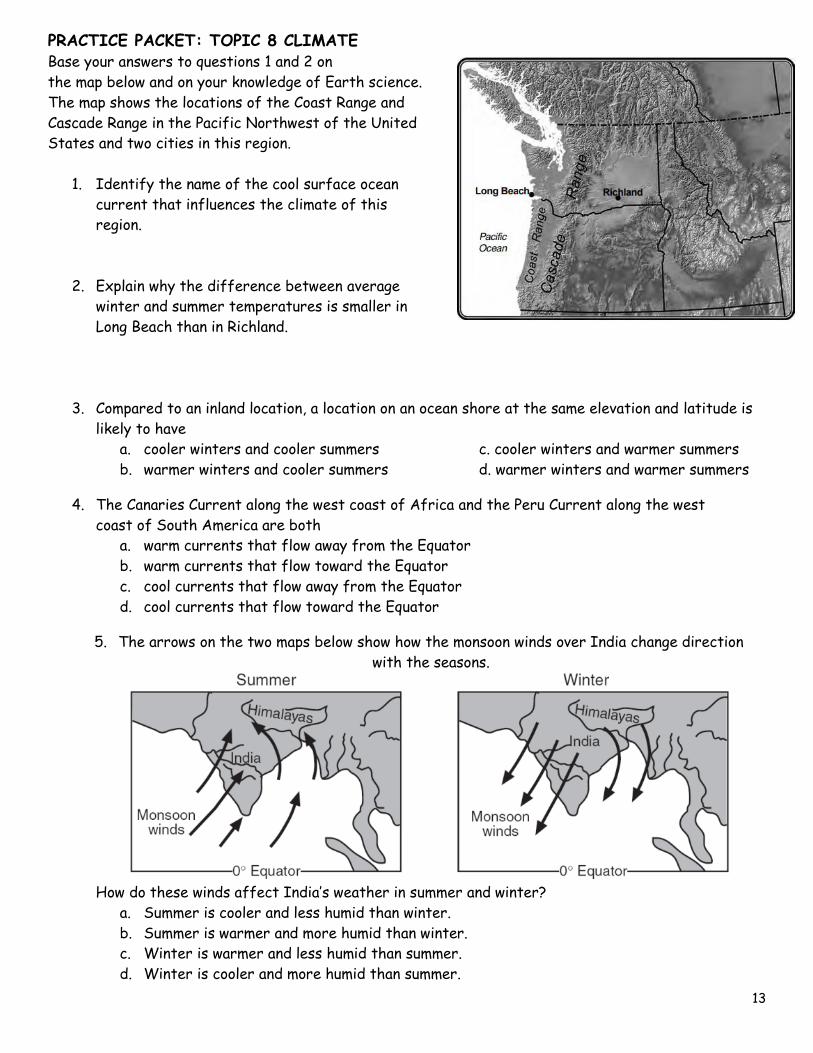
Base your answers to questions 1 and 2 on
the map below and on your knowledge of Earth science.
The map shows the locations of the Coast Range and
Cascade Range in the Pacific Northwest of the United
States and two cities in this region.
1. Identify the name of the cool surface ocean
current that influences the climate of this
region.
2. Explain why the difference between average
winter and summer temperatures is smaller in
Long Beach than in Richland.
3. Compared to an inland location, a location on an ocean shore at the same elevation and latitude is
likely to have
a. cooler winters and cooler summers c. cooler winters and warmer summers
b. warmer winters and cooler summers d. warmer winters and warmer summers
4. The Canaries Current along the west coast of Africa and the Peru Current along the west
coast of South America are both
a. warm currents that flow away from the Equator
b. warm currents that flow toward the Equator
c. cool currents that flow away from the Equator
d. cool currents that flow toward the Equator
5. The arrows on the two maps below show how the monsoon winds over India change direction
with the seasons.
How do these winds affect India’s weather in summer and winter?
a. Summer is cooler and less humid than winter.
b. Summer is warmer and more humid than winter.
c. Winter is warmer and less humid than summer.
d. Winter is cooler and more humid than summer.
PRACTICE PACKET: TOPIC 8 CLIMATE
14
6. Which ocean current has the greatest warming influence on the climate of the Outer Banks of
North Carolina?
a. Gulf Stream Current c. Labrador Current
b. North Atlantic Current d. Canary Current
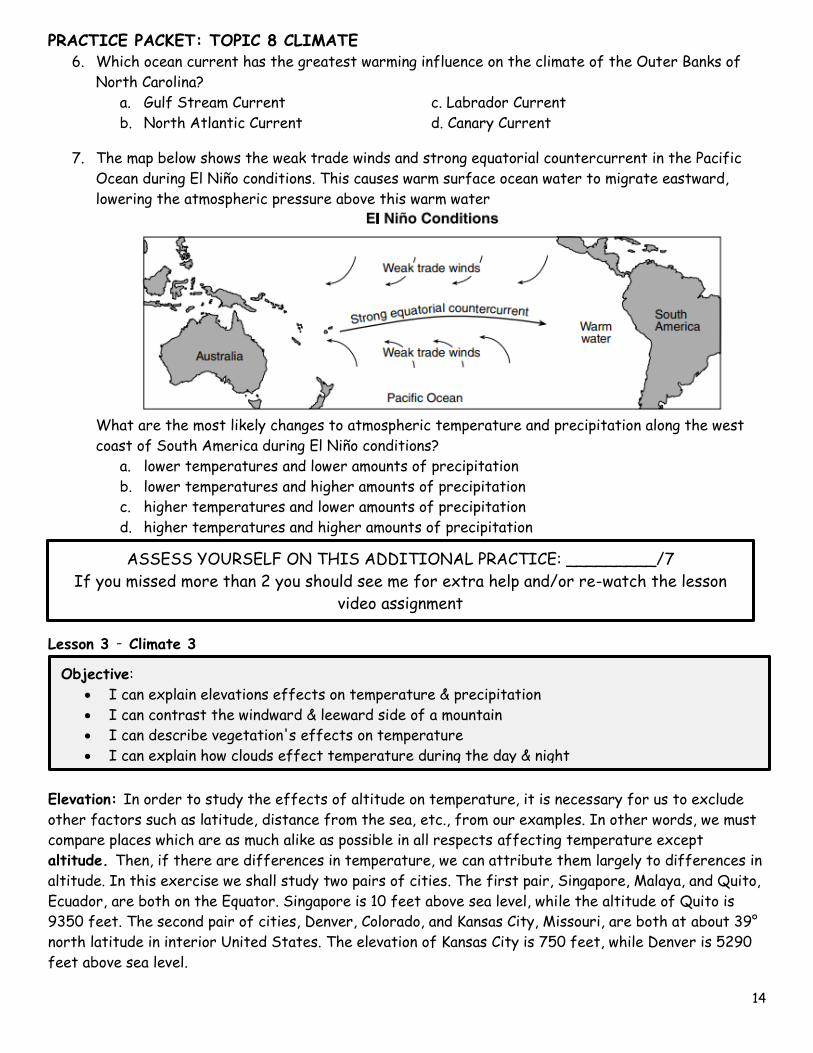
7. The map below shows the weak trade winds and strong equatorial countercurrent in the Pacific
Ocean during El Niño conditions. This causes warm surface ocean water to migrate eastward,
lowering the atmospheric pressure above this warm water
What are the most likely changes to atmospheric temperature and precipitation along the west
coast of South America during El Niño conditions?
a. lower temperatures and lower amounts of precipitation
b. lower temperatures and higher amounts of precipitation
c. higher temperatures and lower amounts of precipitation
d. higher temperatures and higher amounts of precipitation
Lesson 3 – Climate 3
Elevation: In order to study the effects of altitude on temperature, it is necessary for us to exclude
other factors such as latitude, distance from the sea, etc., from our examples. In other words, we must
compare places which are as much alike as possible in all respects affecting temperature except
altitude. Then, if there are differences in temperature, we can attribute them largely to differences in
altitude. In this exercise we shall study two pairs of cities. The first pair, Singapore, Malaya, and Quito,
Ecuador, are both on the Equator. Singapore is 10 feet above sea level, while the altitude of Quito is
9350 feet. The second pair of cities, Denver, Colorado, and Kansas City, Missouri, are both at about 39°
north latitude in interior United States. The elevation of Kansas City is 750 feet, while Denver is 5290
feet above sea level.
Objective:
I can explain elevations effects on temperature & precipitation
I can contrast the windward & leeward side of a mountain
I can describe vegetation's effects on temperature
I can explain how clouds effect temperature during the day & night
ASSESS YOURSELF ON THIS ADDITIONAL PRACTICE: _________/7
If you missed more than 2 you should see me for extra help and/or re-watch the lesson
video assignment
PRACTICE PACKET: TOPIC 8 CLIMATE
15
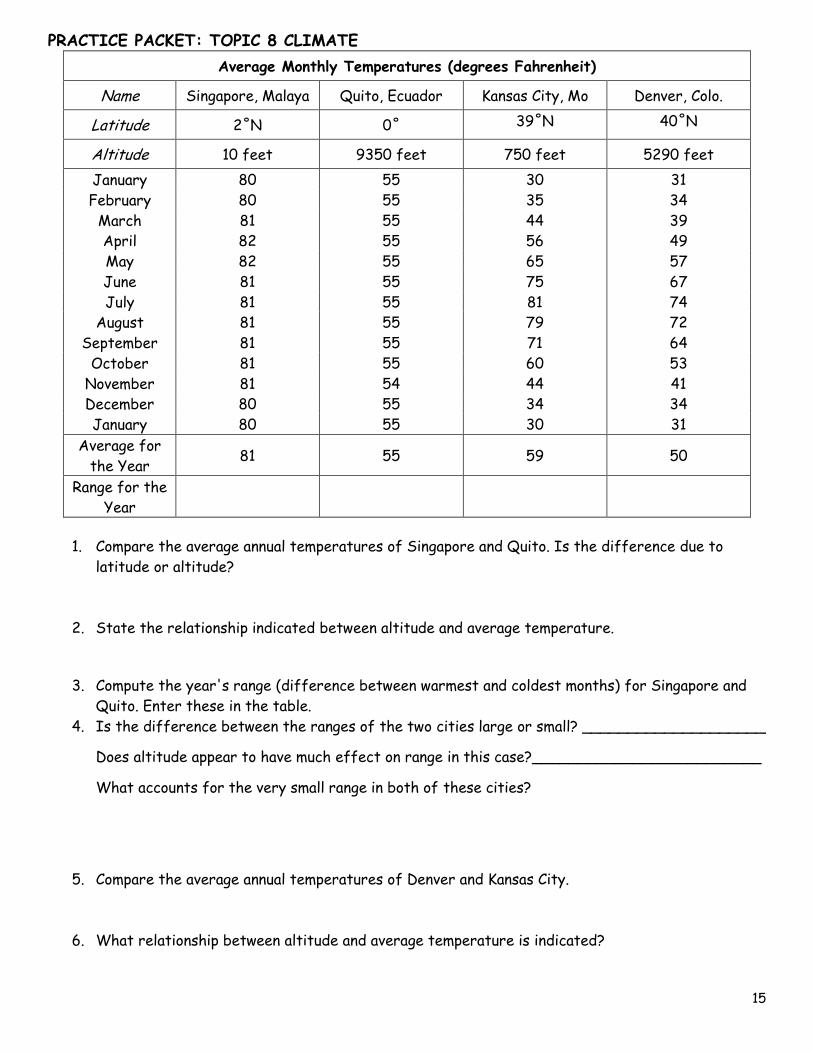
Average Monthly Temperatures (degrees Fahrenheit)
Name Singapore, Malaya Quito, Ecuador Kansas City, Mo Denver, Colo.
Latitude 2˚N 0˚ 39˚N 40˚N
Altitude 10 feet 9350 feet 750 feet 5290 feet
January 80 55 30 31
February 80 55 35 34
March 81 55 44 39
April 82 55 56 49
May 82 55 65 57
June 81 55 75 67
July 81 55 81 74
August 81 55 79 72
September 81 55 71 64
October 81 55 60 53
November 81 54 44 41
December 80 55 34 34
January 80 55 30 31
Average for
the Year 81 55 59 50
Range for the
Year
1. Compare the average annual temperatures of Singapore and Quito. Is the difference due to
latitude or altitude?
2. State the relationship indicated between altitude and average temperature.
3. Compute the year's range (difference between warmest and coldest months) for Singapore and
Quito. Enter these in the table.
4. Is the difference between the ranges of the two cities large or small? ____________________
Does altitude appear to have much effect on range in this case?_________________________
What accounts for the very small range in both of these cities?
5. Compare the average annual temperatures of Denver and Kansas City.
6. What relationship between altitude and average temperature is indicated?

PRACTICE PACKET: TOPIC 8 CLIMATE
16
7. Compute the year's range for the two cities. And enter this information on the data table.
8. Is the difference between the ranges of the two cities large or small? ____________________
Does altitude appear to have much effect on range in this case?_________________________
What accounts for the very small range in both of these cities?
9. In which season are the temperatures of Denver and Kansas City almost identical (for three
months)? Name the months.
Mountains & Rainfall: Seattle, Washington and Spokane, Washington are in almost exactly the same
latitude-about 48° North, in the prevailing southwesterly wind
belt. Seattle, nearer the Pacific, is about 200 miles west of
Spokane, and separated from it by the north-south running
Cascade Mountains. Seattle is on the western or windward side
of the mountain range. Spokane is on the eastern or leeward
side.
Average Monthly Rainfall (inches)
Name Seattle, Washington Spokkane, Washington
Location 48˚N, 122 ˚W 48 ˚N, 118 ˚W
January 4.5 1.7
February 3.7 15
March 3.1 1.3
April 1.9 1.0
May 1.6 1.0
June 1.2 1.2
July 0.5 0.4
August 0.9 0.5
September 1.6 0.9
October 3.1 1.3
November 4.5 1.9
December 5.3 2.2
Total for the Year
Procedure: On the blank graphs provided for this exercise, plot the rainfall of both Seattle and
Spokane as bar graphs. Estimate tenths of inches of rain as closely as possible. Each box represents 0.5
of an inch of rain. The rainfall for January has been plotted for you as a sample on Seattle, Washington.

PRACTICE PACKET: TOPIC 8 CLIMATE
17
1. Using the table, add up the monthly rainfall to find the total rainfall for the year: For Spokane &
for Seattle. Enter the total on both the table and the graph.
2. Which side of the mountain, windward or leeward, receives greater rainfall? _______________
3. Why should more rain fall on the windward side of a mountain than on the leeward side'?
4. Which six months are rainiest in Seattle? What seasons do these include?
5. Why are these seasons rainier than the other two? (Compare temperatures of land and sea.)
6. What factor, other than the Cascade Mountains, might be cited to explain why Snokane
gets less rain than Seattle?
PRACTICE PACKET: TOPIC 8 CLIMATE
18
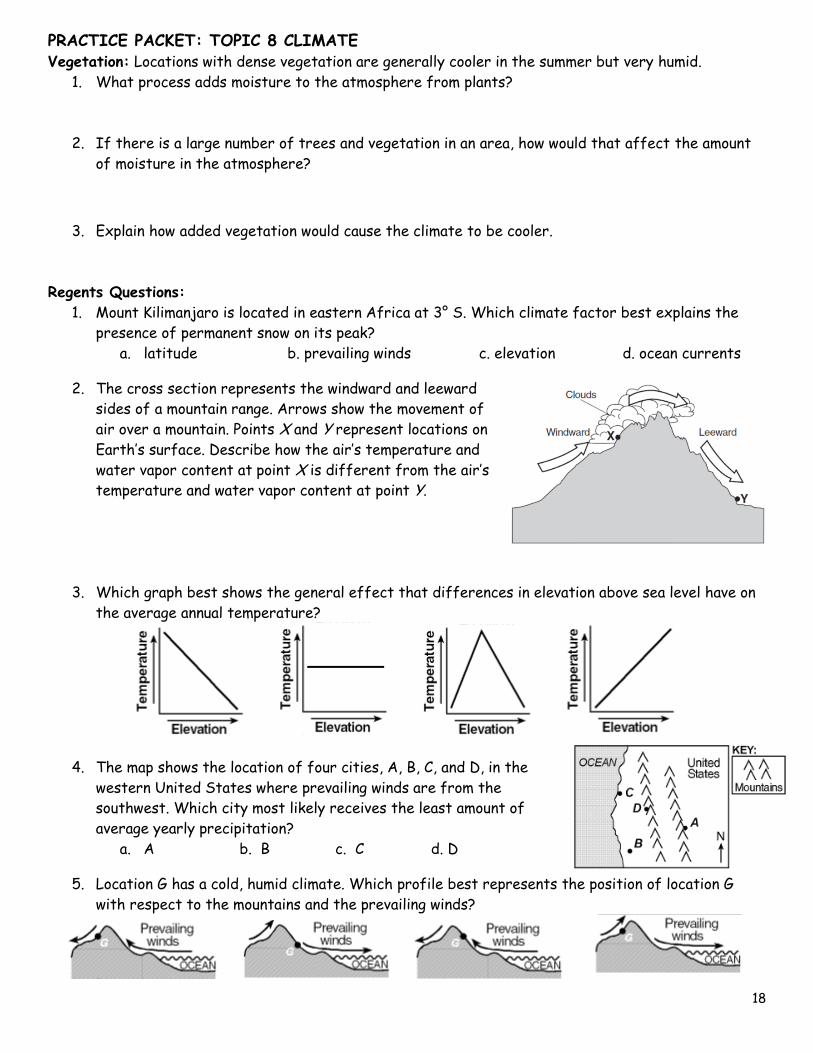
Vegetation: Locations with dense vegetation are generally cooler in the summer but very humid.
1. What process adds moisture to the atmosphere from plants?
2. If there is a large number of trees and vegetation in an area, how would that affect the amount
of moisture in the atmosphere?
3. Explain how added vegetation would cause the climate to be cooler.
Regents Questions:
1. Mount Kilimanjaro is located in eastern Africa at 3° S. Which climate factor best explains the
presence of permanent snow on its peak?
a. latitude b. prevailing winds c. elevation d. ocean currents
2. The cross section represents the windward and leeward
sides of a mountain range. Arrows show the movement of
air over a mountain. Points X and Y represent locations on
Earth’s surface. Describe how the air’s temperature and
water vapor content at point X is different from the air’s
temperature and water vapor content at point Y.
3. Which graph best shows the general effect that differences in elevation above sea level have on
the average annual temperature?
4. The map shows the location of four cities, A, B, C, and D, in the
western United States where prevailing winds are from the
southwest. Which city most likely receives the least amount of
average yearly precipitation?
a. A b. B c. C d. D
5. Location G has a cold, humid climate. Which profile best represents the position of location G
with respect to the mountains and the prevailing winds?

PRACTICE PACKET: TOPIC 8 CLIMATE
19
The map shows an imaginary continent on Earth. Arrows represent prevailing wind directions. Letters A
through D represent locations on the continent. Locations A and B are at the same latitude and at the
same elevation at the base of the mountains.
6. Over the course of a year, compared to location B,
location A will have
a. less precipitation and a greater temperature range
b. less precipitation and a smaller temperature range
c. more precipitation and a smaller temperature range
d. more precipitation and a greater temperature range
7. Compared to the observations made at location D, the observed altitude of Polaris at location B is
a. only greater from March 21 to September 22 c. always less
b. only less from March 21 to September 22 d. always greater
8. The climate at location C is much drier than at location D. This difference is best explained by
the fact that location C is located
a. at a latitude that experiences longer average annual daylight
b. at a latitude where air is sinking and surface winds diverge
c. farther from any mountain range
d. closer to a large body of water
1. In the diagram of a mountain below, location A and location
B have the same elevation. Compared to the climate at
location A, the climate at location B will be
a. warmer and drier c. cooler and drier
b. warmer and wetter d. cooler and wetter
2. Which climate condition generally results from both an increase in distance from the equator and
an increase in elevation above sea level?
a. cooler temperatures c. warmer prevailing winds
b. increased precipitation d. increased air pressure
3. Mt. Kilimanjaro, a volcano in Africa, located near the equator. Which climate factor is responsible
for the snow seen on top Mt. Kilimanjaro?
a. high latitude c. high elevation
b. nearness to a cold ocean current d. nearness to a high-pressure weather center
ASSESS YOURSELF ON THIS LESSON: _________/8
If you missed more than 5, do the Additional Practice. If not, go on to the next hw video!!!
PRACTICE PACKET: TOPIC 8 CLIMATE
20
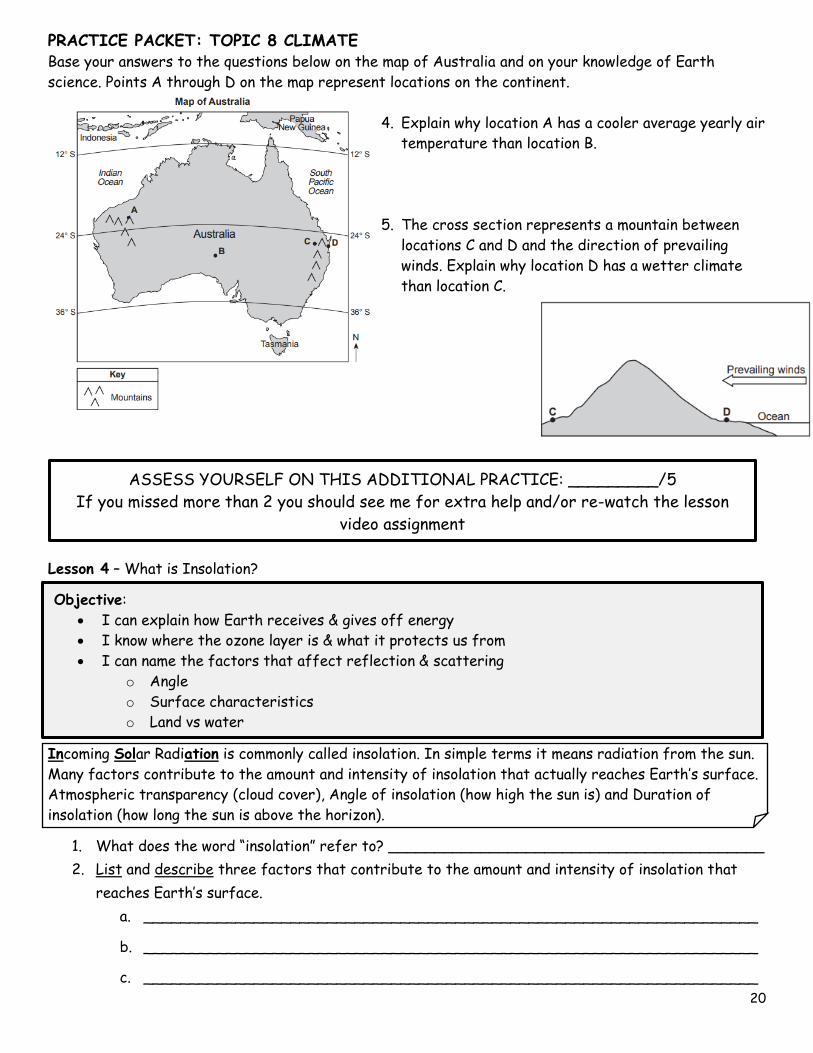
Base your answers to the questions below on the map of Australia and on your knowledge of Earth
science. Points A through D on the map represent locations on the continent.
4. Explain why location A has a cooler average yearly air
temperature than location B.
5. The cross section represents a mountain between
locations C and D and the direction of prevailing
winds. Explain why location D has a wetter climate
than location C.
Lesson 4 – What is Insolation?
Incoming Solar Radiation is commonly called insolation. In simple terms it means radiation from the sun.
Many factors contribute to the amount and intensity of insolation that actually reaches Earth’s surface.
Atmospheric transparency (cloud cover), Angle of insolation (how high the sun is) and Duration of
insolation (how long the sun is above the horizon).
1. What does the word “insolation” refer to? _________________________________________
2. List and describe three factors that contribute to the amount and intensity of insolation that
reaches Earth’s surface.
a. ___________________________________________________________________
b. ___________________________________________________________________
c. ___________________________________________________________________
ASSESS YOURSELF ON THIS ADDITIONAL PRACTICE: _________/5
If you missed more than 2 you should see me for extra help and/or re-watch the lesson
video assignment
Objective:
I can explain how Earth receives & gives off energy
I know where the ozone layer is & what it protects us from
I can name the factors that affect reflection & scattering
o Angle
o Surface characteristics
o Land vs water
PRACTICE PACKET: TOPIC 8 CLIMATE
21
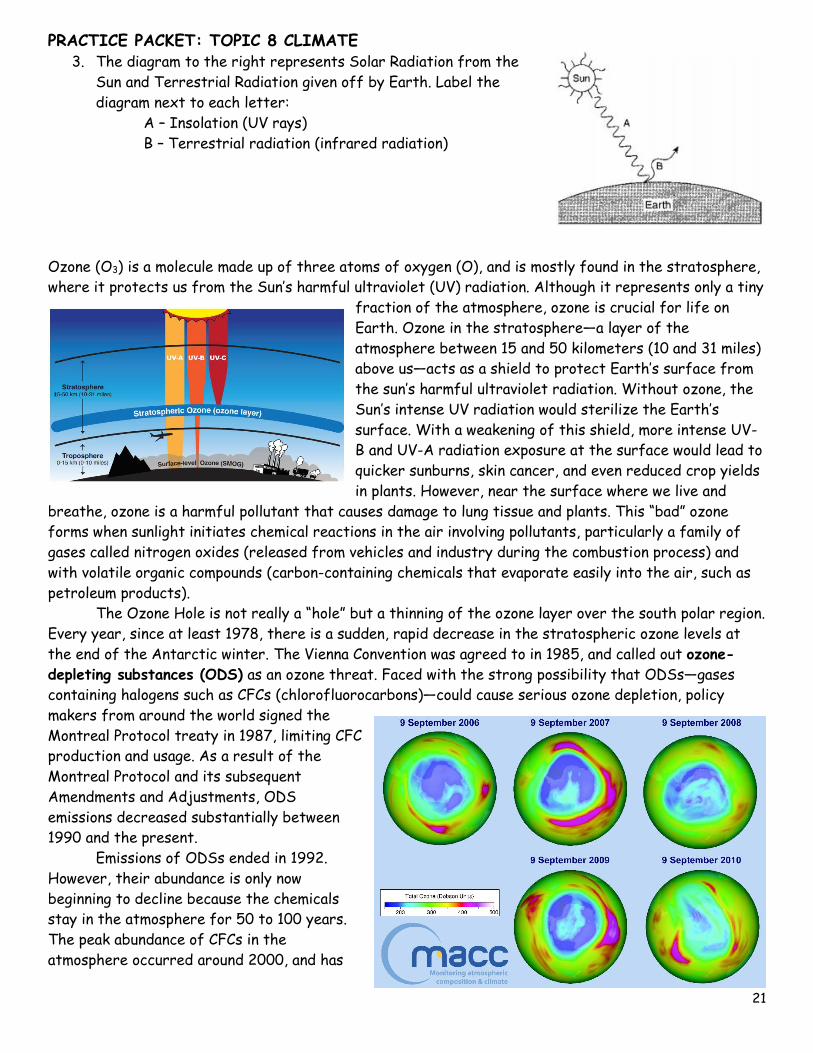
3. The diagram to the right represents Solar Radiation from the
Sun and Terrestrial Radiation given off by Earth. Label the
diagram next to each letter:
A – Insolation (UV rays)
B – Terrestrial radiation (infrared radiation)
Ozone (O3) is a molecule made up of three atoms of oxygen (O), and is mostly found in the stratosphere,
where it protects us from the Sun’s harmful ultraviolet (UV) radiation. Although it represents only a tiny
fraction of the atmosphere, ozone is crucial for life on
Earth. Ozone in the stratosphere—a layer of the
atmosphere between 15 and 50 kilometers (10 and 31 miles)
above us—acts as a shield to protect Earth’s surface from
the sun’s harmful ultraviolet radiation. Without ozone, the
Sun’s intense UV radiation would sterilize the Earth’s
surface. With a weakening of this shield, more intense UV-
B and UV-A radiation exposure at the surface would lead to
quicker sunburns, skin cancer, and even reduced crop yields
in plants. However, near the surface where we live and
breathe, ozone is a harmful pollutant that causes damage to lung tissue and plants. This “bad” ozone
forms when sunlight initiates chemical reactions in the air involving pollutants, particularly a family of
gases called nitrogen oxides (released from vehicles and industry during the combustion process) and
with volatile organic compounds (carbon-containing chemicals that evaporate easily into the air, such as
petroleum products).
The Ozone Hole is not really a “hole” but a thinning of the ozone layer over the south polar region.
Every year, since at least 1978, there is a sudden, rapid decrease in the stratospheric ozone levels at
the end of the Antarctic winter. The Vienna Convention was agreed to in 1985, and called out ozone-
depleting substances (ODS) as an ozone threat. Faced with the strong possibility that ODSs—gases
containing halogens such as CFCs (chlorofluorocarbons)—could cause serious ozone depletion, policy
makers from around the world signed the
Montreal Protocol treaty in 1987, limiting CFC
production and usage. As a result of the
Montreal Protocol and its subsequent
Amendments and Adjustments, ODS
emissions decreased substantially between
1990 and the present.
Emissions of ODSs ended in 1992.
However, their abundance is only now
beginning to decline because the chemicals
stay in the atmosphere for 50 to 100 years.
The peak abundance of CFCs in the
atmosphere occurred around 2000, and has

PRACTICE PACKET: TOPIC 8 CLIMATE
22
decreased by roughly 4 percent to date. Stratospheric ozone was depleted by 5 to 6 percent at middle
latitudes, but has rebounded a little in recent years. The largest recorded Antarctic ozone hole was
recorded in 2006, with slightly smaller holes since then. The “Real World” simulation predicts the
recovery of the ozone layer to above 300 DU by the 2050-2060 time frame.
1. What is Ozone? ____________________________________________________________
2. Where is Ozone found? _______________________________________________________
3. What does it protect us from? _________________________________________________
4. What would a weakening of this shield lead to? _____________________________________
_________________________________________________________________________
5. Where does “bad” ozone come from? _____________________________________________
6. What does “bad” ozone cause? _________________________________________________
7. What is the ozone hole? ______________________________________________________
8. What does ODS stand for? ____________________________________________________
9. What does CFC’s stand for? ___________________________________________________
10. What did the Montreal Protocol treaty do? ________________________________________
11. Why is the abundance of ODSs just starting to decline? ______________________________
12. When was the peak abundance of CFCs? __________________________________________
13. When was the largest recorded Antarctic ozone hole? ________________________________
14. When does the “Read World” simulation predict the recovery of the ozone layer? ____________

PRACTICE PACKET: TOPIC 8 CLIMATE
23
NASA’s fleet of Earth observing satellites produce 1500 Terabytes of data each year, enough to fill
3000 laptops, each with a 500 GB hard drive. To help interpret this wealth of data, scientists rely on
techniques to visualize information such as mapping data values to colors. Create your own color map
using data from Aura’s OMI instrument of total ozone from October 2012.
1. The ozone layer protects life on Earth by absorbing harmful ultraviolet radiation. The ozone layer
is located between 17 kilometers and 35 kilometers above Earth’s surface in which atmospheric
temperature zone?
a. troposphere b. stratosphere c. mesosphere d. thermosphere
2. Scientists are concerned about the decrease in ozone in the upper atmosphere primarily because
ozone protects life on Earth by absorbing certain wavelengths of
a. x-ray radiation c. ultraviolet radiation
b. infrared radiation d. microwave radiation

PRACTICE PACKET: TOPIC 8 CLIMATE
24
3. Most of the electromagnetic energy radiated from Earth's surface is in the form of
a. ultraviolet rays b. infrared rays c. gamma rays d. x rays
4. Equal areas of which surface would absorb the greatest amount of insolation on a sunny day?
a. light-colored, smooth surface c. light-colored, rough surface
b. dark-colored, smooth surface d. dark-colored, rough surface
Base your answers to questions 5 through 7 on the data table
below and on your knowledge of Earth science. The data table
shows the average percentage of insolation from 2006 to 2012
that was reflected during the summer months by the ice sheet
that covers a large portion of Greenland.
5. On the grid, construct a line graph by plotting the average
insolation reflected during the summer by the Greenland ice
sheet from 2006 to 2012. Connect all seven plots with a line.
6. Describe the general trend for the average insolation reflected by the Greenland ice sheet from
2006 to 2012 and state what can be inferred about the change in size of the Greenland ice sheet
during this time period.
Insolation-reflected trend: ____________________________________________________
_________________________________________________________________________
Inferred change in size: ______________________________________________________
_________________________________________________________________________
7. Describe one characteristic of the ice sheet that makes it a good reflector of insolation.
8. Which gas absorbs some of the harmful insolation in Earth’s upper atmosphere before that
insolation reaches Earth’s surface?
a. nitrogen b. oxygen c. ozone d. hydrogen

PRACTICE PACKET: TOPIC 8 CLIMATE
25
9. The diagram below represents Earth and the Sun’s incoming rays. Letters
A, B, C, and D represent locations on Earth’s surface. Which two locations
are receiving the same intensity of insolation?
a. A and B c. C and D
b. B and C d. D and B
10. Equal areas of which type of surface will reflect the most insolation?
a. light gray rooftop c. snow-covered field
b. dark tropical forest d. black paved road
1. A solar water heater contains fluid-filled tubing that absorbs sunlight energy on its outside
surface. Which tubing exterior will best absorb insolation?
a. dark-colored and rough c. dark-colored and smooth
b. light-colored and rough d. light-colored and smooth
2. The ozone layer protects life on Earth by absorbing harmful ultraviolet radiation. The ozone layer
is located between 17 kilometers and 35 kilometers above Earth’s surface in which atmospheric
temperature zone?
a. troposphere b. mesosphere c. stratosphere d. thermosphere
3. At what approximate altitude in the atmosphere can stratospheric ozone be found?
a. 10 km b. 70 km c. 30 km d. 100 km
Base your answers to questions 4 through 6 on the passage below and on your knowledge of Earth
science.
Ozone in Earth’s Atmosphere
Ozone is a special form of oxygen. Unlike the oxygen we breathe, which is composed of two atoms of
oxygen, ozone is composed of three atoms of oxygen. A concentrated ozone layer between 10 and 30
miles above Earth’s surface absorbs some of the harmful ultraviolet radiation coming from the Sun. The
amount of ultraviolet light reaching Earth’s surface is directly related to the angle of incoming solar
radiation. The greater the Sun’s angle of insolation, the greater the amount of ultraviolet light that
reaches Earth’s surface. If the ozone layer were completely destroyed, the ultraviolet light reaching
Earth’s surface would most likely increase human health problems, such as skin cancer and eye damage.
4. State the name of the temperature zone of Earth’s atmosphere where the concentrated layer of
ozone gas exists.
5. Explain how the concentrated ozone layer above Earth’s surface is beneficial to humans.
ASSESS YOURSELF ON THIS LESSON: _________/10
If you missed more than 3, do the Additional Practice. If not, go on to the next hw video!!!
ASSESS YOURSELF ON THIS ADDITIONAL PRACTICE: _________/5
If you missed more than 2 you should see me for extra help and/or re-watch the
lesson video assignment
PRACTICE PACKET: TOPIC 8 CLIMATE
26
Lesson 5 – Factors affecting Insolation
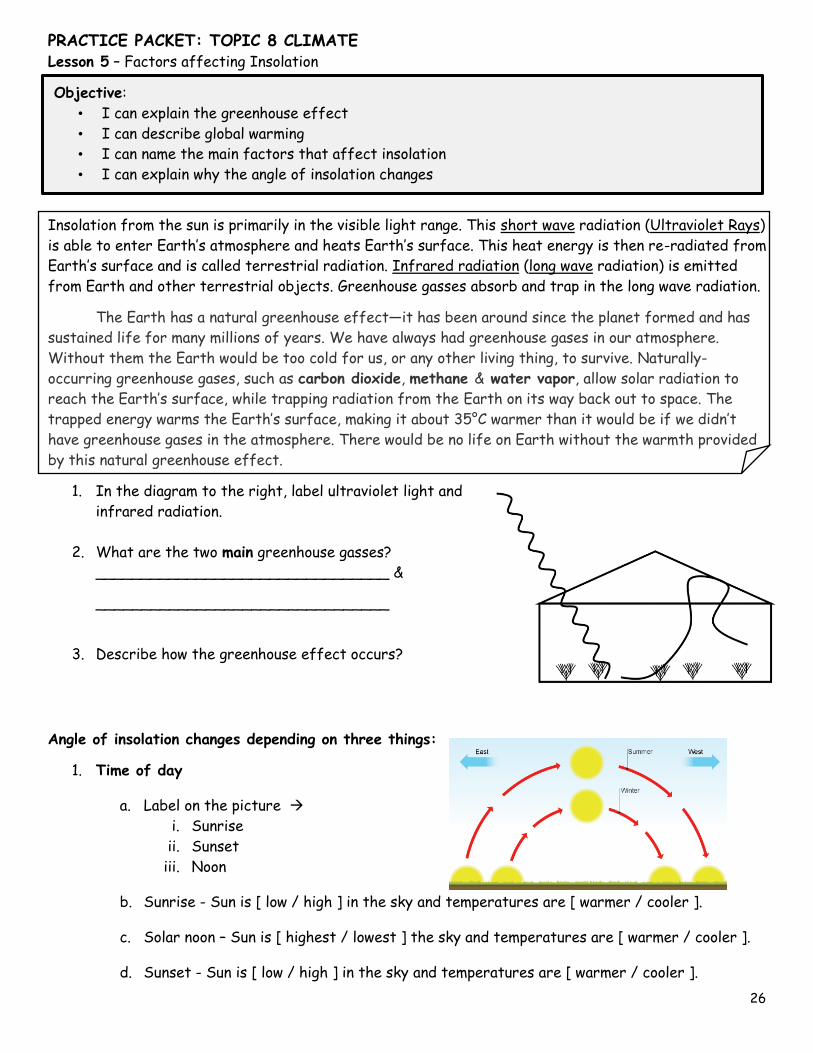
Insolation from the sun is primarily in the visible light range. This short wave radiation (Ultraviolet Rays)
is able to enter Earth’s atmosphere and heats Earth’s surface. This heat energy is then re-radiated from
Earth’s surface and is called terrestrial radiation. Infrared radiation (long wave radiation) is emitted
from Earth and other terrestrial objects. Greenhouse gasses absorb and trap in the long wave radiation.
The Earth has a natural greenhouse effect—it has been around since the planet formed and has
sustained life for many millions of years. We have always had greenhouse gases in our atmosphere.
Without them the Earth would be too cold for us, or any other living thing, to survive. Naturally-
occurring greenhouse gases, such as carbon dioxide, methane & water vapor, allow solar radiation to
reach the Earth’s surface, while trapping radiation from the Earth on its way back out to space. The
trapped energy warms the Earth’s surface, making it about 35°C warmer than it would be if we didn’t
have greenhouse gases in the atmosphere. There would be no life on Earth without the warmth provided
by this natural greenhouse effect.
1. In the diagram to the right, label ultraviolet light and
infrared radiation.
2. What are the two main greenhouse gasses?
________________________________ &
________________________________
3. Describe how the greenhouse effect occurs?
Angle of insolation changes depending on three things:
1. Time of day
a. Label on the picture
i. Sunrise
ii. Sunset
iii. Noon
b. Sunrise - Sun is [ low / high ] in the sky and temperatures are [ warmer / cooler ].
c. Solar noon – Sun is [ highest / lowest ] the sky and temperatures are [ warmer / cooler ].
d. Sunset - Sun is [ low / high ] in the sky and temperatures are [ warmer / cooler ].
Objective:
• I can explain the greenhouse effect
• I can describe global warming
• I can name the main factors that affect insolation
• I can explain why the angle of insolation changes

PRACTICE PACKET: TOPIC 8 CLIMATE
27
2. Latitude – refer to the diagram to the right
a. Which location (name and degree latitude) is the sun’s rays
directly overhead (highest angle of insolation)
____________________________________, _________˚
b. Which location would have the highest temperatures?
c. Which two locations (name and degree latitude) are the sun’s
rays at the lowest angle of insolation. ___________________________________,
__________˚ & ____________________________________, __________˚
d. What is true about the temperatures at the two locations in question “c”? (warm / cold)
e. Write the relationship between angle of insolation and the rate of heating.
f. Draw the relationship between latitude and the angle of insolation on the
graph to the right. Remember to label the axis.
3. Season
a. Label the seasons (summer and spring) next to
the dates given in the diagram to the right.
b. Determine the month for the sun labeled “A” on
the diagram.
c. What season is “A”? _________________
d. Which season is the sun highest in the sky?
e. Which season has the warmest temperatures?
f. Which season is the sun lowest in the sky? ___________________________________
g. Which season has the coldest temperatures? _________________________________
Regents Questions:
1. Evidence supports the idea that increases in carbon dioxide and methane in Earth’s atmosphere
are major contributors to global warming. This is based primarily on the fact that carbon dioxide
and methane are excellent absorbers of
a. gamma rays b. visible light c. microwaves d. infrared radiation

PRACTICE PACKET: TOPIC 8 CLIMATE
28
Base your answers to questions 2 through 4 on the map and passage below and on your knowledge of
Earth science. The map shows isolines that represent the thickness of a portion of the Greenland Ice
Sheet in meters (m). Letters A and B represent points on the ice sheet’s surface.
Greenland Ice Sheet
The Greenland Ice Sheet is a vast body of ice covering roughly 80 percent of the surface of Greenland.
The ice sheet is almost 2400 kilometers long in a north-south direction. The ice sheet, consisting of
layers of snow compressed over more than 100,000 years, contains a valuable record about Earth’s past
climates. The ice sheet glaciers continue to flow seaward and deposit sediment, but global warming has
affected them. Warmer air temperatures have caused increased melting, resulting in a thinning of the
ice sheet and faster glacial movement at the ice sheet edges.
2. On the grid, construct a profile along line AB by plotting the thickness of the ice sheet where
each isoline crosses line AB. Thicknesses of the ice sheet at A and B have been plotted on the
grid. Connect all twelve plots with a line from A to B to complete the profile.
3. Describe one glacial feature that could be found on the exposed surface bedrock of Greenland
that would indicate the direction that the ice moved.
4. Identify two major greenhouse gases that are inferred to contribute to global warming and
increased temperatures in Greenland.
5. Which two gases in Earth’s atmosphere are believed by scientists to be greenhouse gases that
are major contributors to global warming?
a. carbon dioxide and methane c. oxygen and nitrogen
b. hydrogen and helium d. ozone and chlorine
6. A gradual increase in atmospheric carbon dioxide would warm Earth’s atmosphere because carbon
dioxide is a
a. poor reflector of ultraviolet radiation c. good reflector of ultraviolet radiation
b. poor absorber of infrared radiation d. good absorber of infrared radiation

PRACTICE PACKET: TOPIC 8 CLIMATE
29
7. The diagram to the right shows a greenhouse. What is the primary
function of the clear glass of the greenhouse?
a. The glass reduces the amount of insolation entering the
greenhouse.
b. The glass allows all wavelengths of radiation to
enter and all wavelengths of radiation to escape.
c. The glass allows short wavelengths of radiation to enter, but
reduces the amount of long wavelength radiation that
escapes.
d. The glass allows long wavelengths of radiation to
enter, but reduces the amount of short wavelength radiation
that escapes.
8. Most scientists infer that increasing levels of carbon dioxide in Earth’s atmosphere are
contributing to
a. decreased thickness of the troposphere c. depletion of ozone
b. increased absorption of ultraviolet radiation d. increased global temperatures
9. Which two gases in Earth’s atmosphere are believed by scientists to be greenhouse gases that
are major contributors to global warming?
a. carbon dioxide and methane c. oxygen and nitrogen
b. hydrogen and helium d. ozone and chlorine
Base your answers to questions 10 and 11 on the map below and on your knowledge of Earth science. The
map shows part of the North American coastline. The present coastline is shown as a solid line. The
symbols on the key below indicate the inferred coastline 18,000
years ago and an inferred future coastline if global warming
continues.
10. Which statement best explains why 18,000 years ago the
coastline was at a different location than it is today?
a. The climate of Earth was extremely hot and dry.
b. A large amount of Earth’s water was stored in large
continental ice sheets.
c. The east coast of North America was being
subducted under the Eurasian Plate.
d. North America had just separated from Africa, and
the Atlantic Ocean was forming.
11. The inferred position of the future coastline is based on the
assumption that the
a. total amount of global precipitation will decrease
b. thickness of the ozone layer will decrease
c. concentration of carbon dioxide in Earth’s atmosphere will increase
d. rate of uplift of the North American continent will increase
PRACTICE PACKET: TOPIC 8 CLIMATE
30
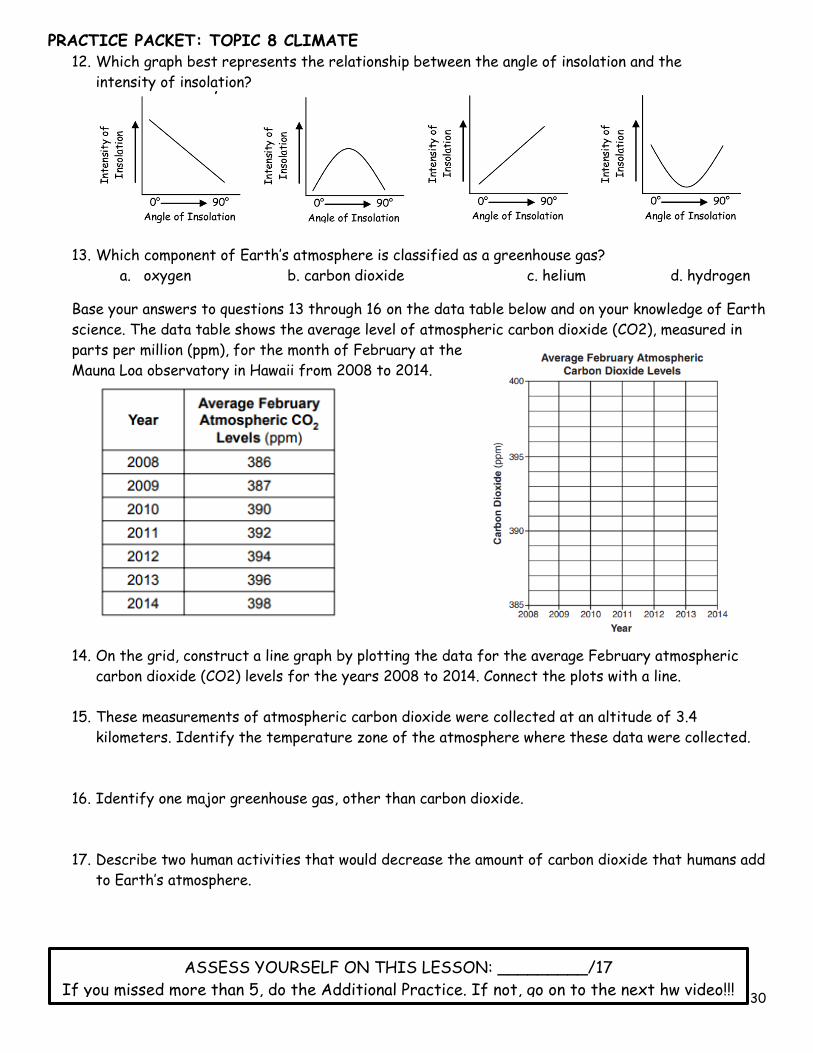
12. Which graph best represents the relationship between the angle of insolation and the
intensity of insolation?
13. Which component of Earth’s atmosphere is classified as a greenhouse gas?
a. oxygen b. carbon dioxide c. helium d. hydrogen
Base your answers to questions 13 through 16 on the data table below and on your knowledge of Earth
science. The data table shows the average level of atmospheric carbon dioxide (CO2), measured in
parts per million (ppm), for the month of February at the
Mauna Loa observatory in Hawaii from 2008 to 2014.
14. On the grid, construct a line graph by plotting the data for the average February atmospheric
carbon dioxide (CO2) levels for the years 2008 to 2014. Connect the plots with a line.
15. These measurements of atmospheric carbon dioxide were collected at an altitude of 3.4
kilometers. Identify the temperature zone of the atmosphere where these data were collected.
16. Identify one major greenhouse gas, other than carbon dioxide.
17. Describe two human activities that would decrease the amount of carbon dioxide that humans add
to Earth’s atmosphere.
ASSESS YOURSELF ON THIS LESSON: _________/17
If you missed more than 5, do the Additional Practice. If not, go on to the next hw video!!!
PRACTICE PACKET: TOPIC 8 CLIMATE
31
1. An increase in which gas would cause the most greenhouse warming of Earth’s atmosphere?
a. nitrogen b. carbon dioxide c. oxygen d. hydrogen
2. The average temperature at Earth’s North Pole is colder than the average temperature at
the Equator because the Equator
a. receives less ultraviolet radiation c. receives more intense insolation
b. has more cloud cover d. has a thicker atmosphere
3. The graph to the right shows air temperatures on a clear
summer day from 7 a.m. to 12 noon at two locations, one in
Florida and one in New York State. Air temperature rose slightly
faster in Florida than in New York State because Florida
a. has a lower angle of insolation
b. has a higher angle of insolation
c. is closer to the Prime Meridian
d. is farther from the Prime Meridian
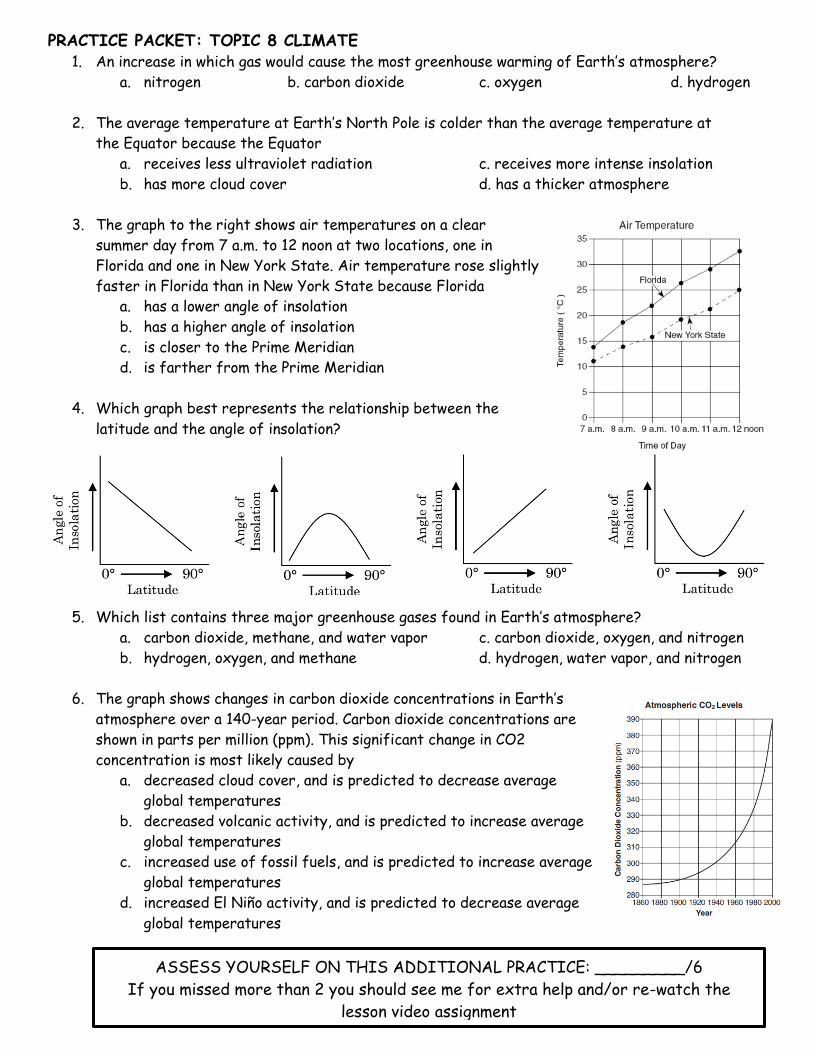
4. Which graph best represents the relationship between the
latitude and the angle of insolation?
5. Which list contains three major greenhouse gases found in Earth’s atmosphere?
a. carbon dioxide, methane, and water vapor c. carbon dioxide, oxygen, and nitrogen
b. hydrogen, oxygen, and methane d. hydrogen, water vapor, and nitrogen
6. The graph shows changes in carbon dioxide concentrations in Earth’s
atmosphere over a 140-year period. Carbon dioxide concentrations are
shown in parts per million (ppm). This significant change in CO2
concentration is most likely caused by
a. decreased cloud cover, and is predicted to decrease average
global temperatures
b. decreased volcanic activity, and is predicted to increase average
global temperatures
c. increased use of fossil fuels, and is predicted to increase average
global temperatures
d. increased El Niño activity, and is predicted to decrease average
global temperatures
ASSESS YOURSELF ON THIS ADDITIONAL PRACTICE: _________/6
If you missed more than 2 you should see me for extra help and/or re-watch the
lesson video assignment
PRACTICE PACKET: TOPIC 8 CLIMATE
32
Lesson 6: Factors affecting Insolation – Continued
Duration of Insolation is the length of time the sun is over the horizon.
The longer the sun is over the horizon the greater the duration of insolation. This depends on two
main factors.
1. Latitude
a. What locations on Earth is there 24 hours of darkness or sunlight for approximately 6
months of the year?
________________________, _____˚N & ________________________, _____˚S
b. Does location in question “a” have a high or low angle of insolation?
c. What are the temperatures like at the locations listed above?
d. Name the location where 12 hours of daylight every day? _________________ , _____˚
e. Does location in question “d” have a high or low angle of insolation?
f. What are the temperatures like at the location listed above?
2. Time of Year
a. In New York State, what season has the longest hours of daylight?
b. What season has the warmest temperatures in New York State?
c. In New York State, what seasons has the shortest hours of daylight?
d. What season has the coldest temperatures in New York State?
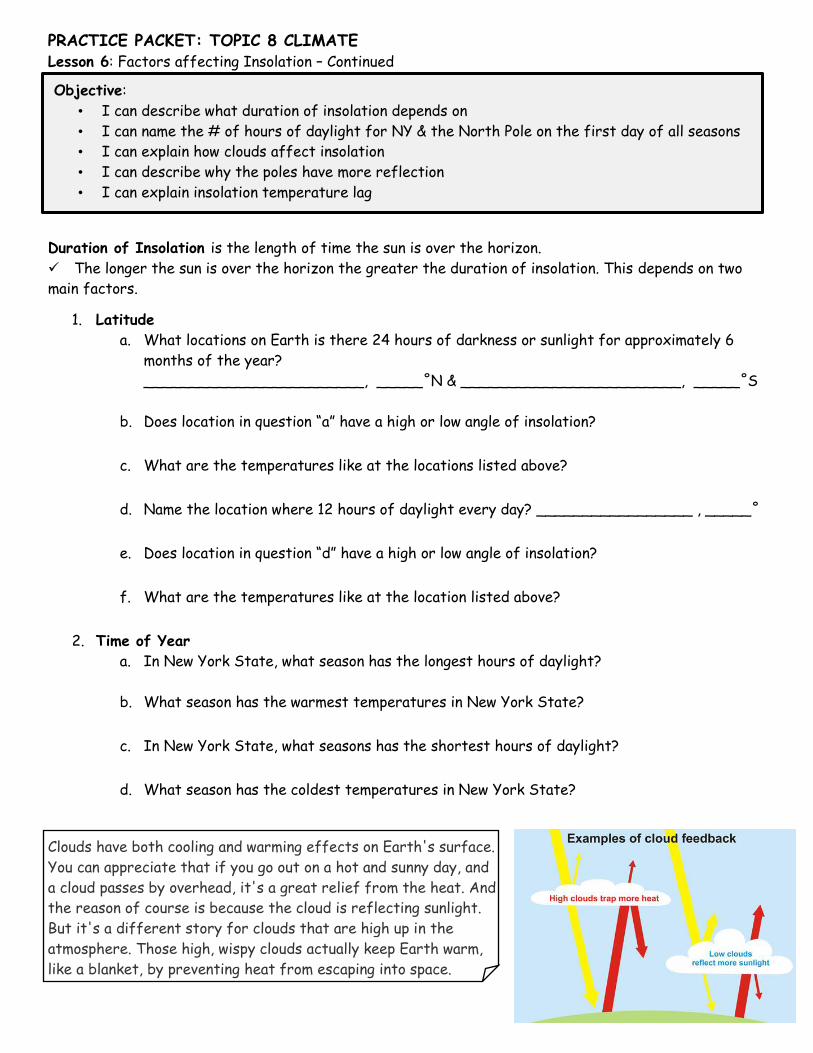
Clouds have both cooling and warming effects on Earth's surface.
You can appreciate that if you go out on a hot and sunny day, and
a cloud passes by overhead, it's a great relief from the heat. And
the reason of course is because the cloud is reflecting sunlight.
But it's a different story for clouds that are high up in the
atmosphere. Those high, wispy clouds actually keep Earth warm,
like a blanket, by preventing heat from escaping into space.
Objective:
• I can describe what duration of insolation depends on
• I can name the # of hours of daylight for NY & the North Pole on the first day of all seasons
• I can explain how clouds affect insolation
• I can describe why the poles have more reflection
• I can explain insolation temperature lag
PRACTICE PACKET: TOPIC 8 CLIMATE
33
1. Why do low clouds cool Earth’s surface?
2. Why do high clouds heat Earth’s surface?
On the summer solstice, the sun’s rays are the most direct at the Tropic of Cancer (the sun appears
directly above you, those at the Equator actually see a lower sun angle on this day). In addition, the amount
of incoming solar energy, or radiation, is the highest. However, bodies of water and the ground, have a
certain heat capacity, which is the amount of energy it takes to change the temperature of an object by
a given amount. In fact, water takes much longer to heat up than land. Since our Earth is around 71% water
our temperatures on land are highly dependent on the temperatures of the bodies of water near it.
In July, terrestrial radiation (outgoing radiation from Earth), is still reaching its peak based on the
large heat capacity of the oceans and to a lesser extent land masses. This added terrestrial radiation
allows air temperature to continue to rise even though energy from the sun is decreasing. On a daily scale,
much of the same process explains why the highest temperatures typically occur at 3 PM rather than solar
noon. Taking a look at NYC below, the seasonal lag is clearly shown in the average highs and lows.
1. Where are the sun’s rays most direct on the summer solstice? __________________________
2. What is heat capacity? _______________________________________________________
3. Why does water take longer to heat up than land? ___________________________________
4. Why is the Earth still reaching its peak temperatures in July?
5. What time of the day are temperatures usually the highest? ___________________________
Regent Questions:
1. How did the huge ash cloud that covered Alaska in 1989 affect the amount of insolation reaching
Earth’s surface and the air temperatures near Earth’s surface?
a. Insolation decreased and temperatures increased.
b. Insolation increased and temperatures decreased.
c. Both insolation and temperatures increased.
d. Both insolation and temperatures decreased.
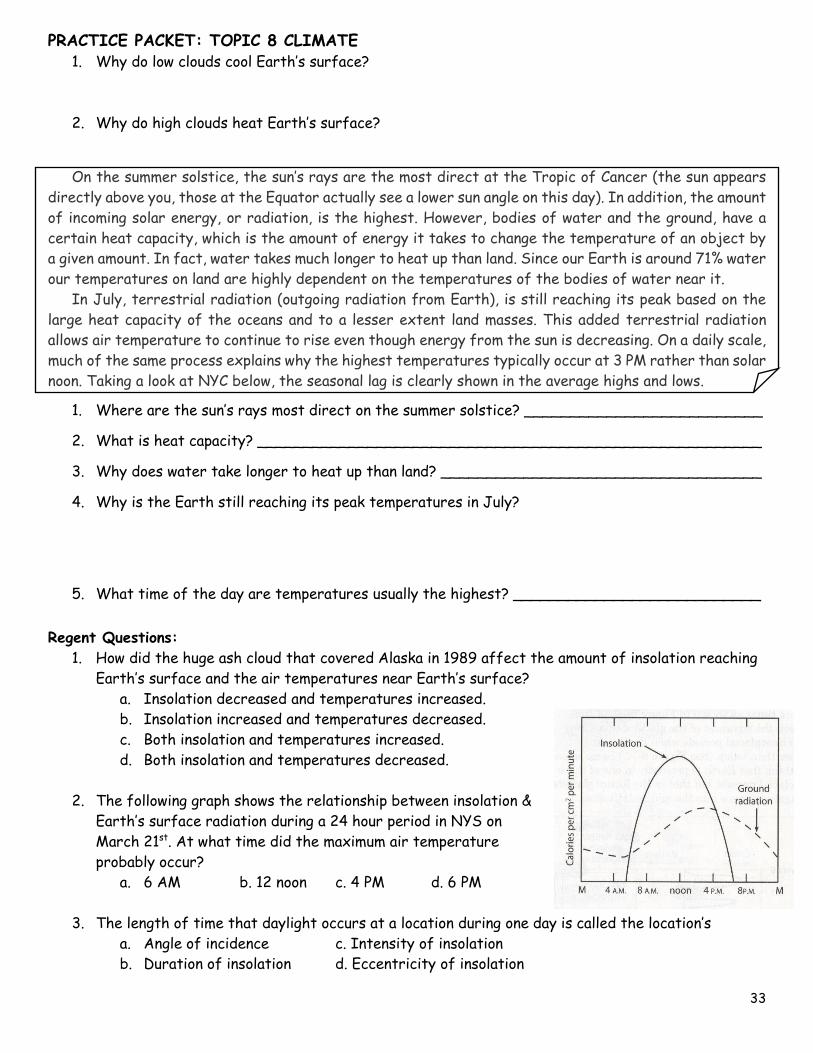
2. The following graph shows the relationship between insolation &
Earth’s surface radiation during a 24 hour period in NYS on
March 21st. At what time did the maximum air temperature
probably occur?
a. 6 AM b. 12 noon c. 4 PM d. 6 PM
3. The length of time that daylight occurs at a location during one day is called the location’s
a. Angle of incidence c. Intensity of insolation
b. Duration of insolation d. Eccentricity of insolation

PRACTICE PACKET: TOPIC 8 CLIMATE
34
4. What is the usual cause of the drop in temperature that occurs between sunset & sunrise at most
NYS locations?
a. Strong winds b. Ground radiation c. Cloud formation d. Heavy precipitation
5. When do maximum surface temperatures usually occur in the N. Hemisphere?
a. Early June to Mid-June c. Mid-July to Early August
b. Late August to Mid-September d. Mid-September to Early October
6. The seasonal temperature changes in the climate of NYS are most influenced by the changing
a. CO2 content of the air
b. Angle of incidence at which the sun’s rays strike Earth’s surface
c. Distance from the sun to Earth
d. Speed at which Earth revolves around the sun
7. Which angle of the sun above the horizon produces the greatest intensity of sunlight per unit
area?
a. 25° b. 40° c. 60° d. 70°
8. The diagram below represents Earth and the Sun’s incoming
rays. Letters A, B, C, and D represent locations on Earth’s
surface. Which location is receiving the most intensity of
insolation?
a. A b. B c. C d. D
9. The diagram represents the horizon and
the Sun’s apparent paths, A, B, and C, on three
different dates, as viewed from the same
location in New York State. Which table
correctly shows the dates on which the
apparent paths of the Sun were observed?
10. In New York State, which day has the shortest duration of insolation?
a. March 21 b. June 21 c. September 21 d. December 21
PRACTICE PACKET: TOPIC 8 CLIMATE
35
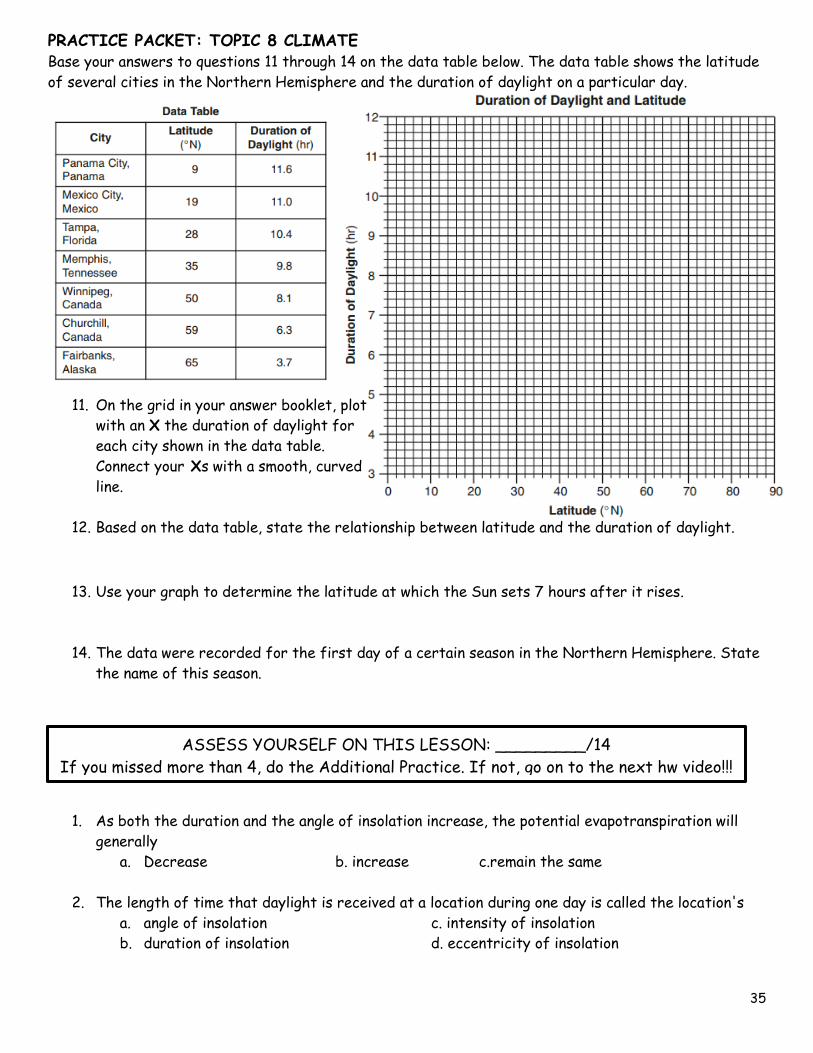
Base your answers to questions 11 through 14 on the data table below. The data table shows the latitude
of several cities in the Northern Hemisphere and the duration of daylight on a particular day.
11. On the grid in your answer booklet, plot
with an X the duration of daylight for
each city shown in the data table.
Connect your Xs with a smooth, curved
line.
12. Based on the data table, state the relationship between latitude and the duration of daylight.
13. Use your graph to determine the latitude at which the Sun sets 7 hours after it rises.
14. The data were recorded for the first day of a certain season in the Northern Hemisphere. State
the name of this season.
1. As both the duration and the angle of insolation increase, the potential evapotranspiration will
generally
a. Decrease b. increase c.remain the same
2. The length of time that daylight is received at a location during one day is called the location's
a. angle of insolation c. intensity of insolation
b. duration of insolation d. eccentricity of insolation
ASSESS YOURSELF ON THIS LESSON: _________/14
If you missed more than 4, do the Additional Practice. If not, go on to the next hw video!!!

PRACTICE PACKET: TOPIC 8 CLIMATE
36
3. Which statement best describes how the insolation changes in New York State from May 21
through June 21?
a. The intensity and the duration of insolation both decrease.
b. The intensity and the duration of insolation both increase.
c. The intensity of insolation decreases and the duration of insolation increases.
d. The intensity of insolation increases and the duration of insolation decreases.
Base your answer questions 4-8 on your knowledge of Earth science and on the graph below. The graph
shows the insolation received and the energy used by a house in New York State. There is a solar energy
collector on the roof that absorbs solar radiation and converts the energy to a form useful for heating
and cooling the home.
4. For how many months of the year is the
amount of energy absorbed by the collector
greater than the amount of energy required
by the house?
a. 12 months c. 8 months
b. 6 months d. 4 months
5. On April 15, what is the approximate
percentage of the energy collected compared
to the radiation received on the roof?
a. 26% c. 34%
b. 42% d. 60%
6. On which date was the energy budget for the
house in equilibrium?
a. January 21 c. March 1
b. June 21 d. October 1
7. Why is the amount of energy required for
cooling the house greatest in July rather than at the time of maximum radiation?
a. The intensity of insolation per unit area increases as the angle of insolation approaches
perpendicular.
b. The house is located at a high altitude.
c. Maximum duration of insolation occurs during July.
d. Maximum surface air temperature occurs sometime after maximum insolation is received.
8. If observations were made for an identical house in similar surroundings at a location 500
kilometers due north, how would the energy collected at the two locations compare over a year?
a. The house farther north would collect less energy.
b. The house farther north would collect more energy.
c. The house farther north would collect the same amount of energy.
ASSESS YOURSELF ON THIS ADDITIONAL PRACTICE: _________/8
If you missed more than 3 you should see me for extra help and/or re-watch the
lesson video assignment

PRACTICE PACKET: TOPIC 8 CLIMATE
37
Lesson 7: Seasons
The Earth's seasons are NOT caused by the differences in the distance from the Sun throughout
the year (these differences are extremely small). The seasons are the result of the tilt of the Earth's axis, revolution around the sun, & parallelism.
The Earth's axis is tilted by 23.45°. This tilting is what gives us the four seasons of the year -
spring, summer, autumn (fall) and winter. Since the axis is tilted, different parts of the globe are
oriented towards the Sun at different times of the year.
Summer is warmer than winter (in each hemisphere) because the Sun's rays hit the Earth at a
more direct angle during summer than during winter and also because the days are much longer than the
nights during the summer. During the winter, the Sun's rays hit the Earth at a smaller angle, and the
days are very short. These effects are due to the tilt of the Earth's axis.
Solstices -The solstices are days when the Sun reaches its farthest northern and southern declinations.
The winter solstice occurs on December 21 and marks the beginning of winter (this is the shortest day
of the year). The summer solstice occurs on June 21 and marks the beginning of summer (this is the
longest day of the year).
Equinoxes - Equinoxes are days in which day and night are of equal duration. The two yearly equinoxes
occur when the Sun crosses the celestial equator. The vernal equinox occurs in late March (this is the
beginning of spring in the Northern Hemisphere and the beginning of fall in the Southern Hemisphere);
the autumnal equinox occurs in late September (this is the beginning of fall in the Northern Hemisphere
and the beginning of spring in the Southern Hemisphere).
1. Is the seasons caused by the distance from the sun? _________________________
2. What three factors cause the seasons? __________________________________________
________________________________________________________________________
3. What two reasons explain why the summer temperatures are warmer? ____________________
_________________________________________________________________________
4. Label the circles below with either direct heat energy or indirect heat energy.
5. What is the date of the winter solstice? __________________________________________
6. What is the date of the summer solstice? _________________________________________
7. What season starts on the vernal equinox? ________________________________________
8. What season starts on the autumnal equinox? ______________________________________
Objective:
I can explain why we get different seasons
I can describe what would happen if the Earth’s tilt changed
I can fill out the seasons chart
PRACTICE PACKET: TOPIC 8 CLIMATE
38
The direct ray of the sun, also known as the Sun’s vertical ray, occurs when the Sun is directly
overhead at a location on Earth (at its Zenith). Due to Earth’s tilt of the axis at 23 ½˚ the direct ray of
the Sun changes as Earth revolves around the Sun. It is the movement of the direct ray that causes the
change in seasons.
The Tropic of Cancer (23 ½ ˚N) and Tropic of Capricorn (23 ½ ˚S) are the farthest locations
north or south of the equator where the Sun is ever directly overhead. The area between the two
tropics is sometimes referred to as “within the tropics”. This means the Sun is NEVER directly overhead
in the Continental United Sates and therefore NEVER directly overhead in New York State.
The Arctic circle (66 ½ ˚N) and Antarctic Circle (66 ½˚S) are the first locations north or south
of the equator that have at least one 24 hour period of daylight, while the other experiences a 24 hour
period of darkness.
1. Where in the sky is the sun when the vertical ray at that location? _______________________
2. What two factors cause the direct ray of the Sun to change its location on Earth?
_________________________________________________________________________
3. What is the tilt of Earth’s axis? ________________________________________________
4. What is the latitude of the North Pole? __________________________________________
5. Subtract the tilt of Earth’s axis from the latitude of the North Pole. ____________________
a. What is located at the degree latitude you just determined? ______________________
6. Think: What season begins in New York State when the Sun’s vertical rays are at the Tropic of
Cancer (23 ½˚N)? ___________________________________________________________
7. Think: What is true about the amount of daylight on the first day of summer in New York State?
Circle the answer: (longest amount of daylight / shortest amount of daylight / 12 hours of
daylight)
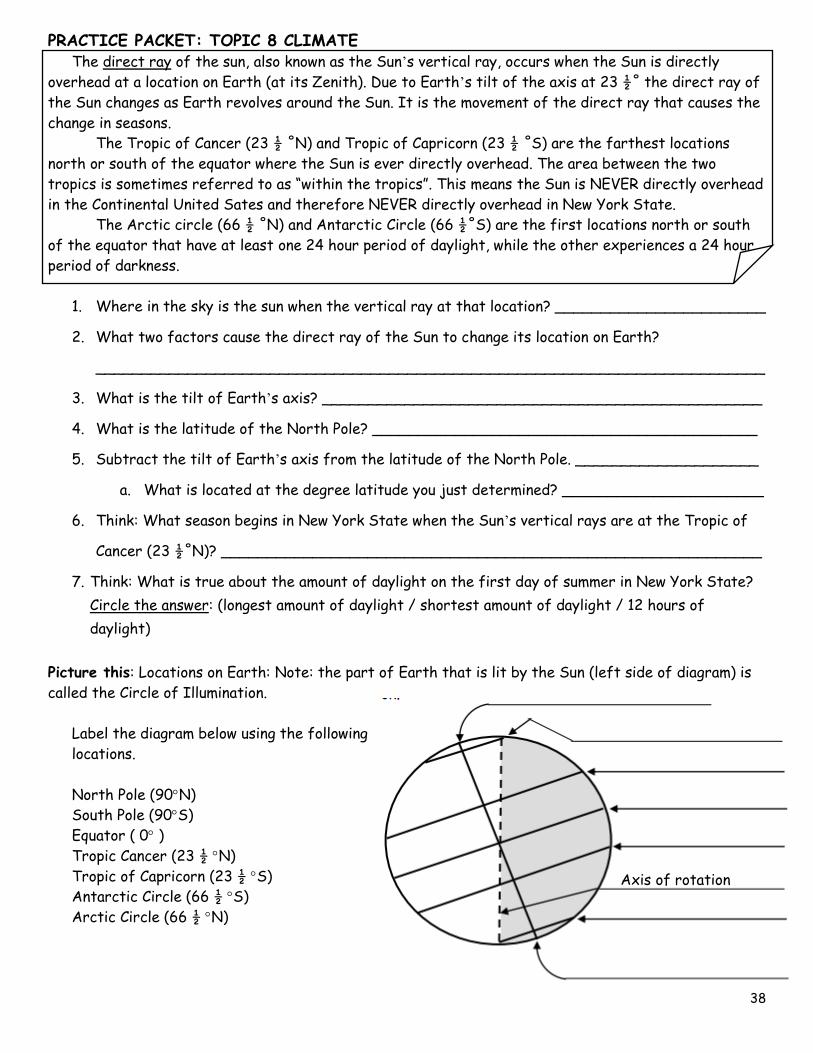
Picture this: Locations on Earth: Note: the part of Earth that is lit by the Sun (left side of diagram) is
called the Circle of Illumination.
Label the diagram below using the following
locations.
North Pole (90N)
South Pole (90S)
Equator ( 0 )
Tropic Cancer (23 ½ N)
Tropic of Capricorn (23 ½ S)
Antarctic Circle (66 ½ S)
Arctic Circle (66 ½ N)
Axis of rotation

PRACTICE PACKET: TOPIC 8 CLIMATE
39
Directions:
On each of the three diagrams (A, B, and C) of Earth, label the North Pole, South Pole, Equator,
Tropic of Cancer and Tropic of Capricorn on the lines in the Earth’s illustration NOT on the
dotted lines for the Sun’s rays.
1. At what location is the direct ray of the Sun? ______________________________________
2. Referring to the illuminated portion of Earth, are the daylight hours greater than the night north
or south of the equator? ______________________________________________________
3. What season would it be when the daylight hours are greater than the night? _______________
4. What season would it be when the night time hours are greater than daylight? ______________
5. What season is it in New York State when the direct rays of the Sun are located as shown in the
diagram above? _____________________
6. At what location is the direct ray of the Sun? ______________________________________
7. Referring to the illuminated portion of Earth, are the daylight hours greater than the night north
or south of the equator? ______________________________________________________
8. What season would it be when the daylight hours are greater than the night? _______________
9. What season would it be when the night time hours are greater than daylight? ______________
10. What season is it in New York State when the direct rays of the Sun are located as shown in the
diagram above? _____________________

PRACTICE PACKET: TOPIC 8 CLIMATE
40
11. At what location is the direct ray of the Sun? ______________________________________
12. Referring to the illuminated portion of Earth, what is true about the daylight and night time
hours? ___________________________________________________________________
13. What two seasons would it be when the daylight hours are equal to the night? ______________
_________________________________________________________________________
14. What two season is it in New York State when the direct rays of the Sun are located as shown in
the diagram above? __________________________________________________________
Label the diagram below with the underlined facts that corresponds with each season.
Looking at the diagram determine which diagram represents summer in the northern hemisphere
and label it “Summer solstice” (North Pole tilted toward the Sun).
o This occurs on June 21
o The direct ray of the Sun is at the Tropic of Cancer (23 ½˚N).
o This is the longest “day” (hours of daylight) north of the equator and any location on or
past the Arctic Circle has 24 hours of daylight.
o Approximately 15 hours of daylight in New York State (NYS)
PRACTICE PACKET: TOPIC 8 CLIMATE
41
Determine which diagram represents winter in the northern hemisphere and label it “Winter
solstice” on the line provided (South Pole tilted toward the Sun).
o This occurs on December 21
o The direct ray of the Sun is at the Tropic of Capricorn (23 ½˚S).
o This is the shortest “day” (hours of daylight) north of the equator and any location on or
past the Arctic Circle has 24 hours of night.
o Approximately 9 hours of daylight in New York State (NYS)
Follow the arrows of Earth counterclockwise to determine which is Spring and which is Autumn.
Label the “Spring equinox” and “Autumnal equinox” where the direct rays are at the equator.
o The Spring Equinox occurs on March 21
o The Autumnal Equinox occurs on September 23
o For each equinox, the direct ray of the Sun is at the Equator (0˚ latitude),
o There is 12 hours of daylight at every location on Earth (except at the poles).
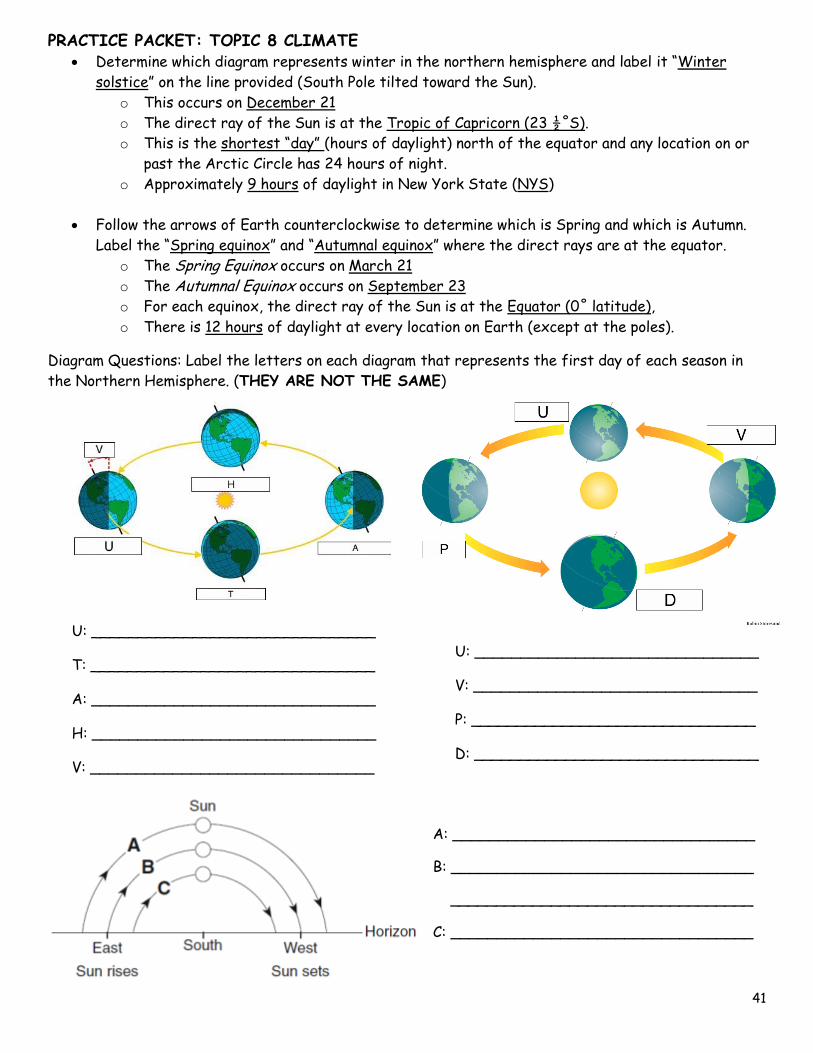
Diagram Questions: Label the letters on each diagram that represents the first day of each season in
the Northern Hemisphere. (THEY ARE NOT THE SAME)
U: _______________________________
T: _______________________________
A: _______________________________
H: _______________________________
V: _______________________________
U: _______________________________
V: _______________________________
P: _______________________________
D: _______________________________
A: _________________________________
B: _________________________________
_________________________________
C: _________________________________
PRACTICE PACKET: TOPIC 8 CLIMATE
42
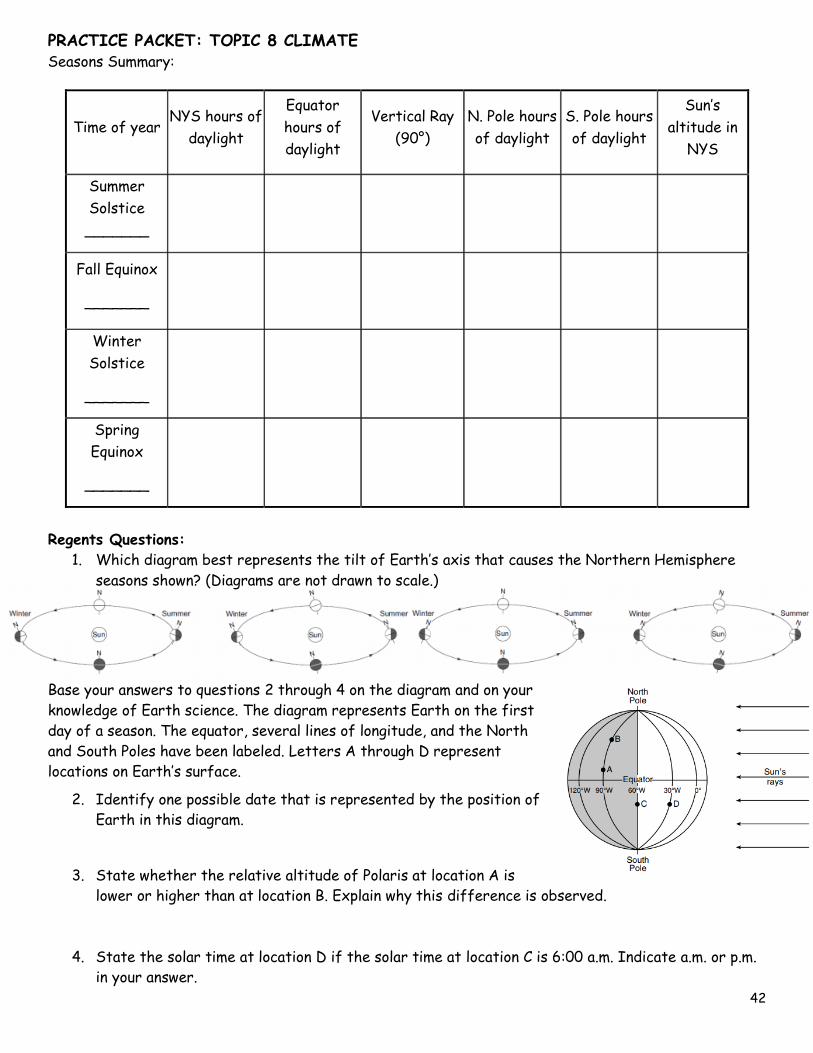
Seasons Summary:
Regents Questions:
1. Which diagram best represents the tilt of Earth’s axis that causes the Northern Hemisphere
seasons shown? (Diagrams are not drawn to scale.)
Base your answers to questions 2 through 4 on the diagram and on your
knowledge of Earth science. The diagram represents Earth on the first
day of a season. The equator, several lines of longitude, and the North
and South Poles have been labeled. Letters A through D represent
locations on Earth’s surface.
2. Identify one possible date that is represented by the position of
Earth in this diagram.
3. State whether the relative altitude of Polaris at location A is
lower or higher than at location B. Explain why this difference is observed.
4. State the solar time at location D if the solar time at location C is 6:00 a.m. Indicate a.m. or p.m.
in your answer.
Time of year NYS hours of
daylight
Equator
hours of
daylight
Vertical Ray
(90°)
N. Pole hours
of daylight
S. Pole hours
of daylight
Sun’s
altitude in
NYS
Summer
Solstice
_______
Fall Equinox
_______
Winter
Solstice
_______
Spring
Equinox
_______
PRACTICE PACKET: TOPIC 8 CLIMATE
43
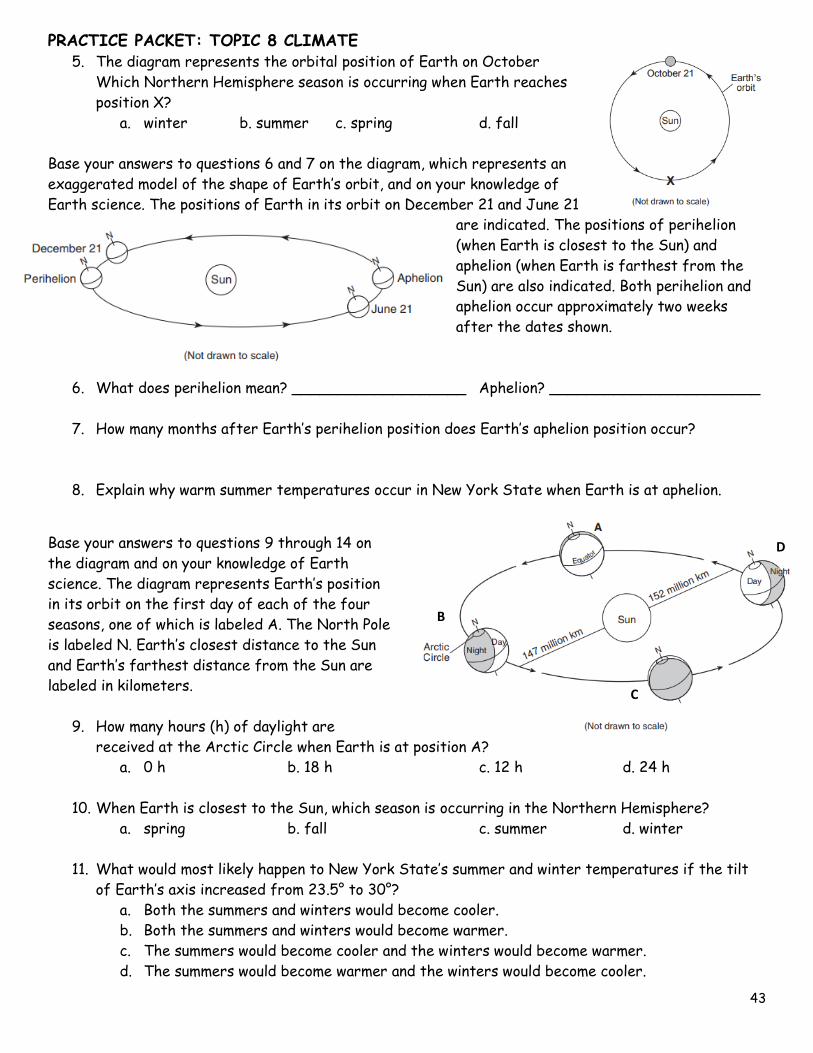
5. The diagram represents the orbital position of Earth on October
Which Northern Hemisphere season is occurring when Earth reaches
position X?
a. winter b. summer c. spring d. fall
Base your answers to questions 6 and 7 on the diagram, which represents an
exaggerated model of the shape of Earth’s orbit, and on your knowledge of
Earth science. The positions of Earth in its orbit on December 21 and June 21
are indicated. The positions of perihelion
(when Earth is closest to the Sun) and
aphelion (when Earth is farthest from the
Sun) are also indicated. Both perihelion and
aphelion occur approximately two weeks
after the dates shown.
6. What does perihelion mean? ___________________ Aphelion? _______________________
7. How many months after Earth’s perihelion position does Earth’s aphelion position occur?
8. Explain why warm summer temperatures occur in New York State when Earth is at aphelion.
Base your answers to questions 9 through 14 on
the diagram and on your knowledge of Earth
science. The diagram represents Earth’s position
in its orbit on the first day of each of the four
seasons, one of which is labeled A. The North Pole
is labeled N. Earth’s closest distance to the Sun
and Earth’s farthest distance from the Sun are
labeled in kilometers.
9. How many hours (h) of daylight are
received at the Arctic Circle when Earth is at position A?
a. 0 h b. 18 h c. 12 h d. 24 h
10. When Earth is closest to the Sun, which season is occurring in the Northern Hemisphere?
a. spring b. fall c. summer d. winter
11. What would most likely happen to New York State’s summer and winter temperatures if the tilt
of Earth’s axis increased from 23.5° to 30°?
a. Both the summers and winters would become cooler.
b. Both the summers and winters would become warmer.
c. The summers would become cooler and the winters would become warmer.
d. The summers would become warmer and the winters would become cooler.
B
C
D

PRACTICE PACKET: TOPIC 8 CLIMATE
44
12. Which change in seasons occurs in the Northern Hemisphere at position A?
a. Winter is ending and spring is beginning. c. Spring is ending and summer is beginning.
b. Summer is ending and fall is beginning. d. Fall is ending and winter is beginning.
13. Approximately how many days (d) does it take Earth to travel from position A to position C?
a. 91 d b. 274 d c. 182 d d. 365 d
14. At which two positions will an observer in New York State experience approximately 12 hours of
daylight during one rotation of Earth?
a. A and B b. B and C c. A and C d. B and D
Base your answers to questions 1 through 2 & the BONUS on the diagram, which shows Earth as viewed
from space on December 21. Some latitudes are labeled.
1. On the diagram, place an X at a location
on Earth’s surface where the Sun was
directly overhead at some time on
December 21.
2. State one factor, other than the tilt of
Earth’s axis, that causes seasons to
change on Earth.
BONUS REVIEW QUESTION: At which
latitude is Polaris observed at an altitude
of 66.5°?
3. Which position in the following diagram best represents Earth on
the first day of summer in the Northern Hemisphere?
A. 1 B. 2 C. 3 D. 4
4. On June 21, at which latitude would an observer find the Sun
directly overhead? A. 23 ½º North B. 90º South C. 23 ½º South D. 0º
5. Which diagram most correctly shows the portion of Earth that is illuminated by sunlight and the
portion that is in shadow on the first day of summer in the Northern Hemisphere?
ASSESS YOURSELF ON THIS LESSON: _________/14
If you missed more than 3, do the Additional Practice. If not, go on to the next hw video!!!

PRACTICE PACKET: TOPIC 8 CLIMATE
45
6. New York State has several more hours of daylight in summer than in winter. Which statement
helps explain this observation?
A. The speed of the Earth in its orbit changes.
B. The distance between the Earth and the Sun varies.
C. The Earth is tilted on its axis.
D. The diameter of the Sun appears to change.
Lesson 8: Celestial Motion
Rotation is the spinning of Earth on its axis 15° per hour. It causes daylight and night and the apparent
motion of the sun around the Earth. One complete rotation takes one day, approximately 23 hours, 56
min, 4 sec. Evidence of rotation includes the Coriolis Effect (the deflection of winds and ocean
currents), circumpolar stars (stars around Polaris), star trails (the apparent motion of stars in the night
sky) & the Foucault Pendulum.
Apparent Motion of the Sun
o the Sun appears to rise in the eastern part of the sky and set in the west, because Earth
rotates West to East
o the sun appears to move at a rate of 15º/hour
o the tilt of the Earth on its axis causes the Sun’s rising and setting
positions to change during different seasons
o the sun is NEVER directly overhead in NYS - it is ALWAYS due
south at solar noon
o The apparent daily motion (motion of celestial objects during the course of a day) changes
with the observer’s latitude
Objective:
I can describe the difference between apparent and real motion
I can say how quickly the Earth rotates & in what direction.
I can name the star that the North Pole always points to.
I can state what is special about Polaris.
I can draw the sun’s path for the different seasons.
I can explain how the sun’s height effects the shadow.
ASSESS YOURSELF ON THIS ADDITIONAL PRACTICE: _________/6
If you missed more than 2 you should see me for extra help and/or re-watch the lesson video.

PRACTICE PACKET: TOPIC 8 CLIMATE
46
1. What is rotation? ___________________________________________________________
2. How fast does the Earth rotate? ________________________________________________
3. What does “apparent motion of the sun” mean? _____________________________________
4. What causes us to see the sun rise & set if it isn’t actually moving? ______________________
_________________________________________________________________________
5. How long does one complete rotation take? ________________________________________
6. Where does the sun appear to rise? ______________________ set? __________________
7. Why? ____________________________________________________________________
8. How many times is the sun directly overhead in NYS? ________________________________
9. Why is there a dotted line for winter at high latitude? _______________________________
Locating objects in the sky: The diagram below represents a model of the sky (celestial sphere) for an
observer. Use the description next to each term below to label the diagram.
Celestial sphere - imaginary dome surrounding Earth
Altitude - the height above Earth’s surface
- Celestial objects are measured in degrees
- Label the arrow pointing to the arrow altitude.
Polaris – the altitude equals an observers latitude in the Northern Hemisphere (label the star Polaris)
Zenith - the point located directly overhead of an observer
- altitude is 90˚
Azimuth - the angular measurement around Earth’s surface
- measured in degrees starting with due North located at 0° Azimuth and moving clockwise
around the horizon.
- Label the line that is pointing to the three dotted lines to show azimuth

PRACTICE PACKET: TOPIC 8 CLIMATE
47
This diagram illustrates the path of the sun and the altitude of the noon sun on the celestial sphere for
an observer in New York State (latitude 43°N) at the beginning of each season. Label each star with the
month for the path it represents. For each mark between the stars, label the corresponding month of
the year. Each mark will have two months of the year. Hint: locate December and move upward labeling
the months until June, then go down until
you reach December.
1. Which letter represents the path
and altitude of the noon sun on . . .
December 21? _______
March 21? ______
June 21? _______
September 23? ______
2. In November, the noon sun would
most likely be between points
_____ and _____
3. In August, the noon sun would
most likely be between points
_____ and _____
4. In May, the noon sun would most likely be between points _____ and _____
5. In January, the noon sun would most likely be between points _____ and _____
6. In April, the noon sun would most likely be between points _____ and _____
7. In February, the noon sun would most likely be between points _____ and _____
8. In July, the noon sun would most likely be between points _____ and _____
9. In October, the noon sun would most likely be between points _____ and _____
10. Path ____ represents the first day of _______________ (June 21). Where does the sun rise?
Give compass directions. ___________________________
11. In juNE in the Northern Hemisphere the sun rises North East. Why did I capitalize NE in juNE?
______________________________________________________
12. Path ____ represents the first day of _______________ & ________________(March 21 &
September 23). Where does the sun rise? Give compass directions. ______________________
13. On the Equinox in the Northern Hemisphere the sun rises directly East. Why did I capitalize E in
Equinox? ______________________________________________________
14. Path ____ represents the first day of _______________ (December 21). Where does the sun
rise? Give compass directions. ___________________________
15. In deSEmber in the Northern Hemisphere the sun rises South East. Why did I capitalize SE (and
misspell) deSEmber? ______________________________________________________
16. The student drew the following diagram that shows the positions of sunrise, A, B, and C, during a
one-year period. Label the locations with the correct dates that sunrise would be in that position.
N S
E
N
W

PRACTICE PACKET: TOPIC 8 CLIMATE
48
For each location given determine the altitude of the noon sun at the beginning of each season.
The first date given for each location is when the vertical rays are at the Zenith (90˚).
Draw and label the path of the sun for each season. Remember these lines are parallel to each
other.
For direction of noon sun, choose “overhead”, “north” (northern sky) or “south” (southern sky)
- look at the diagram
To determine the altitude of the noon sun for different locations use the steps below. (Elmira 42ºN)
What is the latitude of Elmira NY? ______________________________________________
What is the latitude of the Tropic of Cancer? ______________________________________
What is the difference between the two latitudes? __________________________________
What is the altitude of the noon sun at the Tropic of Cancer on June 21? __________________
Subtract the difference between the latitudes from the altitude of the noon sun on the Tropic
of Cancer. This is the altitude of the noon sun in NYS on June 21. _______________________
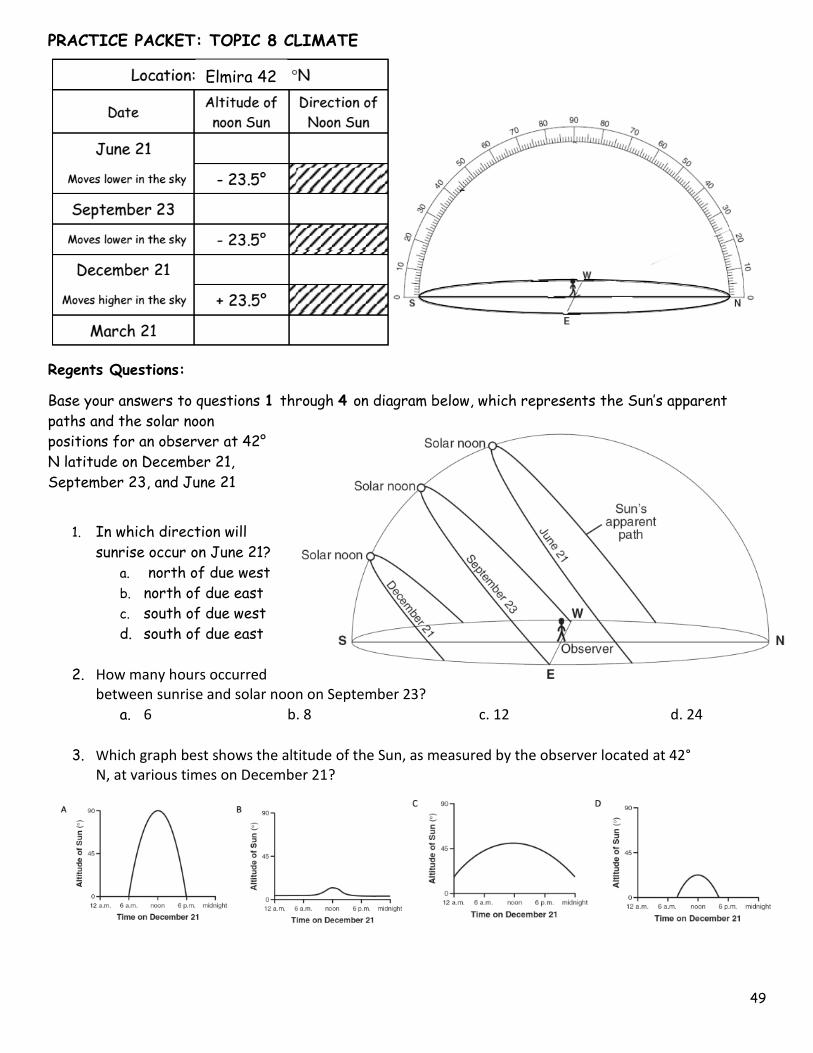
PRACTICE PACKET: TOPIC 8 CLIMATE
49
Regents Questions:
Base your answers to questions 1 through 4 on diagram below, which represents the Sun’s apparent
paths and the solar noon
positions for an observer at 42°
N latitude on December 21,
September 23, and June 21
1. In which direction will
sunrise occur on June 21?
a. north of due west
b. north of due east
c. south of due west
d. south of due east
2. How many hours occurred between sunrise and solar noon on September 23?
a. 6 b. 8 c. 12 d. 24
3. Which graph best shows the altitude of the Sun, as measured by the observer located at 42°
N, at various times on December 21?
Elmira 42
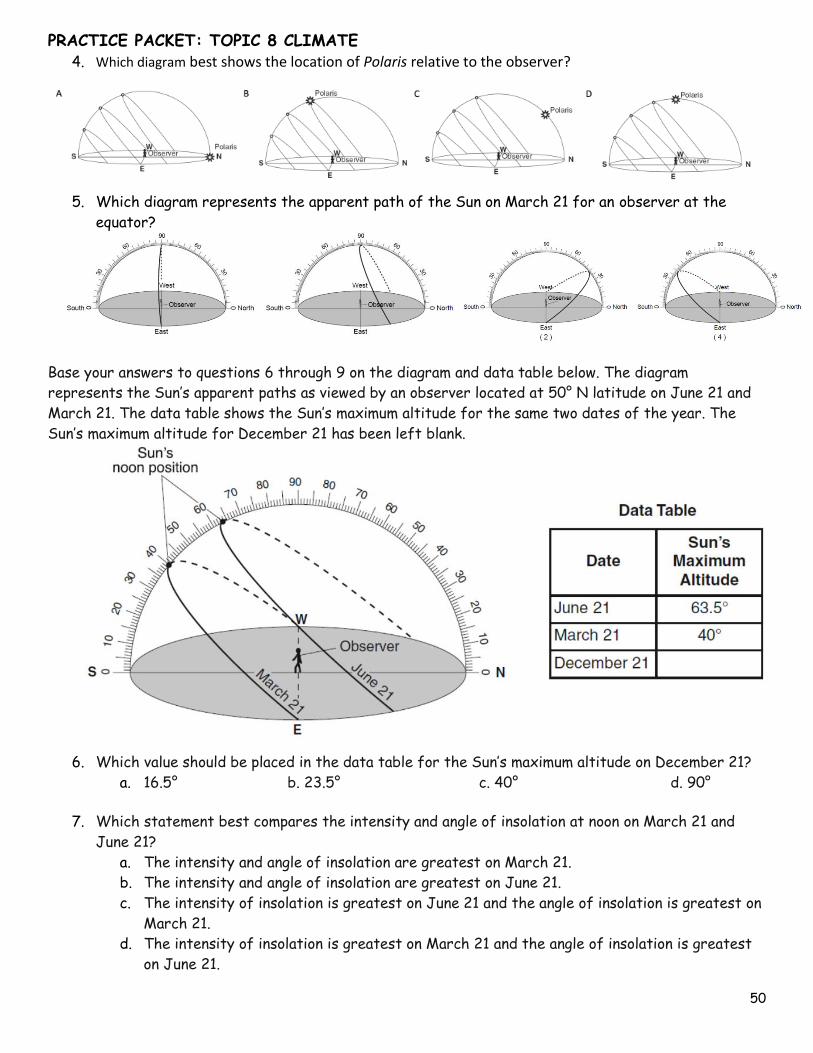
PRACTICE PACKET: TOPIC 8 CLIMATE
50
4. Which diagram best shows the location of Polaris relative to the observer?
5. Which diagram represents the apparent path of the Sun on March 21 for an observer at the
equator?
Base your answers to questions 6 through 9 on the diagram and data table below. The diagram
represents the Sun’s apparent paths as viewed by an observer located at 50° N latitude on June 21 and
March 21. The data table shows the Sun’s maximum altitude for the same two dates of the year. The
Sun’s maximum altitude for December 21 has been left blank.
6. Which value should be placed in the data table for the Sun’s maximum altitude on December 21?
a. 16.5° b. 23.5° c. 40° d. 90°
7. Which statement best compares the intensity and angle of insolation at noon on March 21 and
June 21?
a. The intensity and angle of insolation are greatest on March 21.
b. The intensity and angle of insolation are greatest on June 21.
c. The intensity of insolation is greatest on June 21 and the angle of insolation is greatest on
March 21.
d. The intensity of insolation is greatest on March 21 and the angle of insolation is greatest
on June 21.
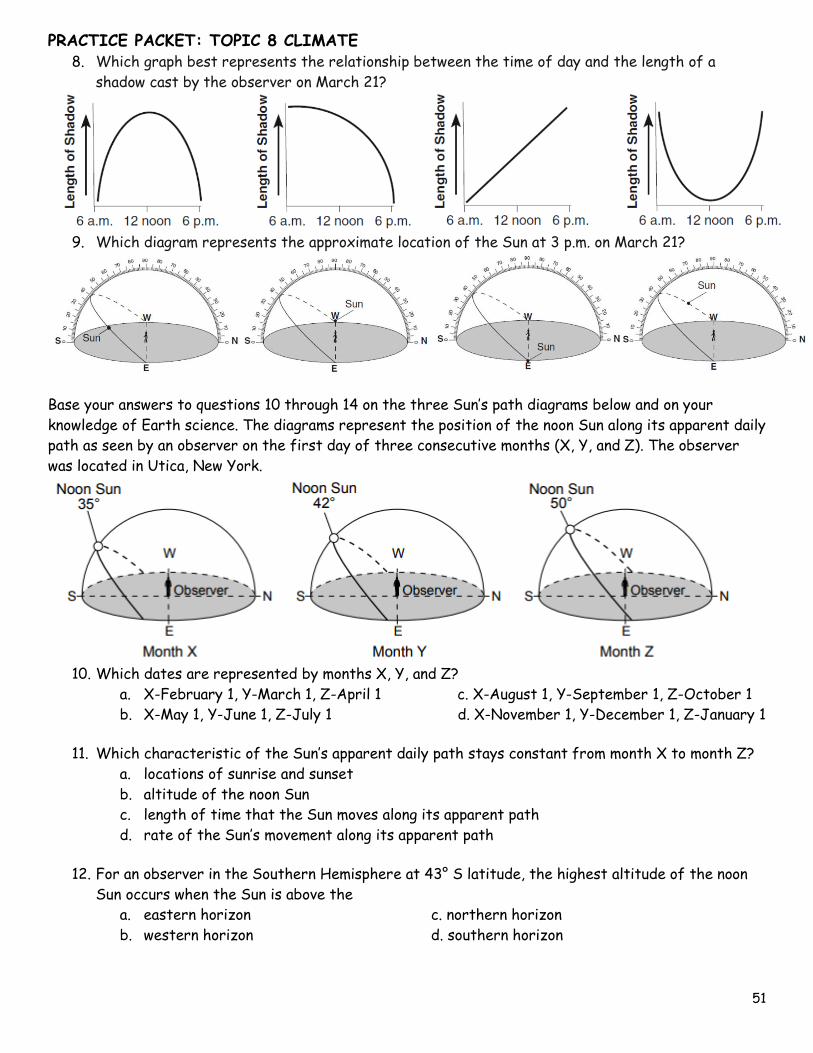
PRACTICE PACKET: TOPIC 8 CLIMATE
51
8. Which graph best represents the relationship between the time of day and the length of a
shadow cast by the observer on March 21?
9. Which diagram represents the approximate location of the Sun at 3 p.m. on March 21?
Base your answers to questions 10 through 14 on the three Sun’s path diagrams below and on your
knowledge of Earth science. The diagrams represent the position of the noon Sun along its apparent daily
path as seen by an observer on the first day of three consecutive months (X, Y, and Z). The observer
was located in Utica, New York.
10. Which dates are represented by months X, Y, and Z?
a. X-February 1, Y-March 1, Z-April 1 c. X-August 1, Y-September 1, Z-October 1
b. X-May 1, Y-June 1, Z-July 1 d. X-November 1, Y-December 1, Z-January 1
11. Which characteristic of the Sun’s apparent daily path stays constant from month X to month Z?
a. locations of sunrise and sunset
b. altitude of the noon Sun
c. length of time that the Sun moves along its apparent path
d. rate of the Sun’s movement along its apparent path
12. For an observer in the Southern Hemisphere at 43° S latitude, the highest altitude of the noon
Sun occurs when the Sun is above the
a. eastern horizon c. northern horizon
b. western horizon d. southern horizon

PRACTICE PACKET: TOPIC 8 CLIMATE
52
13. Position A represents the position of the Sun at another time of day
during month Z. What is the time of day when the Sun is at position A?
a. 1 p.m. c. 7 a.m.
b. 5 p.m. d. 11 a.m.
14. The diagrams below represent the compass direction and altitude of the
Sun’s rays at noon for a location on Earth on four different dates. What
is the latitude of this location?
a. 0° b. 23.5° S c. 23.5° N d. 90° N
1. The model represents the apparent path of the Sun across the sky on
March 21 as seen by an observer on Earth. At which latitude is the
observer located?
a. 90° N b. 23.5° N c. 42° N d. 0°
2. During the month of January, at which location in New York State is the Sun lowest in the sky at
solar noon?
a. Massena b. Utica c. Niagara Falls d. New York City
Base your answers to questions 3 through 5 on the diagram and on your knowledge of Earth science. The
diagram represents the apparent path of the Sun through the sky
as viewed by an observer in the Northern Hemisphere. Points A,
B, C, and D represent four positions of the Sun.
3. This apparent path of the Sun through the sky is caused
by
a. Earth’s revolution around the Sun
b. the Sun’s revolution around Earth
c. Earth’s rotation on its axis
d. the Sun’s rotation on its axis
4. The observer has the longest shadow when the Sun is at position
a. A b. B c. C d. D
5. What is the approximate time of day when the Sun is at position C?
a. 6 a.m. b. 3 p.m. c. 9 a.m. d. 6 p.m.
ASSESS YOURSELF ON THIS LESSON: _________/14
If you missed more than 3, do the Additional Practice. If not, go on to the next hw video!!!
ASSESS YOURSELF ON THIS ADDITIONAL PRACTICE: _________/5
If you missed more than 2 you should see me for extra help and/or re-watch the lesson video.