practicas tema 4. nuevas funcionalidades de monitorización y ajuste.
16
Administración Avanzada de Oracle10g PRACTICAS TEMA 4. NUEVAS FUNCIONALIDADES DE MONITORIZACIÓN Y AJUSTE. 4.1. Ver las filas de las vistas: V$OSSTAT, V$SYS_TIME_MODEL, V$SES_TIME_MODEL, V$SYSMETRIC, V$SESSMETRIC, V$FILEMETRIC, V$EVENTMETRIC, V$SYSTEM_WAIT_CLASS, V$SESSION_WAIT_CLASS, V$WAITCLASSMETRIC. 4.2. Pruebas con AWR. Sacar un snapshot explícitamente y, desde el usuario SCOTT, crear una tabla EMP2 a partir de EMP, generando E/S. Volver a sacar otro snapshot. Generar el infome AWR, en formato HTML, entre los dos snapshots anteriores. 4.3. Pruebas ASH. Vamos a generar un informe ASH, en formato HTML, tomando como comienzo el primer snapshot anterior (comprueba su fecha y hora para calcular el “tiempo atrás” q tienes q indicarle al informe ASH). 4.4. Pruebas ADDM. Vamos a generar un informe ADDM ($ORACLE_HOME/rdbms/admin/addmrpt.sql) entre los dos snapshots anteriores. 4.5. Probar SQL TUNNING. Vamos a hacerlo con la sentencia “select count(*) from scott.emp, scott.emp, scott.emp, scott.emp”. Generaremos la tarea, y después la lanzaremos, para poder generar el informe. Finalmente obtendremos un script con las recomendaciones del informe. 4.6. Probar SEGMENT ADVISOR. Vamos a hacerlo con la tabla SCOTT.EMP2 (creada a partir de SCOTT.EMP y generando muchas filas insertando sobre ella misma, para finalmente borrar al menos la mitad de las filas para que quede espacio libre). Generaremos la tarea, y después la lanzaremos, para poder generar el informe. 4.7. Probar UNDO ADVISOR. Vamos a probar las funciones q proporciona el paquete DBMS_UNDO_ADV, tanto para ver el estado actual del UNDO en nuestra BD, como para obtener estimaciones de qué tamaño debería tener nuestro tablespace de UNDO para el valor de undo_retention actual; y tb, en función de la query q más ha tardado, q undo_retention necesitariamos. © Juan Luis Serradilla Amarilla y Francisco Fernández Martínez 1
Transcript of practicas tema 4. nuevas funcionalidades de monitorización y ajuste.

Administración Avanzada de Oracle10g
PRACTICAS TEMA 4.NUEVAS FUNCIONALIDADES DE MONITORIZACIÓN Y AJUSTE.
4.1. Ver las filas de las vistas: V$OSSTAT, V$SYS_TIME_MODEL, V$SES_TIME_MODEL, V$SYSMETRIC, V$SESSMETRIC, V$FILEMETRIC, V$EVENTMETRIC, V$SYSTEM_WAIT_CLASS, V$SESSION_WAIT_CLASS, V$WAITCLASSMETRIC.
4.2. Pruebas con AWR. Sacar un snapshot explícitamente y, desde el usuario SCOTT, crear una tabla EMP2 a partir de EMP, generando E/S. Volver a sacar otro snapshot. Generar el infome AWR, en formato HTML, entre los dos snapshots anteriores.
4.3. Pruebas ASH. Vamos a generar un informe ASH, en formato HTML, tomando como comienzo el primer snapshot anterior (comprueba su fecha y hora para calcular el “tiempo atrás” q tienes q indicarle al informe ASH).
4.4. Pruebas ADDM. Vamos a generar un informe ADDM ($ORACLE_HOME/rdbms/admin/addmrpt.sql) entre los dos snapshots anteriores.
4.5. Probar SQL TUNNING. Vamos a hacerlo con la sentencia “select count(*) from scott.emp, scott.emp, scott.emp, scott.emp”. Generaremos la tarea, y después la lanzaremos, para poder generar el informe. Finalmente obtendremos un script con las recomendaciones del informe.
4.6. Probar SEGMENT ADVISOR. Vamos a hacerlo con la tabla SCOTT.EMP2 (creada a partir de SCOTT.EMP y generando muchas filas insertando sobre ella misma, para finalmente borrar al menos la mitad de las filas para que quede espacio libre). Generaremos la tarea, y después la lanzaremos, para poder generar el informe.
4.7. Probar UNDO ADVISOR. Vamos a probar las funciones q proporciona el paquete DBMS_UNDO_ADV, tanto para ver el estado actual del UNDO en nuestra BD, como para obtener estimaciones de qué tamaño debería tener nuestro tablespace de UNDO para el valor de undo_retention actual; y tb, en función de la query q más ha tardado, q undo_retention necesitariamos.
© Juan Luis Serradilla Amarilla y Francisco Fernández Martínez 1

Administración Avanzada de Oracle10g
4.1. Consultar las principales vistas dinámicas de la 10g relacionadas con el AWR: V$OSSTAT, V$SYS_TIME_MODEL, V$SES_TIME_MODEL, V$SYSMETRIC, V$SESSMETRIC, V$FILEMETRIC, V$EVENTMETRIC, V$SYSTEM_WAIT_CLASS, V$SESSION_WAIT_CLASS, V$WAITCLASSMETRIC. Probar AWR, ASH, ADDM, SQL TUNING y SEGMENT ADVISOR, según se va proponiendo en la resolución.
Solución:
SQL> set pagesize 37SQL> set pause onSQL> set linesize 100SQL> select * from V$OSSTAT;STAT_NAME VALUE OSSTAT_ID NUM_CPUS 2 0IDLE_TIME 86033589 1BUSY_TIME 639634 2USER_TIME 385713 3SYS_TIME 216593 4IOWAIT_TIME 990609 5NICE_TIME 5004 6RSRC_MGR_CPU_WAIT_TIME 0 14LOAD .029296875 15NUM_CPU_SOCKETS 1 17PHYSICAL_MEMORY_BYTES 183580 1008
SQL> select STAT_NAME,VALUE from V$SYS_TIME_MODEL ORDER BY VALUE DESC;STAT_NAME VALUE sql execute elapsed time 779236309DB time 775467180background elapsed time 649315020background cpu time 373824496parse time elapsed 118326057hard parse elapsed time 111966877DB CPU 103812477PL/SQL execution elapsed time 33052484PL/SQL compilation elapsed time 8844809repeated bind elapsed time 1881642connection management call elapsed time 1055106hard parse (sharing criteria) elapsed time 505131sequence load elapsed time 317365hard parse (bind mismatch) elapsed time 50649failed parse elapsed time 5984RMAN cpu time (backup/restore) 0Java execution elapsed time 0failed parse (out of shared memory) elapsed time 0inbound PL/SQL rpc elapsed time 0
SQL> select SID,STAT_NAME,VALUE from V$SESS_TIME_MODELORDER BY VALUE DESC;
SID STAT_NAME VALUE 33 background elapsed time 223533510 35 background elapsed time 135179893 33 background cpu time 131625709... 14 DB time 1069147 14 sql execute elapsed time 980313 14 DB CPU 472300 14 parse time elapsed 409784
© Juan Luis Serradilla Amarilla y Francisco Fernández Martínez 2

Administración Avanzada de Oracle10g
14 hard parse elapsed time 392502...
(Los datos de cada sesión, como el nombre de usuario, se pueden sacar de v$session por sid)
SQL> select METRIC_NAME,VALUEfrom V$SYSMETRICwhere metric_name like '%Ratio%';
METRIC_NAME VALUE Buffer Cache Hit Ratio 100Memory Sorts Ratio 100...Soft Parse Ratio 40User Calls Ratio 16.3793103...Row Cache Hit Ratio 100Row Cache Miss Ratio 0Library Cache Hit Ratio 84.7457627Library Cache Miss Ratio 15.2542373...
SQL> select SESSION_ID, CPU, PGA_MEMORY, HARD_PARSES, SOFT_PARSES, PHYSICAL_READ_PCT, LOGICAL_READ_PCT from V$SESSMETRIC;SESSION_ID CPU PGA_MEMORY HARD_PARSES SOFT_PARSES PHYSICAL_READ_PCT LOGICAL_READ_PCT 14 .4512 1031848 3 5 0 100...30 0 1564444 0 0 0 0...33 0 1170232 0 0 0 034 0 11583144 0 0 0 035 0 2161764 0 0 0 0...
SQL> select FILE_ID,AVERAGE_READ_TIME,AVERAGE_WRITE_TIME,PHYSICAL_BLOCK_READS,PHYSICAL_BLOCK_WRITES from V$FILEMETRIC;FILE_ID AVERAGE_READ_TIME AVERAGE_WRITE_TIME PHYSICAL_BLOCK_READS PHYSICAL_BLOCK_WRITES 1 .11965812 3 117 22 0 2 0 53 0 0 0 04 0 0 0 05 0 0 0 06 0 0 0 07 0 0 0 0
(Los nombres de ficheros se pueden sacar de v$dbfile por file#)
SQL> select EVENT_ID,NUM_SESS_WAITING,TIME_WAITED,WAIT_COUNT from V$EVENTMETRICwhere NUM_SESS_WAITING>0;
EVENT_ID NUM_SESS_WAITING TIME_WAITED WAIT_COUNT 3539483025 1 5860.2957 20 866018717 8 46884.5491 2351403232821 1 29296.8907 11421975091 1 6478.6887 23702640206 1 0 0 989870553 1 5468.8976 41830121438 1 5468.9045 2
(Los nombres de eventos se pueden sacar de v$system_event, por event_id)
© Juan Luis Serradilla Amarilla y Francisco Fernández Martínez 3

Administración Avanzada de Oracle10g
SQL> select wait_class,total_waits,time_waited from v$system_wait_class;WAIT_CLASS TOTAL_WAITS TIME_WAITED Other 2099 605Application 85 0Configuration 27 621Administrative 2 6Concurrency 129 289Commit 452 535Idle 1637160 580491878Network 5077 2User I/O 42969 33158System I/O 172750 23549
SQL> select sid,wait_class,total_waits,time_waited from v$session_wait_classorder by time_waited desc;
SID WAIT_CLASS TOTAL_WAITS TIME_WAITED 29 Idle 448482 4383485937 Idle 149694 43830087...14 Idle 62 6007133 System I/O 150160 1894534 System I/O 7868 446232 User I/O 6179 22230 User I/O 399 16930 Concurrency 47 100...
SQL> select wait_class#, dbtime_in_wait, time_waited, wait_count from v$waitclassmetric;WAIT_CLASS# DBTIME_IN_WAIT TIME_WAITED WAIT_COUNT 0 0 0 0 1 0 0 0 2 0 0 0 3 0 0 0 4 0 0 0 5 0 0 0 6 0 84892.7288 219 7 .876858559 .0023 2 8 0 0 0 9 100 2.5978 20 10 0 0 0 11 0 0 0
(Se puede obtener el nombre del tipo de espera, wait_class, de v$system_wait_class por wait_class#)
4.2. Pruebas con AWR. Sacar un snapshot explícitamente y, desde el usuario SCOTT, crear una tabla EMP2 a partir de EMP, generando E/S. Volver a sacar otro snapshot. Generar el infome AWR, en formato HTML, entre los dos snapshots anteriores.
(Vamos a sacar el primer snaphost)
SQL> connect / as sysdbaConnected.SQL> EXECUTE dbms_workload_repository.create_snapshot();PL/SQL procedure successfully completed.
(Ahora vamos a crear la tabla SCOTT.EMP2 y a generar E/S sobre ella. Para ello la creamos a partir de SCOTT.EMP y
© Juan Luis Serradilla Amarilla y Francisco Fernández Martínez 4

Administración Avanzada de Oracle10g
luego insertamos las propias filas q contiene con “insert select”, repitiendo esto último al menos 8 veces. Después haremos varias consultas.)
SQL> connect scott/tigercursoXYConnected.SQL> create table emp2 as select * from emp;Table created.SQL> begin for i in 1..10 loop insert into emp2 select * from emp2; end loop;end;/PL/SQL procedure successfully completed.SQL> select count(*) from emp2; COUNT(*) 14336SQL> commit;Commit complete.SQL> select deptno,count(*) from emp2 group by deptno; DEPTNO COUNT(*) 30 3072 20 2560 10 1536SQL> select empno,count(*) from emp2 group by empno; EMPNO COUNT(*) 7782 512 7839 512 7844 512 7698 512 7521 512 7902 512 7566 512 7654 512 7788 512 7934 512 7499 512 7876 512 7369 512 7900 51214 rows selected.SQL> select count(*) from emp2 where empno=7900; COUNT(*) 512
(Ahora vamos a tomar el segundo snapshot)
SQL> connect / as sysdbaConnected.SQL> EXECUTE dbms_workload_repository.create_snapshot();PL/SQL procedure successfully completed.
(Y ahora vamos a lanzar el informe de AWR, $ORACLE_HOME/rdbms/admin/awrrpt.sql, en formato HTML, para los dos últimos snapshots q hemos creado explícitamente)
SQL> @$ORACLE_HOME/rdbms/admin/awrrpt...Enter value for report_type: html...Enter value for num_days: 2
© Juan Luis Serradilla Amarilla y Francisco Fernández Martínez 5

Administración Avanzada de Oracle10g
Listing the last 2 days of Completed Snapshots SnapInstance DB Name Snap Id Snap Started Level CURSO69 CURSO69 562 29 Jan 2007 00:00 1... 596 30 Jan 2007 09:20 1 597 30 Jan 2007 09:33 1
Specify the Begin and End Snapshot Ids~~~~~~~~~~~~~~~~~~~~~~~~~~~~~~~~~~~~~~Enter value for begin_snap: 596...Enter value for end_snap: 597...Specify the Report Name~~~~~~~~~~~~~~~~~~~~~~~The default report file name is awrrpt_1_596_597.html. To use this name,press <return> to continue, otherwise enter an alternative.
Enter value for report_name: awrrpt_cursoXY.html...End of Report</BODY></HTML>Report written to awrrpt_cursoXY.html
(Una vez q tenemos el fichero HTML, vamos a ponerlo en un directorio desde donde podamos verlo en el servidor web, ¡¡¡ OJO, sustituye XY por los números de tu usuario !!!)
/home/CURSO/cursoXY (CURSOXY)> cp awrrpt_cursoXY.html /var/www/html/temp
(Ahora puedes ver tu informe desde “http://cursos.atica.um.es/temp/awrrpt_cursoXY.html”.)
4.3. Pruebas ASH. Vamos a generar un informe ASH, en formato HTML, tomando como comienzo el primer snapshot anterior (comprueba su fecha y hora para calcular el “tiempo atrás” q tienes q indicarle al informe ASH).
SQL> connect / as sysdbaConnected.SQL> @$ORACLE_HOME/rdbms/admin/ashrpt.sqlCurrent Instance~~~~~~~~~~~~~~~~...Specify the Report Type~~~~~~~~~~~~~~~~~~~~~~~Enter 'html' for an HTML report, or 'text' for plain textDefaults to 'html'Enter value for report_type: html...Defaults to 15 minsEnter value for begin_time: 45...Press Enter to analyze till current timeEnter value for duration:...Enter value for report_name: ashrpt_cursoXY.html...End of Report</BODY></HTML>Report written to ashrpt_cursoXY.html
© Juan Luis Serradilla Amarilla y Francisco Fernández Martínez 6
Administración Avanzada de Oracle10g
(Una vez q tenemos el fichero HTML, vamos a ponerlo en un directorio desde donde podamos verlo en el servidor web, ¡¡¡ OJO, sustituye XY por los números de tu usuario !!!)
/home/CURSO/cursoXY (CURSOXY)> cp ashrpt_cursoXY.html /var/www/html/temp
(Ahora puedes ver tu informe desde “http://cursos.atica.um.es/temp/ashrpt_cursoXY.html”.)
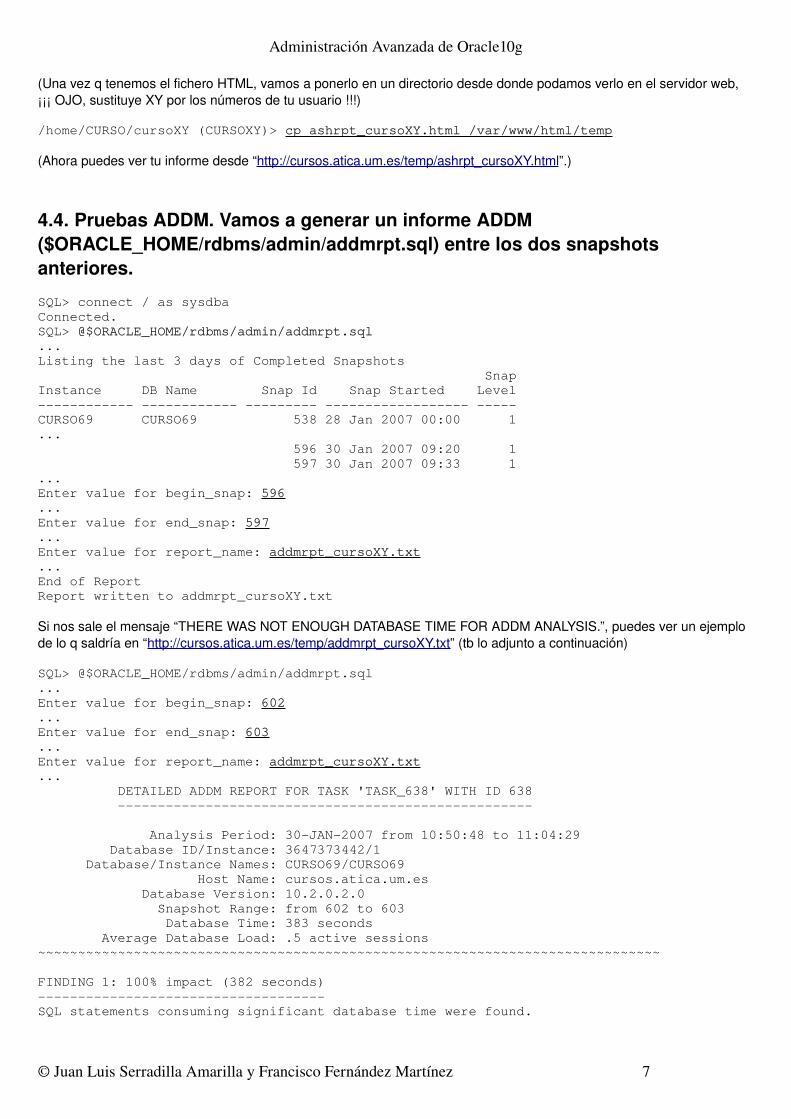
4.4. Pruebas ADDM. Vamos a generar un informe ADDM ($ORACLE_HOME/rdbms/admin/addmrpt.sql) entre los dos snapshots anteriores.
SQL> connect / as sysdbaConnected.SQL> @$ORACLE_HOME/rdbms/admin/addmrpt.sql...Listing the last 3 days of Completed Snapshots SnapInstance DB Name Snap Id Snap Started Level CURSO69 CURSO69 538 28 Jan 2007 00:00 1... 596 30 Jan 2007 09:20 1 597 30 Jan 2007 09:33 1...Enter value for begin_snap: 596...Enter value for end_snap: 597...Enter value for report_name: addmrpt_cursoXY.txt...End of ReportReport written to addmrpt_cursoXY.txt
Si nos sale el mensaje “THERE WAS NOT ENOUGH DATABASE TIME FOR ADDM ANALYSIS.”, puedes ver un ejemplo de lo q saldría en “http://cursos.atica.um.es/temp/addmrpt_cursoXY.txt” (tb lo adjunto a continuación)
SQL> @$ORACLE_HOME/rdbms/admin/addmrpt.sql...Enter value for begin_snap: 602...Enter value for end_snap: 603...Enter value for report_name: addmrpt_cursoXY.txt... DETAILED ADDM REPORT FOR TASK 'TASK_638' WITH ID 638
Analysis Period: 30JAN2007 from 10:50:48 to 11:04:29 Database ID/Instance: 3647373442/1 Database/Instance Names: CURSO69/CURSO69 Host Name: cursos.atica.um.es Database Version: 10.2.0.2.0 Snapshot Range: from 602 to 603 Database Time: 383 seconds Average Database Load: .5 active sessions~~~~~~~~~~~~~~~~~~~~~~~~~~~~~~~~~~~~~~~~~~~~~~~~~~~~~~~~~~~~~~~~~~~~~~~~~~~~~~
FINDING 1: 100% impact (382 seconds)SQL statements consuming significant database time were found.
© Juan Luis Serradilla Amarilla y Francisco Fernández Martínez 7

Administración Avanzada de Oracle10g
RECOMMENDATION 1: SQL Tuning, 100% benefit (381 seconds) ACTION: Run SQL Tuning Advisor on the SQL statement with SQL_ID "bqhg4kaam7k28". RELEVANT OBJECT: SQL statement with SQL_ID bqhg4kaam7k28 and PLAN_HASH 2902285800 select count(*) from emp2,emp2 RATIONALE: SQL statement with SQL_ID "bqhg4kaam7k28" was executed 80 times and had an average elapsed time of 4.7 seconds.
FINDING 2: 100% impact (381 seconds)Time spent on the CPU by the instance was responsible for a substantial partof database time.
RECOMMENDATION 1: SQL Tuning, 100% benefit (381 seconds) ACTION: Run SQL Tuning Advisor on the SQL statement with SQL_ID "bqhg4kaam7k28". RELEVANT OBJECT: SQL statement with SQL_ID bqhg4kaam7k28 and PLAN_HASH 2902285800 select count(*) from emp2,emp2 RATIONALE: SQL statement with SQL_ID "bqhg4kaam7k28" was executed 80 times and had an average elapsed time of 4.7 seconds. RATIONALE: Average CPU used per execution was 4.7 seconds.
~~~~~~~~~~~~~~~~~~~~~~~~~~~~~~~~~~~~~~~~~~~~~~~~~~~~~~~~~~~~~~~~~~~~~~~~~~~~~~
ADDITIONAL INFORMATION
Wait class "Application" was not consuming significant database time.Wait class "Commit" was not consuming significant database time.Wait class "Concurrency" was not consuming significant database time.Wait class "Configuration" was not consuming significant database time.Wait class "Network" was not consuming significant database time.Wait class "User I/O" was not consuming significant database time.Session connect and disconnect calls were not consuming significant databasetime.Hard parsing of SQL statements was not consuming significant database time.
The analysis of I/O performance is based on the default assumption that theaverage read time for one database block is 10000 microseconds.
An explanation of the terminology used in this report is available when yourun the report with the 'ALL' level of detail.
End of ReportReport written to addmrpt_cursoXY.txt
(Una vez q tenemos el fichero, vamos a ponerlo en un directorio desde donde podamos verlo en el servidor web, ¡¡¡ OJO, sustituye XY por los números de tu usuario !!!)
/home/CURSO/cursoXY (CURSOXY)> cp addmrpt_cursoXY.html /var/www/html/temp
(Ahora puedes ver tu informe desde “http://cursos.atica.um.es/temp/addmrpt_cursoXY.html”.)
4.5. Probar SQL TUNNING. Vamos a hacerlo con la sentencia “select count(*) from scott.emp, scott.emp, scott.emp, scott.emp”. Generaremos la tarea, y después la lanzaremos, para poder generar el informe. Finalmente obtendremos un script con las recomendaciones del informe.
(Primero creamos la tarea de ajuste)
© Juan Luis Serradilla Amarilla y Francisco Fernández Martínez 8

Administración Avanzada de Oracle10g
SQL> connect / as sysdbaConnected.SQL> variable stmt_task VARCHAR2(64);SQL> EXEC :stmt_task := DBMS_SQLTUNE.CREATE_TUNING_TASK(sql_text => 'select count(*) from scott.emp, scott.emp,scott.emp,scott.emp')PL/SQL procedure successfully completed.SQL> print stmt_taskSTMT_TASKTASK_622
(Después ejecutamos la tarea anterior)
SQL> exec DBMS_SQLTUNE.EXECUTE_TUNING_TASK(:stmt_task)PL/SQL procedure successfully completed.SQL> SELECT status FROM USER_ADVISOR_TASKS WHERE task_name = :stmt_task;STATUSCOMPLETED
(Y finalmente, podemos generar el informe correspondiente desde sqlplus usando el comando spool, creando un fichero llamado sqltunerpt_cursoXY.txt)
SQL> SET LONG 100000 LONGCHUNKSIZE 1000 LINESIZE 100 PAGESIZE 10000SQL> spool sqltunerpt_cursoXY.txtSQL> SELECT DBMS_SQLTUNE.REPORT_TUNING_TASK(:stmt_task) FROM DUAL;
GENERAL INFORMATION SECTION Tuning Task Name : TASK_622 Tuning Task Owner : SYS Scope : COMPREHENSIVE Time Limit(seconds) : 1800 Completion Status : COMPLETED Started at : 01/30/2007 11:02:57 Completed at : 01/30/2007 11:02:58 Number of Statistic Findings : 1 Number of SQL Profile Findings : 1 Number of SQL Restructure Findings: 1 Schema Name: SYS SQL ID : dc3b1w53mkwqu SQL Text : select count(*) from scott.emp, scott.emp,scott.emp,scott.emp FINDINGS SECTION (3 findings) 1 Statistics Finding Table "SCOTT"."EMP" and its indices were not analyzed. Recommendation Consider collecting optimizer statistics for this table and its indices. execute dbms_stats.gather_table_stats(ownname => 'SCOTT', tabname => 'EMP', estimate_percent => DBMS_STATS.AUTO_SAMPLE_SIZE, method_opt => 'FOR ALL COLUMNS SIZE AUTO', cascade => TRUE); Rationale The optimizer requires uptodate statistics for the table and its indices in order to select a good execution plan.
© Juan Luis Serradilla Amarilla y Francisco Fernández Martínez 9

Administración Avanzada de Oracle10g
2 SQL Profile Finding (see explain plans section below) A potentially better execution plan was found for this statement. Recommendation (estimated benefit<=10%) Consider accepting the recommended SQL profile. execute dbms_sqltune.accept_sql_profile(task_name => 'TASK_622', replace => TRUE); 3 Restructure SQL finding (see plan 1 in explain plans section) An expensive cartesian product operation was found at line ID 2 of the execution plan. Recommendation Consider removing the disconnected table or view from this statement or add a join condition which refers to it. Rationale A cartesian product should be avoided whenever possible because it is an expensive operation and might produce a large amount of data. EXPLAIN PLANS SECTION 1 Original With Adjusted Cost Plan hash value: 4254444861 | Id | Operation | Name | Rows | Cost (%CPU)| Time | | 0 | SELECT STATEMENT | | 1 | 501 (1)| 00:00:06 | | 1 | SORT AGGREGATE | | 1 | | | | 2 | MERGE JOIN CARTESIAN | | 38416 | 501 (1)| 00:00:06 | | 3 | MERGE JOIN CARTESIAN | | 2744 | 40 (0)| 00:00:01 | | 4 | MERGE JOIN CARTESIAN | | 196 | 6 (0)| 00:00:01 | | 5 | INDEX FAST FULL SCAN | PK_EMP | 14 | 2 (0)| 00:00:01 | | 6 | BUFFER SORT | | 14 | 4 (0)| 00:00:01 | | 7 | INDEX FAST FULL SCAN| PK_EMP | 14 | 0 (0)| 00:00:01 | | 8 | BUFFER SORT | | 14 | 40 (0)| 00:00:01 | | 9 | INDEX FAST FULL SCAN | PK_EMP | 14 | 0 (0)| 00:00:01 | | 10 | BUFFER SORT | | 14 | 500 (1)| 00:00:06 | | 11 | INDEX FAST FULL SCAN | PK_EMP | 14 | 0 (0)| 00:00:01 | 2 Using SQL Profile Plan hash value: 4121204128 | Id | Operation | Name | Rows | Cost (%CPU)| Time | | 0 | SELECT STATEMENT | | 1 | 500 (1)| 00:00:06 | | 1 | SORT AGGREGATE | | 1 | | | | 2 | MERGE JOIN CARTESIAN | | 38416 | 500 (1)| 00:00:06 | | 3 | MERGE JOIN CARTESIAN | | 2744 | 39 (0)| 00:00:01 | | 4 | MERGE JOIN CARTESIAN | | 196 | 5 (0)| 00:00:01 | | 5 | INDEX FULL SCAN | PK_EMP | 14 | 1 (0)| 00:00:01 | | 6 | BUFFER SORT | | 14 | 4 (0)| 00:00:01 |
© Juan Luis Serradilla Amarilla y Francisco Fernández Martínez 10

Administración Avanzada de Oracle10g
| 7 | INDEX FAST FULL SCAN| PK_EMP | 14 | 0 (0)| 00:00:01 | | 8 | BUFFER SORT | | 14 | 39 (0)| 00:00:01 | | 9 | INDEX FAST FULL SCAN | PK_EMP | 14 | 0 (0)| 00:00:01 | | 10 | BUFFER SORT | | 14 | 499 (1)| 00:00:06 | | 11 | INDEX FAST FULL SCAN | PK_EMP | 14 | 0 (0)| 00:00:01 | SQL> spool off
(Una vez q tenemos el fichero, vamos a ponerlo en un directorio desde donde podamos verlo en el servidor web, ¡¡¡ OJO, sustituye XY por los números de tu usuario !!!)
/home/CURSO/cursoXY (CURSOXY)> cp sqltunerpt_cursoXY.html /var/www/html/temp
(Ahora puedes ver tu informe desde “http://cursos.atica.um.es/temp/sqltunerpt_cursoXY.html”.)
Y ahora, podemos generar el script correspondiente desde sqlplus usando el comando spool, creando un fichero llamado sqltunerpt_cursoXY.txt)
SQL> SET LONG 100000 LONGCHUNKSIZE 1000 LINESIZE 100 PAGESIZE 10000SQL> spool sqltunescr_cursoXY.txt SQL> SELECT DBMS_SQLTUNE.SCRIPT_TUNING_TASK(:stmt_task) FROM DUAL; Script generated by DBMS_SQLTUNE package, advisor framework Use this script to implement some of the recommendations made by the SQL tuning advisor. NOTE: this script may need to be edited for your system (index names, privileges, etc) before it is executed. execute dbms_stats.gather_table_stats(ownname => 'SCOTT', tabname => 'EMP', estimate_percent => DBMS_STATS.AUTO_SAMPLE_SIZE, method_opt => 'FOR ALL COLUMNS SIZE AUTO', cascade => TRUE);execute dbms_sqltune.accept_sql_profile(task_name => 'TASK_622', replace => TRUE);SQL> spool off
(Una vez q tenemos el fichero, vamos a ponerlo en un directorio desde donde podamos verlo en el servidor web, ¡¡¡ OJO, sustituye XY por los números de tu usuario !!!)
/home/CURSO/cursoXY (CURSOXY)> cp sqltunescr_cursoXY.txt /var/www/html/temp
(Ahora puedes ver tu informe desde “http://cursos.atica.um.es/temp/sqltunescr_cursoXY.txt”.)
4.6. Probar SEGMENT ADVISOR. Vamos a hacerlo con la tabla SCOTT.EMP2 (creada a partir de SCOTT.EMP y generando muchas filas insertando sobre ella misma, para finalmente borrar al menos la mitad de las filas para que quede espacio libre). Generaremos la tarea, y después la lanzaremos, para poder generar el informe.
(Primero vamos a darle al usuario SCOTT los privilegios necesarios para que él mismo pueda crear las tareas del Segment Advisor)
SQL> connect / as sysdbaSQL> grant advisor, create job to scott;Grant succeeded.
(Ahora, desde el usuario SCOTT, vamos a crear una tarea del tipo Segment Advisor para la tabla EMP2, y tb vamos a analizar la tabla EMP, para q veamos q se pueden añadir varios objetos a una misma tarea)
© Juan Luis Serradilla Amarilla y Francisco Fernández Martínez 11

Administración Avanzada de Oracle10g
SQL> connect scott/tigercursoXYSQL> set serveroutput on size 1000000variable id number;declare name varchar2(100); descr varchar2(500); obj_id number;begin name:='scottEMP2segAdv'; descr:='SCOTT.EMP2 Segment Advisor'; dbms_advisor.create_task('Segment Advisor', :id, name, descr); dbms_advisor.create_object (name, 'TABLE', 'SCOTT', 'EMP2', NULL, NULL, NULL, obj_id); dbms_advisor.create_object (name, 'TABLE', 'SCOTT', 'EMP', NULL, NULL, NULL, obj_id); dbms_advisor.set_task_parameter(name, 'recommend_all', 'TRUE'); dbms_advisor.set_task_parameter(name, 'verbose', 'TRUE'); dbms_advisor.execute_task(name);end;/
obj_type_id: 0 name: UNDEFINEDobj_type_id: 1 name: TABLE...Segment schema: SCOTT name: EMP2 type: TABLE partname:Seg_list_key: SCOTT.EMP2..TABLETimelimit: 0 Time_remaining 86400 Time_since_start 1.279368Loading temp trendentering load_temp_trend: owner: SCOTT table: EMP2 seg_type: TABLE part_name:lobcol: lobseg: lobpart: time_limit: 86400Finished loading temp trendStart fetch from temp trendused: 635874 alloc: 851968Segment schema: SCOTT name: EMP type: TABLE partname:Seg_list_key: SCOTT.EMP..TABLETimelimit: 0 Time_remaining 86400 Time_since_start .079368Loading temp trendentering load_temp_trend: owner: SCOTT table: EMP seg_type: TABLE part_name:lobcol: lobseg: lobpart: time_limit: 86400Finished loading temp trendStart fetch from temp trendused: 4398 alloc: 65536
PL/SQL procedure successfully completed.
(Como hemos lanzado la tarea con el parámetro “verbose=true” podemos ver la sallida de lo q ha ido haciendo. Ahora comprobamos el nº de tarea generado en la variable id, y la usamos para ver q ha completado)
SQL> print id ID 644SQL> SELECT STATUS FROM USER_ADVISOR_TASKS WHERE TASK_ID=:id;STATUSCOMPLETED
(Ahora podemos ver si ha encontrado “algo” en el análisis)
SQL> select af.message, af.more_info from user_advisor_findings af, user_advisor_objects ao where ao.task_id = af.task_id and ao.object_id = af.object_id and af.task_id=:id;MESSAGEMORE_INFO
© Juan Luis Serradilla Amarilla y Francisco Fernández Martínez 12

Administración Avanzada de Oracle10g
The free space in the object is less than 10MB.Allocated Space:851968: Used Space:635874: Reclaimable Space :216094:
(Vamos a volver a otra tarea, pero ahora vamos a analizar el tablespace USERS completo)
SQL> set serveroutput on size 999999variable id number;begindeclarename varchar2(100) ;descr varchar2(500) ;objid number;beginname := '' ;descr := 'Segment Advisor Tablespace USERS' ;dbms_advisor.create_task('Segment Advisor', :id, name, descr, NULL) ;dbms_output.put_line('ID = ' || :id || ' Name = ' || name) ;dbms_advisor.create_object(name, 'TABLESPACE', 'USERS',NULL, NULL, NULL, objid);dbms_advisor.set_task_parameter(name, 'RECOMMEND_ALL', 'TRUE') ;dbms_advisor.set_task_parameter(name, 'VERBOSE', 'TRUE') ;dbms_advisor.execute_task(name) ;end ;end ;/
ID = 645 Name = TASK_645obj_type_id: 0 name: UNDEFINEDobj_type_id: 1 name: TABLE...Start loop through objectsObject Input schema: USERS name: type: 9 partname:Segment schema: SCOTT name: DEPT type: TABLE partname:Seg_list_key: SCOTT.DEPT..TABLETimelimit: 0 Time_remaining 86400 Time_since_start 1.302337Loading temp trendentering load_temp_trend: owner: SCOTT table: DEPT seg_type: TABLE part_name:lobcol: lobseg: lobpart: time_limit: 86400Finished loading temp trendStart fetch from temp trendused: 3886 alloc: 65536Segment schema: SCOTT name: EMP type: TABLE partname:Seg_list_key: SCOTT.EMP..TABLETimelimit: 0 Time_remaining 86400 Time_since_start 1.425444Loading temp trendentering load_temp_trend: owner: SCOTT table: EMP seg_type: TABLE part_name:lobcol: lobseg: lobpart: time_limit: 86400Finished loading temp trendStart fetch from temp trendused: 4398 alloc: 65536Segment schema: SCOTT name: BONUS type: TABLE partname:Seg_list_key: SCOTT.BONUS..TABLETimelimit: 0 Time_remaining 86400 Time_since_start 1.494528Loading temp trendentering load_temp_trend: owner: SCOTT table: BONUS seg_type: TABLEpart_name: lobcol: lobseg: lobpart: time_limit: 86400Finished loading temp trendStart fetch from temp trendused: 2048 alloc: 65536Segment schema: SCOTT name: SALGRADE type: TABLE partname:Seg_list_key: SCOTT.SALGRADE..TABLE
© Juan Luis Serradilla Amarilla y Francisco Fernández Martínez 13
Administración Avanzada de Oracle10g
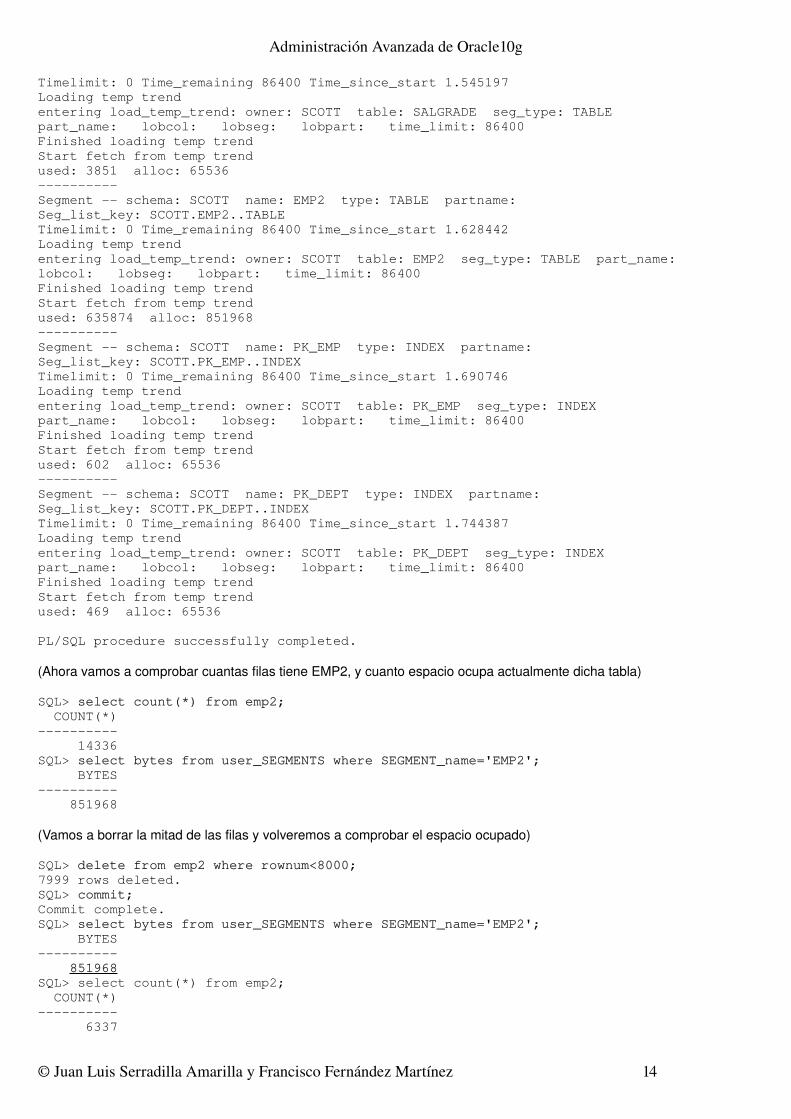
Timelimit: 0 Time_remaining 86400 Time_since_start 1.545197Loading temp trendentering load_temp_trend: owner: SCOTT table: SALGRADE seg_type: TABLEpart_name: lobcol: lobseg: lobpart: time_limit: 86400Finished loading temp trendStart fetch from temp trendused: 3851 alloc: 65536Segment schema: SCOTT name: EMP2 type: TABLE partname:Seg_list_key: SCOTT.EMP2..TABLETimelimit: 0 Time_remaining 86400 Time_since_start 1.628442Loading temp trendentering load_temp_trend: owner: SCOTT table: EMP2 seg_type: TABLE part_name:lobcol: lobseg: lobpart: time_limit: 86400Finished loading temp trendStart fetch from temp trendused: 635874 alloc: 851968Segment schema: SCOTT name: PK_EMP type: INDEX partname:Seg_list_key: SCOTT.PK_EMP..INDEXTimelimit: 0 Time_remaining 86400 Time_since_start 1.690746Loading temp trendentering load_temp_trend: owner: SCOTT table: PK_EMP seg_type: INDEXpart_name: lobcol: lobseg: lobpart: time_limit: 86400Finished loading temp trendStart fetch from temp trendused: 602 alloc: 65536Segment schema: SCOTT name: PK_DEPT type: INDEX partname:Seg_list_key: SCOTT.PK_DEPT..INDEXTimelimit: 0 Time_remaining 86400 Time_since_start 1.744387Loading temp trendentering load_temp_trend: owner: SCOTT table: PK_DEPT seg_type: INDEXpart_name: lobcol: lobseg: lobpart: time_limit: 86400Finished loading temp trendStart fetch from temp trendused: 469 alloc: 65536
PL/SQL procedure successfully completed.
(Ahora vamos a comprobar cuantas filas tiene EMP2, y cuanto espacio ocupa actualmente dicha tabla)
SQL> select count(*) from emp2; COUNT(*) 14336SQL> select bytes from user_SEGMENTS where SEGMENT_name='EMP2'; BYTES 851968
(Vamos a borrar la mitad de las filas y volveremos a comprobar el espacio ocupado)
SQL> delete from emp2 where rownum<8000;7999 rows deleted.SQL> commit;Commit complete.SQL> select bytes from user_SEGMENTS where SEGMENT_name='EMP2'; BYTES 851968SQL> select count(*) from emp2; COUNT(*) 6337
© Juan Luis Serradilla Amarilla y Francisco Fernández Martínez 14

Administración Avanzada de Oracle10g
(Y ahora vamos a compactar el segmento EMP2 y volveremos a comprobar el espacio ocupado)
SQL> alter table emp2 shrink space cascade;ERROR at line 1:ORA10636: ROW MOVEMENT is not enabledSQL> alter table emp2 enable row movement;Table altered.SQL> alter table emp2 shrink space cascade;Table altered.SQL> select count(*) from emp2; COUNT(*) 6337SQL> select bytes from user_SEGMENTS where SEGMENT_name='EMP2'; BYTES 327680
4.7. Probar UNDO ADVISOR. Vamos a probar las funciones q proporciona el paquete DBMS_UNDO_ADV, tanto para ver el estado actual del UNDO en nuestra BD, como para obtener estimaciones de qué tamaño debería tener nuestro tablespace de UNDO para el valor de undo_retention actual; y tb, en función de la query q más ha tardado, q undo_retention necesitariamos.
El UNDO automático se apoya sobre el parámetro undo_retention para saber durante cuanto tiempo debe intentar retener los datos de los segmentos de rollback (una vez q son candidatos a ser reutilizados). Por ejemplo, undo_retention=1800 significaría q queremos q se guarden los cambios registrados en el UNDO durante 1800 segundos (30 minutos), para ser usados por las lecturas simultáneas a las escrituras, y para operaciones de flashback.
(Primero vamos a ver cual es nuestro undo_tablespace, y cuanto vale undo_retention)
SQL> connect / as sysdbaSQL> show parameter undo_tablespace...undo_rbsSQL> show parameter undo_retention...900
(Ahora comprobamos el tamaño actual de nuestro undo_tablespace y vamos a ver cuál es el undo_retention q le cabe)
SQL> select bytes,AUTOEXTENSIBLE,INCREMENT_BY,MAXBYTES from dba_data_files where tablespace_name='UNDO_RBS'; BYTES AUT INCREMENT_BY MAXBYTES 20971520 YES 512 20971520SQL> SELECT DBMS_UNDO_ADV.best_possible_retention from dual;BEST_POSSIBLE_RETENTION 285
(Y vamos a ver cual es la query que más ha tardado, q por tanto nos marcaría el undo_retention máximo q necesitamos hasta el momento)
SQL> SELECT DBMS_UNDO_ADV.LONGEST_QUERY FROM DUAL;LONGEST_QUERY
© Juan Luis Serradilla Amarilla y Francisco Fernández Martínez 15

Administración Avanzada de Oracle10g
657SQL> select dbms_undo_adv.required_retention from dual;REQUIRED_RETENTION 657
(Y finalmente, vamos a ver q tamaño debería tener nuestro undo_tablespace para q le soporte el undo_retention actual)SQL> select dbms_undo_adv.required_undo_size(900) from dual;DBMS_UNDO_ADV.REQUIRED_UNDO_SI 53(Descarga dbms_undo_adv.sql de la web “http://cursos.atica.um.es/DBA10g2/anexos/ADDM/dbms_undo_adv.sql”, y ejecútalo en tu BD)
SQL> @dbms_undo_adv.sqlEstado actual del UNDOEl tablespace de UNDO actual es UNDO_RBS, de 20M,con autoextend activado, y sin garantia de retencion.El parametro undo_retention = 900
RecomendacionesUndo tablespace cannot support required undo retentionSize undo tablespace to 55 MBIncrease undo tablespace size so that long running queries will not fail
PL/SQL procedure successfully completed.
© Juan Luis Serradilla Amarilla y Francisco Fernández Martínez 16