
Practical research on effective use of simulation for HVAC...
8
Practical research on effective use of simulation for HVAC systems in the retro-commissioning process H. Tanaka 1 , S. Ito 2 , Y. Morikawa 3 , Y. Akashi 4 , and M. Yamaha 5 1 Campus Planning&Environment Management Office, Nagoya University, Nagoya, 464-8603, Japan 2 SANKI Engineering Co., Ltd., Akashicho, Chuo-ku, Tokyo, 104-8506, Japan 3 Kiuchi Construction Co., Ltd., kuniyoshida, Suruga-ku, Shizuoka, 422-8633, Japan 4 Graduate School of Engineering, The University of Tokyo, Hongo, Bunkyo-ku, Tokyo, 113-8656, Japan 5 College of Engineering, Chubu University, Kasugai, Aichi, 487-8603, Japan ABSTRACT This paper discusses a method and significance of utilizing simulations for HVAC systems in a retro-commissioning process. In the retro-commissioning project in this study, the performance of air-side HVAC systems were verified based on operational data derived from BEMS (Building Energy Management System) and short-term simple measurements. Also, system simulations were conducted for the air-side HVAC system with operational data to evaluate the effect of future retrofit. The LCEM tool was used to examine and simulate the effect of reducing the electricity consumed by fans by replacing air distribution system from CAV to VAV. The results indicate that VAV retrofitting may cut energy consumption by 52% in summer season, by 62% in winter on the entire typical office floor. The behavior of air-side HVAC system, and energy performance after retrofit improvement could be estimated by using system simulation based on actual operational data. KEYWORDS Retro-commissioning, System simulation, LCEM tool, Operational data, BEMS INTRODUCTION In the retro-commissioning process, if the actual operational data for HVAC system is obtained and saved by BEMS and the like, to suggest options for the system improvement on the ground of this operational data is very important task for the commissioning team. In addition, system simulation by using the operational data provides more reliable results for the suggestions. The application of this approach, there are some practical examples for the HVAC heat source system, but the application example for air-side HVAC system is extremely small. Therefore, the purpose of this study is to show a specific application example. 340
Transcript of Practical research on effective use of simulation for HVAC...

Practical research on effective use of simulation for HVAC systems
in the retro-commissioning process
H. Tanaka1, S. Ito2, Y. Morikawa3, Y. Akashi4, and M. Yamaha5
1 Campus Planning&Environment Management Office, Nagoya University, Nagoya,
464-8603, Japan 2 SANKI Engineering Co., Ltd., Akashicho, Chuo-ku, Tokyo, 104-8506, Japan 3 Kiuchi Construction Co., Ltd., kuniyoshida, Suruga-ku, Shizuoka, 422-8633, Japan 4 Graduate School of Engineering, The University of Tokyo, Hongo, Bunkyo-ku,
Tokyo, 113-8656, Japan 5 College of Engineering, Chubu University, Kasugai, Aichi, 487-8603, Japan
ABSTRACT This paper discusses a method and significance of utilizing simulations for HVAC
systems in a retro-commissioning process. In the retro-commissioning project in this
study, the performance of air-side HVAC systems were verified based on operational data derived from BEMS (Building Energy Management System) and short-term
simple measurements. Also, system simulations were conducted for the air-side
HVAC system with operational data to evaluate the effect of future retrofit. The LCEM tool was used to examine and simulate the effect of reducing the
electricity consumed by fans by replacing air distribution system from CAV to VAV.
The results indicate that VAV retrofitting may cut energy consumption by 52% in summer season, by 62% in winter on the entire typical office floor. The behavior of
air-side HVAC system, and energy performance after retrofit improvement could be
estimated by using system simulation based on actual operational data.
KEYWORDS Retro-commissioning, System simulation, LCEM tool, Operational data, BEMS
INTRODUCTION In the retro-commissioning process, if the actual operational data for HVAC system
is obtained and saved by BEMS and the like, to suggest options for the system
improvement on the ground of this operational data is very important task for the
commissioning team. In addition, system simulation by using the operational data provides more reliable results for the suggestions. The application of this approach,
there are some practical examples for the HVAC heat source system, but the
application example for air-side HVAC system is extremely small. Therefore, the purpose of this study is to show a specific application example.
340
AC-30 AC-30 AC-30 AC-30
AC-30
AC-30
AC-31 AC-30 AC-30 AC-30
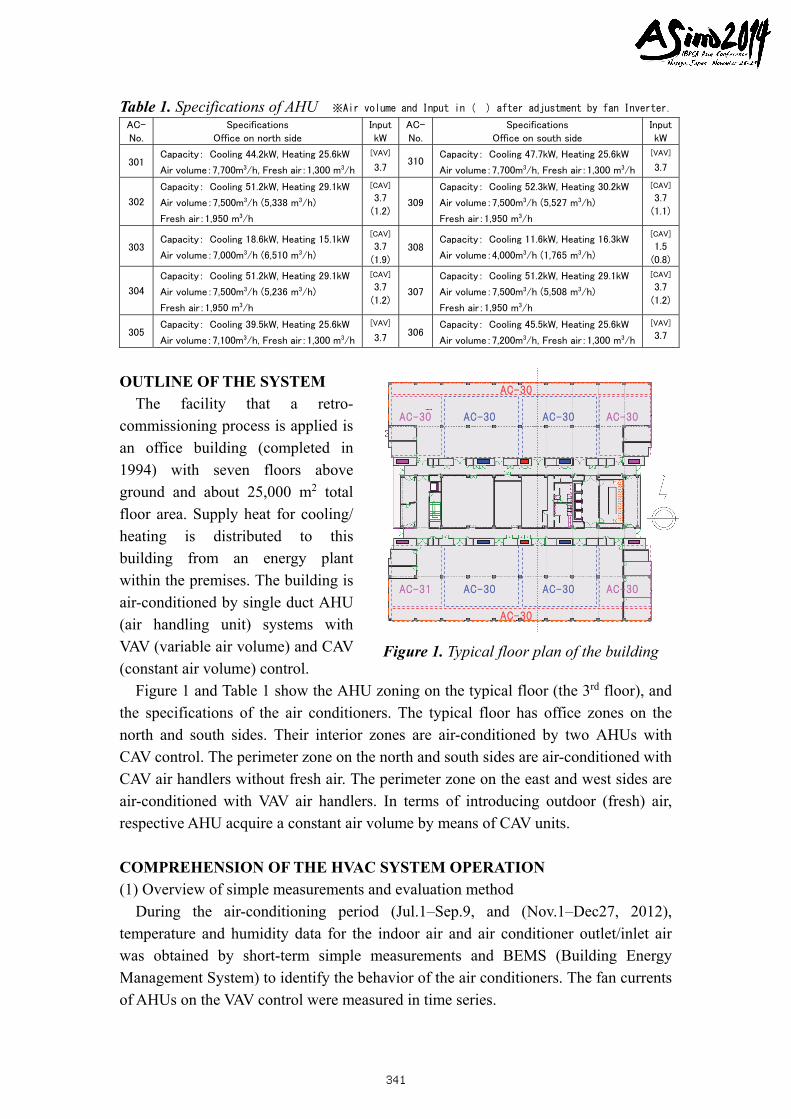
Figure 1. Typical floor plan of the building
Table 1. Specifications of AHU ※Air volume and Input in ( ) after adjustment by fan Inverter. AC-
No.
Specifications
Office on north side
Input
kW
AC-
No.
Specifications
Office on south side
Input
kW
301 Capacity: Cooling 44.2kW, Heating 25.6kW
Air volume:7,700m3/h, Fresh air:1,300 m3/h
[VAV]
3.7310
Capacity: Cooling 47.7kW, Heating 25.6kW
Air volume:7,700m3/h, Fresh air:1,300 m3/h
[VAV]
3.7
302
Capacity: Cooling 51.2kW, Heating 29.1kW
Air volume:7,500m3/h (5,338 m3/h)
Fresh air:1,950 m3/h
[CAV]
3.7
(1.2)309
Capacity: Cooling 52.3kW, Heating 30.2kW
Air volume:7,500m3/h (5,527 m3/h)
Fresh air:1,950 m3/h
[CAV]
3.7
(1.1)
303 Capacity: Cooling 18.6kW, Heating 15.1kW
Air volume:7,000m3/h (6,510 m3/h)
[CAV]
3.7
(1.9)308
Capacity: Cooling 11.6kW, Heating 16.3kW
Air volume:4,000m3/h (1,765 m3/h)
[CAV]
1.5
(0.8)
304
Capacity: Cooling 51.2kW, Heating 29.1kW
Air volume:7,500m3/h (5,236 m3/h)
Fresh air:1,950 m3/h
[CAV]
3.7
(1.2)307
Capacity: Cooling 51.2kW, Heating 29.1kW
Air volume:7,500m3/h (5,508 m3/h)
Fresh air:1,950 m3/h
[CAV]
3.7
(1.2)
305 Capacity: Cooling 39.5kW, Heating 25.6kW
Air volume:7,100m3/h, Fresh air:1,300 m3/h
[VAV]
3.7306
Capacity: Cooling 45.5kW, Heating 25.6kW
Air volume:7,200m3/h, Fresh air:1,300 m3/h
[VAV]
3.7
OUTLINE OF THE SYSTEM The facility that a retro-
commissioning process is applied is
an office building (completed in
1994) with seven floors above ground and about 25,000 m2 total
floor area. Supply heat for cooling/
heating is distributed to this building from an energy plant
within the premises. The building is
air-conditioned by single duct AHU (air handling unit) systems with
VAV (variable air volume) and CAV
(constant air volume) control. Figure 1 and Table 1 show the AHU zoning on the typical floor (the 3rd floor), and
the specifications of the air conditioners. The typical floor has office zones on the
north and south sides. Their interior zones are air-conditioned by two AHUs with CAV control. The perimeter zone on the north and south sides are air-conditioned with
CAV air handlers without fresh air. The perimeter zone on the east and west sides are
air-conditioned with VAV air handlers. In terms of introducing outdoor (fresh) air, respective AHU acquire a constant air volume by means of CAV units.
COMPREHENSION OF THE HVAC SYSTEM OPERATION (1) Overview of simple measurements and evaluation method
During the air-conditioning period (Jul.1–Sep.9, and (Nov.1–Dec27, 2012),
temperature and humidity data for the indoor air and air conditioner outlet/inlet air was obtained by short-term simple measurements and BEMS (Building Energy
Management System) to identify the behavior of the air conditioners. The fan currents
of AHUs on the VAV control were measured in time series.
341
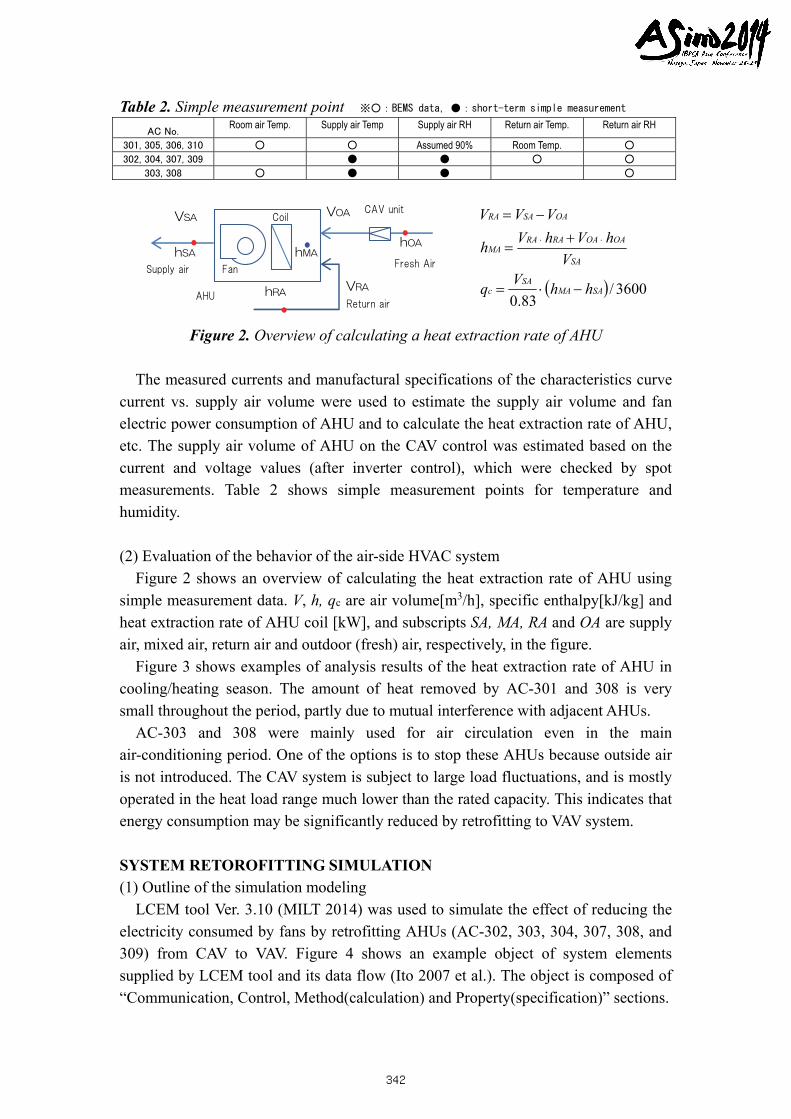
Table 2. Simple measurement point ※○:BEMS data,●:short-term simple measurement
AC No. Room air Temp. Supply air Temp Supply air RH Return air Temp. Return air RH
301, 305, 306, 310 ○ ○ Assumed 90% Room Temp. ○
302, 304, 307, 309 ● ● ○ ○
303, 308 ○ ● ● ○
3600/83.0
SAMASA
c
SA
OAOARARAMA
OASARA
hhV
q
V
hVhVh
VVV
Figure 2. Overview of calculating a heat extraction rate of AHU
The measured currents and manufactural specifications of the characteristics curve
current vs. supply air volume were used to estimate the supply air volume and fan electric power consumption of AHU and to calculate the heat extraction rate of AHU,
etc. The supply air volume of AHU on the CAV control was estimated based on the
current and voltage values (after inverter control), which were checked by spot measurements. Table 2 shows simple measurement points for temperature and
humidity.
(2) Evaluation of the behavior of the air-side HVAC system
Figure 2 shows an overview of calculating the heat extraction rate of AHU using
simple measurement data. V, h, qc are air volume[m3/h], specific enthalpy[kJ/kg] and heat extraction rate of AHU coil [kW], and subscripts SA, MA, RA and OA are supply
air, mixed air, return air and outdoor (fresh) air, respectively, in the figure.
Figure 3 shows examples of analysis results of the heat extraction rate of AHU in cooling/heating season. The amount of heat removed by AC-301 and 308 is very
small throughout the period, partly due to mutual interference with adjacent AHUs.
AC-303 and 308 were mainly used for air circulation even in the main air-conditioning period. One of the options is to stop these AHUs because outside air
is not introduced. The CAV system is subject to large load fluctuations, and is mostly
operated in the heat load range much lower than the rated capacity. This indicates that energy consumption may be significantly reduced by retrofitting to VAV system.
SYSTEM RETOROFITTING SIMULATION (1) Outline of the simulation modeling
LCEM tool Ver. 3.10 (MILT 2014) was used to simulate the effect of reducing the
electricity consumed by fans by retrofitting AHUs (AC-302, 303, 304, 307, 308, and 309) from CAV to VAV. Figure 4 shows an example object of system elements
supplied by LCEM tool and its data flow (Ito 2007 et al.). The object is composed of
“Communication, Control, Method(calculation) and Property(specification)” sections.
hOA hSA
VSA
hMA
hRA
VOA
VRA AHU
Fan
Coil CAV unit
Fresh Air
Return air
Supply air
342

Figure 3-(a). Heat extraction rate of AHU in cooling season
Figure 3-(b). Heat extraction rate of AHU in heating season
Each object exchanges information with only the neighboring objects on both sides. In this process, the objects calculate the output(s) based on an energy balance
calculation. The calculation adopts a static simulation and its time step is one hour.
Regarding the AHU fans, each P-Q characteristic curve (air volume vs static pressure) and motor efficiency are refracted to the fan object. And pressure and power consumption of fan are calculated under supply air volume (B) as shown in Figure 5.
‐100
‐75
‐50
‐25
0
11/1
11/6
11/11
11/16
11/21
11/26
12/1
12/6
12/11
12/16
12/21
12/26
Hea
t ext
ract
ion
rate
of A
HU
(kW
)
0
5
10
11/1
11/6
11/11
11/16
11/21
11/26
12/1
12/6
12/11
12/16
12/21
12/26
Air Volum
e ×1000 (㎥
/h)
0
5
10
11/1
11/6
11/11
11/16
11/21
11/26
12/1
12/6
12/11
12/16
12/21
12/26
Air Volum
e ×1000 (㎥
/h)
‐100
‐75
‐50
‐25
0
11/1
11/6
11/11
11/16
11/21
11/26
12/1
12/6
12/11
12/16
12/21
12/26
Hea
t ext
ract
ion
rate
of A
HU
(kW
)
0
5
10
7/1
7/6
7/11
7/16
7/21
7/26
7/31 8/5
8/10
8/15
8/20
8/25
8/30 9/4
9/9
Air Volum
e ×1000 (㎥
/h)
0
25
50
75
100
7/1
7/6
7/11
7/16
7/21
7/26
7/31
8/5
8/10
8/15
8/20
8/25
8/30
9/4
9/9
Hea
t ext
ract
ion
rate
of A
HU
(kW
)
0
5
10
7/1
7/6
7/11
7/16
7/21
7/26
7/31 8/5
8/10
8/15
8/20
8/25
8/30 9/4
9/9
Air Volum
e ×1000 (㎥
/h)
0
25
50
75
100
7/1
7/6
7/1
1
7/1
6
7/2
1
7/2
6
7/3
1
8/5
8/1
0
8/1
5
8/2
0
8/2
5
8/3
0
9/4
9/9
Hea
t ext
ract
ion
rate
of A
HU
(kW
)
Heat extraction rate of AHU coil [kW] Cooling Capacity [kW] Supply air volume [m3/h] Return air volume [m3/h]
【AC-301:VAV】 【AC-302:CAV】
【AC-304:CAV】 【AC-308:CAV】
Heat extraction rate of AHU coil [kW] Heating Capacity [kW] Supply air volume [m3/h] Return air volume [m3/h]
【AC-301:VAV】 【AC-302:CAV】
【AC-304:CAV】
【AC-308:CAV】
343

Figure 4. Example of Object (Cooling Tower)
Figure 5. The model of fan control
Figure 6. AHU system diagram of LCEM tool
(2) Assumption and boundary condition
In this simulation, it is supposed that each AHU meets the same
thermal load after retrofitting from
CAV to VAV control. In the LCEM tool, objects were connected as
shown in Figure 6 to develop a
modeling of the AHU systems. The cooling/heating water coil
objects used in the simulation were
selected from LCEM tool that are close to actual coil specifications.
The air conditioner fan specific-
ations were checked for the P-Q characteristics of AHU fans, and
were used for the fan modeling. The
minimum supply air volume of AHU was set to each outdoor
(fresh) air volume.
The boundary conditions are as follows: cooling/heating water coil
inlet water temperature: 7°C/45°C,
air supply temperature: 16°C/30°C (based on the actual situation),
outdoor air temperature and relative
humidity: actual measurement values, room heat load: calculation values based on actual measurements, room reference temperature and humidity: actual room
temperature and humidity derived from central monitoring.
The room sensible/latent heat load and room reference temperature and humidity are given as boundary conditions based on actual measurements (room temperature
and humidity, supply air temperature and humidity, and supply air volume). The
outdoor air heat load is added to the coil load calculated by the introduced outdoor air volume and its air temperature and humidity by time of day.
WB Temp. [℃] 16.4 ON/OFF()ON=1, OFF=0) 1 ON/OFF()ON=1, OFF=0) 1
Water Flow Rate [l/min] 2,000 Water Flow Rate [l/min] 2,000
Outlet Water Temp. [℃] 28.0 Supply Cooling W Temp. [℃] 28.0
Inlet Water Temp. [℃] 37.0 Return Cooling W Temp. [℃] 37.0
WB Temp [℃] 16.4
Cooling Water SP [℃] 28.0
Ratio of Water Flow [%] 100
TD Sim [℃] 16.4
Fan Powe [kW] 1.8
Outlet Water Temp. [℃] 28.0
ERROR good
Fan Power DP(kW) 4.0
Water Flow Rate DP [l/min] 2,000
Adjustment Paramete a 1.0
Adjustment Paramete b 0.0
SPECIFICATION
Outside Air Cooling Tower Cooling pump
CONTROL
Air Volume [×1000 m3/h]
B: Required Volume
A⇒C :CAV
A⇒D :VAV (P=const.)
A⇒E :VAV (P∝Q2.)
INPUT: INPUT:
supply water temp. fresh air volume
outdoor air condition INPUT:
room heat load
ref. temp.& RH
AC on-off
OUTPUT: OUTPUT: OUTPUT:
return water temp. heat extraction rate fan power
supply water volume air state static pressure
supply water
boundary
cooling/heating coil
OBJ
AHU unit(humidifier)
OBJ
fan (supply, return)
OBJ ductOBJ
outdoor airboundary
AHU unit(fresh air)
OBJ
VAV・CAVunitOBJ
roomboundary
344

RESULTS AND DISCUSSION Figure 7 shows the results of retrofitting CAV systems to VAV systems for the
typical office floor, and Figure 8 shows the details of system behavior. Table 3 shows
ATF (Air Transport Factor: indoor sensible heat load/electric power consumption by
fans) calculation results before and after retrofitting, based on actual measurements and simulation results.
The results indicate that VAV retrofitting may cut energy consumption by 52% in
cooling season, by 62% in heating season on the entire typical office floor. ATF was improved more than double from 8 (at present) to 16 in summer, from 5 (at present) to
18 in winter. In particular, a large effect was obtained in winter.
Also note that it is assumed that the operation of AC-303 and 308 are stopped in winter, because heat extraction rate of these AHUs have been almost zero during
heating season in actual operation. Therefore, their ATFs have been hidden in Table 3.
In addition, energy efficiency can be improved by stopping the AC303 and 308, but there is the potential for a negative effect on the indoor air quality and the temperature
distribution.
CONCLUSION AND IMPLICATIONS The behavior and the performance of the air-side HVAC system could be verified
using operation data derived from BEMS and short-term easy measurements.
Table 3. ATF(Air Transport Factor) of AHU Cooling season: Heating season:
AC No. 301 302 303 304 305 306
Actual 7.5 12.8 3.2 1 18.2 21.1
Retrofit 7.5 18.6 18.9 3.4 18.2 21.1
AC No. 307 308 309 310
Actual 6.6 0.5 15.2 17.4
Retrofit 17 39.8 15.9 17.4
entire floor
8
16.2
AC No. 301 302 303 304 305 306
Actual 0.7 10.5 3.6 4.2 3.0 1.4
Retrofit 0.7 17.9 - 12.9 3.0 1.4
AC No. 307 308 309 310
Actual 4.2 11.1 7.0 62.5
Retrofit 11.2 - 15.3 62.5
entire floor
6.4
17.7
※AC301,305,306 and 310 are VAV system already, their ATF is the same value before and after retrofitting
Figure 7. Seasonal electric power consumption of AHU fans
0
5
10
15
20
25
30
1 2
Fan
Pow
er
consu
mpt
ion (
MW
h)
Nov. 1~ Dec. 31
Reduction rate62%
AC301AC302
AC303
AC304AC305
AC306AC307
AC308
AC309AC310
8.49
22.31
0
5
10
15
20
25
30
35
40
45
50
CAV合計 VAV合計
Fan
Pow
er
consu
mpt
ion (
MW
h)
Jul. 1~ Sep. 10
AC301AC302
AC303
AC304
AC305AC306AC307
AC308
AC309
AC310
20.01
40.44
Reduction rate49%
Actual condition Retrofit simulation Actual condition Retrofit simulation
345

AC-302 AC-303
AC-304 AC-308
Figure 8-(a). Room heat load and hourly power consumption of AHU fans in summer
For a VAV system, it can grasp the behavior of system operation such as fluctuation of
supply air volume, heat extraction rate of AHU and so on.
With a view to employing VAV for air-side HVAC systems to improve operations, it was demonstrated that system simulation by using the actual operational data
provides more reliable results for the suggestions of the improvement.
ACKNOWLEDGEMENTS The results of this study, it is part of the outcomes of the research committee for an
applications of commissioning process (Building Services Commissioning Association, BSCA in JAPAN). I gratefully acknowledge helpful discussion with the
committee on several points in this paper.
0
10
20
30
40
50
7/1
7/6
7/11
7/16
7/21
7/26
7/31
8/5
8/10
8/15
8/20
8/25
8/30
9/4
9/9
D.B
. Air te
mp.(
℃)
Return Air R.H. Return Air Temp.
0
20
40
60
80
100
7/1
7/6
7/11
7/16
7/21
7/26
7/31
8/5
8/10
8/15
8/20
8/25
8/30
9/4
9/9
Room
heat
load
(kW
) , R
H(%
)sensible heat latent heat
0
0.5
1
1.5
2
2.5
3
3.5
4
7/1
7/6
7/11
7/16
7/21
7/26
7/31
8/5
8/10
8/15
8/20
8/25
8/30
9/4
9/9
Fan
pow
er
consu
mpt
ion(k
W)
CAV
VAV
0
0.5
1
1.5
2
2.5
3
3.5
4
7/1
7/6
7/11
7/16
7/21
7/26
7/31
8/5
8/10
8/15
8/20
8/25
8/30
9/4
9/9
Fan
pow
er c
onsu
mptio
n(kW
)
rated value
0
10
20
30
40
50
7/1
7/6
7/11
7/16
7/21
7/26
7/31
8/5
8/10
8/15
8/20
8/25
8/30
9/4
9/9
D.B
. Air te
mp.(
℃)
Return Air R.H. Return Air Temp.
0
20
40
60
80
100
7/1
7/6
7/11
7/16
7/21
7/26
7/31
8/5
8/10
8/15
8/20
8/25
8/30
9/4
9/9
Room
heat
load
(kW
) , R
H(%
)
latent heat sensible heat
0
0.5
1
1.5
2
2.5
3
3.5
4
7/1
7/6
7/11
7/16
7/21
7/26
7/31
8/5
8/10
8/15
8/20
8/25
8/30
9/4
9/9
Fan power consumption(kW
)
CAV VAV
0
0.5
1
1.5
2
2.5
3
3.5
4
7/1
7/6
7/11
7/16
7/21
7/26
7/31
8/5
8/10
8/15
8/20
8/25
8/30
9/4
9/9
Fan
pow
er c
onsu
mptio
n(kW
)
rated value
346

AC-302 AC-303
AC-304 AC-308
Figure 8-(b). Room heat load and hourly power consumption of AHU fans in winter
REFERENCES MILT (Ministry of Land, Infrastructure, Transport and Tourism, Japan), 2014. Life
Cycle Management Tool Ver.3.10 (http://www.mlit.go.jp/gobuild/sesaku_lcem
_lcem.html )
M.Ito, Y.Sugihara et al., Development of HVAC system simulation tool for life cycle
energy management, Part 1: Outline of the developed simulation tool for life cycle energy management, Part 2: Development of component models for HVAC
equipment, Proceedings of Building Simulation 2007, pp.1610-1622, 2007
0
10
20
30
40
50D
.B. A
ir tem
p.(℃
)
Return Air R.H. Return Air Temp.
0
20
40
60
80
100R
oom
heat
load
(kW
) , R
H(%
)
sensible heat
0
0.5
1
1.5
2
2.5
3
3.5
4
11/1
11/3
11/5
11/7
11/9
11/11
11/13
11/15
11/17
11/19
11/21
11/23
11/25
11/27
11/29
12/1
12/3
12/5
12/7
12/9
12/11
12/13
12/15
12/17
12/19
12/21
12/23
12/25
12/27
Fan
pow
er
consu
mpt
ion(k
W)
CAV VAV
0
0.5
1
1.5
2
2.5
3
3.5
4
11/1
11/3
11/5
11/7
11/9
11/11
11/13
11/15
11/17
11/19
11/21
11/23
11/25
11/27
11/29
12/1
12/3
12/5
12/7
12/9
12/11
12/13
12/15
12/17
12/19
12/21
12/23
12/25
12/27
Fan
pow
er c
onsu
mptio
n(kW
)
rated value
0
10
20
30
40
50
D.B. A
ir temp.(℃
)
Return Air R.H. Return Air Temp.
0
20
40
60
80
100
Room
heat
load
(kW
) , R
H(%
)
sensible heat
0
0.5
1
1.5
2
2.5
3
3.5
4
11/1
11/3
11/5
11/7
11/9
11/11
11/13
11/15
11/17
11/19
11/21
11/23
11/25
11/27
11/29
12/1
12/3
12/5
12/7
12/9
12/11
12/13
12/15
12/17
12/19
12/21
12/23
12/25
12/27
Fan power consumption(kW
)
CAV VAV
0
0.5
1
1.5
2
2.5
3
3.5
4
11/1
11/3
11/5
11/7
11/9
11/11
11/13
11/15
11/17
11/19
11/21
11/23
11/25
11/27
11/29
12/1
12/3
12/5
12/7
12/9
12/11
12/13
12/15
12/17
12/19
12/21
12/23
12/25
12/27
Fan
pow
er c
onsu
mptio
n(kW
)
rated value
347


![[O] cOmpaniessavarinocompanies.com/content/documents/bids... · hvac general notes hvac abbreviations hvac ductwork symbols hvac control symbols chaintreuil jensen stark architectural](https://static.fdocuments.us/doc/165x107/5ae5a13f7f8b9a29048c7dfa/o-compan-general-notes-hvac-abbreviations-hvac-ductwork-symbols-hvac-control-symbols.jpg)