Practical EMI Troubleshooting - Testforce · Overview EMI/EMC Definitions –Radiated and Conducted...
33
Practical EMI Troubleshooting Robin Jackman Application Engineer
Transcript of Practical EMI Troubleshooting - Testforce · Overview EMI/EMC Definitions –Radiated and Conducted...

Practical EMI Troubleshooting
Robin JackmanApplication Engineer

Overview
� EMI/EMC Definitions– Radiated and Conducted Emissions
– Pre-compliance vs. compliance
– Basic configurations
� Pre-Compliance Scanning– Instrument Architectures
– FFT-based Spectrum Analysis
– Visibility and Speed
� Debugging EMI Issues– Correlation of EMI to other signals and events
– Measuring RF power
– Near field vs. far field
� Summary
2

EMI/EMC Definitions
� EMI Specifications– Country/Region specific
– FCC, IC, EU
– Industry specific– Manufacturer
– Military
� Conducted Emissions– Unwanted signals coupled to AC mains
– 9 kHz to 30 MHz
� Radiated Emissions– Unwanted signals broadcast from DUT
– 30 MHz to 6 GHz
� Susceptibility/Immunity– Region dependent
3
Conducted Measurements
– EMI receiver– CISPR 16-1-1
– Software
– Line Impedance Stabilization Network (LISN)– Isolate DUT from mains
– Limiter– Front end protection for instrument
4

Radiated Measurements
– EMI receiver– CISPR 16-1-1
– EMI software
– RF Isolation– Characterized anechoic chamber
– Open-air test site
– Turntable
– Antenna’s
– Characterize emissions 360◦ around DUT
5

EMI Characterization
� Compliance Measurements � Test House
– Often used to avoid expense of setting up in-house lab
– Expensive – “one time” expense ?
– Time consuming– How full is the schedule ?
– Will report an EMI failure, but not where in the design it came from
� Pre-Compliance Measurements � In House
– Test for EMI issues throughout the design process
– Catch problems early, before them become bigger later
– You still need to go to a EMI test house
– Scanning doesn’t have to take a long time !
� EMI Pre-Compliance testing will save time/money by identifying
problem areas before they become expensive re-design issues
6

EMI Pre-Compliance Scanning
� Substitute spectrum/signal analyzer for EMI receiver– RBW (shape factor) - # Trace Points
– Dwell Time - Detectors (CISPR ?)
– Antenna factor ( ≠ equal gain)
� Antenna requirements– Biconical - Pre-amp
– Log-periodic - Tripod
� No chamber or test site ?– Boardroom - Parking garage
� It is very difficult to completely duplicate EMI lab conditions – We are making an accurate approximation
– Understand the compromises in the measurements
– Pay attention to detail as much as possible
7
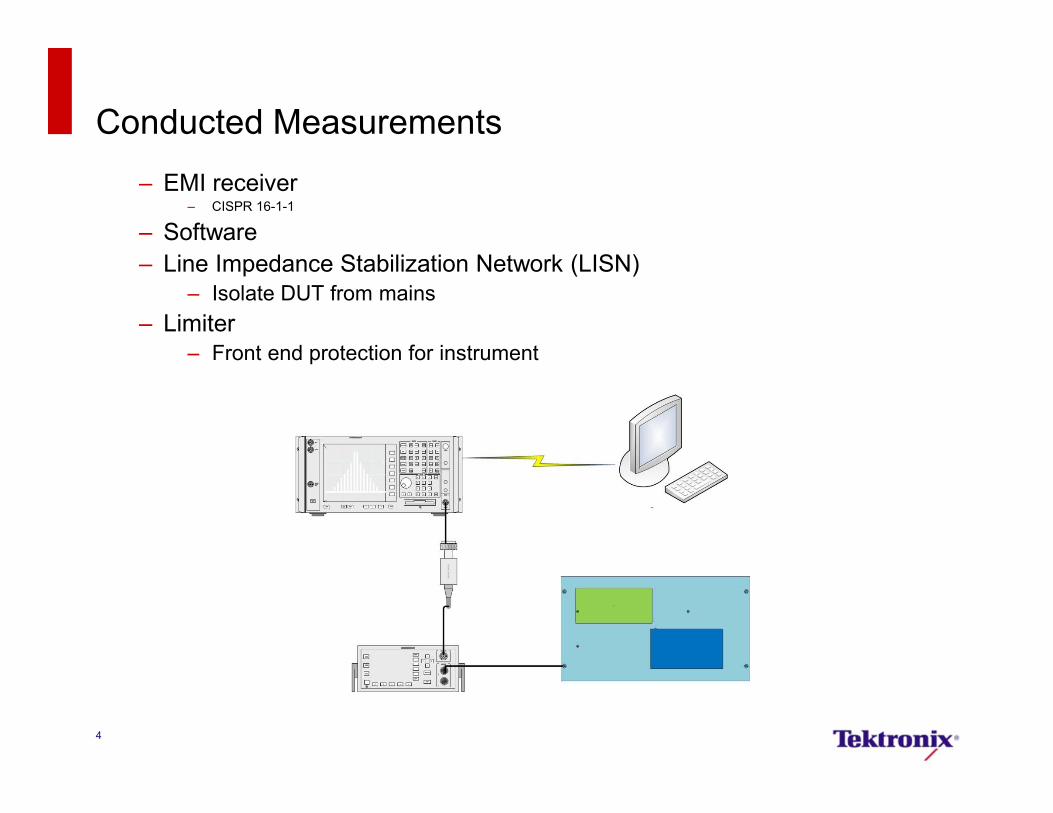
Swept-Tune Spectrum Analyzer
• Traditional architecture • Basic triggers• Good dynamic range• Good sensitivity • Single measurement domain
• Frequency vs. Amplitude• Amplitude vs. time
• Models available across a wide price/performance range

Real Time Spectrum Analyzer
•Wide capture bandwidth – not RBW limited•Advanced triggers•High speed spectrum measurements•Good dynamic range•Good sensitivity•Correlated measurement domains
• Frequency,Amplitude,Phase vs. Time• At the same time
•Models available across broad price/performance range

Scope Block Diagram
10
Amp A/DAcquisition
Memory
Micro-processor
DisplayMemory Display
•Wide capture bandwidth•Large selection probes •Advanced triggers•Limited RBW•Limited detectors•Limited dynamic range•Limited sensitivity•High resolution for low frequency operation (< 1 MHz)•Models available across broad price/performance range
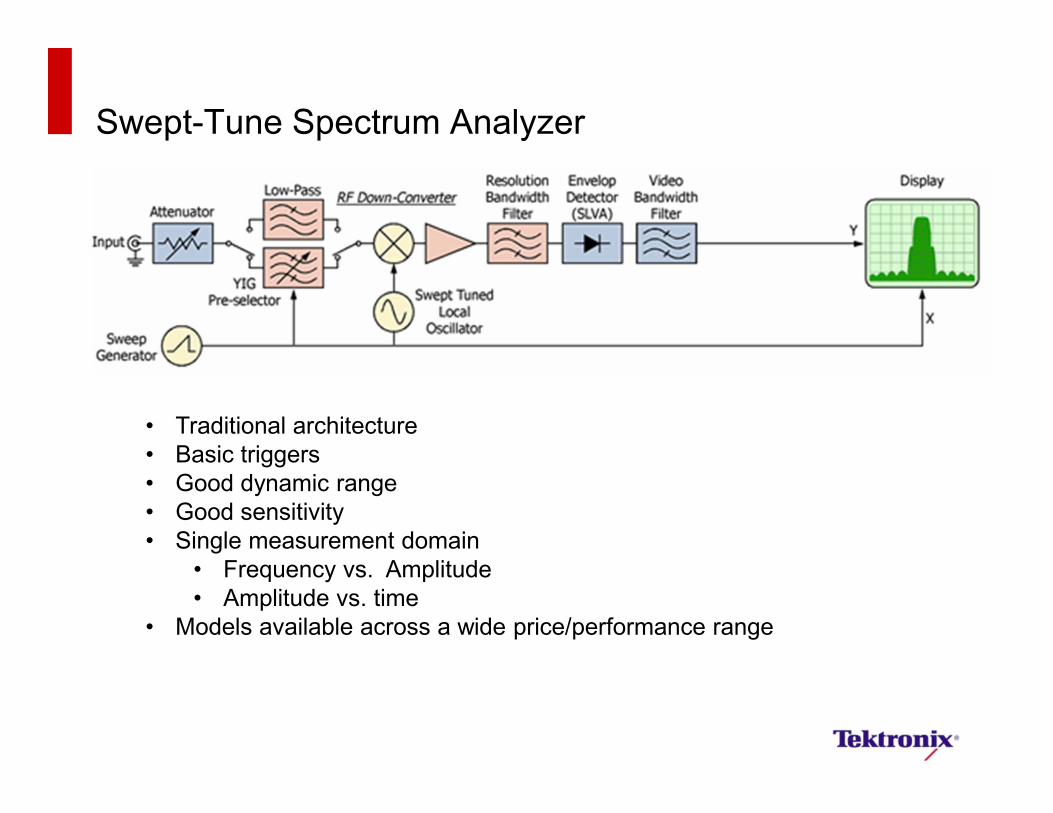
Spectrum Analyzer Sweep Speed
� Swept Spectrum Analyzers– Speed varies with square of RBW
� FFT Spectrum Analyzers– Speed varies with RBW
� Cross-over is between100kHz and 30kHz
� FFT Analyzers are typicallydramatically faster when RBW < 30kHz
� Remember:
– Dwell time is required for EMI
detectors
– EMI Rx & SA do NOT sweep the
same way
11
FFT Update Rate X times faster than Swept Spectrum Analyzers
Examples:1GHz SPAN with 10kHz RBW
Swept: 25 secondsFFT: 2.6 seconds
200MHz SPAN, with 1kHz RBW
Swept: 500 secondsFFT: 5.2 seconds

Spectrum Analyzer Sweep Speed
� EMI Detector types– EMI-Peak (or Peak)
– Worst case
– Safest detector
– EMI-Average– Incorporates dwell
– ~100ms common
– EMI-Quasi-Peak– Incorporates dwell
– ~1second
– VERY long sweep time
� Filter Shape Factor – EMI RBW More selective
12
s1 s2 s3 s4 s5 s6 s6 s8 s1 s2 s3 s4 s5 s6 s6 s8
negative peaksample
positive peak
pixel n( samples)
pixel n+1(samples)

Example: Pre-Compliance Scan � Tektronix RTSA
� 30 MHz – 26.5 GHz
� 41604 Trace Points
� ~ 15s (CISPR Peak)
13
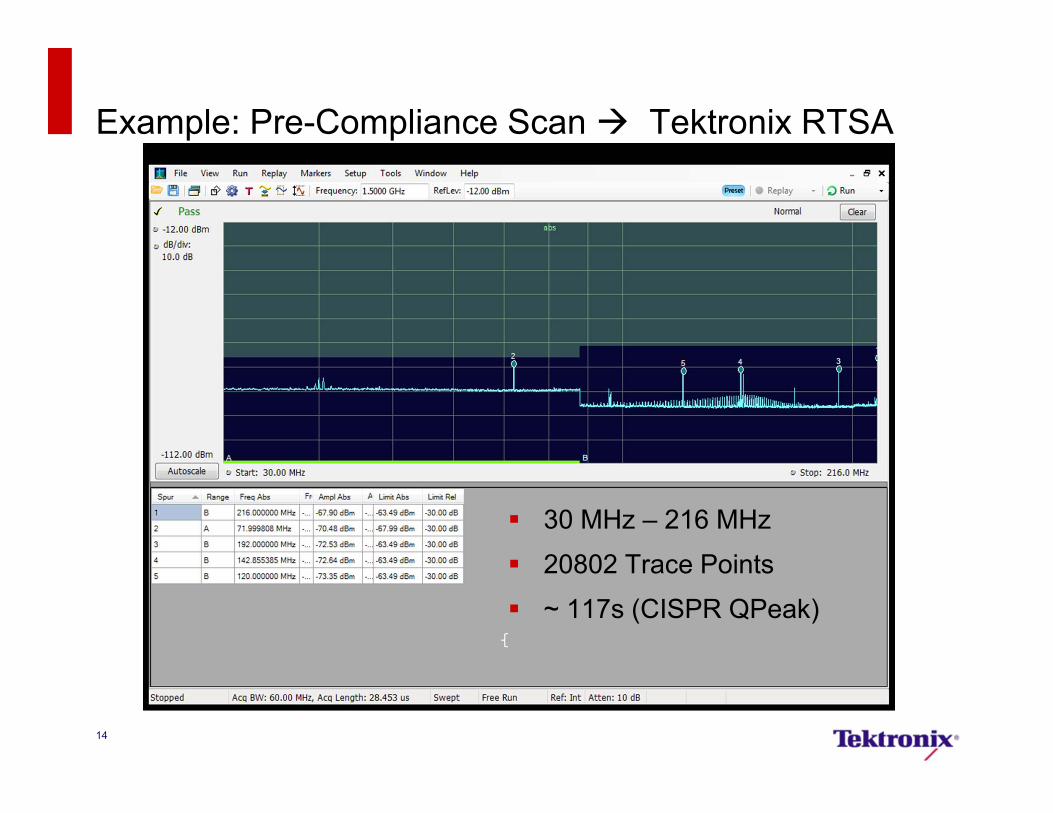
Example: Pre-Compliance Scan � Tektronix RTSA
� 30 MHz – 216 MHz
� 20802 Trace Points
� ~ 117s (CISPR QPeak)
14

Example: Sub-Ranging � Tektronix Basic SA
� Break Scan Into Ranges
� 30 MHz – 88 MHz
� 1001 Trace Points
� ~ 1s (Peak)
15
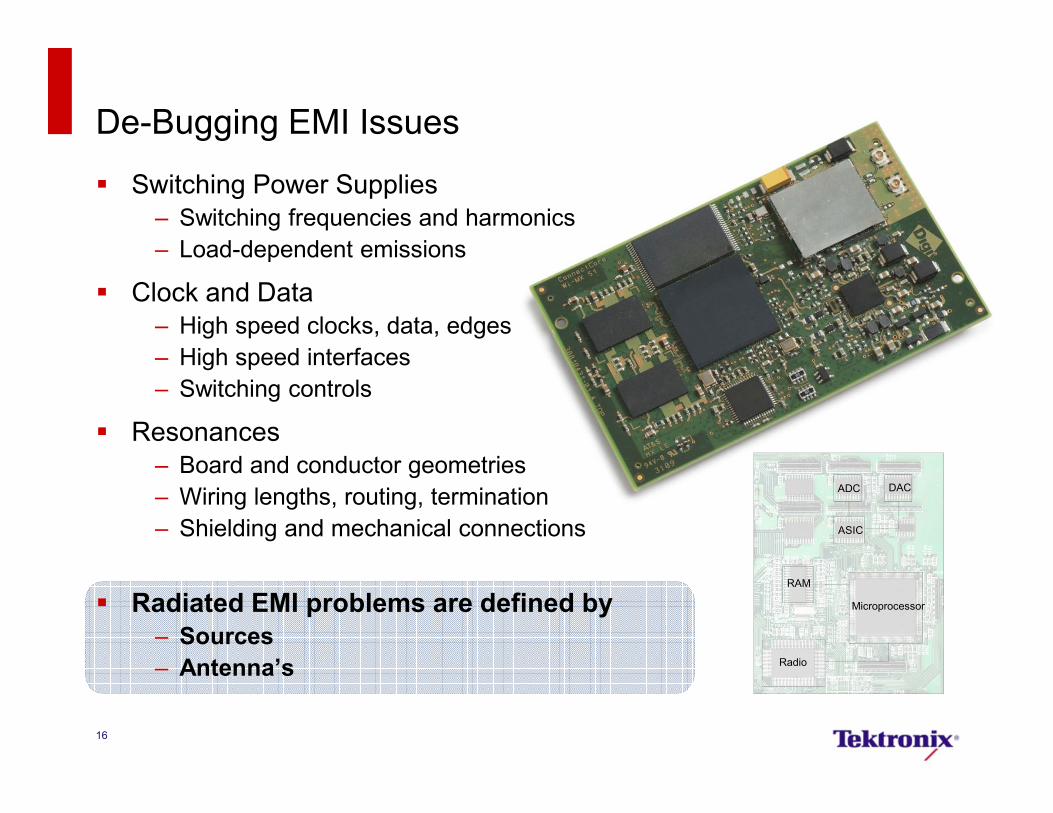
De-Bugging EMI Issues
� Switching Power Supplies– Switching frequencies and harmonics
– Load-dependent emissions
� Clock and Data– High speed clocks, data, edges
– High speed interfaces
– Switching controls
� Resonances– Board and conductor geometries
– Wiring lengths, routing, termination
– Shielding and mechanical connections
� Radiated EMI problems are defined by
– Sources
– Antenna’s
16
WLAN
Microprocessor
Radio
RAM
ADC DAC
ASIC

De-Bugging EMI Issues � Near Field Probing
� E-Field – Stub
– High voltage, low current source
– Max sensitivity perpendicular to source
� H-Field – Loop
– Low voltage, high current source
– Max sensitivity parallel to source
� Isolate sources of energy
� Measure relative changes
� Be Careful
17

De-Bugging EMI Issues � New Tools
� MDO4000 Mixed Domain Oscilloscope
– Combines – Spectrum Analyzer
– Oscilloscope
– Basic Logic Analyzer
– 21 Inputs ALL TIME CORRELATED
� Discrete Fourier Transform Analyzer– Dedicated HW : 50kHz-3/6GHz
– Digital down converter
– Sensitive/wide band
– Record length
� Spectrum Analysis &– Spectrogram
– AM/FM/PM
– Voltage
– Current
– Logic18

TriggerGLOBAL
Acquisition
Control
common
SR and RL
on
Analog
Memory
A/D A/D A/D A/D
Computation
& Display
independent
SR and RL
on RF
Memory
A/D
10GSs
DDC
I Q
Computation
& Display
Dedicated Hardware Optimized for Analog & RF
BlockDownconverter
����

20
Time Correlated Multi-Domain Display
� The amount of time captured in the top is referred to as Analog Time
� The orange bar is referred to as Spectrum Time
� The orange bar indicates the time period for the spectrum from RF input
Tim
e Domain
Frequency Domain
Analog Time
Spectrum Time

Time Correlated Multi-Domain Display
� Simple Radio– SPI bus turns on the
transmitter
– PLL voltage controls frequency
– Watch as radio turns on and changes channel
21

22
Example: Switch Mode Power Supply
� RF : P6158
� DC-DC converter output
� Spectrogram shows PSD over time
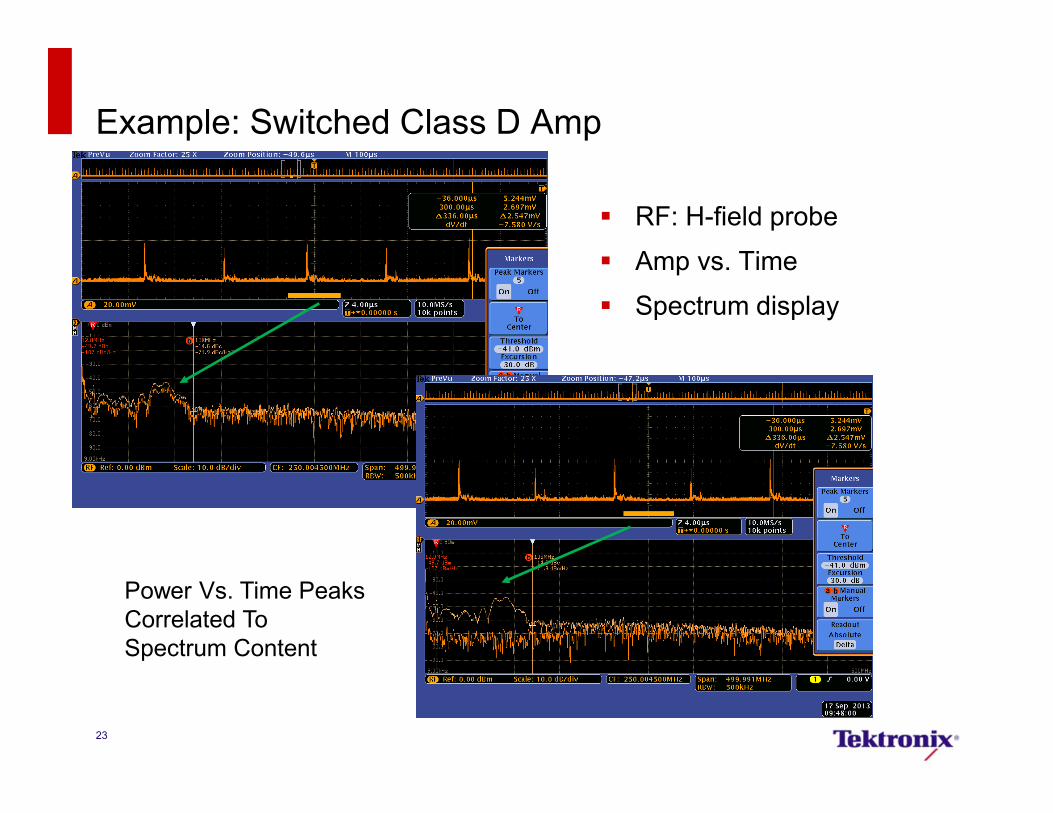
Example: Switched Class D Amp
� RF: H-field probe
� Amp vs. Time
� Spectrum display
23
Power Vs. Time Peaks Correlated To Spectrum Content

Example: Switched Class D Amp
� RF: H-field probe
� Ch1 = Switch signal (HR)
� Spectrum
� Direct Correlation
24
Spectrum Peaks On Rising/Falling Edges Of Switch Control

Example: USB Interference
� RF: H-field probe (USB cable interface)
� CH1: USB HS line
� Direct Correlation
25
Narrow & Broad level changes
Spectral peak occurs during burst

EMI Diagnostics � Tektronix MDO4000
� Spectrum Analyzer– Far field antennas
– Near Field RF Probes
– Passive Probes– 50ohm and Z0 divider probes
– Active Probes– Single-ended and differential
– Current probes
� Oscilloscope analog channels– Wideband passive high-Z probes
– (all of the above)
� Digital channels– Integrated digital probe
26
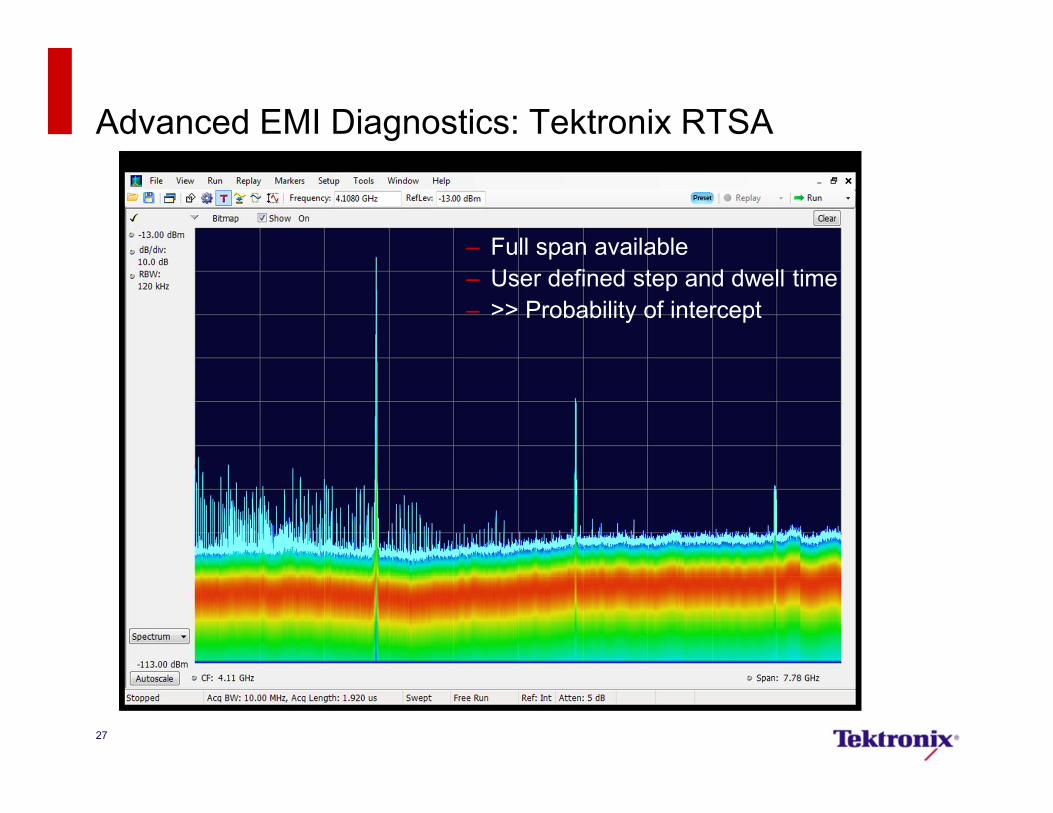
Advanced EMI Diagnostics: Tektronix RTSA
27
– Full span available
– User defined step and dwell time
– >> Probability of intercept

Advanced EMI Diagnostics: Tektronix RTSA
28
� Parallel spectrum engines
� Fast & Wide DPX
� Narrow & Deep
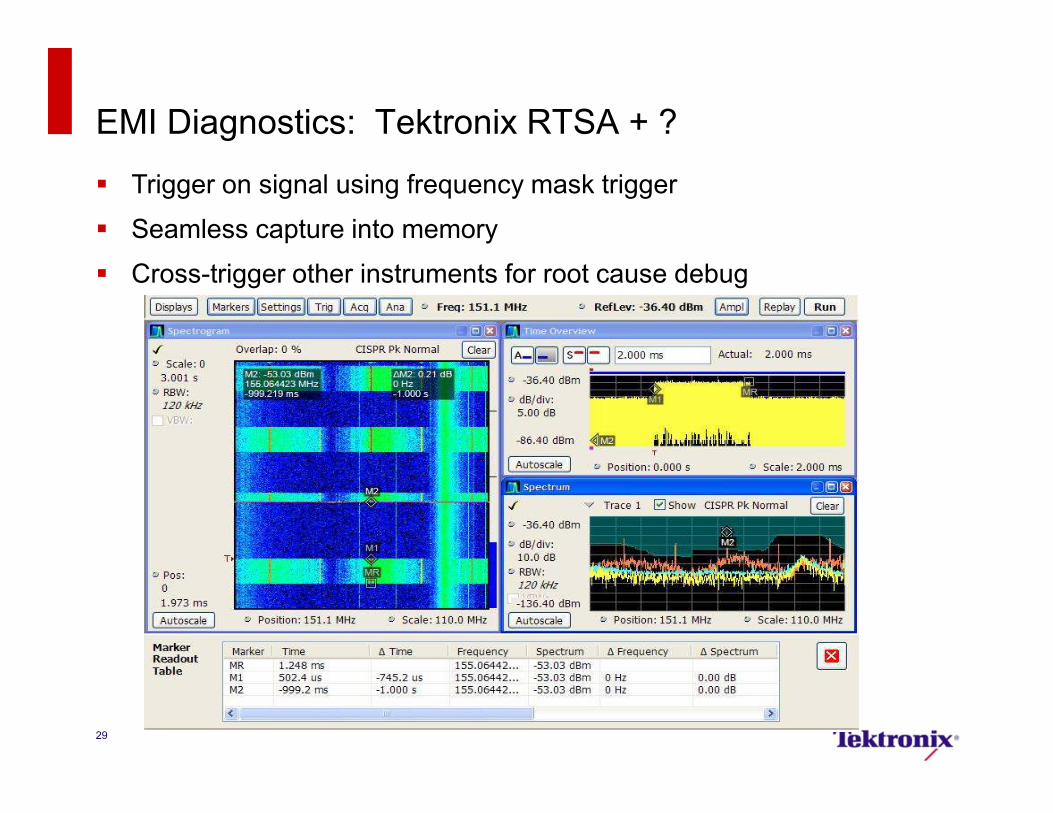
EMI Diagnostics: Tektronix RTSA + ?
29
� Trigger on signal using frequency mask trigger
� Seamless capture into memory
� Cross-trigger other instruments for root cause debug

Advanced EMI Diagnostics � Board Level Scanning
� APREL Inc. EM-iSight
� Automated scan, single near-field probe, 20 GHz coverage
� Far-field estimation
� www.aprel.com
30

Summary
� EMI diagnostics and troubleshooting of modern designs presents unique challenges � what’s in your product ?
� Pre-compliance scanning will save $$$ and time
� Be careful of the tools you select, know the limitations
� Near-field scanning can pinpoint trouble areas
� Analysis in multiple, time-correlated domains speeds troubleshooting and debugging
� Real-Time Spectrum Analysis can provide deeper insight to transient phenomenon
� Coincidence is KEY to identifying sources of EMI
31
EMI Training
www.emiguru.com
32