
Practical Aspects of Thermoanalytical Methods 600 700 800 900 temperature in C 13 mPa vacuum 130 mPa...
65
Lecture Series: Modern Methods in Heterogeneous Catalysis Research Practical Aspects of Thermoanalytical Methods Christian Näther Institut für Anorganische Chemie Christian-Albrechts-Universität Kiel
Transcript of Practical Aspects of Thermoanalytical Methods 600 700 800 900 temperature in C 13 mPa vacuum 130 mPa...
Lecture Series: Modern Methods in Heterogeneous Catalysis Research
Practical Aspects
of Thermoanalytical Methods
Christian Näther
Institut für Anorganische Chemie
Christian-Albrechts-Universität Kiel

1. Switch on the clicker
press the on/off button
2. Enter the numerical “code“
you are logged in, if the 2. diode flash slowly
3. Enter your answer
press one of the multiple choice or T/F buttons
4. After the lecture please switch off the clicker
press the on/off button for about two seconds .
How to use the “RF-Clicker“?
on/off
true false
code (e.g. 23)
multiple
choice
buttons
Number of participants that have
logged successfully into the system
diodes

What is the name of the legendary sword of King Arthur?
Button Answer
1A Example
2B Express
3C Excalibur
4D Excess
5E Eva
6 Egon
Question to become familar with the clicker?

What are the key aspects of this lecture? Why they were selected?
catalysis
surface technologies
material testing
synthesis of new compounds
optimization of materials
quality control
DT?
investigation on the reactivity of compounds
analytic

Problem oriented selection of a method: Which questions are of importance for
the selection of a specific method?
What should be investigated?
Elemental analysis (qualitative/quantitative) / thermal properties / reactivity /
structural information / ……
State of matter of the sample?
solid / liquid / gaseous
State of the sample?
amorphous / semi crystalline / crystalline (large single crystals or powder)
Properties of the sample?
large or small particles / diamagnetic / paramagnetic / conducting / isolating
On which area of the sample information is needed?
surface / bulk
How precise or accurate the information should be?
qualitative composition / quantitative composition / crystal structures
What are the key aspects of this lecture? Why they were selected?

Which knowledge is needed for a problem oriented selection of a method?
Which methods exists ?
Theoretical basics (only what is needed)?
Which information can be extracted by one specific method?
On which area of a sample information is provided ?
Are there specific requirements concerning the nature of the sample ?
How precise and accurate is the information provided by one specific method?
Which are the limitations of a specific method ?
Are there any parameters that influence a measurement ?
Which are possible pitfalls and errors that can occur?
What are the key aspects of this lecture? Why they were selected?
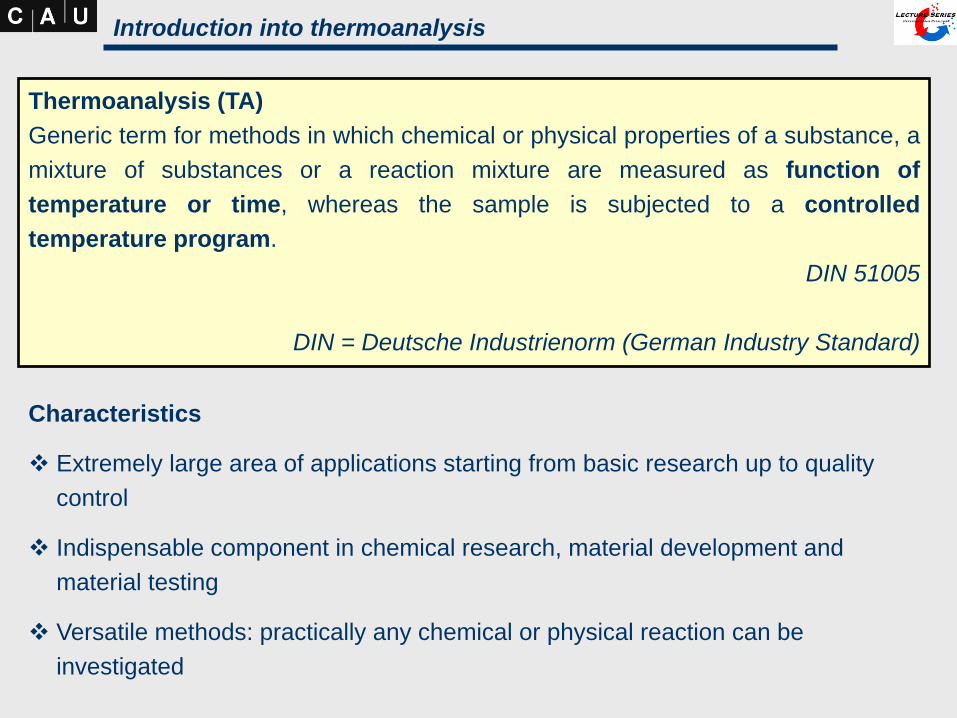
Introduction into thermoanalysis
Characteristics
Extremely large area of applications starting from basic research up to quality
control
Indispensable component in chemical research, material development and
material testing
Versatile methods: practically any chemical or physical reaction can be
investigated
Thermoanalysis (TA)
Generic term for methods in which chemical or physical properties of a substance, a
mixture of substances or a reaction mixture are measured as function of
temperature or time, whereas the sample is subjected to a controlled
temperature program.
DIN 51005
DIN = Deutsche Industrienorm (German Industry Standard)

Which methods belongs to thermonalytical methods?
Problem: There is no common characteristic feature of thermoanalytical methods.
Because in most methods physical properties are measured as function of
temperature or time, any other method should belong to thermoanalytical methods.
Solution: Only methods are considered which are defined by the ICTA or the DIN,
for which commercial devices exist and which are in general accepted as
thermoanalytical methods.
Methods
Thermogravimetry (TG)
Differential Thermoanalysis (DTA)
Differential Scanning Calorimetry (DSC)
Thermomicroscopy
Dilatometrie (DIL)
Thermomechanical Analysis (TMA)
Dynamic Mechanical Analysis (DMA)

Simultaneous methods combine different thermoanalytical techniques
Advantegous
Differences in the sample behaviour do not play any role
Environmental parameters are identical (atmosphere, temperature program)
Temperature is always comparable
Examples
TG-DTA: thermogravimetry with differential thermoanalysis
TOA-DSC: thermooptical analysis with differential scanning calorimetry
TG-MS: thermogravimetry coupled to mass spectroscopy
Supplement methods are used to get further information about the sample
behaviour
Examples
Temperature and time resolved X-ray powder diffraction
Thermomagnetometry (measurement of magnetic properties)
Thermoconductometrie (measurement of conductivity)
Thermophotometry (measurement of the optical properties)
Simultaneous and supplement methods

Examples for the application of therm. methods in catalysis
Investigations on the properties of catalyst precursor compounds and on the
preparation of catalysts
Investigations on the thermal behaviour of catalysts e.g. in different atmospheres
by e.g. pulse thermoanalysis
Investigations on deactivation processes of the catalyst during exposure with
reactive gases or gas mixtures
Investigations on phase changes or sintering of catalysts in different atmospheres
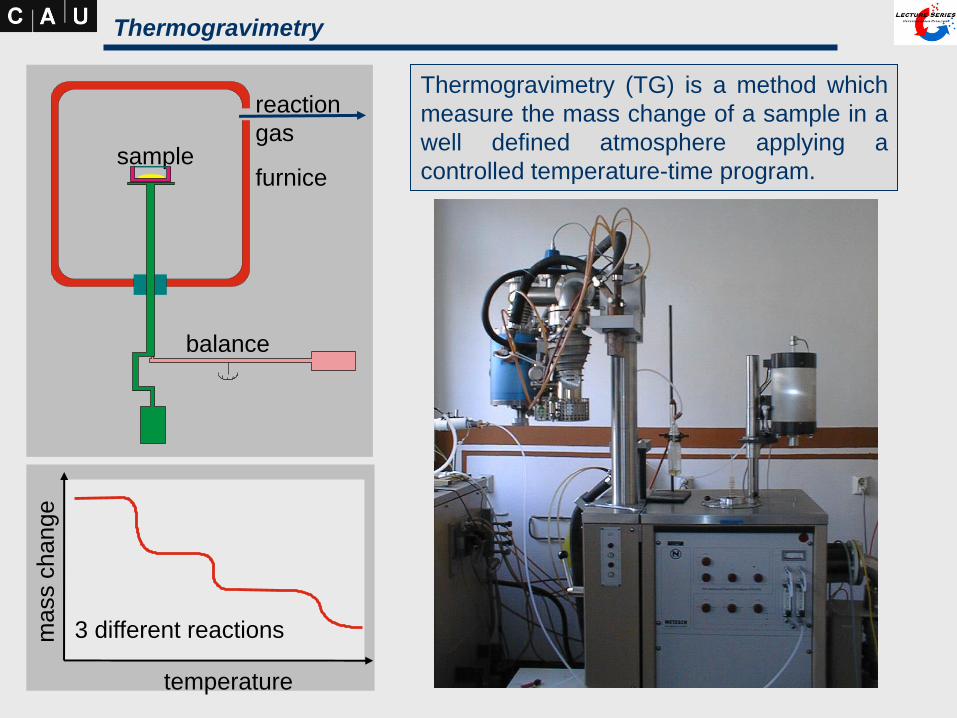
Thermogravimetry (TG) is a method which
measure the mass change of a sample in a
well defined atmosphere applying a
controlled temperature-time program.sample
furnice
balance
reaction
gas
temperature
3 different reactions
Thermogravimetrym
ass
change

Measured variable:
m = m(T) oder Dm = m(T) -m0
m = sample mass
mo = sample mass at the beginning
T = temperature
What is measured in thermogravimetry
DTG
TG
temperature in °C200 4000 600 800
Differentiated thermogravimetric curve
1. derivative of the measured variable:
d(Dm) / dt = d(m - m0) / dt = dm / dt
Each mass step is shown as a peak;
Can help if the different mass steps are
poorly resolved.
Can help in analyzing the exact mass
loss for poorly resolved TG curves.
ma
ss
change
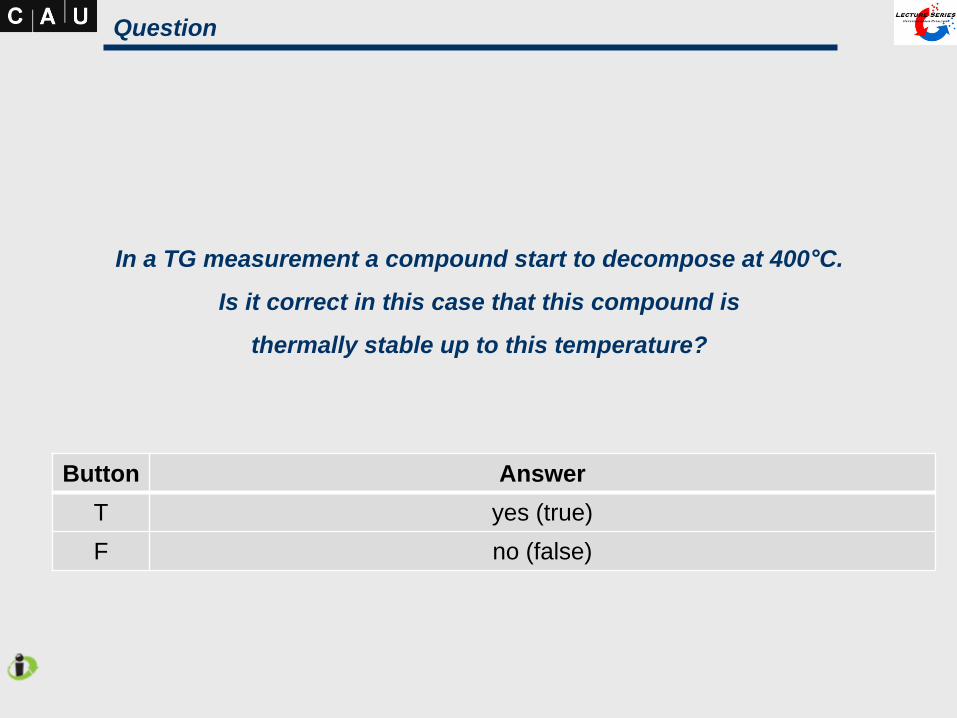
In a TG measurement a compound start to decompose at 400°C.
Is it correct in this case that this compound is
thermally stable up to this temperature?
Button Answer
T yes (true)
F no (false)
Question
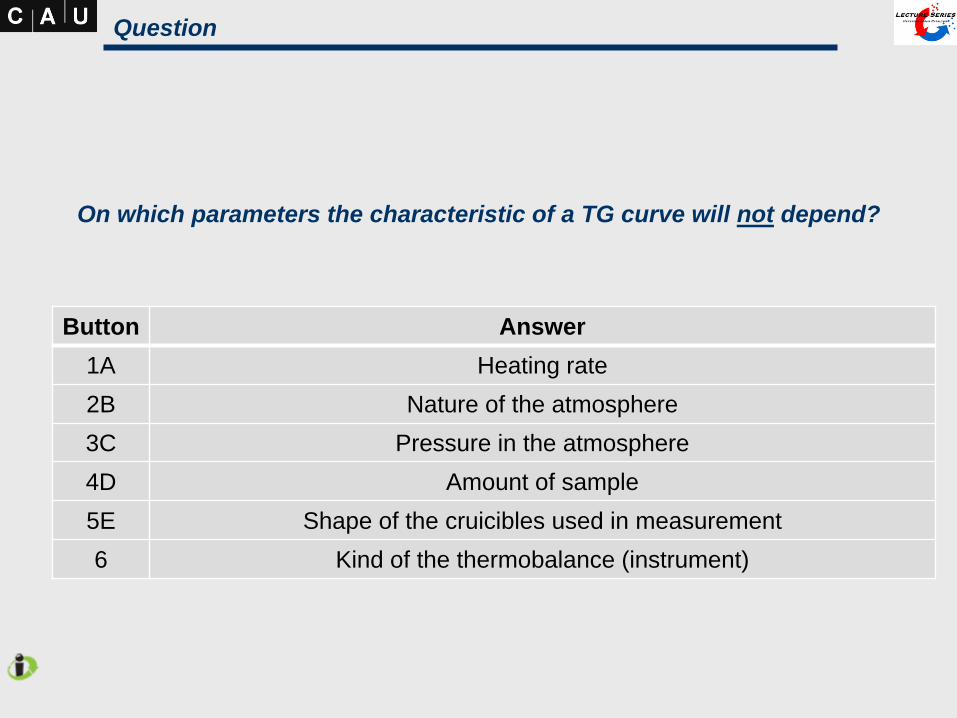
On which parameters the characteristic of a TG curve will not depend?
Button Answer
1A Heating rate
2B Nature of the atmosphere
3C Pressure in the atmosphere
4D Amount of sample
5E Shape of the cruicibles used in measurement
6 Kind of the thermobalance (instrument)
Question

Parameters that influence the TG curve
The measured variable and the course of the reaction depends on the
following parameters:
Temperature time program
Properties of the sample
Atmosphere in the thermobalance
Heat conductance
Effects of gas flow and bouyancy
Temperature inhomogenities within the sample (influence of the heat
conductance)
Nature of the sample (e.g. large crystals or microcrystalline powder)
Pressure
Nature of the gas
Reactions of the sample

tem
pera
ture
time time
T
time
ma
ss
change
time time time
constant
heating
stepwise
isothermal
isothermal
Temperature time programs (common to all methods)
tem
pera
ture
tem
pe
ratu
rem
ass
change
ma
ss
change

tem
pera
ture
time
b1
b=0
b=0
b1
b1-b
1-b
1
b=0
In practically all modern thermoanalytic
instrument any temperature time
program can be used
Example
Continuous heating and cooling to
determine the reversibility of a reaction.
.
Temperature time programs (common to all methods)
time
To Reaction controlled TG experiment
-Dm as f(t) = constant.
Device automatically detect change of
the signal (e.g. Dm) and stop heating
until the signal is constant.
Can increase resolution
-Dm
To = temperature
of the furnice
tem
pera
ture
b = heating rate

fast heating rate
low resolution
only one peak is visible in DTG curve
Influence of the heating rate b on the resolution of a reaction
temperature
temperature
timetemperature
temperature
b2 <b
1
b3 <b
2
T1T2
dmdT
time
T1 T2
dmdT
dmdT
ma
ss
change
temperature temperature
b1
dmdT
mid heating rate
better resolution
two different unresolved peaks are visible
slow heating rate
good resolution
complete separation of the peaks
quasi isothermal
best resolution
any separation of the peaks
ma
ss
change
mass
change
ma
ss
change

What is expected for the decomposition temperatures if CaCO3
is investigated by thermogravimetry in vacuum, in air under normal pressure
and in pure CO2?
Button Answer
1A There is no influence on the TG curve
2B vacuum < air < CO2
3C vacuum > air > CO2
4D vacuum < CO2< air
5E vacuum > CO2 > air
6 CO2 > vacuum > air
QuestionMNF-Chem0406a
C. Näther, Kiel
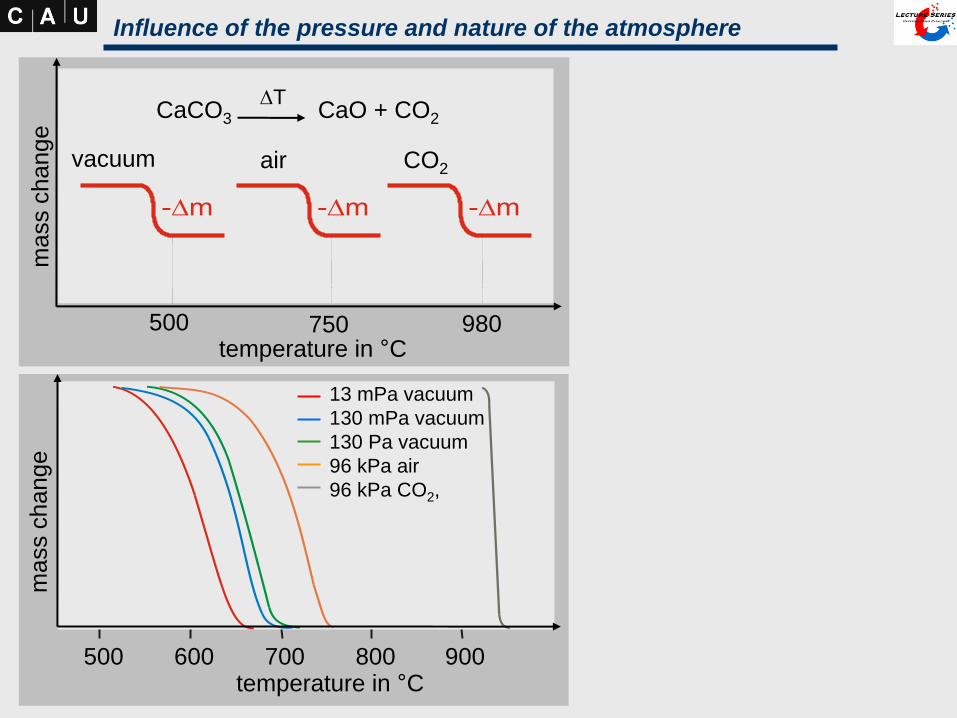
Influence of the pressure and nature of the atmosphere
500 600 700 800 900temperature in °C
13 mPa vacuum
130 mPa vacuum
130 Pa vacuum
96 kPa air
96 kPa CO2,
ma
ss
change
temperature in °C500 750 980
vacuum air CO2
CaCO3 CaO + CO2
DT
ma
ss
change

1: open cruicible with large surface area
2: open cruicible
3: cruicible with a small hole
Cruicibles for a self
produced atmosphere
Influence of the cruicibles
temperature in °C600 700 800 900 1000
1 2 3
mass
change
quasi isothermic
Constant heating rate

What is expected for the decomposition temperatures if a first measurement
is performed with larger, a second with smaller particles?
Button Answer
1A This will have no influence on the decomposition temperatures
2B The decomposition temperature increases
3C The decomposition temperature decreases
QuestionMNF-Chem0406a
C. Näther, Kiel

25 25 0
pressure
temperature
50 50 10100 100 20
6,7 · 10 Pa-3
23 · 10 Pa-3
1,3 · 10 Pa-3
150 150temperature in °C temperature in °C
50 °C150 °C
time in min
0,2 mg 0,2 mg
0,5 mgheating rate: 2 K/min.
heating rate: 8 K/min.
large crystals (large particles)
microcrystalline powder (small particles)air
vacuum
Influence of the nature of the sample: CaC2O4 H2O
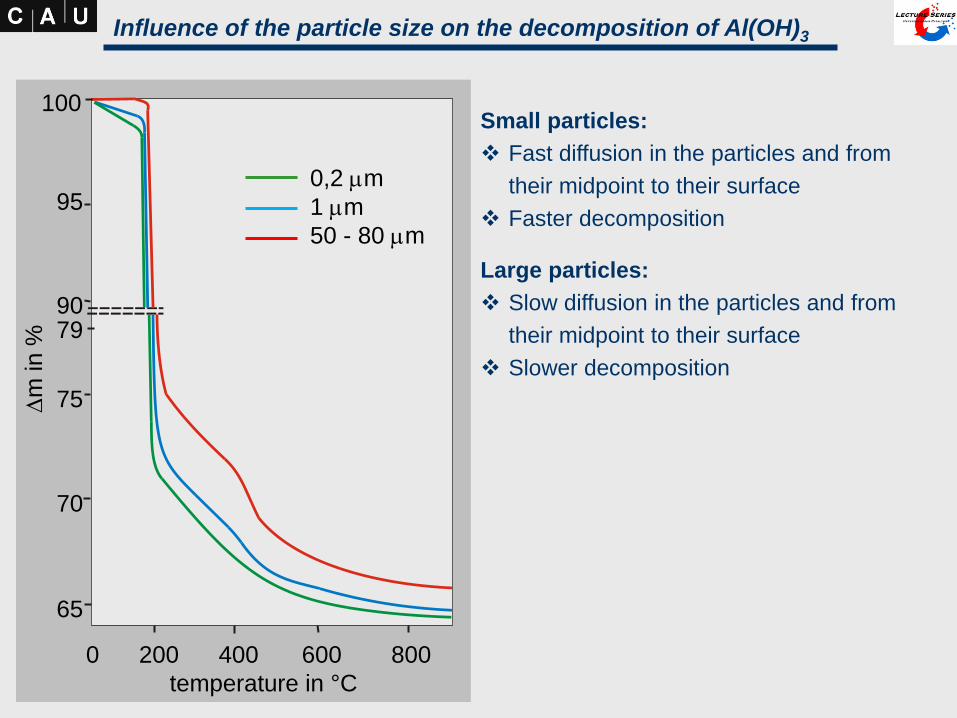
8006004002000
65
70
75
7990
95
100
temperature in °C
0,2 mm
1 mm
50 - 80 mm
Small particles:
Fast diffusion in the particles and from
their midpoint to their surface
Faster decomposition
Large particles:
Slow diffusion in the particles and from
their midpoint to their surface
Slower decomposition
Influence of the particle size on the decomposition of Al(OH)3D
min
%

T temperature
TP temperature of the sample
area
r position in the sample
1,2,3 sample areas
Dm1,2,3 mass change in the sample
areas
Dm complete mass change
Dm = Dm1 + Dm2 + Dm3
Dm3
T
Dm2
T
Dm1
Dm
TP
r
32
1
Time lag of the reaction in the particles of the sample
T
T

Is it correct that each TG step correspond to the formation of a new compound
with distinct stoichiometry ?
Button Answer
T yes (true)
F no (false)
Question

Does each TG step correspond to the formation of a compound?
No !
It might be that that the reaction is very fast in the beginning but slow down with
increased reaction time
Several steps might be involved and in the end, a reaction might proceed via diffusion
which can be the rate-determining step.
50 75 100 125 150 175 200 225 250 275 300 325
50
55
60
65
70
75
80
85
90
95
100D
m / %
temperature in °C
Reactand
1. product
2. product
additional
intermediate?
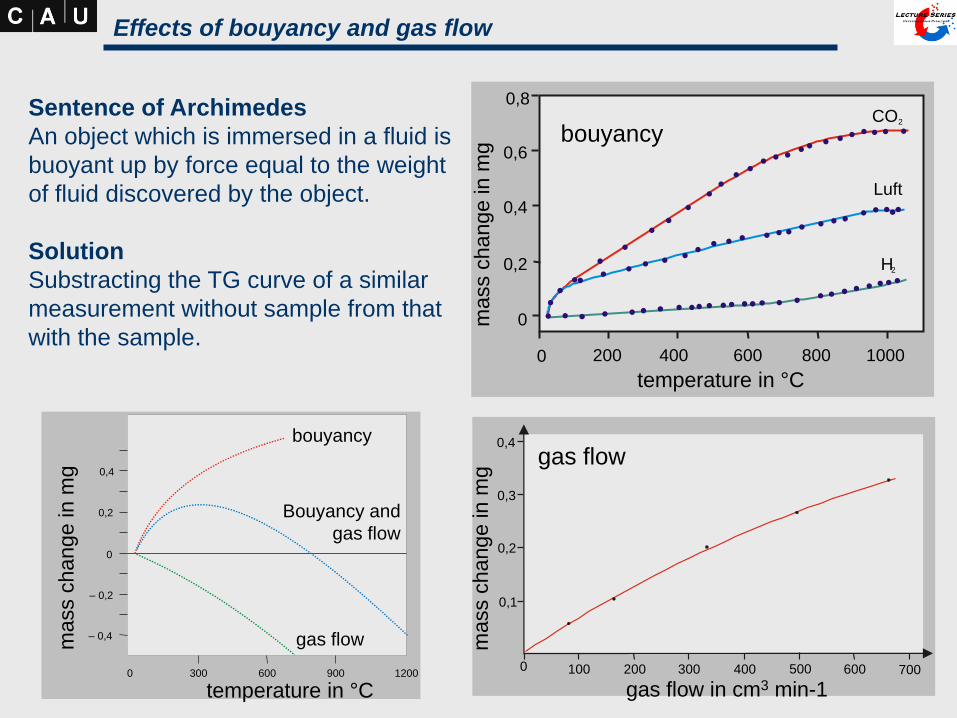
0 100 200 300 400 500 600 700
0,1
0,2
0,3
0,4
gas flow in cm3 min-1
0 200 400 600 800 1000
0,8
0,6
0,4
0,2
0
temperature in °C
CO2
Luft
H2
bouyancy
gas flow
Effects of bouyancy and gas flow
mass
ch
ang
ein
mg0,4
0,2
0
– 0,2
– 0,4
0 300 600 900 1200
temperature in °C
gas flow
Bouyancy and
gas flow
bouyancy
mass
ch
ang
ein
mg
mass
ch
ang
ein
mg
Sentence of Archimedes
An object which is immersed in a fluid is
buoyant up by force equal to the weight
of fluid discovered by the object.
Solution
Substracting the TG curve of a similar
measurement without sample from that
with the sample.

In which case the TG curve is only minor influenced if there is no correction
fow bouyancy and gas flow
Button Antwort
1A large sample weight
2B small sample weight
3C small sample weight and large mass loss
4D large mass loss
5E large sample weight and small mass loss
6 large sample weight and large mass loss
Question
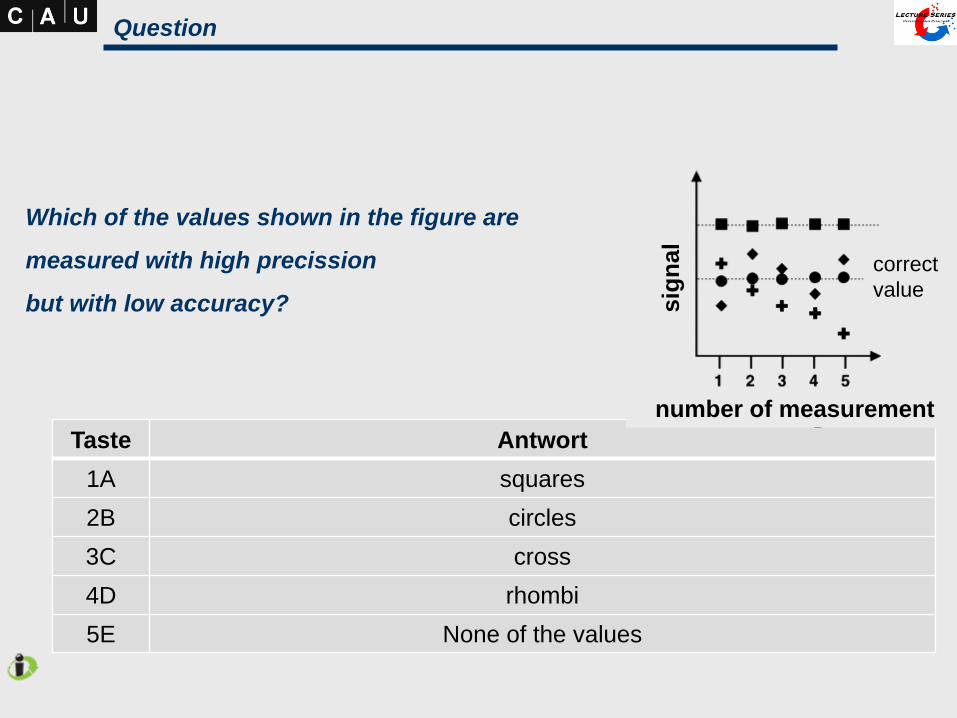
Which of the values shown in the figure are
measured with high precission
but with low accuracy?
Taste Antwort
1A squares
2B circles
3C cross
4D rhombi
5E None of the values
Question
sig
nal
number of measurement
correct
value

50 75 100 125 150 175 200 225 250 275 300 325
50
55
60
65
70
75
80
85
90
95
100D
m / %
temperature in °C
0.5 / 1 / 2 / 4 / 8 / 16
heating rate: °C/min.
N
N
C2H 5
DT2:1DT
3:21:1
Influence of the heating rate on product formation
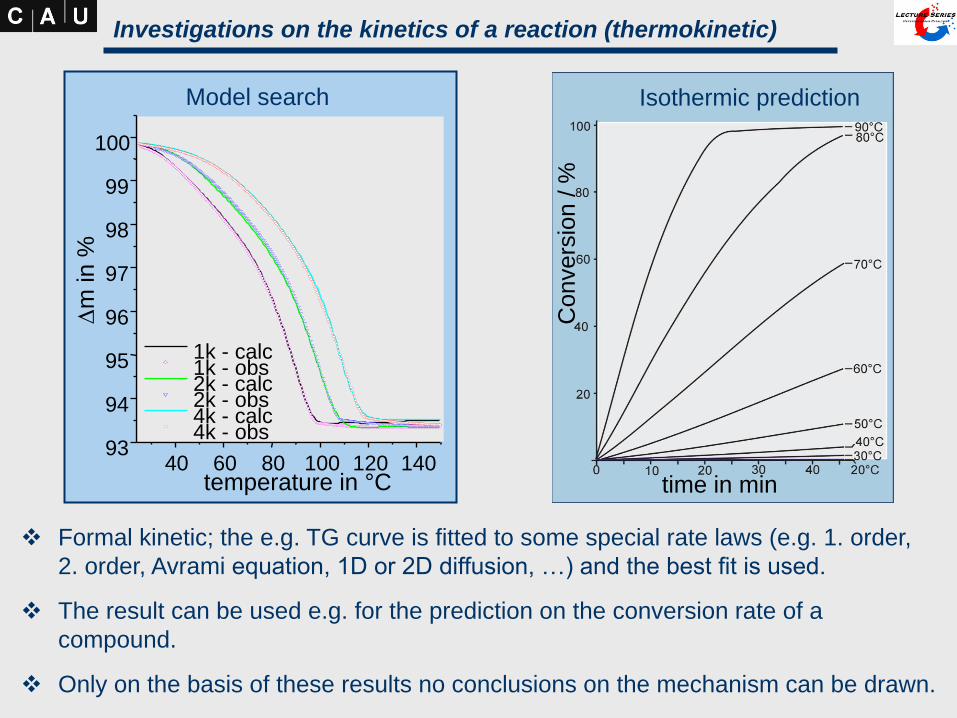
Investigations on the kinetics of a reaction (thermokinetic)
Model search
40 60 80 100 120 14093
94
95
96
97
98
99
100
1k - calc1k - obs2k - calc2k - obs4k - calc4k - obs
Dm
in %
temperature in °C
Isothermic prediction
time in min
Conve
rsio
n/ %
Formal kinetic; the e.g. TG curve is fitted to some special rate laws (e.g. 1. order,
2. order, Avrami equation, 1D or 2D diffusion, …) and the best fit is used.
The result can be used e.g. for the prediction on the conversion rate of a
compound.
Only on the basis of these results no conclusions on the mechanism can be drawn.

thermobalance
mass
spectrometer
Skimmer-
furnice Pt-Rh-
furnice
Thermogravimetry coupled to mass spectroscopy
mass
spectrometer
Advantegous
Information on the compounds emitted
during a measurement are provided

Coupling of the mass spectrometer
Capillary coupling
mode of operation
transfer of the gas via a heated
capillary
disadvantages
products can condense within the
capillary
order in which the products reach
the MS can change
advantegous
precise quantitative
measurements are possible
Skimmer coupling
mode of operation
transfer of the gas via a Skimmer that
always have the sample temperature
advantegous
No temperature gradient from the
sample to the mass spectrometer
detection of low volatile compounds
disadvantegous
quantitative measurements are very
often difficult to perform
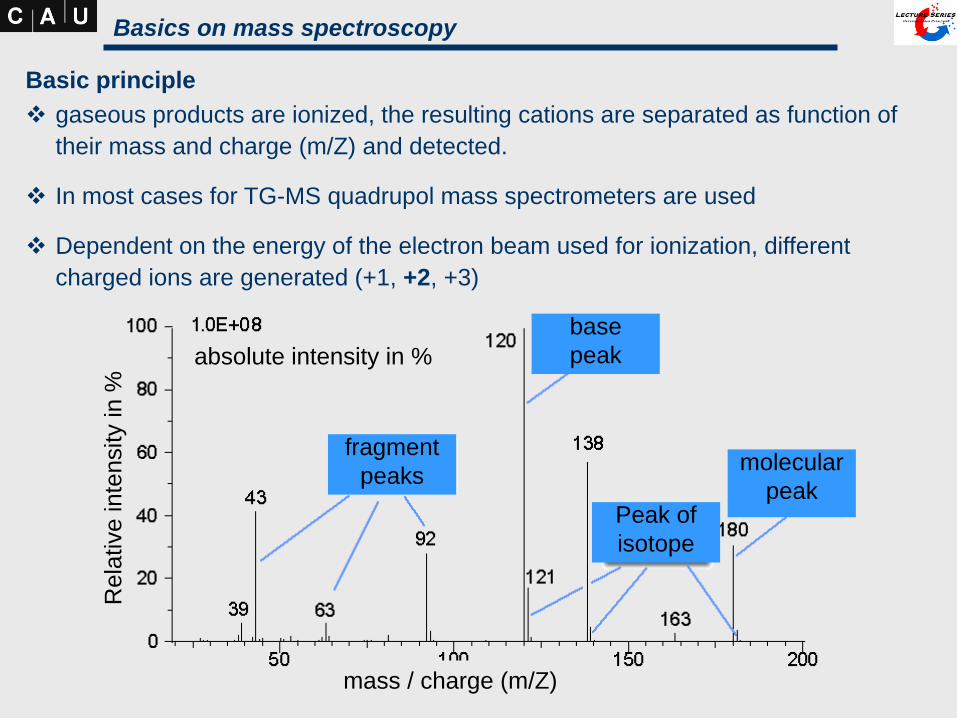
Basics on mass spectroscopy
Basic principle
gaseous products are ionized, the resulting cations are separated as function of
their mass and charge (m/Z) and detected.
In most cases for TG-MS quadrupol mass spectrometers are used
Dependent on the energy of the electron beam used for ionization, different
charged ions are generated (+1, +2, +3)
Re
lative inte
nsity
in %
absolute intensity in %
mass / charge (m/Z)
fragment
peaks
base
peak
molecular
peakPeak of
isotope

Scan modes
Analog scan
All masses were detected as function
of time or temperature up to a given
value
temperature in °C
DT,
Dm
, d
m/d
T, I in
arb
itra
ryu
nit
s50 75 100 125 150 175 200 225 250
DTA
m/z=108
TG
DTG
-18.1%
-18.0%
endo
Tp=175Tp=86
Tp=75
Tp=177
Trend scan
mid scan; mulitple ion detection; The
intensity of selected signals were measured
as function of time or temperature

Problems with interpretation
fragmentation and multiple ionization
presence of natural isotops
random overlap of the signals
contaminations in the carrier gas
wrong selection of the carrier gas

Influence of the carrier gas
The concentration of the
carrier gas is much higher
than those of the species
which should be detected
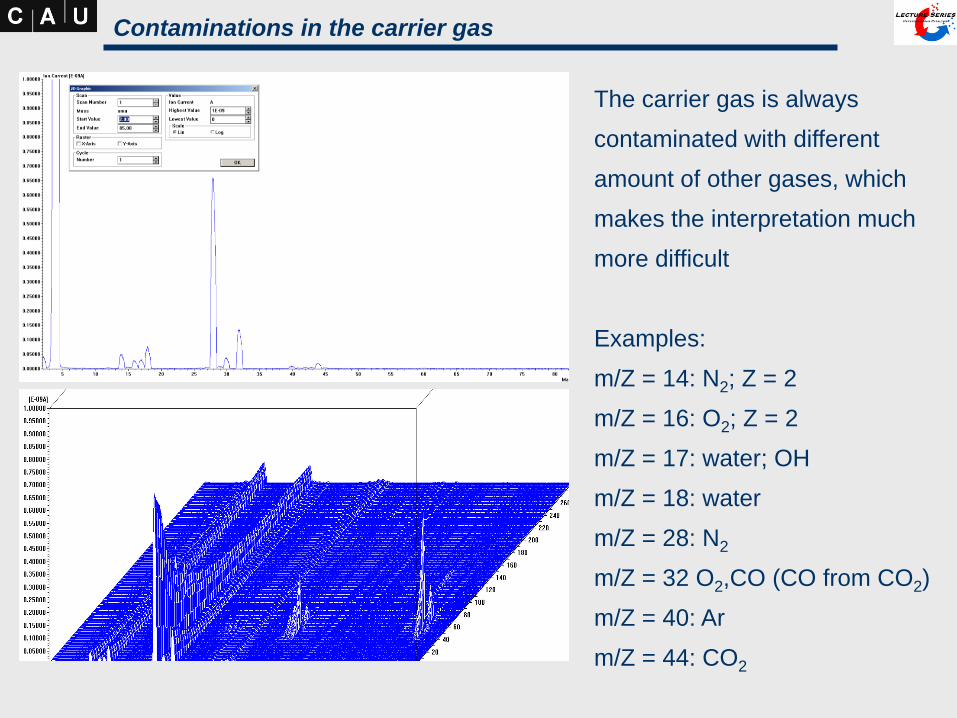
Contaminations in the carrier gas
The carrier gas is always
contaminated with different
amount of other gases, which
makes the interpretation much
more difficult
Examples:
m/Z = 14: N2; Z = 2
m/Z = 16: O2; Z = 2
m/Z = 17: water; OH
m/Z = 18: water
m/Z = 28: N2
m/Z = 32 O2,CO (CO from CO2)
m/Z = 40: Ar
m/Z = 44: CO2
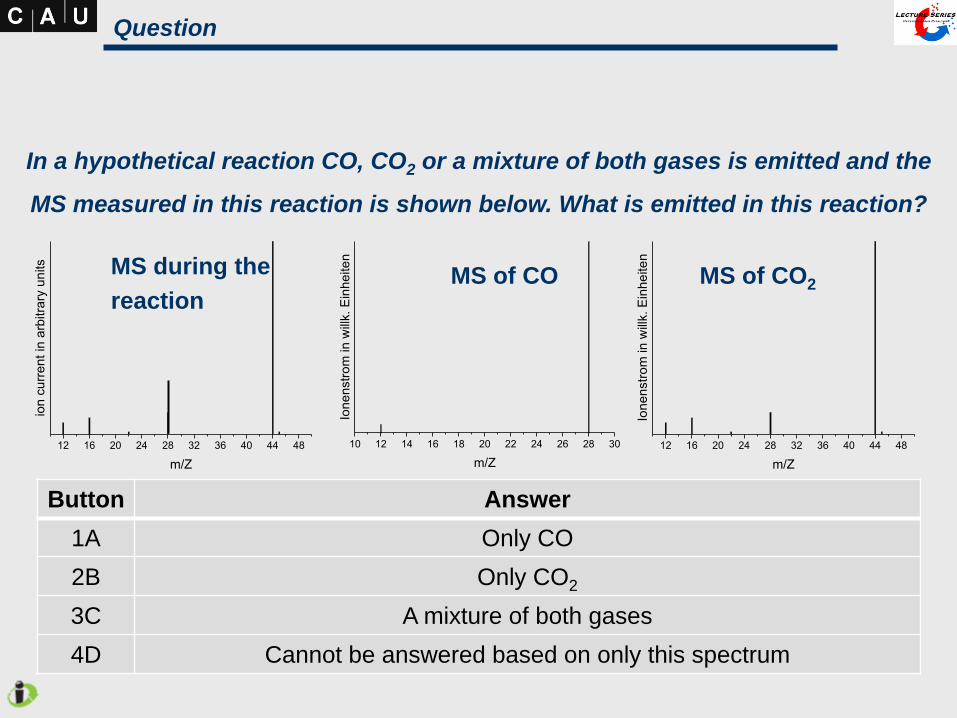
Question
In a hypothetical reaction CO, CO2 or a mixture of both gases is emitted and the
MS measured in this reaction is shown below. What is emitted in this reaction?
Button Answer
1A Only CO
2B Only CO2
3C A mixture of both gases
4D Cannot be answered based on only this spectrum
10 12 14 16 18 20 22 24 26 28 30
Ion
en
str
om
in
will
k.
Ein
he
ite
n
m/Z
12 16 20 24 28 32 36 40 44 48
Ion
en
str
om
in
will
k. E
inh
eite
n
m/Z
MS of CO MS of CO2
12 16 20 24 28 32 36 40 44 48
ion
cu
rre
nt
in a
rbitra
ry u
nits
m/Z
MS during the
reaction
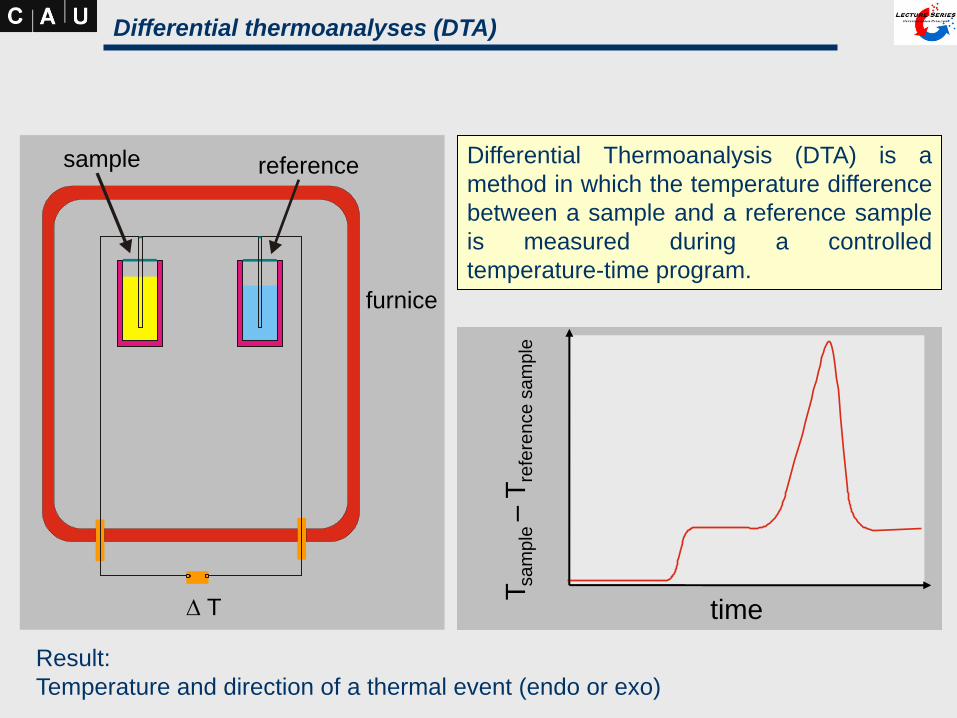
Differential Thermoanalysis (DTA) is a
method in which the temperature difference
between a sample and a reference sample
is measured during a controlled
temperature-time program.
referencesample
furnice
D T time
Tsa
mple
–T
refe
rence
sa
mple
Differential thermoanalyses (DTA)
Result:
Temperature and direction of a thermal event (endo or exo)

A sample is heated with a constant heating rate.
What will happen if the sample start to melt?
Button Answer
1A The temperature of the sample still increases but with slower rate
2B The temperature of the sample remain constant until melting is finished
3C The temperature of the sample increases with the same rate
4D The temperature of the sample decreases
Question
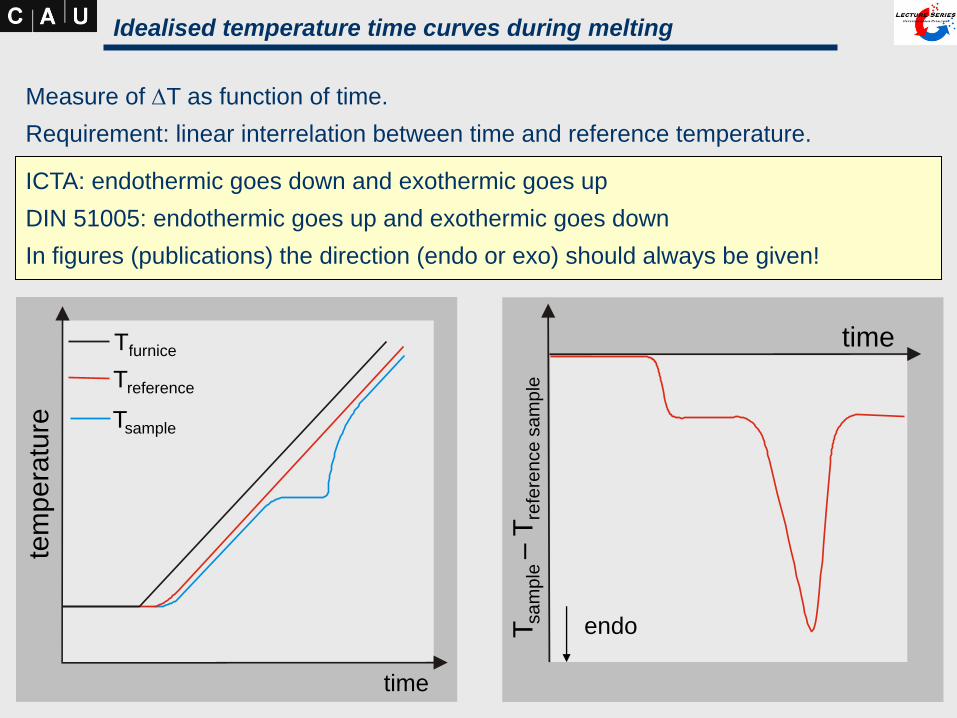
Measure of DT as function of time.
Requirement: linear interrelation between time and reference temperature.
tem
pe
ratu
re
time
Tfurnice
Treference
Tsample
time
ICTA: endothermic goes down and exothermic goes up
DIN 51005: endothermic goes up and exothermic goes down
In figures (publications) the direction (endo or exo) should always be given!
endo
Idealised temperature time curves during melting
Tsa
mple
–T
refe
rence
sa
mple

At which position of a DTA peak a thermal event is finished?
Button Antwort
1A At the beginning of the peak
2B At the peak maximum
3C At the end of the peak
Question
Heat
flu
x
temperature or time
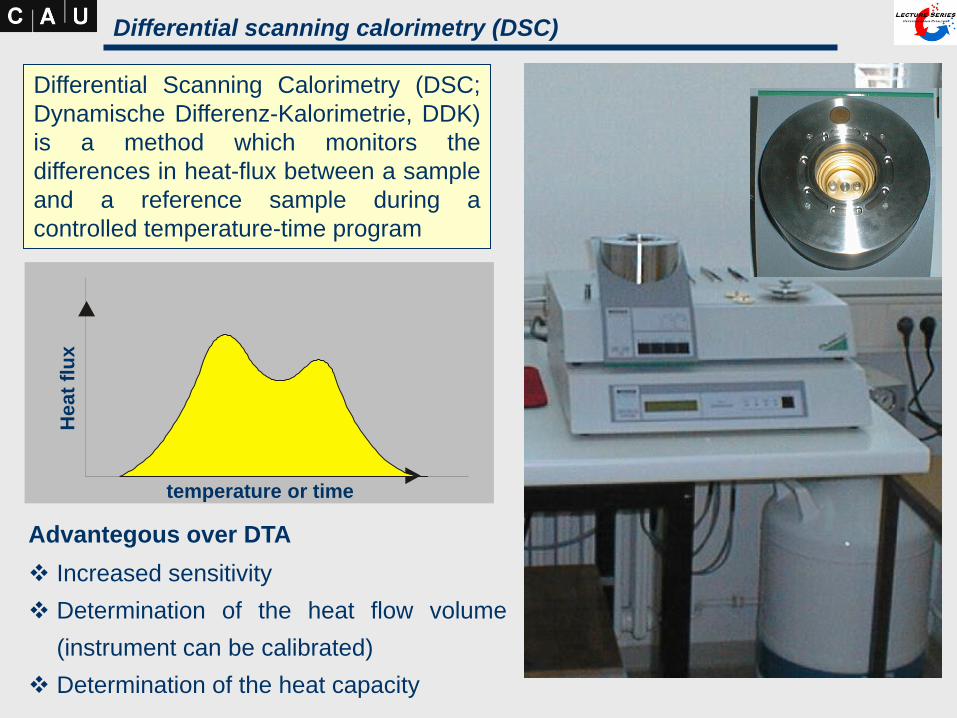
Differential Scanning Calorimetry (DSC;
Dynamische Differenz-Kalorimetrie, DDK)
is a method which monitors the
differences in heat-flux between a sample
and a reference sample during a
controlled temperature-time program
Differential scanning calorimetry (DSC)
Advantegous over DTA
Increased sensitivity
Determination of the heat flow volume
(instrument can be calibrated)
Determination of the heat capacity

sample reference
DTsr
Measured variable in differential scannning calorimetry
Heat flux DSC
Same principle like DTA
DT is measured
DT is proportional to the heat flux
sample reference
Power compensating DSC
Compensation of the reaction heat in
order that DT is always zero
Directed measurement of the electrical
power

In DTA and DSC reference samples are used in order to ensure that always the same
amount of heat is transfered to the sample and reference sample
Standards for a reference sample:
Behaviour as function of temperature must be known
No reaction of the reference sample in the temperature range which is
investigated
If possible comparable heat capacity of reference and sample
In the case of small sample mass and not to high demand for accuracy measurement
can be performed only with an empty cruicible
The reference sample (reference)

t1 t2
time in s
Area between measured curve and
baseline is proportional to the heat flow
Instrument must be calibrated for
temperature and heat quantity using
reference materials
Measured curve
temperature or time
Requirements for calibration
(transition from DTA into DSC)
Peak area should not depend on external
parameters like e.g. heating rate
diffe
rence
sig
na
lin
mV
diffe
rence
in m
V

T T
DT1/2
Ti Te Tp Tf Tc Ti Te Tp Tf Tc
Ti = Temperature of the start of a reaction (first deviation from baseline)
Te = extrapolated onset temperature (intersection of the baseline with the tangen
of the peak
Tp = peak temperature
Tf = extrapolated end temperature
Tc = temperature at the end of a reaction
DT1/2 = half-with
Characteristic temperaturessig
nal
sig
nal

105 110 115 120 125 130 135 140 145 150 155
he
atflow
temperature in °C
1 K/min.
5 K/min.
10 K/min.
20 K/min.
endo
Please note: extrapolated onset
temperature does not depend on
heating rate and should always be
given if possible
If always the same heating rate is
used, peak temperatures can also
be used
Melting point of di-tert.butyl-biphenyl at different heating rates
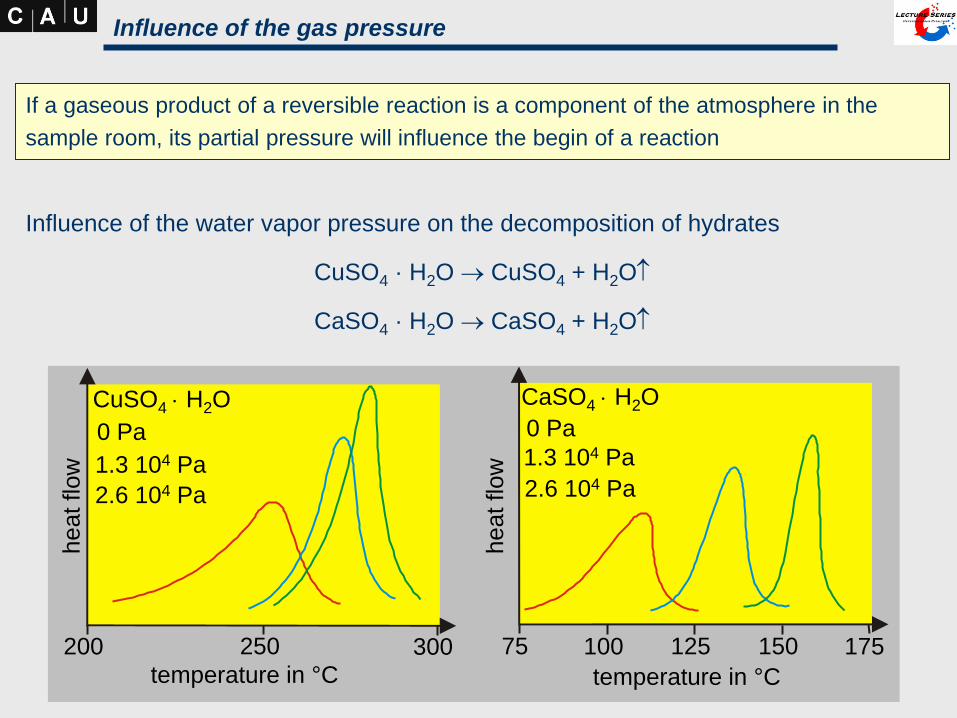
Influence of the water vapor pressure on the decomposition of hydrates
CuSO4 · H2O CuSO4 + H2O
CaSO4 · H2O CaSO4 + H2O
temperature in °C temperature in °C
200 250 300 75 100 125 150 175
CuSO4 H2O
0 Pa 0 Pa
1.3 104 Pa 1.3 104 Pa
2.6 104 Pa 2.6 104 Pa
If a gaseous product of a reversible reaction is a component of the atmosphere in the
sample room, its partial pressure will influence the begin of a reaction
Influence of the gas pressure
he
atflow
he
atflow
CaSO4 H2O

Thermal decomposition of NiC4O4 · H2O
In nitrogen endothermic decomposition
into Ni, CO and water
In oxygen exothermic decomposition
because of oxidation of CO into CO2
exo
the
rmic
endoth
erm
ic
time in min.0 2 4 6
0 2 4 6
in nitrogen
in oxygen
Influence of the nature of the gassig
na
l

Differences to conventional DSC:
Instead of a linear heating rate a sinusoidal modulated heating rate is used
Modulated differential scanning calorimetry
Advantegous
Increased sensitivity and resolution
Separation of complex transition is much easier
Directe determination of heat capacity and heat flow within one experiment
Reversible and irreversible reactions can be separated in one measurement
(two different curves are achieved)
average heating rate
0.1°C
frequency 20 s
amplitude +/- 0.15°C
heat capacity
non-reversible
heat flow
Cp
(J/g
°C)
Nn
on
-revers
ible
he
atflo
win
mW
temperature in K
1.0
0.8
0.6
0.4
0.2
0.0420 430 435425 440 445 450
-1.0
-0.5
0.0
0.5
107.6°C
108.1°C
109.8°C110.3°C
108.6°C
13.44°C/min.
-11.54°C/min.
112
111
110
109
108
107
106
108.0 108.5 109.0 109.5 110.0
-15
-10
-5
0
5
10
15
Mm
odula
ted
tem
pera
turt
ein
°C
Ab
ge
leite
teM
od
ulie
rte
Te
mp
.In
° Ctemperature in °C

Phase transitions in sodium nitrate
average heating rate 0.1°C
frequency 20 s
amplitude +/- 0.15°C
heat capacity
non-reversible
heat flow
Cp
(J/g
°C
)
Nn
on
-revers
ible
he
atflow
in m
W
temperature in K
1.0
0.8
0.6
0.4
0.2
0.0420 430 435425 440 445 450
-1.0
-0.5
0.0
0.5

Special instrumentation: High Speed and High Pressure DSC
High Speed DSC (HDSC)
At slower heating rates the resolution becomes better but the sensitivity is reduced!
Solution: Usage of high speed DSC (Heating rate from 50 to 500 C/min).
Example:
Detection of very small amounts of amorphous content because on fast heating rate
the glass transition becomes visible, which cannot be detected at low heating rates.
High Pressure DSC (HPDSC)
DSC measurements up to 1000 bar are possible
Examples:
Formation and dissociation of gas hydrates
Investigations under gas supercritical conditions
Investigations on dehydration of goethite to
Hematite under high pressure (right)
2 a-FeOOH a-Fe2O3 + H2O

Example: determination of the glass temperature and crystallinity
glass transition: transition of e.g. a polymer from the glassy state into the rubbery-
elastic state
amorphous polymer crystalline polymer semi-crystalline polymer
temperature temperature temperature
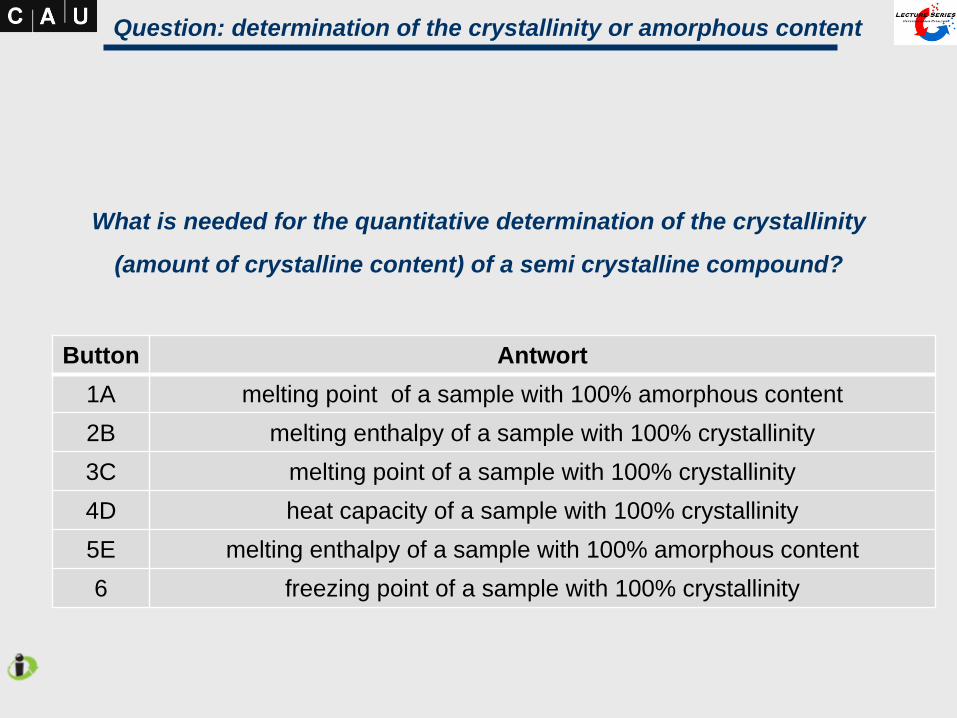
What is needed for the quantitative determination of the crystallinity
(amount of crystalline content) of a semi crystalline compound?
Button Antwort
1A melting point of a sample with 100% amorphous content
2B melting enthalpy of a sample with 100% crystallinity
3C melting point of a sample with 100% crystallinity
4D heat capacity of a sample with 100% crystallinity
5E melting enthalpy of a sample with 100% amorphous content
6 freezing point of a sample with 100% crystallinity
Question: determination of the crystallinity or amorphous content
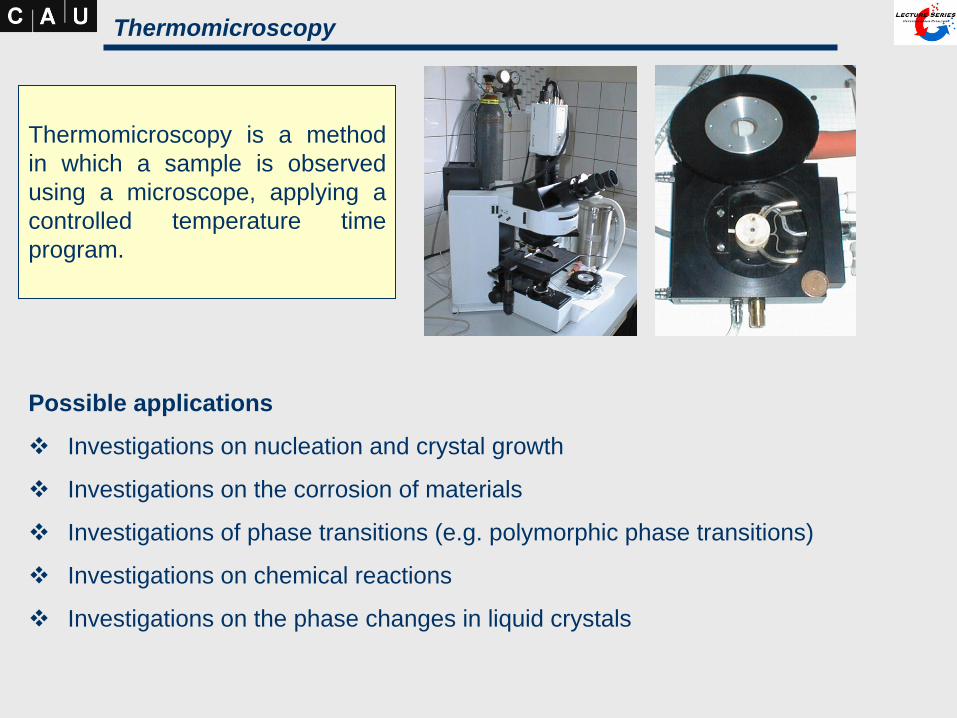
Thermomicroscopy
Thermomicroscopy is a method
in which a sample is observed
using a microscope, applying a
controlled temperature time
program.
Possible applications
Investigations on nucleation and crystal growth
Investigations on the corrosion of materials
Investigations of phase transitions (e.g. polymorphic phase transitions)
Investigations on chemical reactions
Investigations on the phase changes in liquid crystals

1600°C
2000°C 2700°C
Large crystals growth on the costs of
the smaller particles
Recrystallisation of a metal

The result of one single thermoanalytical experiment without any further information
about the sample, its reactions and its reaction products has no significant meaning.
Consequently, different methods should always be combined
temperature
- mD TG curve
exo
DTA curve
thermomicroscopy
melting
decomposition
polymorphic
transformation ?
powder diffraction
reactand
modification I
reactand
modification II product 1
mass spectroscopy
product 2
Critical view on thermoanalytic methods

- One measurement is not enough -
Thermogravimetric investigations on Mn2Sb2S5. ethylamine
100 150 200 250 300 350 400
exothermic
DTA curve
TG curve1. measured in argon
100 150 200 250 300 350 400
exothermic
DTA curve
TG curve2. measured in argon
100 150 200 250 300 350 400
exothermic
DTA curve
TG curve3. measured in argon
100 150 200 250 300 350 400
exothermicDTA curve
TG curve
measured in air
Murphy’s law: whatever can go wrong, will go wrong.
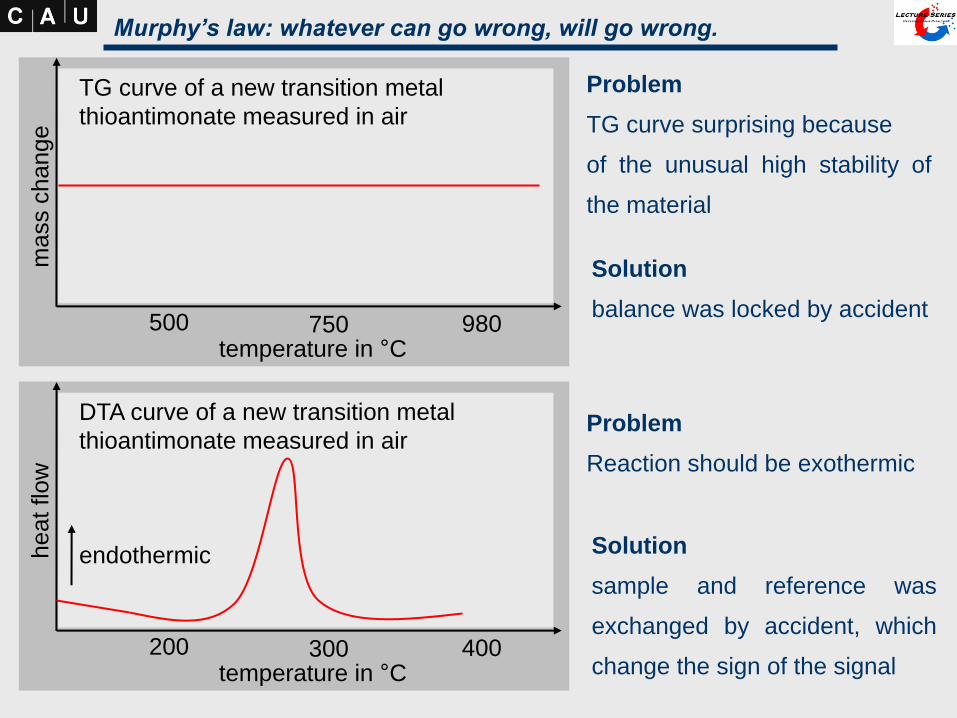
Problem
TG curve surprising because
of the unusual high stability of
the material
temperature in °C500 750 980
ma
ss
change
temperature in °C200 300 400
he
atflow
TG curve of a new transition metal
thioantimonate measured in air
DTA curve of a new transition metal
thioantimonate measured in air
endothermic
Murphy’s law: whatever can go wrong, will go wrong.
Problem
Reaction should be exothermic
Solution
sample and reference was
exchanged by accident, which
change the sign of the signal
Solution
balance was locked by accident

Supplemental
Additional methods
Dilatometry (DIL)
Thermomechanical Analysis (TMA)
Dynamic Mechanical Analysis (DMA)

Dilatometry (DIL)
Dilatometry is a method in which
changes in volume of a
compound are measured
applying a controlled temperature
time program.
Possible applications
Determination of the coefficient of expansion (lengths, volume)
Investigations of first order phase transition (this method is very sensitive against
changes in volume)
Investigations on the sintering behaviour of e.g. ceramcis
Measurement of the change in volume during a magnetic transition
Investigations on the swelling behaviour of e.g. paper
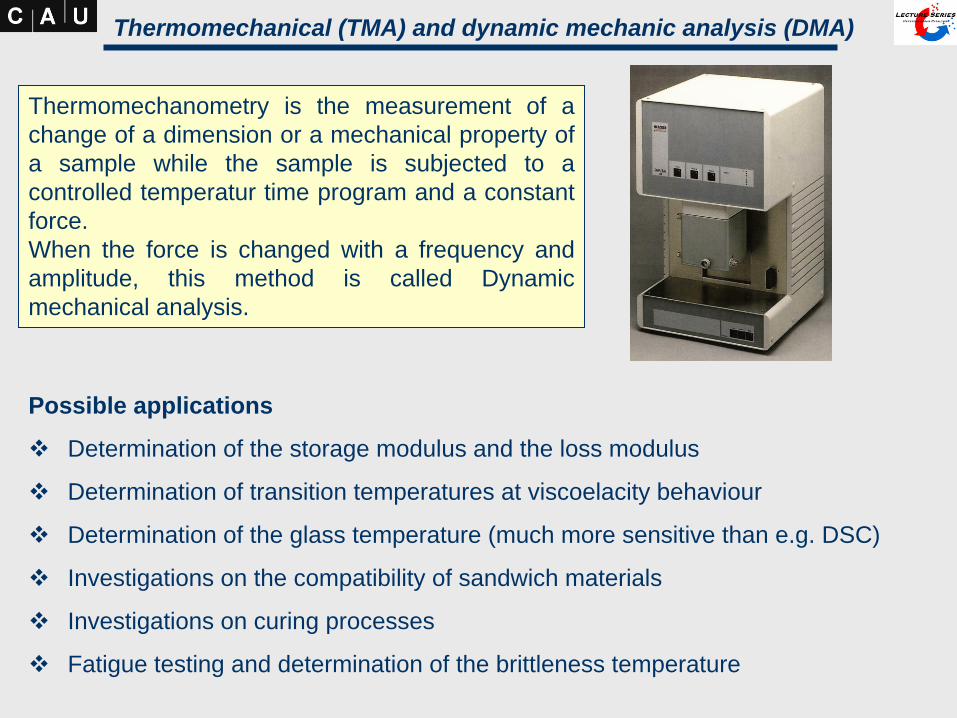
Thermomechanical (TMA) and dynamic mechanic analysis (DMA)
Thermomechanometry is the measurement of a
change of a dimension or a mechanical property of
a sample while the sample is subjected to a
controlled temperatur time program and a constant
force.
When the force is changed with a frequency and
amplitude, this method is called Dynamic
mechanical analysis.
Possible applications
Determination of the storage modulus and the loss modulus
Determination of transition temperatures at viscoelacity behaviour
Determination of the glass temperature (much more sensitive than e.g. DSC)
Investigations on the compatibility of sandwich materials
Investigations on curing processes
Fatigue testing and determination of the brittleness temperature


![Suction verification of very small work piecesca01.smcworld.com/catalog/en/switch_sensor/PFMV-E/6-8-p0287-03… · (Vacuum pump) P2 [kPa] P2 [kPa] 5.0 4.5 4.0 3.5 3.0 2.5 2.0 1.5](https://static.fdocuments.us/doc/165x107/608a17d6a0fc58763e26eff3/suction-verification-of-very-small-work-vacuum-pump-p2-kpa-p2-kpa-50-45.jpg)