PQ Systems, Inc. Corporate Headquarters International...
150
PQ Systems, Inc. Corporate Headquarters: 10468 Miamisburg-Springboro Rd. Miamisburg, OH 45342 Sales 800-777-3020 Technical Support 800-777-5060 Fax 937-885-2252 International Offices: PQ Systems Europe Ltd. Ryeground House, Ryeground Lane Freshfield, Formby, Merseyside L37 7EQ England Tel. 01704 871465 Fax 01704 875189 PQ Systems Pty. Ltd. Level 6, Peninsula Centre 435-437 Nepean Highway, Frankston, Victoria 3199 Australia Tel. 03-9770-1960 Fax 03-9770-1995
Transcript of PQ Systems, Inc. Corporate Headquarters International...

PQ Systems, Inc.Corporate Headquarters:
10468 Miamisburg-Springboro Rd. Miamisburg, OH 45342Sales 800-777-3020
Technical Support 800-777-5060Fax 937-885-2252
International Offices:
PQ Systems Europe Ltd. Ryeground House, Ryeground LaneFreshfield, Formby, Merseyside L37 7EQ England
Tel. 01704 871465Fax 01704 875189
PQ Systems Pty. Ltd. Level 6, Peninsula Centre435-437 Nepean Highway, Frankston, Victoria 3199 Australia
Tel. 03-9770-1960Fax 03-9770-1995

ii SQCpack 2000
The information in this document is subject to change without notice. PQ Systems,Inc. furnishes the software described in this document under a license andrequires that it be used only according to the terms of the license.Productivity-Quality Systems, Inc. makes no warranties, express or implied,concerning the system, including all warranties of merchantability and fitness fora particular purpose.
Productivity-Quality Systems, Inc. is also known as PQ Systems, Inc.®
SQCpack is a registered trademark of Productivity-Quality Systems, Inc.CHARTrunner is a trademark of Productivity-Quality Systems, Inc.CHARTrunner-e is a trademark of Productivity-Quality Systems, Inc.GAGEpack is a registered trademark of Productivity-Quality Systems, Inc.PORTspy is a registered trademark of Productivity-Quality Systems, Inc.MEASUREspy is a trademark of Productivity-Quality Systems, Inc.DOEpack is a registered trademark of Productivity-Quality Systems, Inc.R&Rpack is a registered trademark of Productivity-Quality Systems, Inc.Total Quality Transformation is a registered trademark of Productivity-QualitySystems, Inc.TQT is a registered trademark of Productivity-Quality Systems, Inc.Windows® is a registered trademark of Microsoft® Corporation.All other brand and product names are trademarks or registered trademarks oftheir respective companies.
Copyright © 2000 by Productivity-Quality Systems, Inc.; third printing, fourthversion, release 4.6, October 2002.All rights reserved. Printed in the United States of America. No part of thisdocument may be reproduced, stored in a retrieval system, or transmitted, in anyform or by any means, electronic, mechanical, photocopying, recording, orotherwise, without the prior written permission of Productivity-QualitySystems, Inc.This User Guide accompanies release 4.6 of SQCpack 2000.

Contents iii
PQ Systems, Inc. “Per Workstation” License Agreement
*** REGISTERED LICENSE AGREEMENT ***
This license applies to the registered version of the Software. If you are using anevaluation version of the Software, see the section entitled “EVALUATIONLICENSE AGREEMENT” below.
You should carefully read the following terms and conditions before using theSoftware. Your use of the software indicates acceptance of this license agreementand warranty.
Registered Version of the License
A registered license grants you the right to install and use the Software on asingle workstation (i.e., one computer). You must purchase a registered licensefor each workstation on which the Software is installed. If you use the Softwarethrough a network, you must still obtain individual licenses for the Software tocover each individual workstation that will access the Software through thenetwork. For instance, if 10 different workstations will use the Software on anetwork, each workstation must have its own registered license, regardless ofwhether the Software is used at different times or concurrently.
Further Explanation of Copyright-Law Provisions
You may transfer all of your rights to use the Software to another workstation,provided that you transfer to that workstation (or destroy) all of the Softwareand documentation provided in this package, together with all copies, tangible orintangible, including copies in RAM or installed on a disk, as well as backupcopies. Remember, once you transfer the Software, it may be used only on thesingle workstation to which it is transferred. Except as stated in this paragraph,you may not otherwise transfer, rent, lease, sublicense, timeshare, or lend theSoftware or documentation. Your use of the Software is limited to acts that areessential steps in the use of the Software on your workstation as described in thedocumentation. You may not otherwise modify, alter, adapt, merge, decompile,or reverse-engineer the Software, and you may not remove or obscure PQSystems’ copyright or trademark notices.
Governing Law and General Provisions
This license statement shall be construed, interpreted, and governed by the lawsof the State of Ohio, USA. If any provision of this statement is found void orunenforceable, it will not affect the validity of the balance of this statement, whichshall remain valid and enforceable according to its terms. If any remedy providedis determined to have failed of its essential purpose, all limitations of liability andexclusions of damages set forth in the Limited Warranty shall remain in full forceand effect. This statement may be modified only in writing signed by you and anauthorized representative of PQ Systems, Inc. Use, duplication, or disclosure bythe US Government of computer software and documentation in this packageshall be subject to the restricted rights applicable to commercial computersoftware (under DFARS 52.227-7013). All rights not specifically granted in thisstatement are reserved by PQ Systems, Inc.

iv SQCpack 2000
Disclaimer of Warranty
THIS SOFTWARE AND THE ACCOMPANYING FILES ARE SOLD “AS IS” ANDWITHOUT WARRANTIES AS TO PERFORMANCE OR MERCHANTABILITY ORANY OTHER WARRANTIES WHETHER EXPRESSED ORIMPLIED. Because ofthe various hardware and software environments into which the Software maybe put, NO WARRANTY OF FITNESS FOR A PARTICULAR PURPOSE ISOFFERED.
Good data processing procedure dictates that any program be thoroughly testedwith noncritical data before relying on it. The user must assume the entire riskof using the Software. ANY LIABILITY OF THE SELLER WILL BE LIMITEDEXCLUSIVELY TO PRODUCT REPLACEMENT OR REFUND OF PURCHASEPRICE.
*** EVALUATION LICENSE AGREEMENT ***
The following license applies to the evaluation version of the Software. If youhave purchased a license for the registered version of the Software, see thesection “REGISTERED LICENSE AGREEMENT” above.
You should read the following terms and conditions carefully before using theSoftware. Unless you have a different license agreement signed by PQ Systems,Inc. your use of the Software indicates your acceptance of this license agreementand warranty.
Evaluation and Registration
This is not free software. Subject to the terms below, you are hereby licensed touse this software for evaluation purposes without charge during the evaluationperiod. If you want to use the Software after the evaluation period then aregistered license must be purchased. The evaluation period may vary from oneSoftware product to another, but in no case does the evaluation period extendbeyond 90 days from the first use of the Software.
Unregistered use of the Software after the evaluation period is in violation ofU.S. and international copyright laws.
Governing Law and General Provisions
This license statement shall be construed, interpreted, and governed by the lawsof the State of Ohio, USA. If any provision of this statement is found void orunenforceable, it will not affect the validity of the balance of this statement,which shall remain valid and enforceable according to its terms. If any remedy

Contents v
provided is determined to have failed of its essential purpose, all limitations ofliability and exclusions of damages set forth in the Limited Warranty shallremain in full force and effect. This statement may be modified only in writingsigned by you and an authorized representative of PQ Systems, Inc. Use,duplication, or disclosure by the US Government of computer software anddocumentation in this package shall be subject to the restricted rights applicableto commercial computer software (under DFARS 52.227-7013). All rights notspecifically granted in this statement are reserved by PQ Systems, Inc.
Disclaimer of Warranty
THIS SOFTWARE AND THE ACCOMPANYING FILES ARE SOLD “AS IS”AND WITHOUT WARRANTIES AS TO PERFORMANCE OR MERCHANT-ABILITY OR ANY OTHER WARRANTIES WHETHER EXPRESSED OR IM-PLIED. Because of the various hardware and software environments into whichthe Software may be put, NO WARRANTY OF FITNESS FOR A PARTICULARPURPOSE IS OFFERED.
Good data processing procedure dictates that any program be thoroughlytested with noncritical data before relying on it. The user must assume theentire risk of using the Software. ANY LIABILITY OF THE SELLER WILL BELIMITED EXCLUSIVELY TO PRODUCT REPLACEMENT OR REFUND OFPURCHASE PRICE.
PQ SYSTEMS, INC.Corporate Headquarters: 10468 Miamisburg-Springboro Road, Miamisburg,Ohio 45342, USA, (937) 885-2255, http://www.pqsystems.com. InternationalOffices: Australia 03-9770-1960, United Kingdom (01704) 871465.
All PQ Systems products are trademarks of Productivity-Quality Systems, Inc.,Copyright (c) 1998-2000 Productivity-Quality Systems, Inc.All rights reserved.

vi SQCpack 2000
Contents vii
Contents
Welcome .................................................................................... 13
What’s new in SQCpack? ................................................... 13About your SQCpack documentation ................................. 14About PQ Systems .............................................................. 14Reaching PQ Systems Sales and Technical Support ........... 17
Section 1 Installing SQCpack 2000 ............................................ 19
In this section ..................................................................... 19Hardware and software requirements .................................. 19Using the installation README file .................................... 19Installing SQCpack ............................................................ 20Converting a trial license ................................................... 20Converting database files from older ......................................versions of SQCpack .......................................................... 21
Section 2 Getting Started ........................................................... 23
In this section ..................................................................... 23Why SQCpack? .................................................................. 23The process ........................................................................ 24Starting SQCpack ............................................................... 24Logging in as a different user ............................................. 24Overview of key SQCpack forms ....................................... 25Toolbar icons ...................................................................... 36Accessing Menus................................................................ 38Getting Help ...................................................................... 38Exiting SQCpack ................................................................ 39
Section 3 Quick reference ......................................................... 41
In this section ..................................................................... 41Accessing Menus................................................................ 41Pop-up Menu functions ....................................................... 41Menus available from the main screen ............................... 42Groups setup form .............................................................. 64Data entry tab menus ......................................................... 66Charts/Limits tab ................................................................ 70Chart display menus ........................................................... 71
viii SQCpack 2000
Section 4 Tutorial ....................................................................... 73
Lesson 1Group setup ........................................................... 74Lesson 2 Data entry ............................................................ 77Lesson 3 Charts, limits, and filters ...................................... 78Lesson 4 Multi-charts and Workspaces ............................... 84Lesson 5 Chart styles .......................................................... 87Lesson 6 Working with Attributes data ............................... 89Lesson 7 Working with Pareto data .................................... 92Lesson 8 Choice lists .......................................................... 94Lesson 9 Working with calculated characteristics .............. 96
Section 5 The SQCpack 2000 Database ..................................... 99
In this section ..................................................................... 99Organizing data in SQCpack ............................................. 99Database Menu .................................................................100Creating new database files ..............................................101Opening database files ......................................................102Converting database files from older versions of SQCpack 102Managing database files ....................................................104Global user databases ........................................................105
Section 6 Working with groups and characteristics ...................109
In this section ....................................................................109 Creating a group...............................................................110Creating group identifiers ..................................................113Creating characteristics .....................................................115Modify groups, characteristics, and identifiers ..................127Copying groups, characteristics, and identifiers ................127Deleting groups, characteristics, and identifiers ................128Information ........................................................................129Print data ...........................................................................129Export data ........................................................................129
Section 7 Data and chart types ..................................................131
In this section ....................................................................131Variables data ...................................................................132Attributes data ...................................................................143Pareto data ........................................................................148
Contents ix
Section 8 Entering and editing data ...........................................151
In this section ....................................................................151The data entry process .......................................................152Navigating the data editor ................................................152Formatting the data editor .................................................159Entering identifiers and data ..............................................159Entering identifiers from choice lists ..................................160Entering data directly through a device .............................160Entering notes and assignable causes ................................160Editing data .......................................................................164Saving data .......................................................................166Exiting the data editor .......................................................166
Section 9 Real-time charting .....................................................167
In this section ....................................................................167Displaying real-time charts ...............................................167Real-time data entry ..........................................................168Real-time data entry with a device ...................................169Navigating through the real-time chart ..............................170Adding notes and causes ...................................................172Out-of-control testing ........................................................173Alarms and Preferences .....................................................173
Section 10 Charts .......................................................................177
In this section ....................................................................177Auto charts ........................................................................177Creating charts ..................................................................178Chart options .....................................................................179Control limits ....................................................................193Pareto chart .......................................................................208Display chart .....................................................................210Chart display .....................................................................211Print ...................................................................................220The chart display Edit Menu ..............................................221Editing chart setup .............................................................222Copying charts ..................................................................222Deleting a chart ................................................................223ClipCHART .......................................................................223
x SQCpack 2000
Section 11 Multi-charts .............................................................225
In this section ....................................................................225Creating new Multi-charts .................................................225The Multi-chart display .....................................................228Modify a Multi-chart .........................................................231Printing Multi-charts from the SQCpack Tree ....................231Copying a Multi-chart .......................................................232Deleting a Multi-chart .......................................................232
Section 12 Workspaces .............................................................233
In this section ....................................................................233Creating new Workspaces .................................................233Removing a chart from the Workspace ..............................235Modifying a chart in the Workspace .................................235Display a Workspace ........................................................235Modify a Workspace .........................................................236Printing Workspaces ..........................................................236Save all chart images ........................................................237Copying a Workspace .......................................................237Deleting Workspace ..........................................................238
Section 13 Reports .....................................................................239
In this section: ...................................................................239Report templates ...............................................................239Creating reports .................................................................244Previewing and printing reports .........................................249Saving reports as a file ......................................................250
Section 14 Importing data .........................................................251
In this section: ...................................................................251Import options ...................................................................251Automated and custom imports .........................................252Memorized import .............................................................263Editing a memorized import ..............................................264
Section 15 Configuring SQCpack 2000 .....................................265
In this section ....................................................................265Setting preferences ............................................................265Default charts ....................................................................275Security .............................................................................275Chart styles .......................................................................284Out-of-control tests ............................................................289Language ...........................................................................292Choice lists .......................................................................292Printer setup ......................................................................295

Contents xi
Appendix A Formulas used by SQCpack ..................................297
Variables formulas .............................................................297Attributes formulas ............................................................304Tabular constants for X-bar and range ................................306Tabular constants for individuals and moving range ..........306Tabular constants for X-bar and sigma ...............................307Tabular constants for median charts ..................................307Capability analysis ............................................................308
Appendix B Network security ....................................................311
Operating system security .................................................311Security inside SQCpack ...................................................312
Appendix C Supplementary Papers ...........................................313
Non-normal Data Analysis in SQCpack Using Pearson Curve Fitting .................................................313Using Spec Limits on Control Charts .................................323References ........................................................................327
Appendix D Data Filter Examples .............................................329
Example 1 Basic Filter .....................................................329Example 2 Like Filter ........................................................331Example 3 Date Filter .......................................................331Example 4 Time filter ........................................................332Example 5 Exclusion filter (not equal to) ...........................332Example 6 Missing data ....................................................332
Appendix E Glossary ..................................................................333
Appendix F Out-of-control tests and codes ................................337
AIAG .................................................................................337AT&T .................................................................................337Duncan..............................................................................337Gitlow Attributes ...............................................................338Gitlow Variables ...............................................................338Hughes ..............................................................................338Juran ..................................................................................338Shewhart ...........................................................................339SQCWIN ...........................................................................339Western .............................................................................339
Index ..........................................................................................341
Request for New Features ..................................................357

xii SQCpack 2000
Welcome
Welcome to SQCpack 2000, the latest version of our popular statisticalprocess control software. SQCpack 2000 combines powerful SQCtechniques with flexibility and user-friendliness, making data analysiseasier than ever. It allows you to create a variety of charts and reports,using system defaults or your own custom settings.
If you are new to SQCpack 2000, you may want to turn to Chapter 3,“Tutorial,” for a quick, simple tutorial about using key features of theproduct.
What’s new in SQCpack?In version 4.6� Summary reporting
� Chart annotation
� Statistics as chart titles
� Cusum charts
� Control chart and histogram combination button
� Expanded chart styles and new style editor
In version 4.5� Real-time charting
� E-mail alarms for an out-of-control condition exists
� ClipCharts (for sharing charts with people who do not haveSQCpack)
14 SQCpack 2000
About your SQCpack documentationSQCpack includes the following:
❖❖❖❖❖ User Guide This document.
❖❖❖❖❖ On-line Help This provides descriptions of theapplication’s commands and windows.It appears when you select a help optionfrom the Help Menu or press 1. Formore information, see “Getting Help” inSection 2, Getting Started.
❖❖❖❖❖ SQC Quality AdvisorTM This provides an overview of using SQCtools. It explains SQC terminology andissues. The SQC Quality Advisor is anon-line help file that you can open fromthe Help Menu.
About PQ SystemsProductivity-Quality Systems, Inc. is a full-service firm dedicated tohelping customers continuously improve their organizations. We offer acomprehensive network of products and services designed to improvequality, productivity, and competitive position for all industries. The fullline of improvement products and services from PQ Systems includes:
CHARTrunner generates process performance charts and performsstatistical analysis using data that is collected, stored, and managed byother applications. CHARTrunner eliminates the need for complex importing,time consuming exporting, and tedious data entry.
CHARTrunner-e is a web-based charting solution. It works with thedesktop version of CHARTrunner to generate SPC and other processperformance charts and performs statistical analysis using data that iscollected, stored, and managed by other applications. It then makes thosecharts available for viewing through a standard web browser.
GAGEpack® 2000 is 32-bit gage calibration tracking software that man-ages a complete history of measurement devices, instruments, and gages.GAGEpack 2000 helps organizations conform to ISO 9000, QS-9000 andother calibration standards. Features include comprehensive R&Rstudies, improved security, enhanced sorting, and flexible reports.
Welcome 15
R&Rpack® 2000 provides users with a complete statistical and graphicalanalysis of their measurement systems. Its reports and charts meet AIAGstandards and help organizations to conform to ISO and QS-9000 .requirements. Charts include gage performance curves, accuracy/devia-tion histograms, accuracy/linearity charts, control charts, intraclasscorrelation, interaction plots, and EMP charts.
DOEpack® 2000 is easy-to-use design of experiments software that guidesyou through a logical, step-by-step process for planning, designing,implementing, and interpreting effective experimental designs. It helpsyou to optimize responses and identify winning combinations so that yousave time and money and produce higher quality products.
PORTspy 2000 transfers data easily from a wide variety of measuringdevices into SQCpack 2000 and other popular software programs.PORTspy 2000 saves time, eliminates data input errors, guides usersthrough setup with an easy-to-use wizard, and manages data frommultiple devices simultaneously.
MEASUREspy bridges the communication gap between complex datafrom measurement devices and analysis software. MEASUREspy caneasily find the important data in complicated, structured output, such asfiles from CMMs. MEASUREspy virtually eliminates keyboard or manualdata entry, as well as the errors associated with these tasks. By workingwith the increasingly sophisticated devices used throughout manufactur-ing industries, it makes critical data immediately available for analysiswith SQCpack or other software programs.
SPC Workout is an interactive multimedia-training course that provideseffective step-by-step instruction on how to implement and use statisticalprocess control. SPC Workout’s three modules—a statistics primer,control chart basics, and advanced control charting—make it suitable forworkers at all levels. On-line exercises, and end-of-unit tests documentthe learners’ progress while the colorful graphics and full audio keeplearners interested.
FMEA Investigator is an interactive multimedia-training course thatprovides effective instructions for conducting both design and processFMEAs as required by QS-9000. It teaches you how to customize ratingscales for your specific design or process to assure meaningful informa-tion and results from the FMEA. In addition, you will learn how to linkFMEAs to control plans and have access to worksheet and rating scalestemplates. The FMEA Investigator illustrates concepts with two casestudies of companies that used FMEAs to improve their product designand manufacturing processes.

16 SQCpack 2000
Gage Mentor is a step-by-step multimedia training course that provideseffective instructions on how to take successful dimensional measurements.Gage Mentor consists of two modules: Using Gages and Managing Gages.Using Gages teaches how to properly use a wide variety of dimensionalgages, how to read symbols on engineering drawings, and how to avoidcommon measurement errors. Managing Gages teaches proper gagemanagement and measurement system analysis.
Six Sigma Start-Up is an introductory course on the principles and prac-tices of Six Sigma. It is a computer-based interactive training system thatteaches operators, engineers, supervisors, and managers the key concepts ofsix sigma so they will be better prepared to support a company’s six sigmaefforts.
Total Quality Transformation® offers step-by-step help in facilitating thequality transformation in organizations. Materials include Foundations forLeaders, Team Skills, Alignment Guide, Improvement Guide, Strategic QualityPlanning Guide, Improvement Tools, Total Quality Tools, and Total Quality Toolsfor Windows. TQT is a part of the Transformation of American Industry
®
training project, which has been used in a variety of manufacturing andservice organizations since 1984.
Consulting and Training Services are offered by PQ Systems for companiesat all stages of their quality management programs. A staff of highly-qualified consultants brings practical experience from both industrial andacademic environments. Seminars and on-site training programs areavailable to help companies implement successful quality managementprograms.

Welcome 17
Reaching PQ Systems Sales and TechnicalSupportPQ Systems invites your questions and comments about our products andservices.
Sales 1-800-777-3020 937-885-2255
PQ Systems, Inc.10468 Miamisburg-Springboro Rd.Miamisburg, OH 45342
Call Sales for:
� General information to help you decide to purchase or evaluate thesoftware
� To place an order or check the status of an order
The E-mail address is:� [email protected]
Fax 937-885-2252You can send a fax to either Sales or Technical Support. To ensure thatyour fax is delivered quickly to the right department, please send it toAttn: Sales or Attn: Technical Support.
World Wide Web URLhttp://www.pqsystems.com
International OfficesPQ Systems Europe Ltd.Ryeground House, Ryeground Lane,Freshfield, Formby, Merseyside L37 7EQ EnglandTel. 01704 871465Fax 01704 875189
PQ Systems Pty. Ltd.Level 6, Peninsula Centre 435-437 Nepean HighwayFrankston, Victoria 3199 AustraliaTel. 03-9770-1960Fax 03-9770-1995

18 SQCpack 2000
Technical Support 1-800-777-5060 937-885-2255
Call our experienced technical support team. Our experts can answerquestions about software problems, data analysis, and applications.
Before You CallPlease follow these steps to help our technical advisors answer yourquestions quickly:
� Have your license/serial number ready. It is listed in the AboutSQCpack dialog box. You can access this dialog box by selectingAbout from the Help Menu.
� Be at your computer, if possible.
� Review the topic for which you have a question in the User Guide.
The E-mail Address is:� [email protected]
Section 1 Installing SQCpack 2000 19
Section 1
Installing SQCpack 2000
In this sectionThis section looks at the following topics:
� Hardware and software requirements
� Using the README file
� Installing SQCpack
� Upgrading from a trial license
Hardware and software requirementsYou need the following to run SQCpack:
� Pentium PC with at least 32 megabytes of memory; 64 megabytes ofmemory is recommended
� A hard drive with at least 30 megabytes of free space
� VGA or SVGA graphics adapters
� Windows 95, 98, 2000, or Windows NT
Using the installation README fileWe strive to continuously improve our software and occasionally makechanges that affect the look or use of SQCpack. We are not always able toinclude this information in the manual that you receive with the product.Instead, we include this information in a README file on the CD thatcontains the program files. This file has a separate icon in the SQCpackgroup or folder. To open the README file, double-click on this icon.
1
20 SQCpack 2000
Installing SQCpackTo install SQCpack:
1. Put the Quality Suite CD in your CD drive and close the drive. The CDshould launch automatically. If it does not:
a. Open the Start Menu and select Run.
b. In the Run form, type the letter of your CD drive, followed by colon,backslash, and setup. For example, if your Quality Suite CD is inyour D drive, you would type D:\setup.
c. Select K.
2. From the introduction screen, click on >> or press the d key. Fromthe Quality Suite Main Menu, select Install Products.
3. From the Quality Suite Software screen, click on SQCpack. Follow on-screen installation instructions to complete the install.
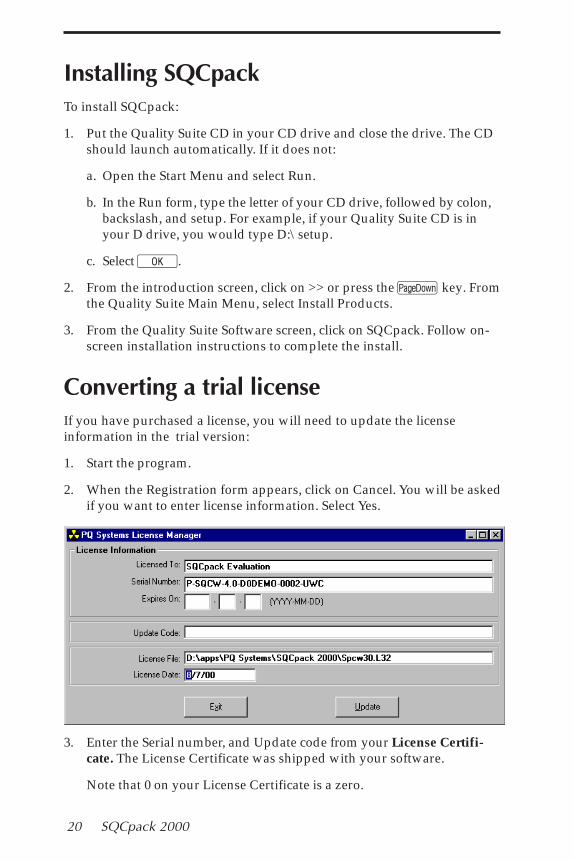
Converting a trial license If you have purchased a license, you will need to update the licenseinformation in the trial version:
1. Start the program.
2. When the Registration form appears, click on Cancel. You will be askedif you want to enter license information. Select Yes.
3. Enter the Serial number, and Update code from your License Certifi-cate. The License Certificate was shipped with your software.
Note that 0 on your License Certificate is a zero.
Section 1 Installing SQCpack 2000 21
If you did not receive this certification, contact your PQ Systems SalesRepresentative.
United States 1-800-777-3020.
Australia 03-9770-1960
England 01704 871465
To review the license agreement, please refer to page iii at the front of thisUser Guide.
Converting database files from olderversions of SQCpackIf SQCpack 3.x is installed, SQCpack 2000 will prompt you to automati-cally convert SQCpack 3.x databases.
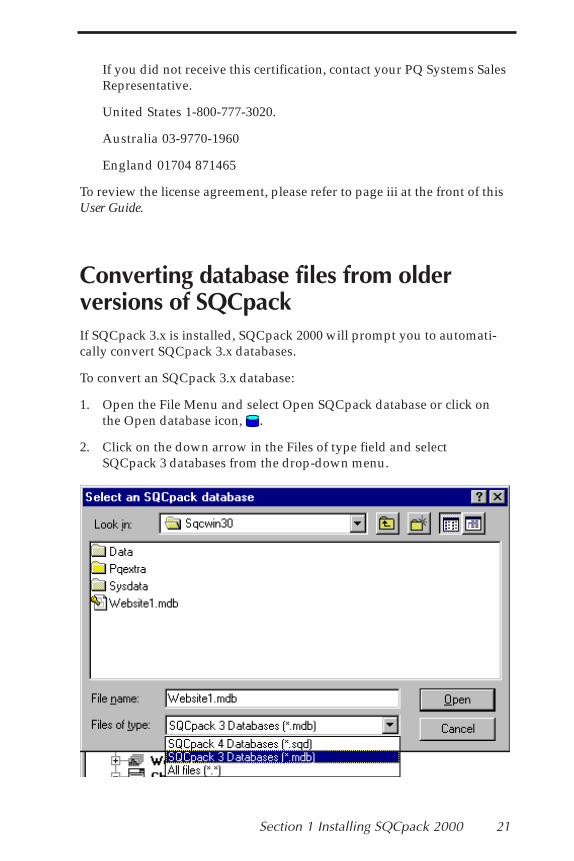
To convert an SQCpack 3.x database:
1. Open the File Menu and select Open SQCpack database or click onthe Open database icon, .
2. Click on the down arrow in the Files of type field and selectSQCpack 3 databases from the drop-down menu.
22 SQCpack 2000
3. Select the SQCpack 3 database that you want to convert and click onOpen.
4. Select the path for the converted database, for example, c:\ProgramFiles\SQCpack 2000\data\.
SQCpack 2000 will convert the database as before opening it. Note thatfor a large database, this process may take several minutes. If any groupsin the 3.x database are not successfully converted, SQCpack 2000 willcreate a log file during the conversion process.
For earlier versions of SQCpack, please contact the nearest PQ SystemsTechnical Support department:
United States: 1-800-777-5060 or [email protected]
Australia: 03-9770-1960 or [email protected]
England: 01704 871465 or [email protected]
Section 2 Getting Started 23
Section 2
Getting Started
In this sectionThis section provides an overview of the software, illustrates keySQCpack forms, and provides information on program settings andnavigating through the software. This section covers the following topics:
� Why SQCpack?
� The process
� Starting SQCpack
� The SQCpack Tree
� Key forms and tabs
� Exiting SQCpack
� Getting help
Why SQCpack?SQCpack helps users take control of service and manufacturingprocesses. SQCpack makes statistical process control easy by automati-cally performing lengthy calculations and by quickly creating charts. Useit to monitor and improve systems throughout your organization fromsales to production to customer service. SQCpack will help you findprocess problems quickly, and provides the tools for prioritizing them. Itprovides online answers to your SPC questions including chart selectionand interpretation.
2
24 SQCpack 2000
To view a chart in SQCpack:
1. See the topic “Creating a group” inSection 6, Working with Groups andcharacteristics.
2. See the topic “Creating characteristic”in Section 6, Working with Groups andcharacteristics.
3. See the topic “Entering identifiers anddata” in Section 8, Entering and editingdata.
4. See the topic “Control limits” in Section10, Charts. Skip this step for histograms,run charts and Pareto charts
5. See Section 10, Charts.
Starting SQCpackTo start SQCpack:
1. Click on the Start Menu and select SQCpack. This will likely be foundunder Start, Programs, PQ Systems, SQCpack. Or if the SQCpack 2000icon was added to the desktop, simply double-click on the icon.
2. If SQCpack has been configured for users to log in, a login form willappear. Type your user and password and click Enter.
Logging in as a different userTo change the login without shutting down the program (this is availableonly if the User login required option is selected in the Supervisor useraccount):
1. Open the File Menu, and select Log in as a different user. TheSQCpack login window will open.
2. Type your name and password. Press the T key to move betweenfields. Press the R key or click on K when you are finished.
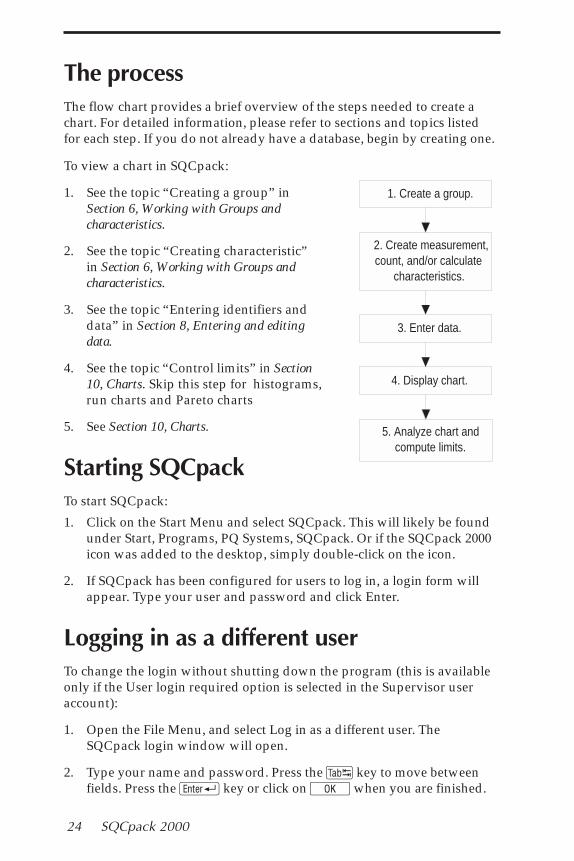
The processThe flow chart provides a brief overview of the steps needed to create achart. For detailed information, please refer to sections and topics listedfor each step. If you do not already have a database, begin by creating one.
1. Create a group.
2. Create measurement, count, and/or calculate
characteristics.
3. Enter data.
4. Display chart.
5. Analyze chart and compute limits.
Section 2 Getting Started 25
Overview of key SQCpack forms
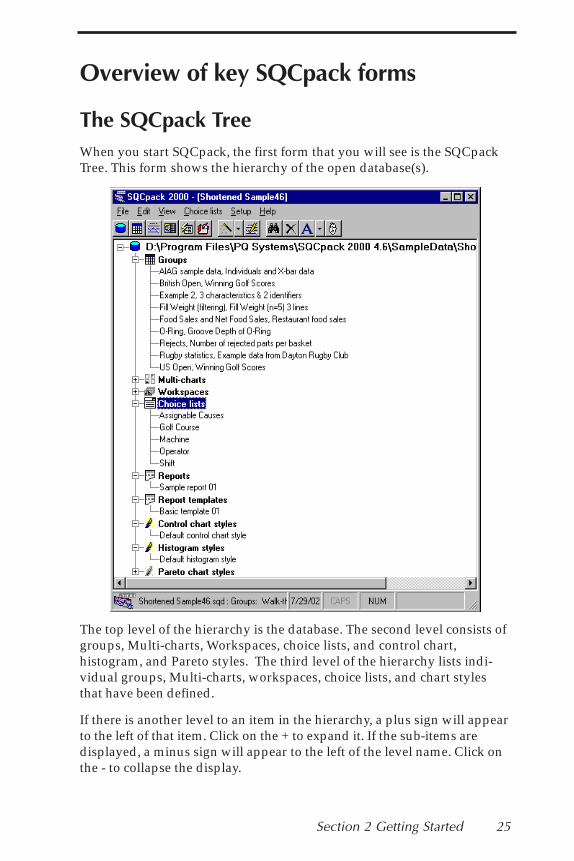
The SQCpack TreeWhen you start SQCpack, the first form that you will see is the SQCpackTree. This form shows the hierarchy of the open database(s).
The top level of the hierarchy is the database. The second level consists ofgroups, Multi-charts, Workspaces, choice lists, and control chart,histogram, and Pareto styles. The third level of the hierarchy lists indi-vidual groups, Multi-charts, workspaces, choice lists, and chart stylesthat have been defined.
If there is another level to an item in the hierarchy, a plus sign will appearto the left of that item. Click on the + to expand it. If the sub-items aredisplayed, a minus sign will appear to the left of the level name. Click onthe - to collapse the display.
26 SQCpack 2000
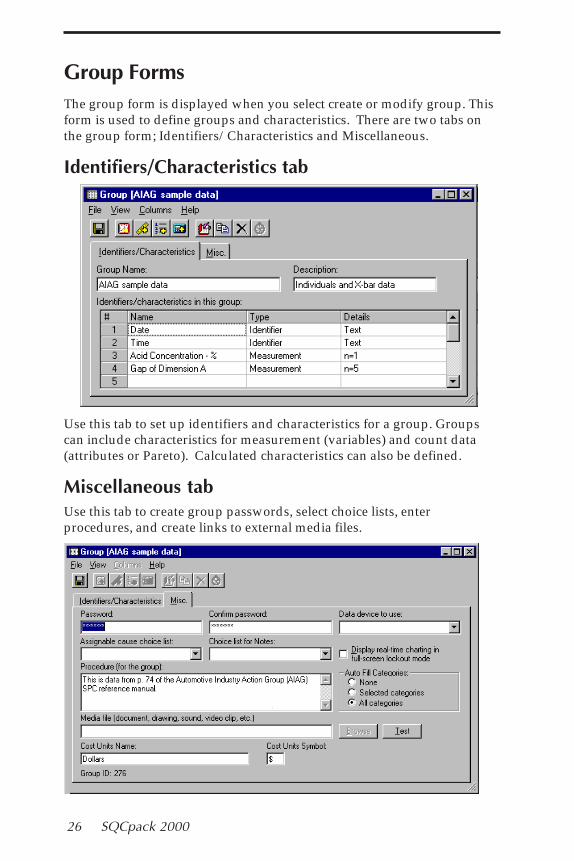
Group FormsThe group form is displayed when you select create or modify group. Thisform is used to define groups and characteristics. There are two tabs onthe group form; Identifiers/Characteristics and Miscellaneous.
Identifiers/Characteristics tab
Use this tab to set up identifiers and characteristics for a group. Groupscan include characteristics for measurement (variables) and count data(attributes or Pareto). Calculated characteristics can also be defined.
Miscellaneous tabUse this tab to create group passwords, select choice lists, enterprocedures, and create links to external media files.

Section 2 Getting Started 27
When you create and define a group, SQCpack creates a table that will beused to store data for that group.
Data entry formThe data entry form consists of two tabs, one for entering data and one forcreating, modifying, and viewing charts.
Data entry tabThe data entry form is available from the Group Menu or the pop-upmenu for an individual group. Enter data and identifiers for the group.
28 SQCpack 2000
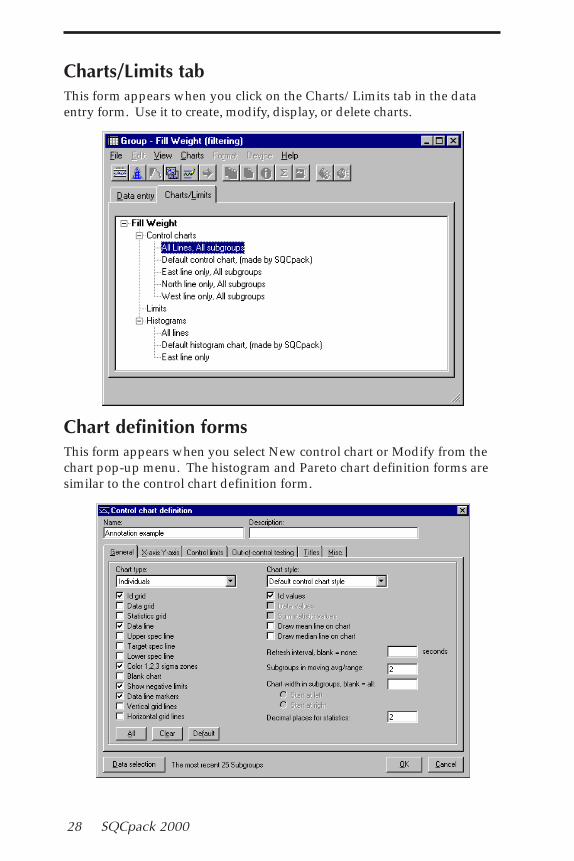
Charts/Limits tabThis form appears when you click on the Charts/Limits tab in the dataentry form. Use it to create, modify, display, or delete charts.
Chart definition formsThis form appears when you select New control chart or Modify from thechart pop-up menu. The histogram and Pareto chart definition forms aresimilar to the control chart definition form.
Section 2 Getting Started 29
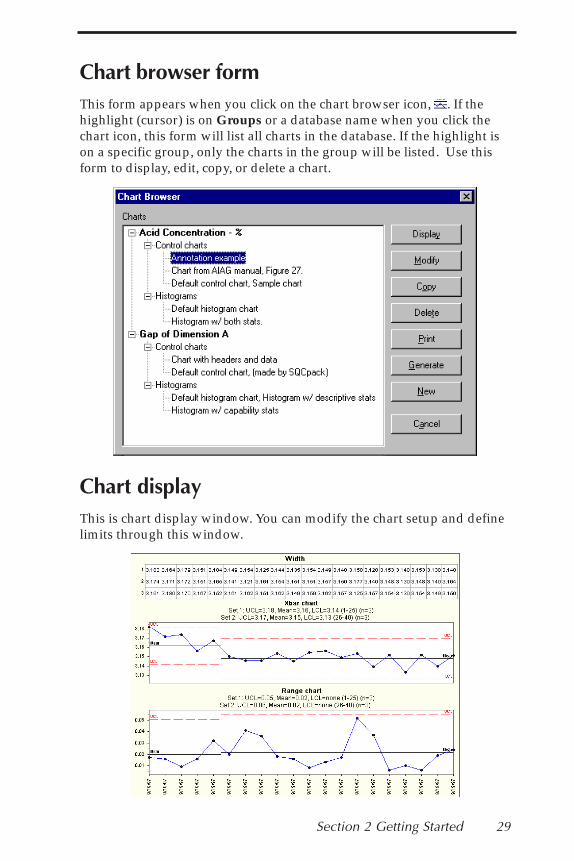
Chart browser formThis form appears when you click on the chart browser icon, . If thehighlight (cursor) is on Groups or a database name when you click thechart icon, this form will list all charts in the database. If the highlight ison a specific group, only the charts in the group will be listed. Use thisform to display, edit, copy, or delete a chart.
Chart displayThis is chart display window. You can modify the chart setup and definelimits through this window.
30 SQCpack 2000
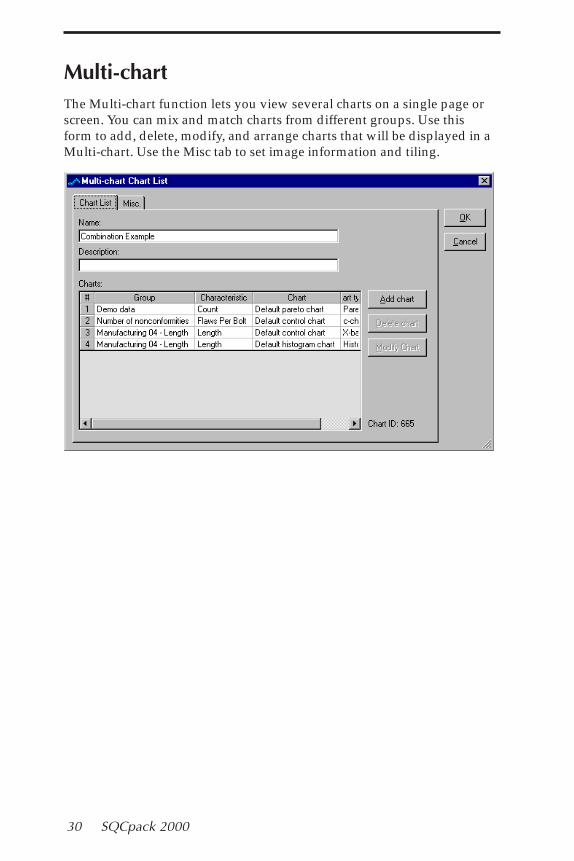
Multi-chartThe Multi-chart function lets you view several charts on a single page orscreen. You can mix and match charts from different groups. Use thisform to add, delete, modify, and arrange charts that will be displayed in aMulti-chart. Use the Misc tab to set image information and tiling.
Section 2 Getting Started 31
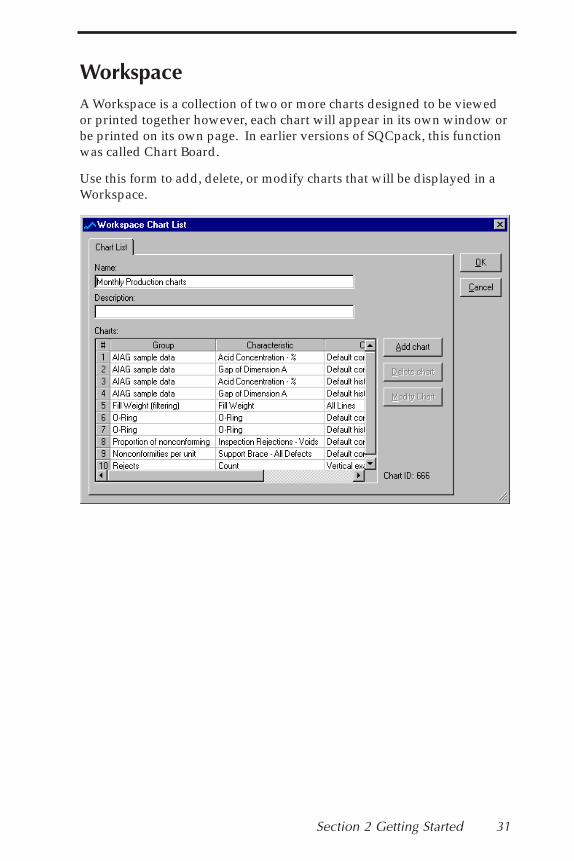
WorkspaceA Workspace is a collection of two or more charts designed to be viewedor printed together however, each chart will appear in its own window orbe printed on its own page. In earlier versions of SQCpack, this functionwas called Chart Board.
Use this form to add, delete, or modify charts that will be displayed in aWorkspace.
32 SQCpack 2000
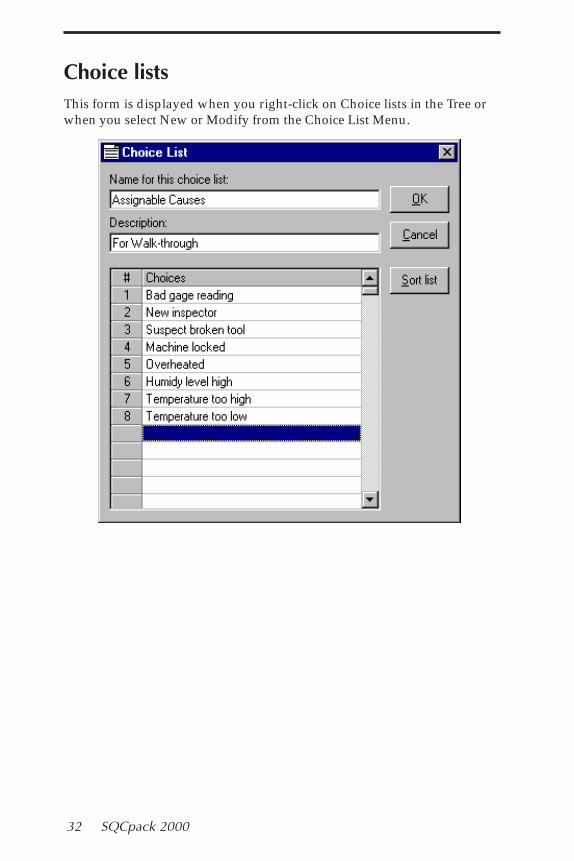
Choice listsThis form is displayed when you right-click on Choice lists in the Tree orwhen you select New or Modify from the Choice List Menu.
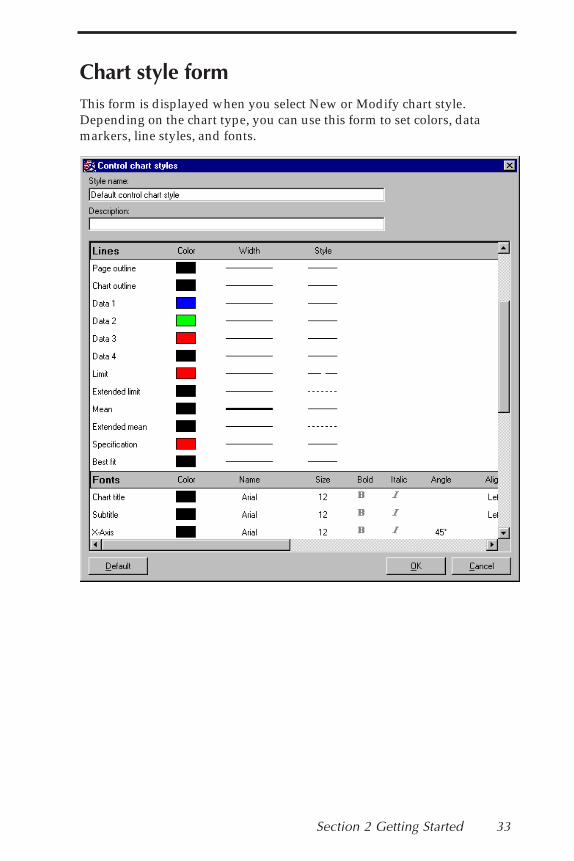
Section 2 Getting Started 33
Chart style formThis form is displayed when you select New or Modify chart style.Depending on the chart type, you can use this form to set colors, datamarkers, line styles, and fonts.
34 SQCpack 2000
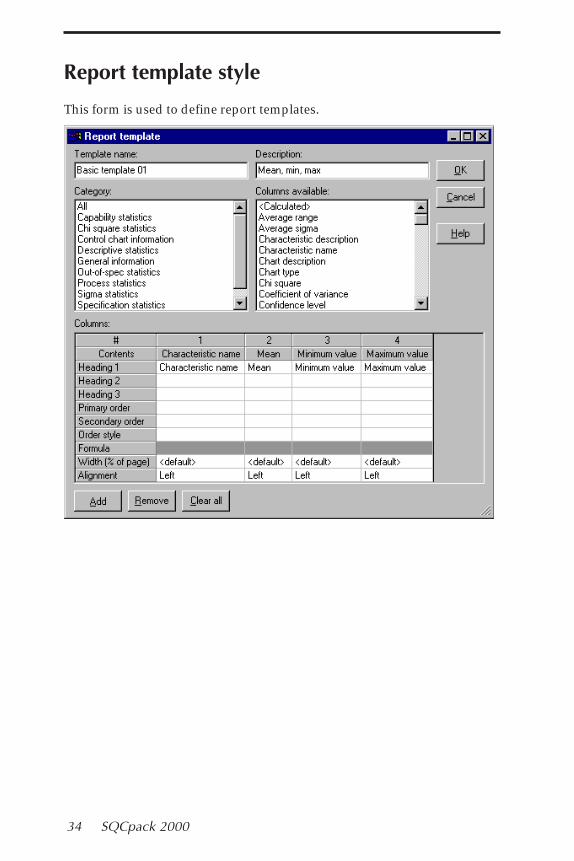
Report template style
This form is used to define report templates.
Section 2 Getting Started 35
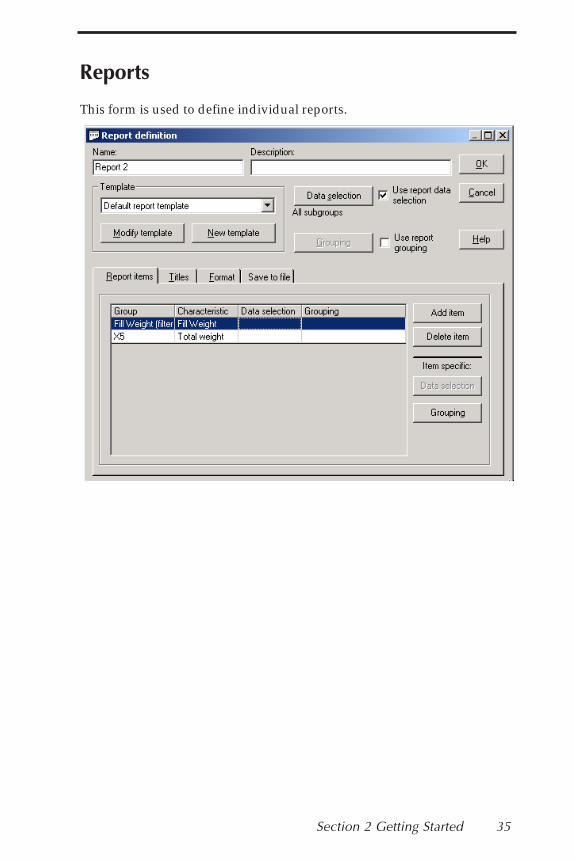
Reports
This form is used to define individual reports.
36 SQCpack 2000
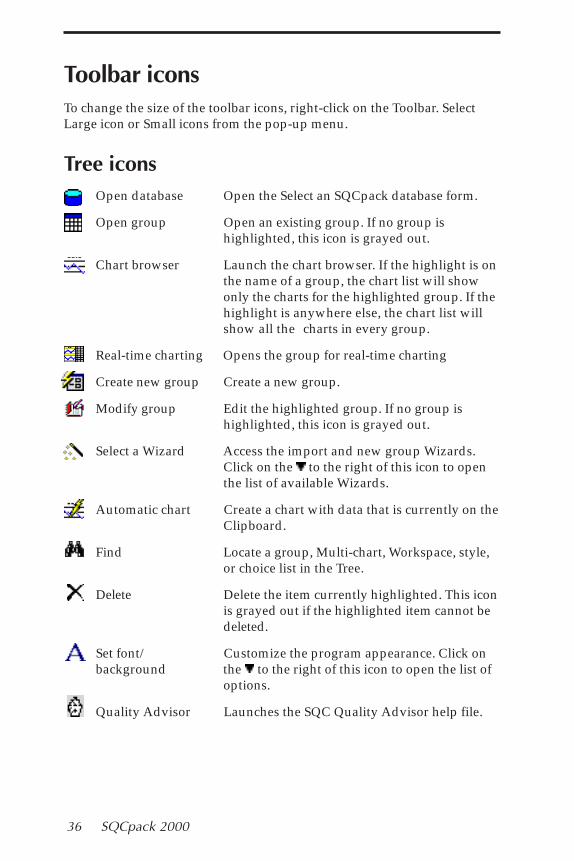
Toolbar iconsTo change the size of the toolbar icons, right-click on the Toolbar. SelectLarge icon or Small icons from the pop-up menu.
Tree iconsOpen database Open the Select an SQCpack database form.
Open group Open an existing group. If no group ishighlighted, this icon is grayed out.
Chart browser Launch the chart browser. If the highlight is onthe name of a group, the chart list will showonly the charts for the highlighted group. If thehighlight is anywhere else, the chart list willshow all the charts in every group.
Real-time charting Opens the group for real-time charting
Create new group Create a new group.
Modify group Edit the highlighted group. If no group ishighlighted, this icon is grayed out.
Select a Wizard Access the import and new group Wizards.Click on the to the right of this icon to openthe list of available Wizards.
Automatic chart Create a chart with data that is currently on theClipboard.
Find Locate a group, Multi-chart, Workspace, style,or choice list in the Tree.
Delete Delete the item currently highlighted. This iconis grayed out if the highlighted item cannot bedeleted.
Set font/ Customize the program appearance. Click onbackground the to the right of this icon to open the list of
options.
Quality Advisor Launches the SQC Quality Advisor help file.
Section 2 Getting Started 37
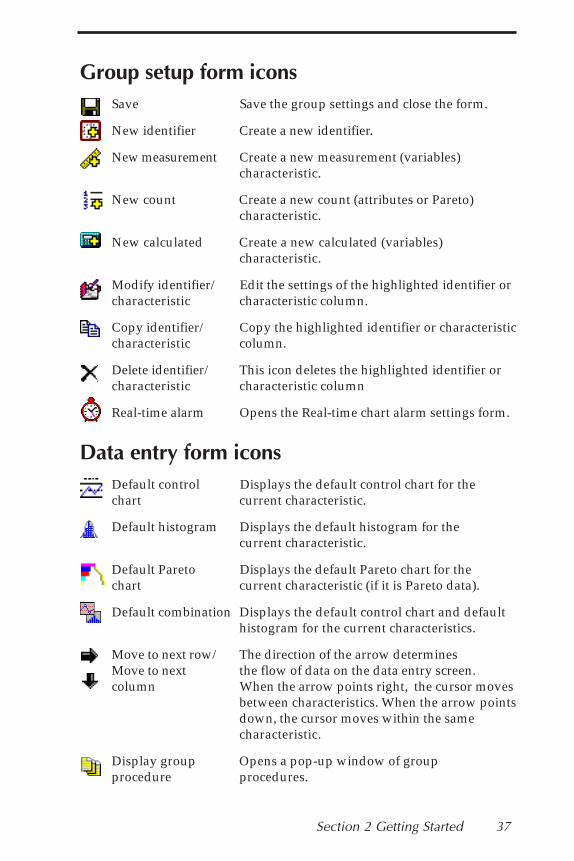
Group setup form iconsSave Save the group settings and close the form.
New identifier Create a new identifier.
New measurement Create a new measurement (variables)characteristic.
New count Create a new count (attributes or Pareto)characteristic.
New calculated Create a new calculated (variables)characteristic.
Modify identifier/ Edit the settings of the highlighted identifier orcharacteristic characteristic column.
Copy identifier/ Copy the highlighted identifier or characteristiccharacteristic column.
Delete identifier/ This icon deletes the highlighted identifier orcharacteristic characteristic column
Real-time alarm Opens the Real-time chart alarm settings form.
Data entry form iconsDefault control Displays the default control chart for thechart current characteristic.
Default histogram Displays the default histogram for thecurrent characteristic.
Default Pareto Displays the default Pareto chart for thechart current characteristic (if it is Pareto data).
Default combination Displays the default control chart and defaulthistogram for the current characteristics.
Move to next row/ The direction of the arrow determinesMove to next the flow of data on the data entry screen.column When the arrow points right, the cursor moves
between characteristics. When the arrow pointsdown, the cursor moves within the samecharacteristic.
Display group Opens a pop-up window of groupprocedure procedures.
38 SQCpack 2000
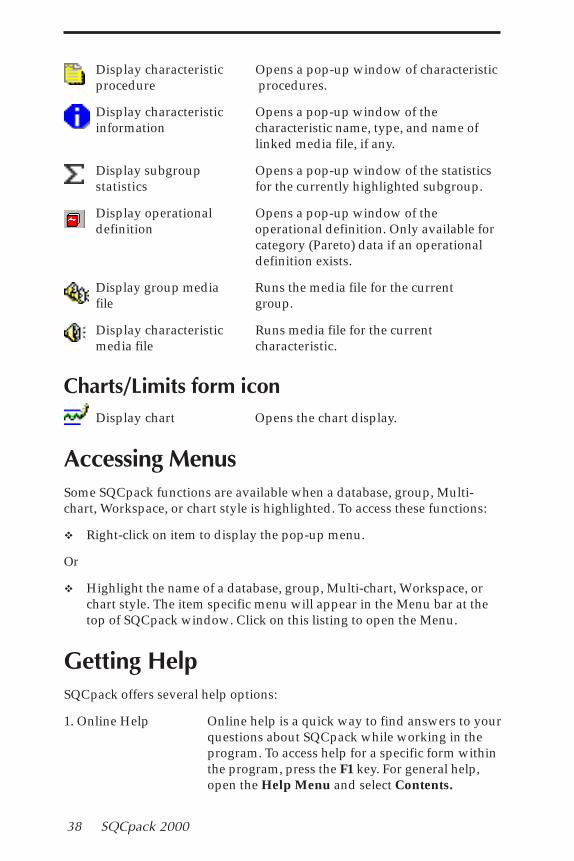
Display characteristic Opens a pop-up window of characteristicprocedure procedures.
Display characteristic Opens a pop-up window of theinformation characteristic name, type, and name of
linked media file, if any.
Display subgroup Opens a pop-up window of the statisticsstatistics for the currently highlighted subgroup.
Display operational Opens a pop-up window of thedefinition operational definition. Only available for
category (Pareto) data if an operationaldefinition exists.
Display group media Runs the media file for the currentfile group.
Display characteristic Runs media file for the currentmedia file characteristic.
Charts/Limits form iconDisplay chart Opens the chart display.
Accessing MenusSome SQCpack functions are available when a database, group, Multi-chart, Workspace, or chart style is highlighted. To access these functions:
� Right-click on item to display the pop-up menu.
Or
� Highlight the name of a database, group, Multi-chart, Workspace, orchart style. The item specific menu will appear in the Menu bar at thetop of SQCpack window. Click on this listing to open the Menu.
Getting HelpSQCpack offers several help options:
1. Online Help Online help is a quick way to find answers to yourquestions about SQCpack while working in theprogram. To access help for a specific form withinthe program, press the F1 key. For general help,open the Help Menu and select Contents.
Section 2 Getting Started 39
2. Tool tips If you hold the mouse pointer over an icon, apop-up help message will appear. Move themouse away from the icon to clear the message.
3. SQC Quality Advisor The online SQC Quality Advisor providesanswers to commonly-asked questions aboutSPC. To open the SQC Quality Advisor, open theHelp menu and select Quality Advisor.
4. README file This file contains updated information onSQCpack. It has a separate icon in the SQCpackfolder.
5. Technical Support SQCpack 2000 includes one year of technicalsupport. Our technical support team will behappy to answer your questions. For technicalsupport:
In North and South America, contact our USoffice at:
800-777-5060 or 937-885-2255 [email protected]
In Europe or Africa, contact our UK office at: 01704 871465 or [email protected]
In Australia or Asia, contact our Australia officeat:03-9770-1960 or [email protected]
Technical support information is also availableonline at:http://pqsystems.com/support/support.htm
Exiting SQCpackTo exit SQCpack:
❖ Press A+4 or open the File Menu and select Exit.

40 SQCpack 2000
Section 3 Quck reference 41
Section 3
Quick reference
In this sectionThis section is a quick reference for users who are already familiar withSQCpack 2000. It provides a quick reference to key functions menu-by-menu, screen-by-screen. It does not provide detail on using the functions.For more detailed information, refer to the rest of the User Guide.
� Pop-up menus
� Menus available from the Tree
� Groups form menus
� Data entry form menus
� Charts/Limits form menus
Accessing MenusSome SQCpack menus are available only when a database, group, Multi-chart, Workspace, choice list, or chart style is highlighted. To access thesefunctions:
� Highlight Database, Group, Multi-chart, Workspace, Choice list, orChart style in the Tree. The item-specific menu will appear in theMenu bar at the top of SQCpack window. Click on this listing to openthe Menu.
Pop-up Menu functionsMost of the menu functions described below are also available throughpop-up menus. Right-click on any item in the Tree to open a pop-up menulisting functions available for that item.
3
42 SQCpack 2000
Menus available from the main screen
File Menu
Open an SQCpack databaseTo open an existing database from the Tree:
1. Open the File Menu and select Open an SQCpack database. Or pressC + o simultaneously.
2. Select a database and click Open.
Close current databaseTo close an open database from the Tree:
1. Move the highlight to the database that you want to close.
2. Open the File Menu and select Close current database. Or pressC + 4 simultaneously.
Log in as a different userIf user logins are required, you can close all open databases and log in asa different user:
� Open the File Menu and select Log in as a different user.
This option will be grayed out if user logins are not required.
New SQCpack databaseTo create a new database from the Tree:
1. Open the File Menu and select New SQCpack database. Or press C + N simultaneously.
2. Enter a name for the database and click Save.
ImportTo import data from the Tree:
1. Open the File Menu and select Import.
2. Select an option:� Auto import� Custom import� Memorized import� Edit memorized import

Section 3 Quck reference 43
3. Follow on-screen instructions. For more information on importing data,please refer to Section 14, “Importing”
UtilitiesSave a chart as a CHARTrunner fileIf you use CHARTrunner, this function will create a .CRF file of a chart youselect. This allows you to share SQCpack charts electronically withCHARTrunner users. If you have the web-enabled CHARTrunner-e, use thisfunction to create chart definitions so that those without SQCpack orCHARTrunner can view charts that they need through their web browsers.
To save a chart as a CHARTrunner file:
1. Open the File Menu and select Utilities, Save a chart as aCHARTrunner file. The Chart browser form will open.
2. Highlight the chart you want and click on the Select button.
3. Name the .CRF file and click on K.
Save chart as a clipCHARTA clipCHART is a file format that allows you to send your SQCpack chartand the associated data to a colleague, customer, or supplier. Your col-league can view the data, change statistics or titles, and even select adifferent type of chart for the data. All the recipient needs is theCHARTrunner Viewer, which is included with SQCpack.
The clipCHART file has a file extension of .CCF. The file contains every-thing a person needs, in order to see the file.
To save a chart as a clipCHART:
1. Open the File Menu and select Utilities. Select Save a chart as aclipCHART. The Chart browser form will open.
2. Highlight the chart that you want to save and click on the Select button.
3. Enter a file name and click on Save.
Current user nameTo check the current active user or user database:
� Open the File Menu and select Utilities, Current user name.
Click on K to close the form.
44 SQCpack 2000
Compact and repair To repair a corrupted database or compress a database file from the Tree:
1. Open the Database that you want to repair or compact.
2. Open Database Menu and select Compact and repair database orright-click on the Database name and select Compact and repairdatabase from the pop-up menu.
Convert an SQCpack 3.x data database To convert an SQCpack 3.x data database to SQCpack 2000 format:
1. Open the File Menu and select Utilities, Convert an SQCpack 3.xdata.
2. In the Select an SQCpack database form, enter the path and name of adatabase or select a database from a folder.
3. Click on the Open button.
Convert an SQCpack 3.x user database To convert an SQCpack 3.x user database to SQCpack 2000 format:
1. Open the File Menu and select Utilities, Convert an SQCpack 3.xuser database.
2. In the select SQCpack 3.x user database to convert field, enter the pathand name of a user database or click on the Browse button to open theSelect form and choose the user database.
3. Select the method for converting the database. Options are:
� Add users to a new global user databaseSelect this to create a new global user database for the 3.x users.
� Add users to the current global user databaseSelect this if you want the 3.x user accounts to be stored in thecurrent global user database.
� Add users to SQC databaseSelect this to include users in the same database as your data.
4. In the Database to add users field, enter the path and name of a userdatabase. For an existing database, click on the Browse button to openthe Select form and choose the user database. Click K to close theSelect form. Click K to complete the conversion.

Section 3 Quck reference 45
New global user databaseTo create a new global user database:
1. Open the File Menu and select Utilities, New global user database.
2. Enter a name and location for the global user database and click onSave.
3. Enter your login name and password. You must have access rights tocreate a global user database.
For more information on global database, security, and access rights, referto Section 13, “Configuring SQCpack.”
Purge groups marked for deletionWhen you delete a group from the database, the group is not permanentlydeleted until you run the Compact and repair utility or select this utility.To purge deleted groups:
� Open the File Menu and select Utilities, Purge groups marked ofdeletion. You will be prompted to confirm the purge. Select Yes topermanently delete the groups, No to cancel the deletion.
Recall selected groupsWhen you delete a group from the database, the group is not permanentlydeleted until you run the Compact and repair utility or purge deletedgroups utilities. Groups that have not been permanently deleted can berestored. To do this.
1. Open the File Menu and select Utilities, Recall selected groups. TheRecall groups marked for deletion form will open.
2. Uncheck a group that you want to restore. Groups with a check willremain marked for deletion.
3. Click on the Recall button.
SQCpack printersTo set a default printer for SQCpack 2000:
1. Open the File Menu and select SQCpack printers. The Select printerfor SQCpack form will open.
2. Select a printer from the drop down menu. If the printer that you wantis not listed, set it up through the Printer control panel (WindowsStart Menu, Settings, Printers).
3. Enter the page margins in the Print margins fields. Margin measure-ments are shown in inches.
46 SQCpack 2000
Most recent databasesSQCpack lists the most-recently-opened databases on the File Menu. Thedefault number of databases in this list is 4. This can be changed throughthe Setup Preferences form.
To open an recently used database:
� Open the File Menu and select the name of the database that you wantto open.
ExitTo exit SQCpack from the Tree:
� Open the File Menu and select Exit.
Edit Menu
Delete To an delete item currently highlighted in the Tree:
1. Move the highlight to the item that you want to delete.
2. Open the Edit Menu and select Delete. Or press the D key.
3. You will be prompted to confirm the action. Select Yes to delete theitem. Select No to cancel the delete.
FindTo locate an item in the Tree:
1. Open the Edit Menu and select Find. Or press C + F simulta-neously. The Find form will open.
2. Enter the search term in the Find What field and click on the Findbutton.
Find nextTo repeat the Find item:
� Open the Edit Menu and select Find Next. Or press 3.
View Menu
ToolbarTo display or turn off the toolbar icons:
� Open the View Menu and select Toolbar.
Section 3 Quck reference 47
Tool Tips To turn the tool tips on or off:
� Open the View Menu and select Tool tips.
Tool tips are the small fields that pop up when the cursor rests on an icon.
Go to >Use this option to move the highlight to quickly find a section of theSQCpack Tree.
1. Open the View Menu and select Go to. A submenu will open.
2. Select the section that you want to find. The highlight and displaywill jump to that section.
Refresh TreeTo refresh the Tree display:
� Open the View Menu and select Refresh Tree. Or press 5.
Database Menu For more information on using the databases, see Section 5, “TheSQCpack database.”
To make the Database Menu appear in the Menu bar:
� In the Tree, move the highlight to the name of a database.
Open To open an existing database from the Tree:
1. Open the Database Menu and select Open.
2. Select a database and click Open.
CloseTo close an open database from the Tree:
1. Move the highlight to the database that you want to close.
2. Open the Database Menu and select Close.
48 SQCpack 2000
New To create a new database from the Tree:
1. Open the Database Menu and select New.
2. Enter a name for the database and click Save.
Compact and repair
To repair a corrupted database or compress a database file from the Tree:
1. Open the Database that you want to repair or compact.
2. Open Database Menu and select Compact and repair database orright-click on the Database name and select Compact and repairdatabase from the pop-up menu.
BackupTo back up a database file from the Tree:
1. Highlight the database that you want to back up.
2. Open the Database Menu and select Backup.
PropertiesTo enable database security:
1. Open the Database Menu and select Properties.
2. Select the security options for the current database and click on K.For more information, see the topic “Security” in Section 15, “Configur-ing SQCpack 2000.”
Groups Menu For more information on groups, see Section 6, ”Working with groups andcharacteristics.”
To make the Groups Menu appear in the Menu bar:
� In the Tree, move the highlight to Groups.
New groupTo create a new group:
� Open the Groups Menu and select New group. The Group form will open.
For more information on creating groups, see Section 6, ”Working withgroups and characteristics.”
Section 3 Quck reference 49
Group MenuFor more information on groups, see Section 6, ”Working with groups andcharacteristics.”
To make the Group Menu appear in the Menu bar:
� In the Tree, move the highlight to the name of a group.
Open (data entry)To open the Data entry form for the highlighted group:
� Open the Group Menu and select Open (data entry).
For more information on entering data, see Section 8,“Entering and editingdata.”
ModifyTo edit the highlighted group:
1. Open the Group Menu and select Modify.
2. Make desired changes and click on the Save icon.
CopyTo copy the highlighted group:
� Open the Group Menu and select Copy.
DeleteTo delete the highlighted group:
1. Open the Group Menu and select Delete.
2. You will be prompted to confirm the action. Select Yes to delete the item.Select No to cancel the delete.
RenameTo rename the highlighted group:
1. Open the Group Menu and select Rename.
2. Type a new name and press the R key.

50 SQCpack 2000
Open (real-time charting)To open the Data entry form for the highlighted group:
� Open the Group Menu and select Open (real-time charting).
For more information on entering data, see Section 9, “Real-time charting.”
Print dataTo print data from the highlighted group:
1. Open the Group Menu and select Print data.
2. Select Print.
3. Select the items that you want to print.
4. Press K.
Export dataTo export data from the highlighted group:
1. Open the Group Menu and select Export data.
2. Select Export.
3. Select the items that you want to export.
4. Press K.
New groupTo create a new group:
� Open the Group Menu and select New. The Group form will open.
For more information, see Section 6, ”Working with groups andcharacteristics.”
InformationTo view group information including name, description, date created, lastmodified date, identifiers, and characteristics:
1. Highlight a group in the Tree.
2. Open the Group Menu and select Information.
Click on K to close the Information window.
Section 3 Quck reference 51
Copy to databaseIf you have more than one database open, this option will appear in theGroup Menu. To copy a group to a different (open) database:
1. Highlight the group that you want to copy.
2. Open the Group Menu and select Copy to database.
3. Select the database to which you want to copy the group.
4. If you want the data to be copied along with the group setup, select Yeswhen prompted.
Multi-chart Menu For more information, see Section 11, “Multi-charts.”
To make the Multi-chart Menu appear in the Menu bar:
� In the Tree, move the highlight to Multi-chart or the name of a Multi-chart.
New Multi-chartTo define a new Multi-chart:
1. Open the Multi-chart Menu and select New Multi-chart. The Chart listform will open.
2. Add the charts you want to include in this Multi-chart.
3. Click K.
For more information, see “Creating Multi-charts” in Section 10,“Multi-charts.”
DisplayTo display the highlighted Multi-chart:
� Open the Multi-chart Menu and select Display. The Multi-chart will open.
ModifyTo edit the highlighted Multi-chart:
1. Open the Multi-chart Menu and select Modify.
2. Make desired changes and click on K.
52 SQCpack 2000
CopyTo copy the charts in the Multi-chart:
� Open the Multi-chart Menu and select Copy.
DeleteTo delete the highlighted Multi-chart:
1. Open the Multi-chart Menu and select Delete.
2. You will be prompted to confirm the action. Select Yes to delete theitem. Select No to cancel the delete.
RenameTo rename the highlighted Multi-chart:
1. Open the Multi-chart Menu and select Rename.
2. Type a new name and press the R key.
Print chart (1 page)To print all the charts in the Multi-chart on one page:
� Open the Multi-chart Menu and select Print chart (1 page).
Print chart (1 page per chart)To print all the charts in the Multi-chart with one chart per page:
� Open the Multi-chart Menu and select Print chart (1 page per chart).
Generate chart image fileTo save the Multi-chart as a graphic file:
1. Highlight the Multi-chart that you want to save.
2. Open the Multi-chart Menu and select Generate chart image file.
3. Select the file type, size, name and folder.
4. Click on K.
InformationTo view information including name, description, date created, lastmodified date, and a list of charts within the Multi-chart:
1. Highlight a group in the Tree.
2. Open the Multi-chart Menu and select Information.
Click on K to close the Information window.
Section 3 Quck reference 53
Workspace MenuTo make the Workspace Menu appear in the Menu bar:
� In the Tree, move the highlight to Workspaces or to the name of aWorkspace.
New WorkspaceTo define a new Workspace:
1. Open the Workspace Menu and select New Workspace. The Chartlist form will open.
2. Add the charts you want to include in this Workspace.
3. Click K.
DisplayTo display the highlighted Workspace:
� Open the Workspace Menu and select Display. The Workspace willopen.
ModifyTo edit the highlighted Workspace:
1. Open the Workspace Menu and select Modify.
2. Make desired changes and click on K.
CopyTo copy the charts in the Workspace:
� Open the Workspace Menu and select Copy.
DeleteTo delete the highlighted Workspace:
1. Open the Workspace Menu and select Delete.
2. You will be prompted to confirm the action. Select Yes to delete theitem. Select No to cancel the delete.
RenameTo rename the highlighted Workspace:
1. Open the Workspace Menu and select Rename.
2. Type a new name and press the R key.
54 SQCpack 2000
Print all charts in WorkspaceTo print all the charts in the Workspace:
� Open the Workspace Menu and select Print all.
Save all chart imagesSQCpack allows you to save all charts in the Workspace as image files. Saveall chart images allows you to generate image files for a number of chartswith a single command. To save all chart images:
1. Highlight a Workspace.
2. Open the Workspace Menu and select either Save all chart images todefault folder or Save all chart images to specified folder. The formersaves images into the default folder specified in the Chart definitionform for each chart in the Workspace. The latter allows you to select afolder for all of the images.
InformationTo view group information including name, description, date created, lastmodified date, and a list of charts within the Workspace:
1. Highlight a Workspace in the Tree.
2. Open the Workspace Menu and select Information.
Click on K to close the Information window.
Choice list Menu To make the Choice lists Menu appear in the Menu bar:
� In the Tree, move the highlight to Choice lists or the name of a Choicelist.
New choice listTo define a new choice list:
1. Open the Choice list Menu and select New. The Choice list form willopen.
2. Enter a name for the choice list and enter choices.
3. Click K.
For more information on choice lists, see Section 6, “Working with groupsand characteristics.”
Section 3 Quck reference 55
ModifyTo edit the highlighted choice list:
1. Open the Choice list Menu and select Modify.
2. Make desired changes and click on K.
CopyTo copy the highlighted choice list:
� Open the Choice list Menu and select Copy.
DeleteTo delete the highlighted choice list:
1. Open the Choice list Menu and select Delete.
2. You will be prompted to confirm the action. Select Yes to delete theitem. Select No to cancel the delete
RenameTo rename the highlighted choice list:
1. Open the Choice list Menu and select Rename.
2. Type a new name and press the R key.
InformationTo view group information including name, description, date created, lastmodified date, and a list of charts within the Choice list:
1. Highlight a group in the Tree.
2. Open the Choice list Menu and select Information.
Click on K to close the Information window.
ReportsFor more information on reports, see Section 13, ”Reports.”
To make the Reports Menu appear in the Menu bar:
� In the Tree, move the highlight to Reports.
56 SQCpack 2000
New reportTo create a new report:
� Open the Reports Menu and select New report. The Report definitionform will open.
For more information on creating Reports, see Section 13, ”Reports.”
ReportTo make the Report Menu appear in the Menu bar:
� In the Tree, move the highlight to the name of a report.
For more information, see Section 13, ”Reports.”
ModifyTo edit the highlighted report:
1. Open the Report Menu and select Modify.
2. Make desired changes and click on K.
CopyTo copy the highlighted report:
1. Open the Report Menu and select Copy.
2. Enter a name for the report copy and click on K.
DeleteTo delete the highlighted report:
1. Open the Report Menu and select Delete.
2. You will be prompted to confirm the action. Select Yes to delete thereport. Select No to cancel the delete.
RenameTo rename the highlighted report:
1. Open the Report Menu and select Rename.
2. Type a new name and press the K button.
PreviewTo preview the highlighted report:
� Open the Report Menu and select Preview.
Section 3 Quck reference 57
PrintTo print the highlighted report:
1. Open the Report Menu and select Print.
2. Click on the Printer icon.
Save to fileTo save the highlighted report to a file:
1. Open the Report Menu and select Save to file.
2. Select the File type and Printer orientation.
3. Enter a path and file name for the chart image file.
4. Click on the K button to save the file.
Report templatesFor more information on report templates, see Section 13, ”Reports.”
To make the Report Template Menu appear in the Menu bar:
� In the Tree, move the highlight to Report templates.
New report templateTo create a new report:
1. Open the Reports Template Menu and select New report template.The Report template form will open.
2. Enter a report name (required) and description (optional).
3. Select the items that you want to include in the report.
4. Click on K.
For more information on creating Report templates, see Section 13,”Reports.”
DeleteTo delete the highlighted report template:
1. Open the Report Template Menu and select Delete.
2. You will be prompted to confirm the action. Select Yes to delete thereport template. Select No to cancel the delete.
58 SQCpack 2000
ModifyTo edit the highlighted report template:
1. Open the Report Template Menu and select Modify.
2. Make desired changes and click on K.
CopyTo copy the highlighted report template:
1. Open the Report Template Menu and select Copy.
2. Enter a name for the template copy and click on K.
RenameTo rename the highlighted report:
1. Open the Report Template Menu and select Rename.
2. Type a new name and press the K button.
Chart Style Menus There are Chart style menus for Control Charts, Histograms, and Paretocharts. The options for these menus are the same.
To make the Chart style Menu appear in the Menu bar:
� In the Tree, move the highlight to Control chart style, Histogramstyles, Pareto chart style, or the name of a Chart style.
New chart (histogram, Pareto) styleTo create a new chart style:
1. Move the cursor to Control chart style, Histogram chart style, orPareto chart style.
2. Open the Chart style Menu and select New.
3. Name the chart style and set up the chart style options.
4. Click on K.
For more information on chart styles, see the topic “Chart styles” inSection 15, “Configuring SQCpack 2000.”
Section 3 Quck reference 59
ModifyTo edit the highlighted chart style:
1. Open the Chart Style Menu and select Modify.
2. Make desired changes and click on K.
CopyTo copy the highlighted chart style:
� Open the Chart Style Menu and select Copy.
DeleteTo delete the highlighted chart style:
1. Open the Chart Style Menu and select Delete.
2. You will be prompted to confirm the action. Select Yes to delete theitem. Select No to cancel the delete
RenameTo rename the highlighted chart style:
1. Open the Chart Style Menu and select Rename.
2. Type a new name and press the R key.
User Menu To make the User Menu appear in the Menu bar:
� In the Tree, move the highlight to Users or the name of a User.
If User does not appear in the Tree, the option has not been enabled for thecurrent database. For more information, see the topic “Security” in Section15, “Configuring SQCpack 2000.”
New userTo set up a new user account:
1. Move the highlight to User. Open the User Menu and select Newuser. The User form will open.
2. Type a user name in the Name field. If the login option is enabled,you will need to enter a password for the user.
3. Set the access rights for this user.
60 SQCpack 2000
4. Click on K.
For more information, see the topic “Security” in Section 1, “ConfiguringSQCpack 2000.”
ModifyTo modify the highlighted user account:
1. Open the User Menu and select Modify.
2. Make desired changes and click on K.
DeleteTo delete the highlighted user:
1. Open the User Menu and select Delete.
2. You will be prompted to confirm the action. Select Yes to delete theitem. Select No to cancel the delete.
CopyTo copy the highlighted User:
1. Open the User Menu and select Copy.
2. Change the user name and select K.
InformationTo view information for the highlighted user account:
� Open the User Menu and select Information.
Click on K to close the Information window.
Setup Menu functions
Out-of-control testsTo add, edit, or delete out-of-control test parameters:
1. Open the Setup Menu and select Out-of-control.
2. Make desired changes and select K.
For more information, see the topic “Out-of-control test” in Section 15,“Configuring SQCpack 2000.”
Section 3 Quck reference 61
Change current user passwordTo change your password:
1. Open the Setup Menu and select Change current password. ThePassword form will open.
2. Enter the new password and confirm it.
3. Click on K.
PreferencesTo set program preferences :
1. Open the Setup Menu and select Preferences.
2. Make desired changes and select K.
For more information, see the topic “Setting preferences” in Section 15,“Configuring SQCpack 2000.”
Data DevicesTo configure a device for direct data input:
1. Open the Setup Menu and select Data devices.
2. Click on the Add button.
3. Set up device parameters.
4. Click on K.
For more information, see the topic “Direct data input” in Section 8,“Entering and editing data.”
Default control chartTo edit the default control chart:
1. Open the Setup Menu and select Default control chart.
2. Make desired changes and click on K.
For more information, see the topic “Default charts” in Section 15,“Configuring SQCpack 2000.”
Default histogramTo edit the default histogram:
1. Open the Setup Menu and select Default histogram.
62 SQCpack 2000
2. Make desired changes and click on K.
For more information, see the topic “Default charts” in Section 15,“Configuring SQCpack 2000.”
Default Pareto chartTo edit the default Pareto chart:
1. Open the Setup Menu and select Default Pareto chart.
2. Make desired changes and click on K.
For more information, see the topic “Default charts” in Section 15,“Configuring SQCpack 2000.”
LanguageTo change SQCpack language, if you have an LLD language file:
1. Copy the translation file (such as 0410_Italiano.LLD) into theSQCpack folder.
2. Open the Setup Menu and select Language. The Language optionsform will open.
3. Click on Select the following language and highlight the language inthe list.
4. Click on K.
Help Menu functions
ContentsTo launch the help file:
� Open the Help Menu and select Contents.
TutorialFor help getting started with SQCpack 2000:
� Open the Help Menu and select Tutorial.
SQC Quality Advisor™For help selecting or interpreting charts:
� Open the Help Menu and select Quality Advisor
Section 3 Quck reference 63
Formula referenceTo view the formulas used by SQCpack 2000:
� Open the Help Menu and select Formula reference.
Obtaining Technical SupportFor information on contacting PQ Systems’ Technical Support:
� Open the Help Menu and select Obtain Technical Support.
New UserIf you are new to SQCpack, you can contact PQ Systems for a guided tourof the software. This option provides contact information for PQ Systems.
� Open the Help Menu and select New user.
PQ Systems on the WebTo see if you have the the latest version of SQCpack:
1. Open the Help Menu and select PQ Systems on the Web.
2. Select Check for Updates.
To launch your web browser and visit PQ Systems’ home page:
1. Open the Help Menu and select PQ Systems on the Web.
2. Select PQ Systems Home.
To launch your web browser and visit PQ Systems’ Technical Support onthe Web:
1. Open the Help Menu and select PQ Systems on the Web.
2. Select PQ Systems Technical Support.
AboutTo view version or system information, or to enter a license certificateinformation or upgrade code:
1. Open the Help Menu and select About.
2. Select K to close the About window.
64 SQCpack 2000
Groups setup formThese menus are available from the Groups setup form. To access theseforms, click on the Create new group icon, , or the Modify group icon,
. For more information on setting up groups, see Section 6 “Workingwith Groups and Characteristics.”
Group setup form File Menu functionsSave To save the group setup:
� Open the File Menu and select Save.
CancelTo cancel changes to the group setup:
� Open the File Menu and select Cancel.
View Menu functionsToolbarTo display or turn off the toolbar icons:
� Open the View Menu and select Toolbar.
Columns Menu functionsNew identifierTo create a new identifier:
� Open the Columns Menu and select New identifier.
For more information on identifiers, see Section 6, “Working with groupsand characteristics.”
New measurementTo create a new measurement characteristic:
� Open the Columns Menu and select New measurement.
For more information on measurement characteristics, see Section 6,“Working with groups and characteristics.”
Section 3 Quck reference 65
New countTo create a new count characteristic:
� Open the Columns Menu and select New count.
For more information on count characteristics, see Section 6, “Workingwith groups and characteristics.”
New calculatedTo create a new calculated characteristic:
� Open the Columns Menu and select New calculated.
For more information on calculated characteristics, see Section 5, “Work-ing with groups and characteristics.”
Modify To modify an identifier or characteristic:
1. Move the highlight to the identifier or characteristic that you want toedit.
2. Open the Columns Menu and select Modify.
3. Make desired changes and select K.
Copy To copy an identifier or characteristic:
1. Move the highlight to the identifier or characteristic that you want tocopy.
2. Open the Columns Menu and select Copy.
DeleteTo delete an identifier or characteristic:
1. Move the highlight to the identifier or characteristic that you want todelete.
2. Open the Columns Menu and select Delete.
3. You will be prompted to confirm the action. Select Yes to delete theitem. Select No to cancel the delete.
RefreshTo refresh the columns:
� Open the Columns Menu and select Refresh.
66 SQCpack 2000
Data entry tab menusThese menus are available from the Data entry tab. For more information,see Section 8, “Entering and editing data.”
File MenuCloseTo close the data entry form:
� Open the File Menu and select Close.
Edit MenuCutTo cut data and copy it to the Clipboard:
1. Highlight the data that you want to cut.
2. Open the Edit Menu and select Cut.
CopyTo copy data to the Clipboard:
1. Highlight the data that you want to copy.
2. Open the Edit Menu and select Copy.
PasteTo paste data that has been copied to the Clipboard:
1. Move the cursor to the position in which you want to copy the data.
2. Open the Edit Menu and select Paste.
Select allTo highlight all the data:
� Open the Edit Menu and select Select all.
Notes and causes1. Move the cursor to the subgroup to which you want to add a note or
cause.
2. Open the Edit Menu and select Notes and causes.
3. Enter the note or cause and click on K.
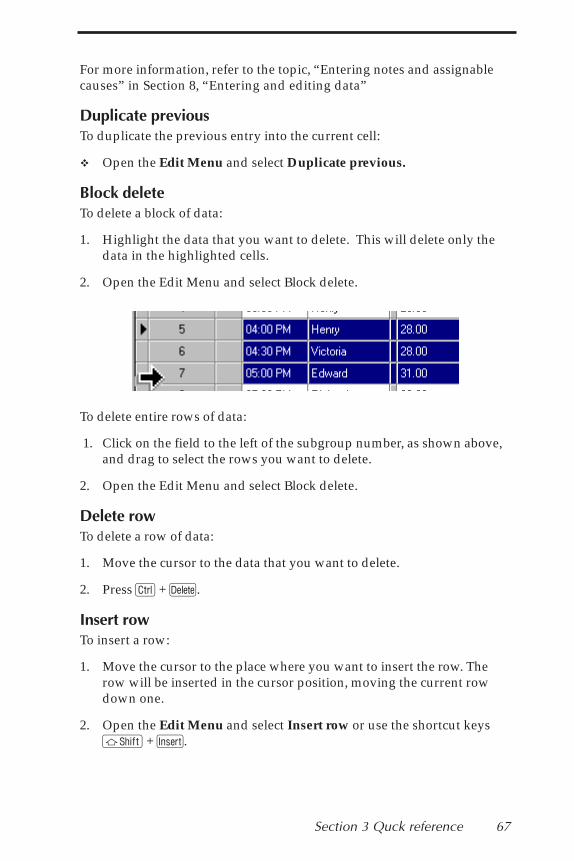
Section 3 Quck reference 67
For more information, refer to the topic, “Entering notes and assignablecauses” in Section 8, “Entering and editing data”
Duplicate previousTo duplicate the previous entry into the current cell:
� Open the Edit Menu and select Duplicate previous.
Block deleteTo delete a block of data:
1. Highlight the data that you want to delete. This will delete only thedata in the highlighted cells.
2. Open the Edit Menu and select Block delete.
To delete entire rows of data:
1. Click on the field to the left of the subgroup number, as shown above,and drag to select the rows you want to delete.
2. Open the Edit Menu and select Block delete.
Delete rowTo delete a row of data:
1. Move the cursor to the data that you want to delete.
2. Press C + D.
Insert rowTo insert a row:
1. Move the cursor to the place where you want to insert the row. Therow will be inserted in the cursor position, moving the current rowdown one.
2. Open the Edit Menu and select Insert row or use the shortcut keysS + I.
68 SQCpack 2000
Move one cell to the rightThis toggle allows you to set the direction of the cursor. If it is selected, thecursor will move between characteristics. If it is not selected, the cursorwill move within one characteristic. If a characteristic has a sample sizelarger than one, the cursor will move to the next observation until thesubgroup is complete and then move down to the next row.
To toggle this option on or off:
� Open the Edit Menu and select Move one cell to the right. Or click onthe Move to next row or Move to next column icon.
RefreshTo refresh the currently displayed chart:
� Open the Edit Menu and select Refresh.
Go to rowTo move the cursor to a different row:
1. Open the Edit Menu and select Go to row.
2. Enter the row number and click on the K button.
View MenuToolbarTo display or turn off the toolbar icons:
� Open the View Menu and select Toolbar.
Characteristic To view information for the currently highlighted characteristic:
1. Open the View Menu and select Characteristic.
2. Then select one of the following:
� Procedure
� Media file
� Information
GroupTo view information for the currently highlighted group:
1. Open the View Menu and select Group.
Section 3 Quck reference 69
2. Then select one of the following:
� Procedure
� Media file
Operational definitionThis function is available only for Pareto groups that have operationaldefinitions. To view operational definitions:
� Open the View Menu and select Operational defintion.
Subgroup statisticsTo view statistics for the currently highlighted subgroup:
� Open the View Menu and select Subgroup statistics.
Lock identifiersIf you have a group with a large number of characteristics, this optionwill display identifiers while scrolling through the characteristics. To lockidentifiers:
� Open the View Menu and select Lock identifiers.
Format MenuFontTo set the font for the data entry grid:
1. Open the Format Menu and select Font.
2. Make desired changes to the font settings and click on K.
Autosize columnTo have SQCpack automatically resize the data grid columns to fit thedata:
� Open the Format Menu and select Autosize column.
Device Menu To enable data entry through a device:
� Open the Device Menu and select Enable data input from a device.
If this option is grayed out, check the group setup to determine if a devicehas been assigned to this group.

70 SQCpack 2000
Charts/Limits tabThe menus available from the Charts/Limits tab. Other menus availableon this tab are covered under the Data entry tab. For more information, seeSection 10, “Charts.”
Charts Menu functionsDisplayTo display the highlighted chart:
� Open the Chart Menu and select Display.
ModifyTo edit the highlighted chart:
1. Open the Chart Menu and select Modify.
2. Make desired changes and select K.
Copy To copy the highlighted chart:
� Open the Chart Menu and select Copy.
DeleteTo delete the highlighted chart:
1. Open the Chart Menu and select Delete.
2. You will be prompted to confirm the action. Select Yes to delete theitem. Select No to cancel the delete
Generate chart image fileTo generate an image file of the highlighted chart:
1. Open the Chart Menu and select Generate chart image file. TheChart image information form will open.
2. Select the Image type, Image size in pixels, and enter a file name.
3. Click K.
New control chartTo create a new chart:
1. Open the Chart Menu and select New Control chart.
Section 3 Quck reference 71
2. Define the chart and select K.
For more information on creating control charts, see the topic “Creatingcharts” in Section 10, “Charts.”
New histogramTo create a new histogram:
1. Open the Chart Menu and select New histogram.
2. Define the histogram and select K.
This option is only available with variables data. For more information oncreating histograms, see the topic “Creating charts” in Section 10,“Charts.”
New Pareto chartTo create a new Pareto chart:
1. Open the Chart Menu and select New Pareto chart.
2. Define the Pareto chart and select K.
This option is only available for Pareto data. For more information oncreating Pareto charts, see the topic “Creating charts” in Section 10,“Charts.”
Chart display menusWhen a Chart is displayed, these menus are available through thedisplay window.
File Menu functionsSave chart imageTo save the chart as a BMP, WMF, PNG or JPG graphics file:
1. Open the File Menu and select Save chart image.
2. Name the file and select a file type.
3. Click on Save.
PrintTo print the chart:
1. Open the File Menu and select Print.
2. Click on K.
72 SQCpack 2000
CloseTo close the chart:
� Open the File Menu and select Close.
Close all chartsIf you have multiple charts open, such as with a Workspace, this functionwill close all the chart windows.
� Open the File Menu and select Close all charts.
Edit Menu functionsCopy chart to ClipboardTo copy a chart:
1. Open the Edit Menu and select Copy chart to Clipboard.
2. Select either As Windows metafile graphic or As Windows bitmapgraphic.
Refresh chartTo redraw the chart with current data:
� Open the Edit Menu and select Refresh chart.
Chart definitionTo edit the chart from the display window:
1. Open the Edit Menu and select Chart definition.
2. Make desired changes and click on K.
Section 4 Tutorial 73
Section 4
Tutorial
This tutorial introduces you to a few of the key features of SQCpack. It isdesigned to walk you through the basics of creating a database, setting upgroups, entering data, drawing charts, and more.
To get started with SQCpack 2000, work through Lessons 1-3 in order.Lessons 4-9 cover more advanced topics. Complete these lessons if andwhen you need them. They can be completed in any order.
Lessons include:Lesson 1 Create database, variables group, and identifiersLesson 2 Enter dataLesson 3 Create and display charts, filter data, draw control limits
Advanced topics:Lesson 4 Multi-charts and WorkspacesLesson 5 Creating new chart stylesLesson 6 Working with attributes dataLesson 7 Working with Pareto dataLesson 8 Choice listsLesson 9 Working with calculated characteristics
4
74 SQCpack 2000
Lesson 1 Group setupIn this lesson, you will create a new database, a group with two identifiersand two characteristics.
1.1 Creating new database filesNote, if you do not have user rights for creating a database, open theSample46.sqd database and skip to Step 1.2.
1. Open the File Menu and select New SQCpack database.
2. Type Tutorial in the Filename field and click Save. The tutorialdatabase will open and appear in the Tree.
For more information about SQCpack databases, see Section 5, “TheSQCpack 2000 database.”
1.2 Creating a new group1. Move the highlight to the Tutorial database that you have just created.
Click on the New group icon, , or open the Groups Menu and selectNew group. The Group form will open. The Identifiers/Characteristicstab will be displayed.
2. Enter Practice Group in the Group name field.
3. In the Description field, type Tutorial.
To complete the group, you will need to define identifiers and characteristics.

Section 4 Tutorial 75
1.3 Create identifiers1. To set up the first identifier, click on the New identifier icon, , or
open the Columns Menu and select New identifier. The Identifiercolumn form will open.
2. Type Date in the Name field. Set the identifier type as Date.
3. Select ID entry is required and click on K.
4. Click on the New identifier icon again.
5. Type Operator in the Name field and set the identifier type as Text.Click on K.
1.4 Creating measurement characteristics1. Click on the New measurement icon, , or open the Columns Menu
and select New measurement. The Measurement definition form willopen. The Measurement tab will be displayed.
2. Enter Length in the Name field.
3. Enter 3 in the Subgroup size field.
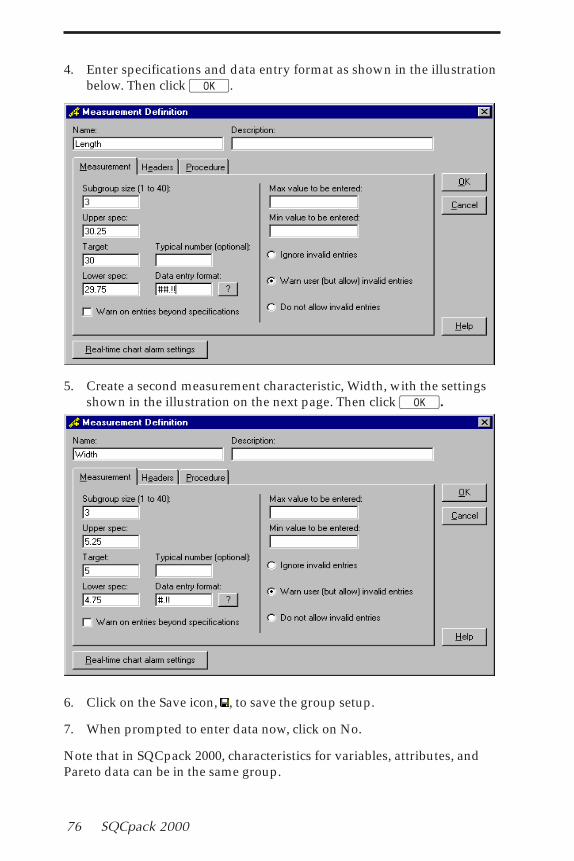
76 SQCpack 2000
4. Enter specifications and data entry format as shown in the illustrationbelow. Then click K.
5. Create a second measurement characteristic, Width, with the settingsshown in the illustration on the next page. Then click K.
6. Click on the Save icon, , to save the group setup.
7. When prompted to enter data now, click on No.
Note that in SQCpack 2000, characteristics for variables, attributes, andPareto data can be in the same group.
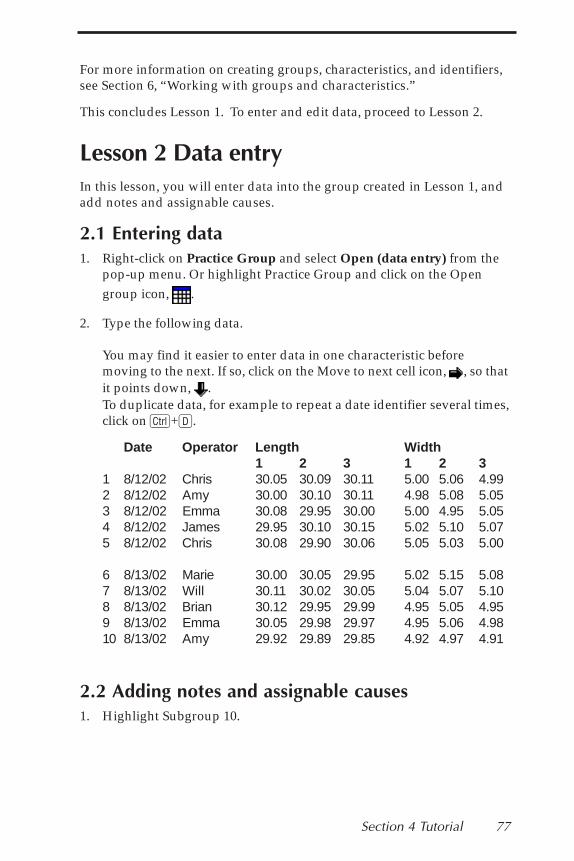
Section 4 Tutorial 77
For more information on creating groups, characteristics, and identifiers,see Section 6, “Working with groups and characteristics.”
This concludes Lesson 1. To enter and edit data, proceed to Lesson 2.
Lesson 2 Data entryIn this lesson, you will enter data into the group created in Lesson 1, andadd notes and assignable causes.
2.1 Entering data1. Right-click on Practice Group and select Open (data entry) from the
pop-up menu. Or highlight Practice Group and click on the Opengroup icon, .
2. Type the following data.
You may find it easier to enter data in one characteristic beforemoving to the next. If so, click on the Move to next cell icon, , so thatit points down, .To duplicate data, for example to repeat a date identifier several times,click on C+D.
Date Operator Length Width1 2 3 1 2 3
1 8/12/02 Chris 30.05 30.09 30.11 5.00 5.06 4.992 8/12/02 Amy 30.00 30.10 30.11 4.98 5.08 5.053 8/12/02 Emma 30.08 29.95 30.00 5.00 4.95 5.054 8/12/02 James 29.95 30.10 30.15 5.02 5.10 5.075 8/12/02 Chris 30.08 29.90 30.06 5.05 5.03 5.00
6 8/13/02 Marie 30.00 30.05 29.95 5.02 5.15 5.087 8/13/02 Will 30.11 30.02 30.05 5.04 5.07 5.108 8/13/02 Brian 30.12 29.95 29.99 4.95 5.05 4.959 8/13/02 Emma 30.05 29.98 29.97 4.95 5.06 4.9810 8/13/02 Amy 29.92 29.89 29.85 4.92 4.97 4.91
2.2 Adding notes and assignable causes1. Highlight Subgroup 10.
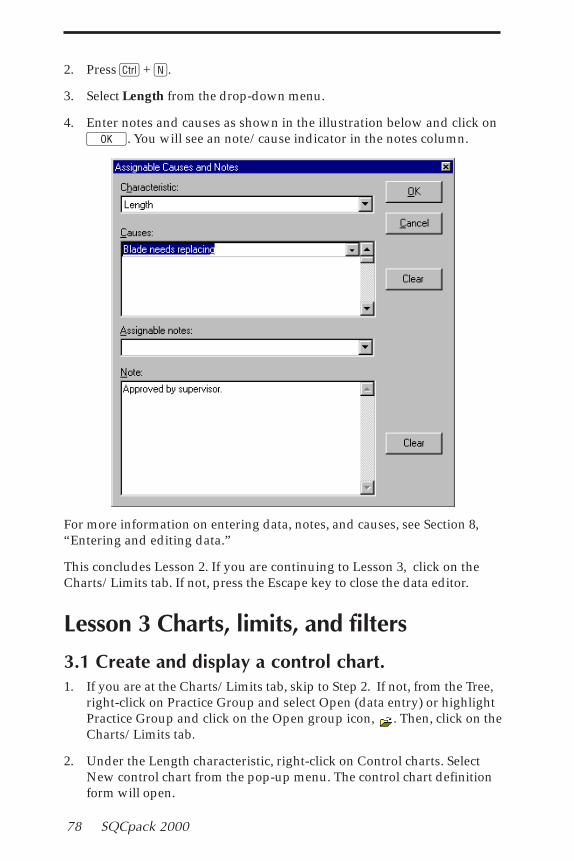
78 SQCpack 2000
2. Press C + N.
3. Select Length from the drop-down menu.
4. Enter notes and causes as shown in the illustration below and click onK. You will see an note/cause indicator in the notes column.
For more information on entering data, notes, and causes, see Section 8,“Entering and editing data.”
This concludes Lesson 2. If you are continuing to Lesson 3, click on theCharts/Limits tab. If not, press the Escape key to close the data editor.
Lesson 3 Charts, limits, and filters
3.1 Create and display a control chart.1. If you are at the Charts/Limits tab, skip to Step 2. If not, from the Tree,
right-click on Practice Group and select Open (data entry) or highlightPractice Group and click on the Open group icon, . Then, click on theCharts/Limits tab.
2. Under the Length characteristic, right-click on Control charts. SelectNew control chart from the pop-up menu. The control chart definitionform will open.

Section 4 Tutorial 79
3. Enter Length in the name field. Leave the chart type at the default ofX-bar/range.
4. Select the options shown below.
5. Click on the X-axis Y-axis tab.
6. In the Label x-axis with drop-down menu, select Numbers. Leave theLabel every subgroup setting.
7. Set Causes to Display abbreviated text.
8. Click on the Out-of-control testing tab.
9. Perform out-of-control tests should be selected. Click to select Out-of-control test numbers.
10. Click on K to save the settings and return to the Charts/Limitstab.
11. With the highlight on the Length chart that you just created, click onthe Chart icon, , to display the chart. You can also right-click onthe chart name and select Display from the pop-up menu.
3.2 Draw control limitsSQCpack allows you to draw control limits through the chart display. Todo this:
1. Click on Subgroup 1, hold down the mouse button, and drag themouse pointer to Subgroup 5.

80 SQCpack 2000
2. Right-click on the selected area. From the pop-up menu, selectCompute limits. The Control limits form will open.
3. Select Standard as the method for computing limits.
The Subgroups included field reflects the subgroups that arehighlighted. If 1 to 5 does not appear in these fields, you can edit therange here.
4. Select Extend limits to extend the control limits to all subgroups.
5. Click on K to close the Control limit form.
Note that for the first 5 subgroups, the control limit lines are solid andfor the last 5 they are dotted. Unless you change the chart style (Lesson5), solid lines illustrate the data used in the control limit calculationand dotted lines indicate that the limits have been extended.
3.3 Annotating the displayed chart1. Right-click anywhere on the Chart display window and select Add
annotation from the pop-up menu. The chart annotation form willopen.
2. Type "Look at this!" in the Annotation text field.
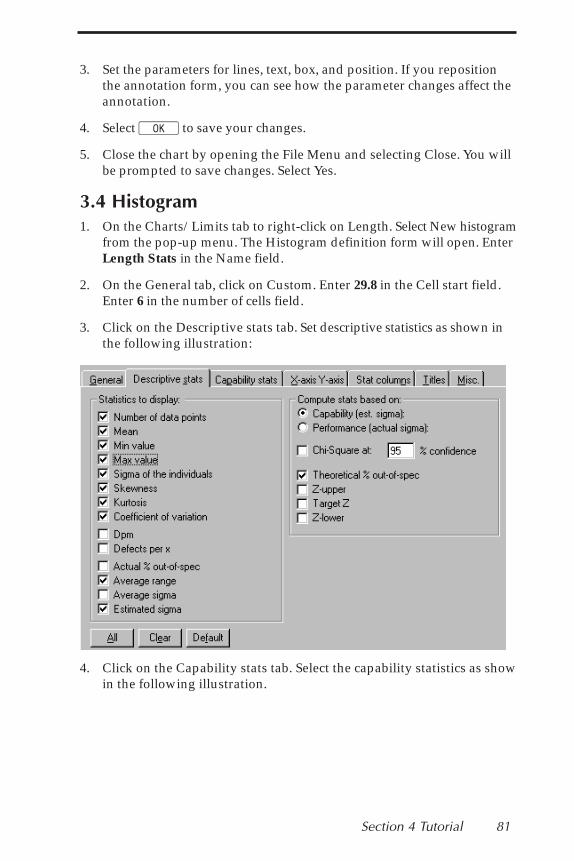
Section 4 Tutorial 81
3. Set the parameters for lines, text, box, and position. If you repositionthe annotation form, you can see how the parameter changes affect theannotation.
4. Select K to save your changes.
5. Close the chart by opening the File Menu and selecting Close. You willbe prompted to save changes. Select Yes.
3.4 Histogram1. On the Charts/Limits tab to right-click on Length. Select New histogram
from the pop-up menu. The Histogram definition form will open. EnterLength Stats in the Name field.
2. On the General tab, click on Custom. Enter 29.8 in the Cell start field.Enter 6 in the number of cells field.
3. Click on the Descriptive stats tab. Set descriptive statistics as shown inthe following illustration:
4. Click on the Capability stats tab. Select the capability statistics as showin the following illustration.
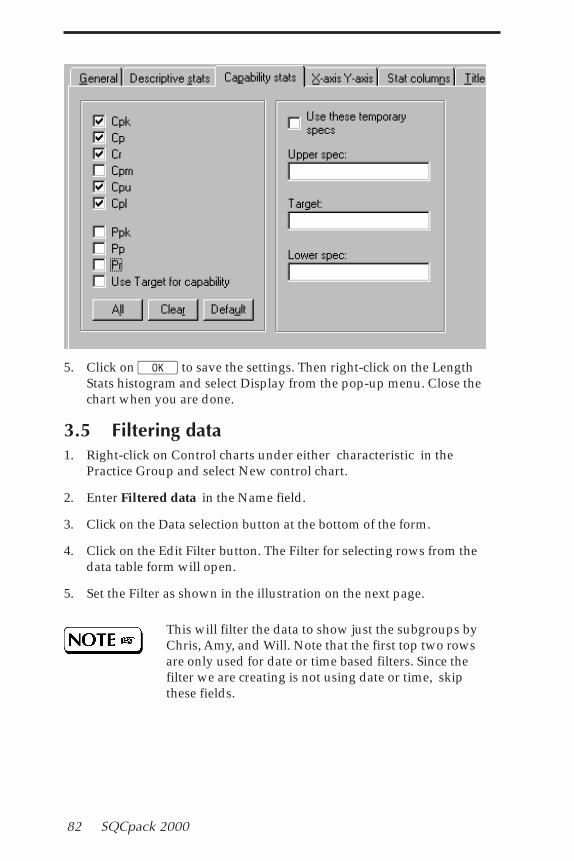
82 SQCpack 2000
5. Click on K to save the settings. Then right-click on the LengthStats histogram and select Display from the pop-up menu. Close thechart when you are done.
3.5 Filtering data1. Right-click on Control charts under either characteristic in the
Practice Group and select New control chart.
2. Enter Filtered data in the Name field.
3. Click on the Data selection button at the bottom of the form.
4. Click on the Edit Filter button. The Filter for selecting rows from thedata table form will open.
5. Set the Filter as shown in the illustration on the next page.
This will filter the data to show just the subgroups byChris, Amy, and Will. Note that the first top two rowsare only used for date or time based filters. Since thefilter we are creating is not using date or time, skipthese fields.
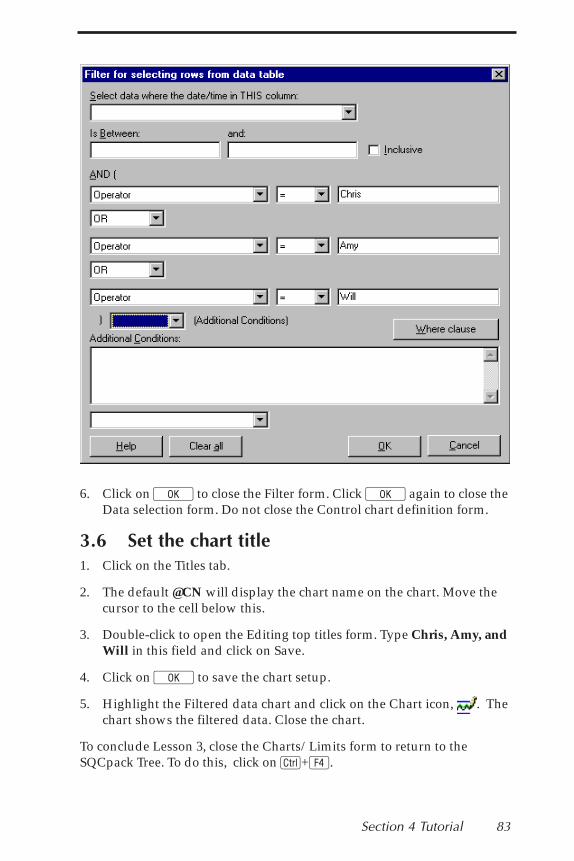
Section 4 Tutorial 83
6. Click on K to close the Filter form. Click K again to close theData selection form. Do not close the Control chart definition form.
3.6 Set the chart title1. Click on the Titles tab.
2. The default @CN will display the chart name on the chart. Move thecursor to the cell below this.
3. Double-click to open the Editing top titles form. Type Chris, Amy, andWill in this field and click on Save.
4. Click on K to save the chart setup.
5. Highlight the Filtered data chart and click on the Chart icon, . Thechart shows the filtered data. Close the chart.
To conclude Lesson 3, close the Charts/Limits form to return to theSQCpack Tree. To do this, click on C+4.
84 SQCpack 2000
Lesson 4 Multi-charts and WorkspacesFor this lesson we will open the Sample database as well as create aMulti-chart and a Workspace.
4.1 Open an existing databaseTo open the sample database:
❖ Click on the Database icon, , and select Sample46.sqd from theSampleData folder.
4.2 Multi-chartsThe Multi-chart function lets you view several charts on a single page orscreen. You can mix and match charts from different groups.
To create a new Multi-chart:
1. Under the Sample46.sqd database, right-click on Multi-charts andselect New Multi-chart from the pop-up menu. The Multi-chart formwill open.
2. Enter Tutorial as the name for this Multi-chart .
3. Click on the Add chart button. The Chart browser form will open.
4. Open the listing for AIAG sample data. Open the AcidConcentration - % and Control charts. Highlight the Annotationexample.
5. Click Select.
6. Repeat Steps 3-5 to add the following charts:
Group Characteristic Chart
AIAG sample data Acid Concentration - % Histogram w/both stats
Number of nonconforming Spot Welds-Undersize Chart w/oheaders, data
Lost items, medical center Count Default Paretochart, SimpleExample
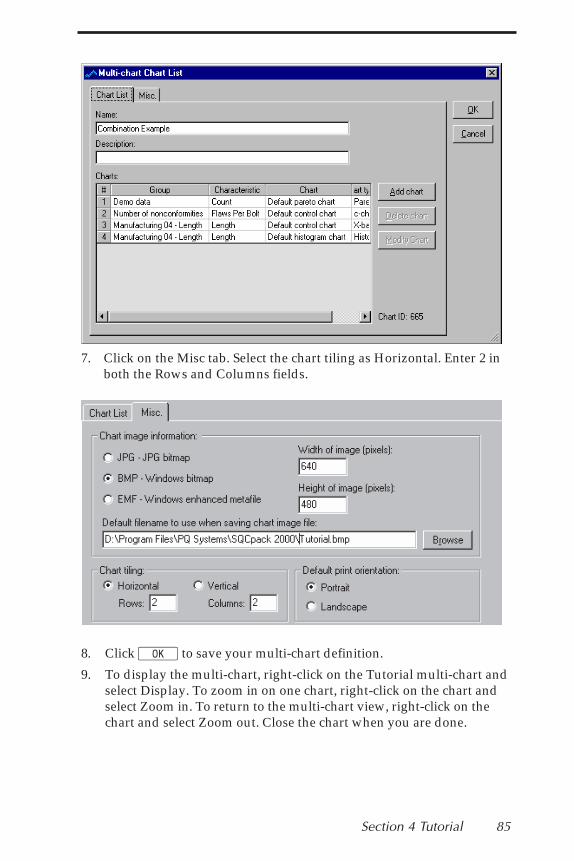
Section 4 Tutorial 85
7. Click on the Misc tab. Select the chart tiling as Horizontal. Enter 2 inboth the Rows and Columns fields.
8. Click K to save your multi-chart definition.
9. To display the multi-chart, right-click on the Tutorial multi-chart andselect Display. To zoom in on one chart, right-click on the chart andselect Zoom in. To return to the multi-chart view, right-click on thechart and select Zoom out. Close the chart when you are done.
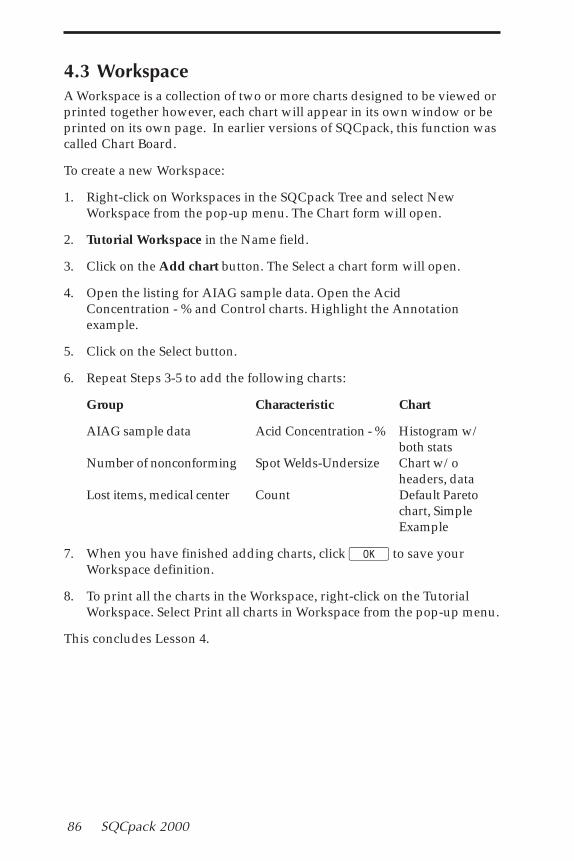
86 SQCpack 2000
4.3 WorkspaceA Workspace is a collection of two or more charts designed to be viewed orprinted together however, each chart will appear in its own window or beprinted on its own page. In earlier versions of SQCpack, this function wascalled Chart Board.
To create a new Workspace:
1. Right-click on Workspaces in the SQCpack Tree and select NewWorkspace from the pop-up menu. The Chart form will open.
2. Tutorial Workspace in the Name field.
3. Click on the Add chart button. The Select a chart form will open.
4. Open the listing for AIAG sample data. Open the AcidConcentration - % and Control charts. Highlight the Annotationexample.
5. Click on the Select button.
6. Repeat Steps 3-5 to add the following charts:
Group Characteristic Chart
AIAG sample data Acid Concentration - % Histogram w/both stats
Number of nonconforming Spot Welds-Undersize Chart w/oheaders, data
Lost items, medical center Count Default Paretochart, SimpleExample
7. When you have finished adding charts, click K to save yourWorkspace definition.
8. To print all the charts in the Workspace, right-click on the TutorialWorkspace. Select Print all charts in Workspace from the pop-up menu.
This concludes Lesson 4.
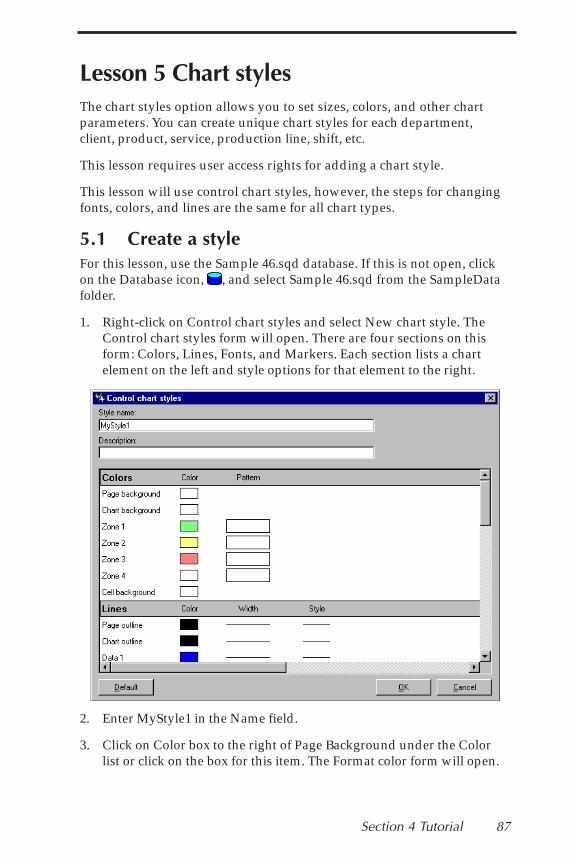
Section 4 Tutorial 87
Lesson 5 Chart stylesThe chart styles option allows you to set sizes, colors, and other chartparameters. You can create unique chart styles for each department,client, product, service, production line, shift, etc.
This lesson requires user access rights for adding a chart style.
This lesson will use control chart styles, however, the steps for changingfonts, colors, and lines are the same for all chart types.
5.1 Create a styleFor this lesson, use the Sample 46.sqd database. If this is not open, clickon the Database icon, , and select Sample 46.sqd from the SampleDatafolder.
1. Right-click on Control chart styles and select New chart style. TheControl chart styles form will open. There are four sections on thisform: Colors, Lines, Fonts, and Markers. Each section lists a chartelement on the left and style options for that element to the right.
2. Enter MyStyle1 in the Name field.
3. Click on Color box to the right of Page Background under the Colorlist or click on the box for this item. The Format color form will open.
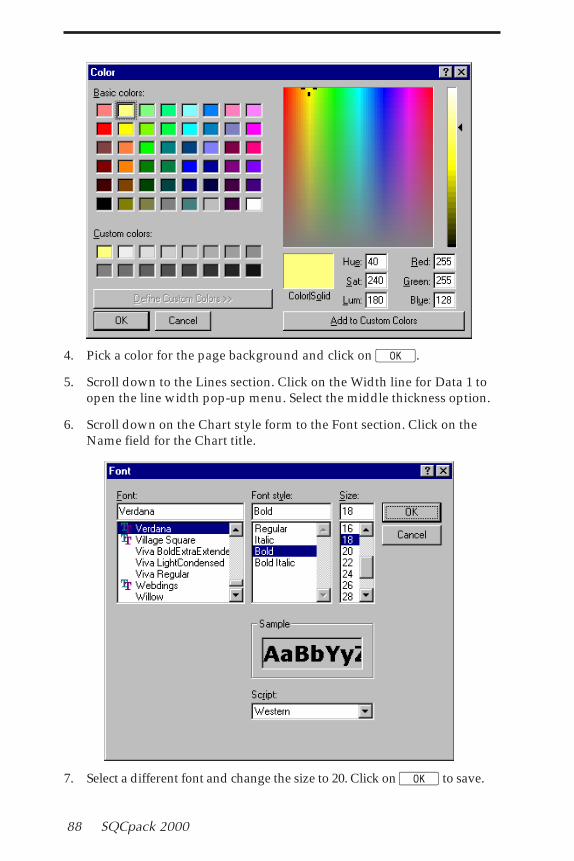
88 SQCpack 2000
4. Pick a color for the page background and click on K.
5. Scroll down to the Lines section. Click on the Width line for Data 1 toopen the line width pop-up menu. Select the middle thickness option.
6. Scroll down on the Chart style form to the Font section. Click on theName field for the Chart title.
7. Select a different font and change the size to 20. Click on K to save.
Section 4 Tutorial 89
8. Scroll down to the Data marker section of the tree. Click on the Stylemarket for Data 1 to open the marker style pop-up menu. Select adifferent marker style.
9. Click on K again to save your style.
5.2 Attach a style to the chart.1. From the Tree, click on the Charts icon, , to open the Chart browser.
2. Select any default control chart and click on Modify to open theControl chart definition form.
3. Select MyStyle1 from the chart style drop-down menu and click onK.
4. Display the chart to view the new style. Close the chart when you aredone.
This concludes Lesson 5 .
Lesson 6 Working with Attributes dataIn this lesson, you will create an group and characteristic for attributes,enter data, and draw a chart.
6.1 Create a count characteristic6.1.1 New group1. Click on the New group icon, , or open the Groups Menu and select
New group. The Group form will open. The Identifiers/Characteris-tics tab will be displayed.
2. Enter Attributes Group in the Group name field.
3. In the Description field, type Tutorial.
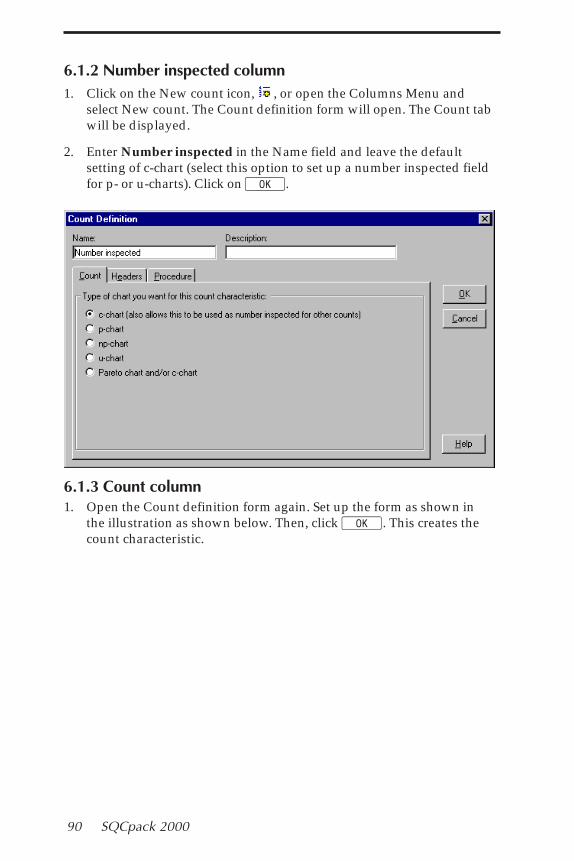
90 SQCpack 2000
6.1.2 Number inspected column1. Click on the New count icon, , or open the Columns Menu and
select New count. The Count definition form will open. The Count tabwill be displayed.
2. Enter Number inspected in the Name field and leave the defaultsetting of c-chart (select this option to set up a number inspected fieldfor p- or u-charts). Click on K.
6.1.3 Count column1. Open the Count definition form again. Set up the form as shown in
the illustration as shown below. Then, click K. This creates thecount characteristic.
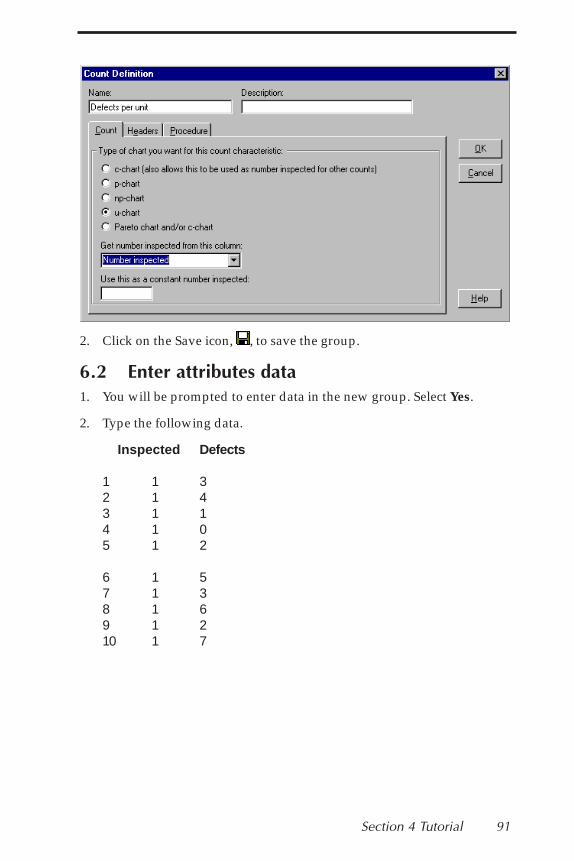
Section 4 Tutorial 91
2. Click on the Save icon, , to save the group.
6.2 Enter attributes data1. You will be prompted to enter data in the new group. Select Yes.
2. Type the following data.
Inspected Defects
1 1 32 1 43 1 14 1 05 1 2
6 1 57 1 38 1 69 1 210 1 7
92 SQCpack 2000
6.3 Attributes control chart1. Click on the Charts/Limits tab. Right-click on Control charts under
Defects per unit and select New control chart from the pop-up menu.
2. Enter Defects per unit in the Name field. Leave the other options setat the default value.
3. Click on K.
4. With the highlight on the chart that you just created, click on theChart icon, , to display the chart.
This concludes Lesson 6.
Lesson 7 Working with Pareto dataIn this lesson, you will create a group with a characteristic for Paretodata, enter data, and draw a chart.
7.1 Create a Pareto characteristic7.1.1 New group1. Click on the New group icon, , or open the Groups Menu and select
New group. The Group form will open. The Identifiers/Characteris-tics tab will be displayed.
2. Enter Pareto Group in the Group name field.
3. In the Description field, type Tutorial.
7.1.2 Pareto count characteristic1. Open the Count definition form by clicking on the New count
characteristic icon, .
2. Set up the form as shown in the next illustration.

Section 4 Tutorial 93
3. Click on the Categories tab. Set up the categories as shown in theillustration below.
4. Click on K to save the characteristic settings. Click on the Saveicon, , to save the group.
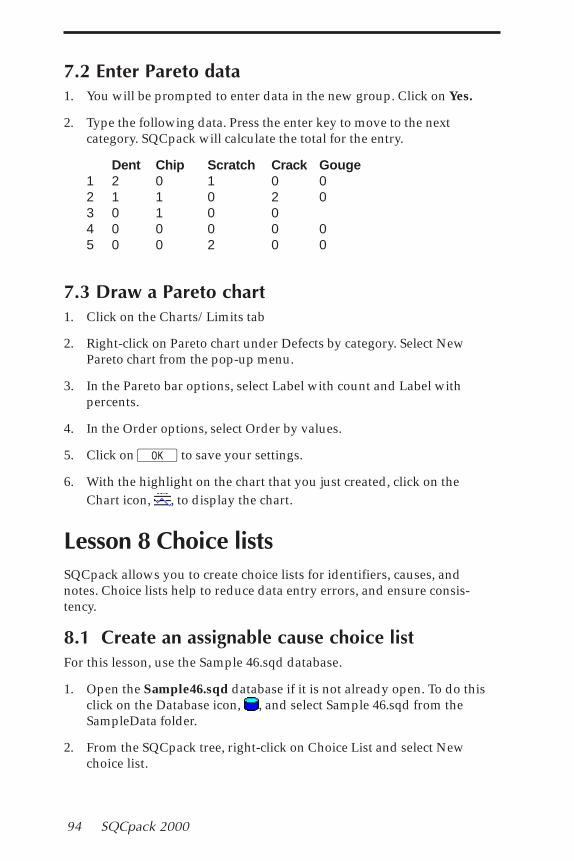
94 SQCpack 2000
7.2 Enter Pareto data1. You will be prompted to enter data in the new group. Click on Yes.
2. Type the following data. Press the enter key to move to the nextcategory. SQCpack will calculate the total for the entry.
Dent Chip Scratch Crack Gouge1 2 0 1 0 02 1 1 0 2 03 0 1 0 04 0 0 0 0 05 0 0 2 0 0
7.3 Draw a Pareto chart1. Click on the Charts/Limits tab
2. Right-click on Pareto chart under Defects by category. Select NewPareto chart from the pop-up menu.
3. In the Pareto bar options, select Label with count and Label withpercents.
4. In the Order options, select Order by values.
5. Click on K to save your settings.
6. With the highlight on the chart that you just created, click on theChart icon, , to display the chart.
Lesson 8 Choice listsSQCpack allows you to create choice lists for identifiers, causes, andnotes. Choice lists help to reduce data entry errors, and ensure consis-tency.
8.1 Create an assignable cause choice listFor this lesson, use the Sample 46.sqd database.
1. Open the Sample46.sqd database if it is not already open. To do thisclick on the Database icon, , and select Sample 46.sqd from theSampleData folder.
2. From the SQCpack tree, right-click on Choice List and select Newchoice list.
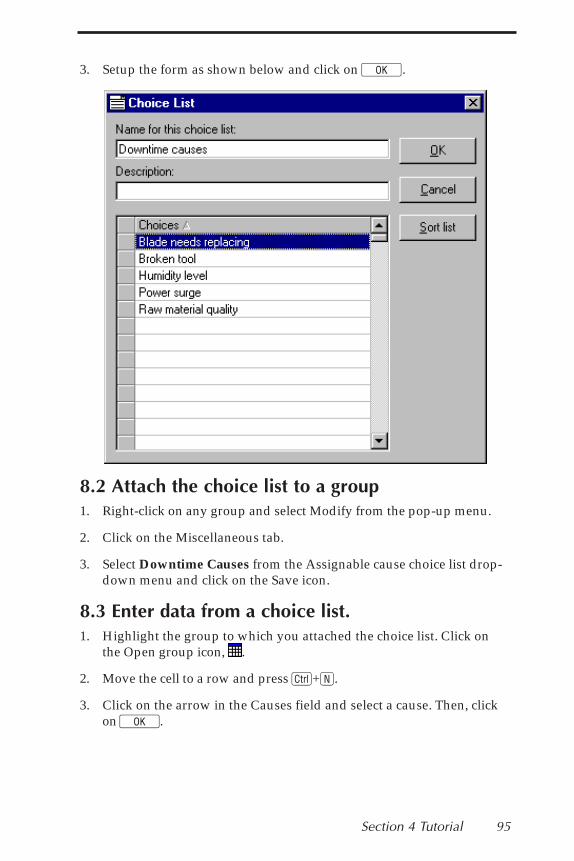
Section 4 Tutorial 95
3. Setup the form as shown below and click on K.
8.2 Attach the choice list to a group1. Right-click on any group and select Modify from the pop-up menu.
2. Click on the Miscellaneous tab.
3. Select Downtime Causes from the Assignable cause choice list drop-down menu and click on the Save icon.
8.3 Enter data from a choice list.1. Highlight the group to which you attached the choice list. Click on
the Open group icon, .
2. Move the cell to a row and press C+N.
3. Click on the arrow in the Causes field and select a cause. Then, clickon K.
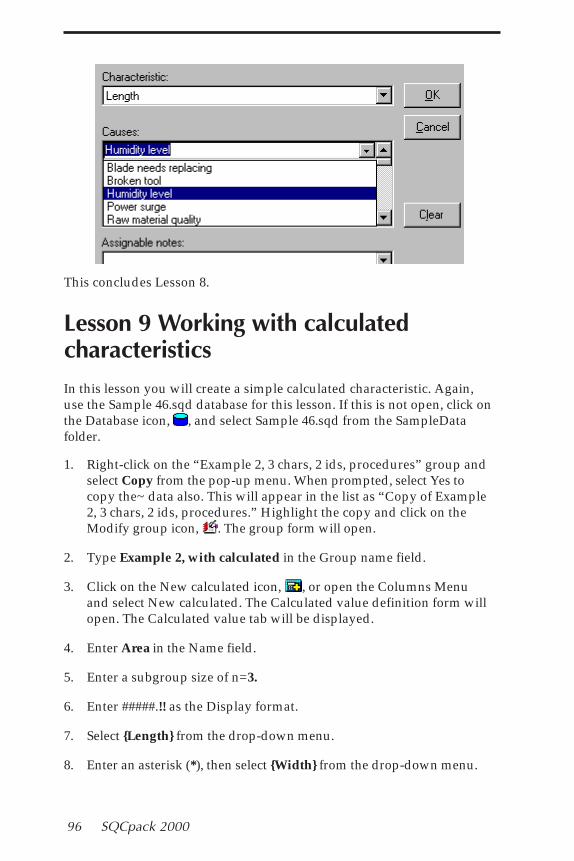
96 SQCpack 2000
This concludes Lesson 8.
Lesson 9 Working with calculatedcharacteristicsIn this lesson you will create a simple calculated characteristic. Again,use the Sample 46.sqd database for this lesson. If this is not open, click onthe Database icon, , and select Sample 46.sqd from the SampleDatafolder.
1. Right-click on the “Example 2, 3 chars, 2 ids, procedures” group andselect Copy from the pop-up menu. When prompted, select Yes tocopy the~ data also. This will appear in the list as “Copy of Example2, 3 chars, 2 ids, procedures.” Highlight the copy and click on theModify group icon, . The group form will open.
2. Type Example 2, with calculated in the Group name field.
3. Click on the New calculated icon, , or open the Columns Menuand select New calculated. The Calculated value definition form willopen. The Calculated value tab will be displayed.
4. Enter Area in the Name field.
5. Enter a subgroup size of n=3.
6. Enter #####.!! as the Display format.
7. Select {Length} from the drop-down menu.
8. Enter an asterisk (*), then select {Width} from the drop-down menu.
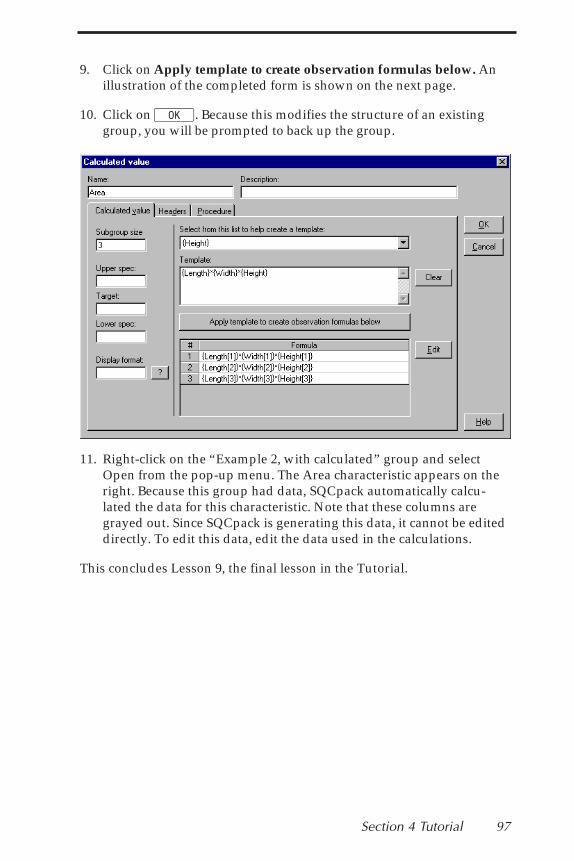
Section 4 Tutorial 97
9. Click on Apply template to create observation formulas below. Anillustration of the completed form is shown on the next page.
10. Click on K. Because this modifies the structure of an existinggroup, you will be prompted to back up the group.
11. Right-click on the “Example 2, with calculated” group and selectOpen from the pop-up menu. The Area characteristic appears on theright. Because this group had data, SQCpack automatically calcu-lated the data for this characteristic. Note that these columns aregrayed out. Since SQCpack is generating this data, it cannot be editeddirectly. To edit this data, edit the data used in the calculations.
This concludes Lesson 9, the final lesson in the Tutorial.

98 SQCpack 2000
Section 5 SQCpack 2000 databases 99
5
Section 5
The SQCpack 2000 Database
In this sectionThis section provides a quick reference to functions that are availablethrough the menus.
� Organizing data in SQCpack
� Creating new database files
� Opening database files
� Multiple database access
� Managing database files
� User databases
Organizing data in SQCpackSQCpack stores data in database files. Each database can contain severaldata groups, which are collections of one or more characteristics that youwant to monitor. A characteristic is an element of a product or process, suchas length, color, or temperature. For example, if you are monitoring a processthat makes coffee mugs, you might create a group with characteristics forheight, diameter, thickness, and kiln temperature.
Think of the SQCpack database as a file cabinet. Individual drawers arethe groups, and the files in a drawer are the characteristics for that group.
How you define a database, groups, and characteristics is up to you. Youcould define a database for the organization, for each shift, each customer,an entire product, a part, a process, a production line, or a department,and then set up groups to represent related characteristics.

100 SQCpack 2000
Database MenuTo access the Database Menu:
� Right-click on the name of a database
Or
� Highlight the name of a database. Database will appear in the Menubar at the top of SQCpack window.
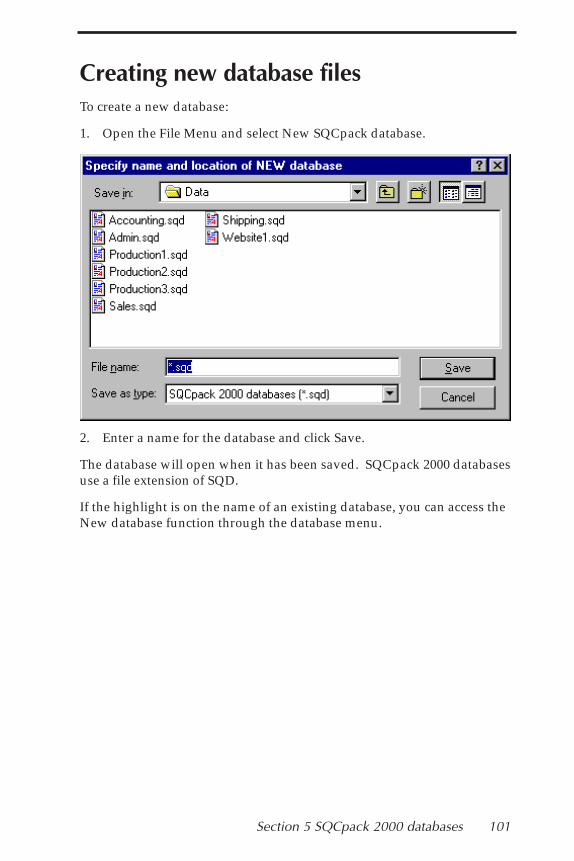
Section 5 SQCpack 2000 databases 101
Creating new database filesTo create a new database:
1. Open the File Menu and select New SQCpack database.
2. Enter a name for the database and click Save.
The database will open when it has been saved. SQCpack 2000 databasesuse a file extension of SQD.
If the highlight is on the name of an existing database, you can access theNew database function through the database menu.
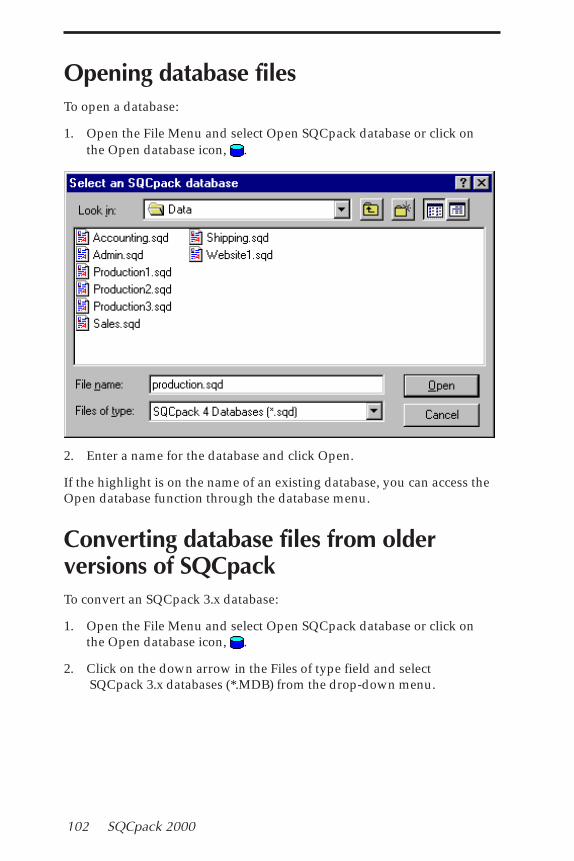
102 SQCpack 2000
Opening database filesTo open a database:
1. Open the File Menu and select Open SQCpack database or click onthe Open database icon, .
2. Enter a name for the database and click Open.
If the highlight is on the name of an existing database, you can access theOpen database function through the database menu.
Converting database files from olderversions of SQCpackTo convert an SQCpack 3.x database:
1. Open the File Menu and select Open SQCpack database or click onthe Open database icon, .
2. Click on the down arrow in the Files of type field and select SQCpack 3.x databases (*.MDB) from the drop-down menu.
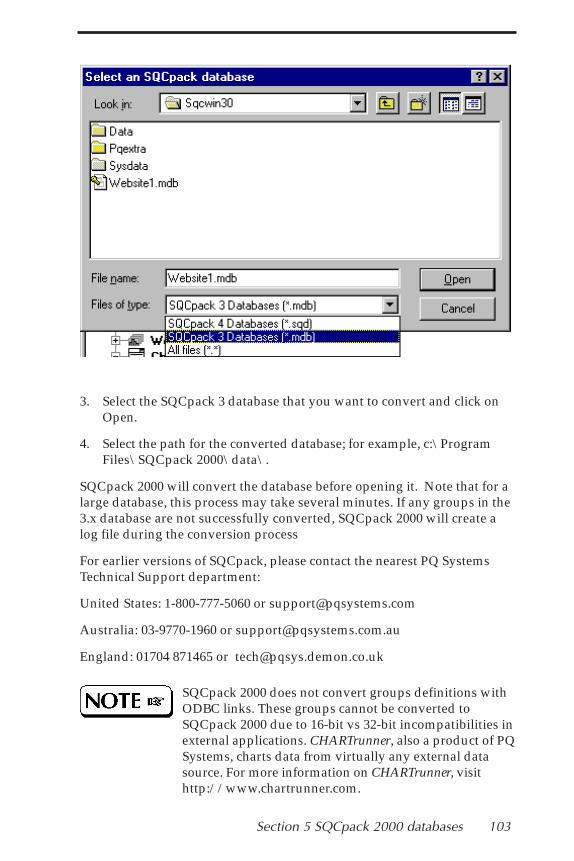
Section 5 SQCpack 2000 databases 103
3. Select the SQCpack 3 database that you want to convert and click onOpen.
4. Select the path for the converted database; for example, c:\ProgramFiles\SQCpack 2000\data\.
SQCpack 2000 will convert the database before opening it. Note that for alarge database, this process may take several minutes. If any groups in the3.x database are not successfully converted, SQCpack 2000 will create alog file during the conversion process
For earlier versions of SQCpack, please contact the nearest PQ SystemsTechnical Support department:
United States: 1-800-777-5060 or [email protected]
Australia: 03-9770-1960 or [email protected]
England: 01704 871465 or [email protected]
SQCpack 2000 does not convert groups definitions withODBC links. These groups cannot be converted toSQCpack 2000 due to 16-bit vs 32-bit incompatibilities inexternal applications. CHARTrunner, also a product of PQSystems, charts data from virtually any external datasource. For more information on CHARTrunner, visithttp://www.chartrunner.com.
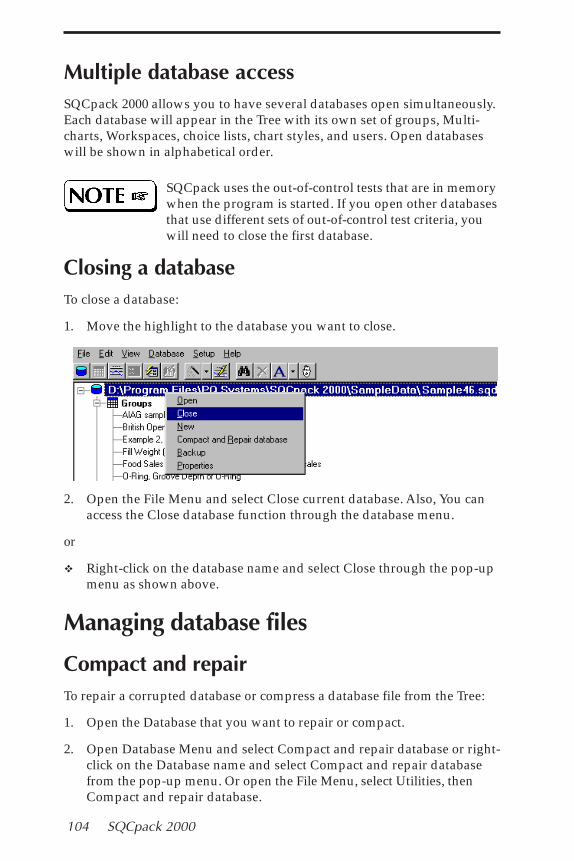
104 SQCpack 2000
Multiple database accessSQCpack 2000 allows you to have several databases open simultaneously.Each database will appear in the Tree with its own set of groups, Multi-charts, Workspaces, choice lists, chart styles, and users. Open databaseswill be shown in alphabetical order.
SQCpack uses the out-of-control tests that are in memorywhen the program is started. If you open other databasesthat use different sets of out-of-control test criteria, youwill need to close the first database.
Closing a database To close a database:
1. Move the highlight to the database you want to close.
2. Open the File Menu and select Close current database. Also, You canaccess the Close database function through the database menu.
or
� Right-click on the database name and select Close through the pop-upmenu as shown above.
Managing database files
Compact and repair To repair a corrupted database or compress a database file from the Tree:
1. Open the Database that you want to repair or compact.
2. Open Database Menu and select Compact and repair database or right-click on the Database name and select Compact and repair databasefrom the pop-up menu. Or open the File Menu, select Utilities, thenCompact and repair database.
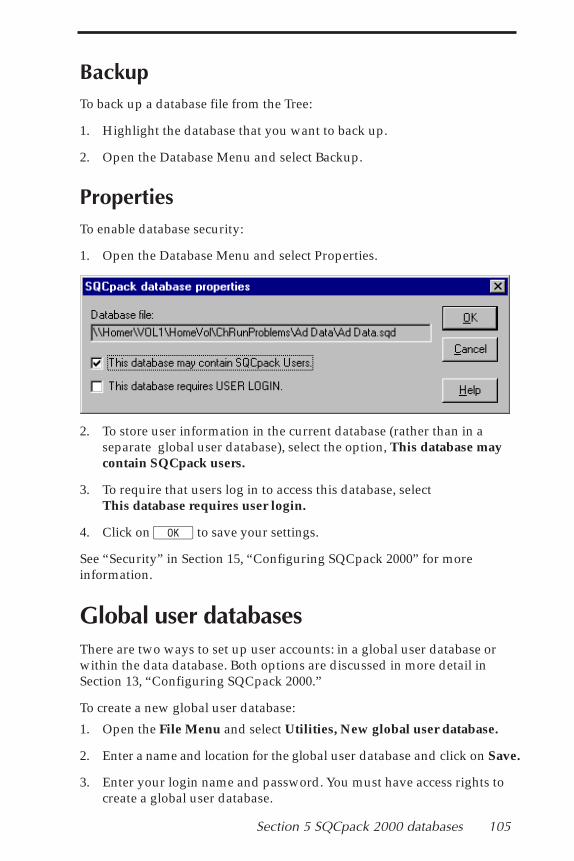
Section 5 SQCpack 2000 databases 105
BackupTo back up a database file from the Tree:
1. Highlight the database that you want to back up.
2. Open the Database Menu and select Backup.
PropertiesTo enable database security:
1. Open the Database Menu and select Properties.
2. To store user information in the current database (rather than in aseparate global user database), select the option, This database maycontain SQCpack users.
3. To require that users log in to access this database, selectThis database requires user login.
4. Click on K to save your settings.
See “Security” in Section 15, “Configuring SQCpack 2000” for moreinformation.
Global user databasesThere are two ways to set up user accounts: in a global user database orwithin the data database. Both options are discussed in more detail inSection 13, “Configuring SQCpack 2000.”
To create a new global user database:
1. Open the File Menu and select Utilities, New global user database.
2. Enter a name and location for the global user database and click on Save.
3. Enter your login name and password. You must have access rights tocreate a global user database.
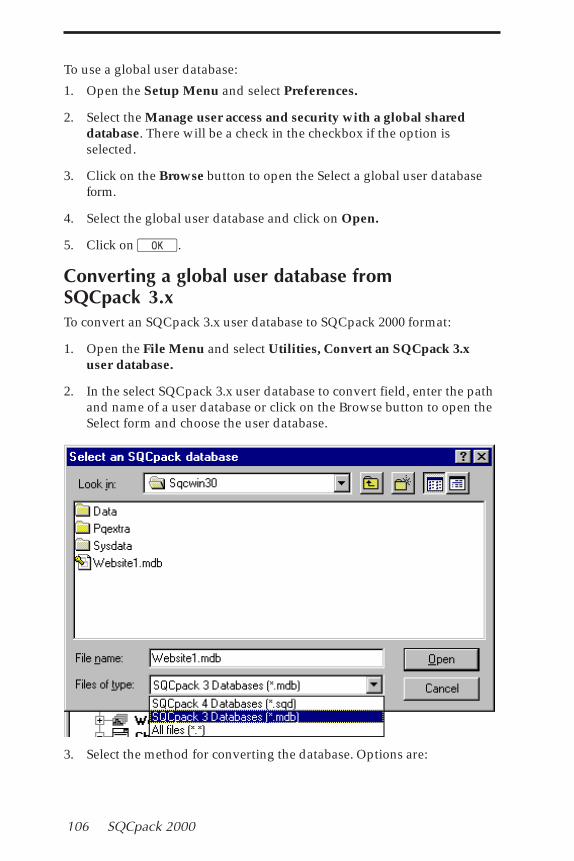
106 SQCpack 2000
To use a global user database:
1. Open the Setup Menu and select Preferences.
2. Select the Manage user access and security with a global shareddatabase. There will be a check in the checkbox if the option isselected.
3. Click on the Browse button to open the Select a global user databaseform.
4. Select the global user database and click on Open.
5. Click on K.
Converting a global user database fromSQCpack 3.xTo convert an SQCpack 3.x user database to SQCpack 2000 format:
1. Open the File Menu and select Utilities, Convert an SQCpack 3.xuser database.
2. In the select SQCpack 3.x user database to convert field, enter the pathand name of a user database or click on the Browse button to open theSelect form and choose the user database.
3. Select the method for converting the database. Options are:

Section 5 SQCpack 2000 databases 107
� Add users to a new global user database.Select this to create a new global user database for the 3.x users.
� Add users to the current global user database.Select this if you want the 3.x user accounts to be stored in thecurrent global user database.
� Add users to SQC database.Select this to include users in the same database as your data.
4. In the Database to add users field, enter the path and name of a userdatabase. For an existing database, click on the Browse button to openthe Select form and choose the user database. Click OK to close theSelect form. Click K to complete the conversion.

108 SQCpack 2000
Section 6 Working with groups and characteristics 109
6
Section 6
Working with groups andcharacteristics
In this section� Creating a group
� Creating group identifiers
� Creating characteristics
� Editing group & characteristic information
� Copying groups & characteristics
� Deleting groups & characteristics
� Group information
� Printing data
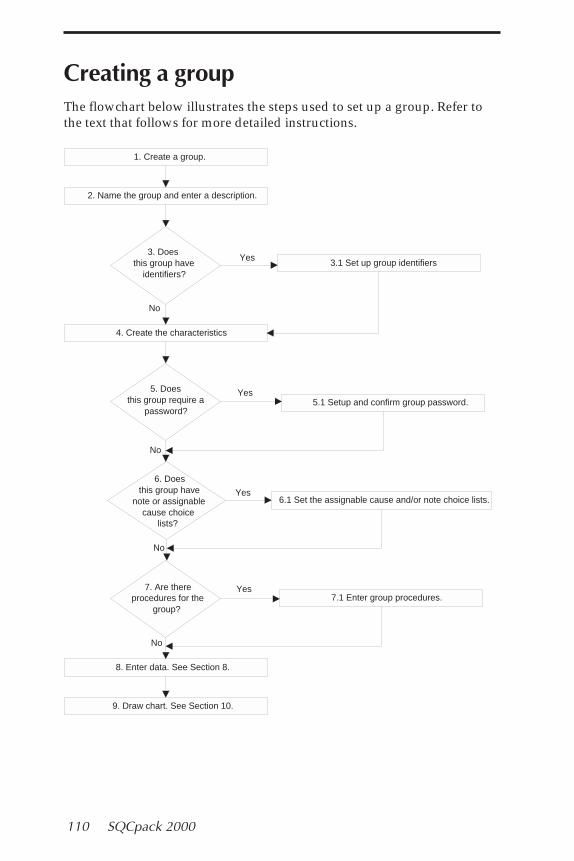
110 SQCpack 2000
Creating a groupThe flowchart below illustrates the steps used to set up a group. Refer tothe text that follows for more detailed instructions.
1. Create a group.
2. Name the group and enter a description.
3. Does this group have
identifiers?
4. Create the characteristics
5. Doesthis group require a
password?
6. Does this group have
note or assignable cause choice
lists?
7. Are there procedures for the
group?
8. Enter data. See Section 8.
9. Draw chart. See Section 10.
3.1 Set up group identifiers
5.1 Setup and confirm group password.
6.1 Set the assignable cause and/or note choice lists.
7.1 Enter group procedures.
Yes
Yes
Yes
Yes
No
No
No
No
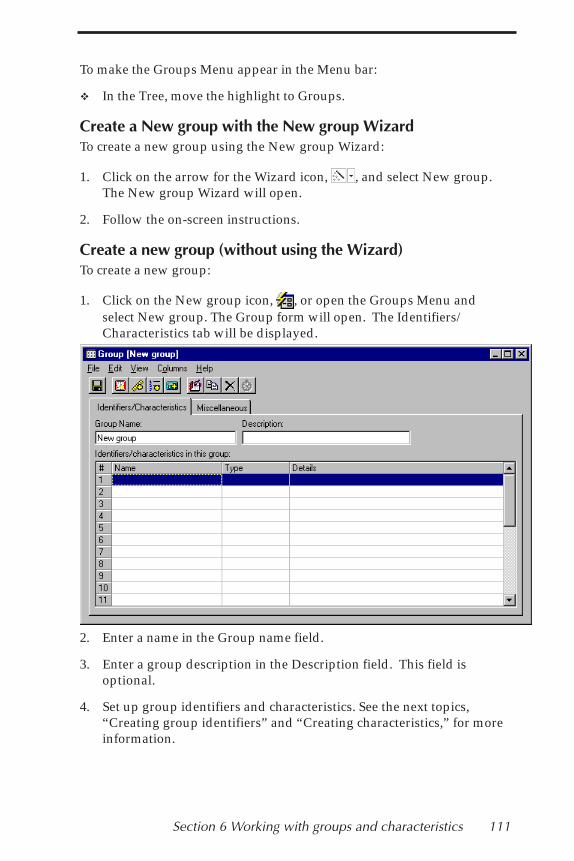
Section 6 Working with groups and characteristics 111
To make the Groups Menu appear in the Menu bar:
� In the Tree, move the highlight to Groups.
Create a New group with the New group WizardTo create a new group using the New group Wizard:
1. Click on the arrow for the Wizard icon, , and select New group.The New group Wizard will open.
2. Follow the on-screen instructions.
Create a new group (without using the Wizard)To create a new group:
1. Click on the New group icon, , or open the Groups Menu andselect New group. The Group form will open. The Identifiers/Characteristics tab will be displayed.
2. Enter a name in the Group name field.
3. Enter a group description in the Description field. This field isoptional.
4. Set up group identifiers and characteristics. See the next topics,“Creating group identifiers” and “Creating characteristics,” for moreinformation.
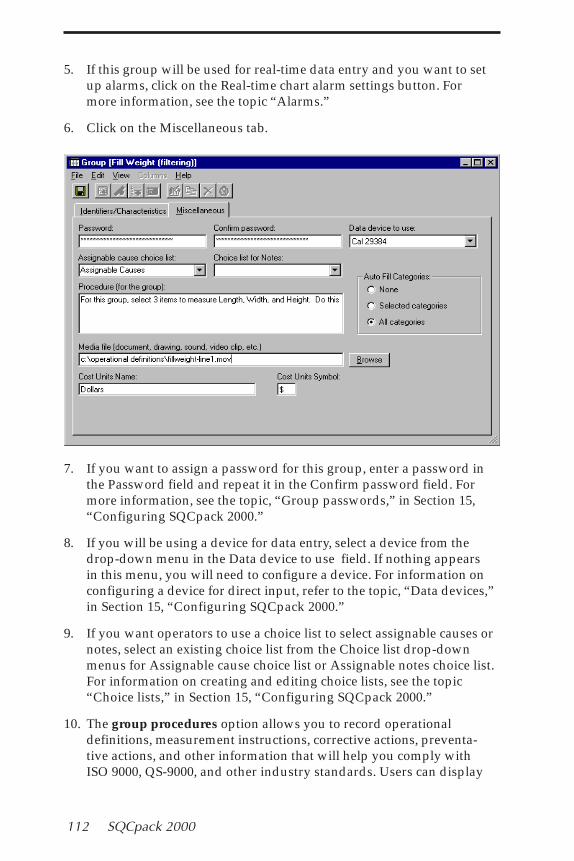
112 SQCpack 2000
5. If this group will be used for real-time data entry and you want to setup alarms, click on the Real-time chart alarm settings button. Formore information, see the topic “Alarms.”
6. Click on the Miscellaneous tab.
7. If you want to assign a password for this group, enter a password inthe Password field and repeat it in the Confirm password field. Formore information, see the topic, “Group passwords,” in Section 15,“Configuring SQCpack 2000.”
8. If you will be using a device for data entry, select a device from thedrop-down menu in the Data device to use field. If nothing appearsin this menu, you will need to configure a device. For information onconfiguring a device for direct input, refer to the topic, “Data devices,”in Section 15, “Configuring SQCpack 2000.”
9. If you want operators to use a choice list to select assignable causes ornotes, select an existing choice list from the Choice list drop-downmenus for Assignable cause choice list or Assignable notes choice list.For information on creating and editing choice lists, see the topic“Choice lists,” in Section 15, “Configuring SQCpack 2000.”
10. The group procedures option allows you to record operationaldefinitions, measurement instructions, corrective actions, preventa-tive actions, and other information that will help you comply withISO 9000, QS-9000, and other industry standards. Users can display
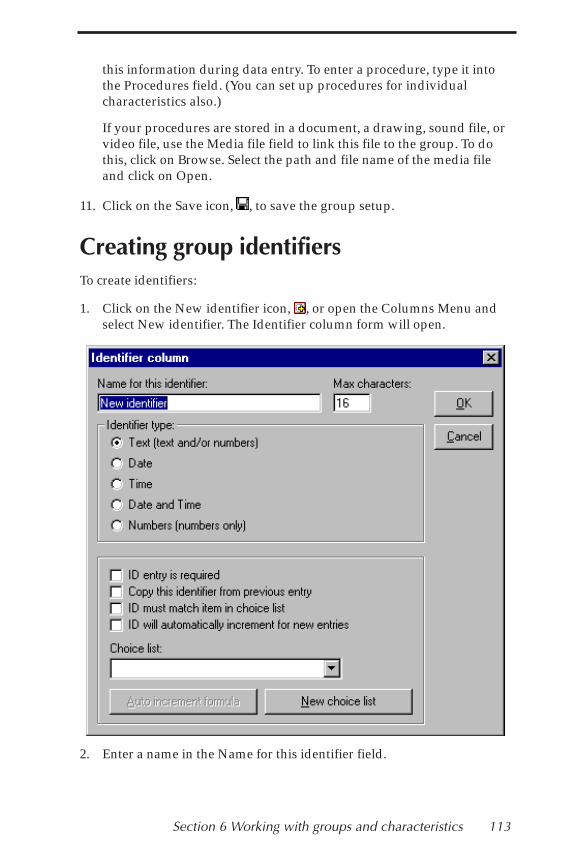
Section 6 Working with groups and characteristics 113
this information during data entry. To enter a procedure, type it intothe Procedures field. (You can set up procedures for individualcharacteristics also.)
If your procedures are stored in a document, a drawing, sound file, orvideo file, use the Media file field to link this file to the group. To dothis, click on Browse. Select the path and file name of the media fileand click on Open.
11. Click on the Save icon, , to save the group setup.
Creating group identifiersTo create identifiers:
1. Click on the New identifier icon, , or open the Columns Menu andselect New identifier. The Identifier column form will open.
2. Enter a name in the Name for this identifier field.
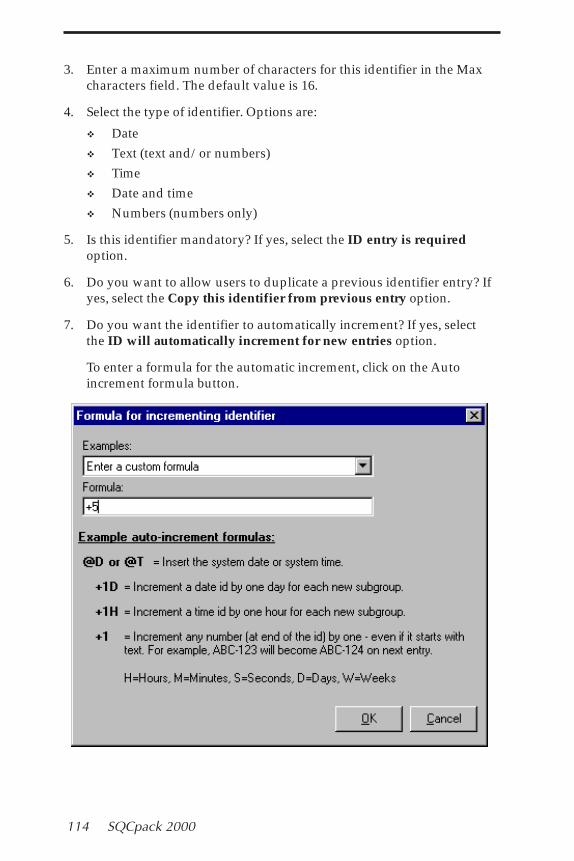
114 SQCpack 2000
3. Enter a maximum number of characters for this identifier in the Maxcharacters field. The default value is 16.
4. Select the type of identifier. Options are:
� Date� Text (text and/or numbers)� Time� Date and time� Numbers (numbers only)
5. Is this identifier mandatory? If yes, select the ID entry is requiredoption.
6. Do you want to allow users to duplicate a previous identifier entry? Ifyes, select the Copy this identifier from previous entry option.
7. Do you want the identifier to automatically increment? If yes, selectthe ID will automatically increment for new entries option.
To enter a formula for the automatic increment, click on the Autoincrement formula button.
Section 6 Working with groups and characteristics 115
Enter the formula and click on K. The form, shown above, in-cludes example formulas. To view an example, select a formula fromthe drop-down menu. The formula will appear in the Formula field.
8. If this is a text or numbers identifier, do you want to use a choice list?Select a choice list from the Choice list drop-down menu. To create anew choice list, click on the Choice list button. Setup the choice list andclick on K. For information on creating and editing choice lists,see the topic “Choice lists,” in Section 15, “Configuring SQCpack2000.”
If you specify a choice list for this identifier, must the entry match thechoice list? If yes, select the ID must match item in the choice listoption.
9. Select K to save the identifier.
Creating characteristicsThere are three types of characteristics: measurement, count, and calculated.
Measurement Create a measurement characteristic for variables data.
Count Count characteristics are used for attributes or Pareto data.You will need to setup a separate count characteristiccolumn to record the number inspected.
Calculated Set up a calculated characteristic to calculate data basedon measurement characteristics data. For example, create acalculated characteristic of Area by multiplying ameasurement characteristic of Length x a measurementcharacteristic of Width.
For more information on data types, please refer to Section 7, “Data andchart types.”
Measurement characteristicsTo create a measurement (variables) characteristic:
1. Click on the New measurement icon or open the Columns Menu andselect New measurement. The Measurement definition form will open.The Measurement tab will be displayed.

116 SQCpack 2000
2. Enter a name for the characteristic.
3. Enter a description in the Description field. This field is optional.
4. Type the number of observations you want to enter for each sample(data point on a chart). For information on how to select a samplesize, please refer to the SQC Quality Advisor. This field is required.
5. All other fields are optional. See below for descriptions.
6. To save the characteristic, click on K.
Optional characteristics fields:Upper spec, Target, Lower specAlthough these fields are optional, you will need to enter values in theupper and/or lower specification (tolerance) fields in order to performcapability analysis. Type specifications in these fields.
If you have only one specification value, leave the otherfield blank.
Warn on entries beyond specificationsSelect this option if you want to alert user when an observation fallsoutside specifications during data entry.
Section 6 Working with groups and characteristics 117
Data entry format Use the Data entry format field to set up the format for incoming data.When you enter the format, use the following symbols:
This field can contain up to 16 characters. When you enter the format, usethe following symbols:
Use this: To represent this:# a digit, will not replace a blank with zero
0-9 pre-type/auto type digits
@ a decimal automatically included
. a decimal that the user types
! a digit placeholder, if nothing is typed, 0 will beinserted
Both the # and the ! are considered as ‘digit place holders.’ They aredifferent in one respect. If no digit is typed where an exclamation markappears (in the format), a zero will be placed there automatically. For the#, if no digit is typed, none will be displayed. For example, if the dataentry format is .12!! and you do not enter a value, SQCpack will leave thecell empty. If you type 0, SQCpack will write the data as .1200.
Use the @ sign if you want a decimal to be typed automatically. In terms offormatting the number this symbol acts just like a decimal. When a usercomes to this ‘position’ while typing, a decimal will be entered automati-cally. For example, if you enter a format of #@##, you can type 258 and theprogram will enter the data as 2.58.
If you want to use a typing prefix, you can set it up in this field. Forexample, if all the data values for this characteristic fall between 2.52 and2.59, you can enter a data format of 2.5###. The 2.5 would be automati-cally entered for each observation and users must enter only theadditional values. To enter 2.5873, for example, you would type only the873. The typing prefix can be overwritten if data falls outside the prefixrange.
Hard digits that appear starting at the left of the format ( 1, 2, 3, 4, 5, 6, 7, 8, 9)will be automatically typed for users as they move from cell to cell. Assoon as a non-hard digit is encountered, the auto typing stops. Forexample, the format: 12.##4## will pre-type only the 12. (the 4 is treatedlike a #).
118 SQCpack 2000
Data entry format Value entered Value displayed Value stored##. 21 21. 21##.0 21 21.0 212#.! 1 21.0 2121.# 1 21.1 21.1### 21.1 21 21.1000 21.1 021 21.100@0 211 21.1 21.1.0!! .1 .100 .1.00 .034 .03 .034.00 .036 .04 .036#.00 -.1 -.10 -.1#.00 .1 .10 .1#00.00 99.9 99.90 99.9#00.00 100 100.00 100.12!!.12!! 0 .1200 .120
The program stores the complete number entered, regardless of the dataentry format. If the display shows 2 places after the decimal, but you areentering 3 numbers after the decimal, you will not lose any data. If youwant to display this last digit, you can modify the data entry format.
Max value to be entered, Min value to be enteredUse these fields to enter the largest and smallest numbers you can enter foran observation. You can enter a value in both, one, or neither of these fields.
If you set a minimum and/or maximum value, press T and use t or bto set the parameters. Options are:
❖ Do not allow invalid entries
❖ Warn user (but allow) invalid entries
❖ Ignore invalid entries
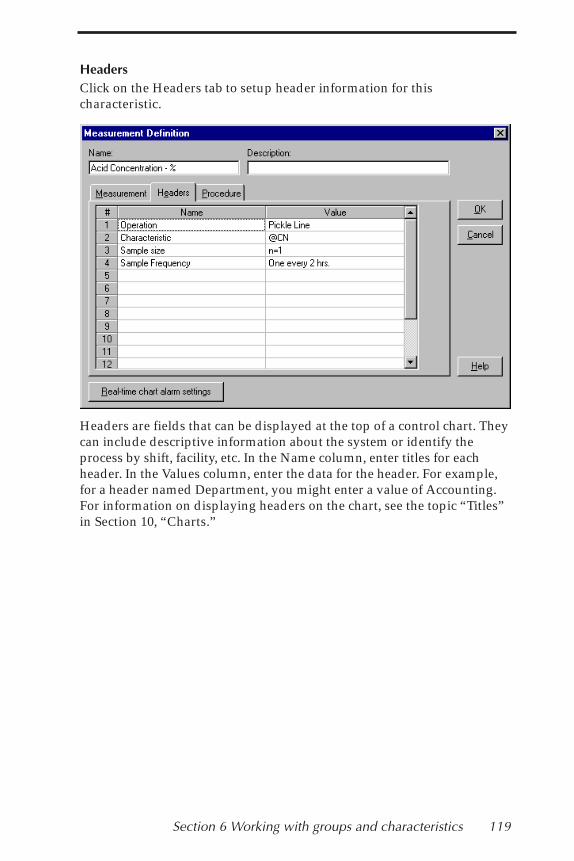
Section 6 Working with groups and characteristics 119
HeadersClick on the Headers tab to setup header information for thischaracteristic.
Headers are fields that can be displayed at the top of a control chart. Theycan include descriptive information about the system or identify theprocess by shift, facility, etc. In the Name column, enter titles for eachheader. In the Values column, enter the data for the header. For example,for a header named Department, you might enter a value of Accounting.For information on displaying headers on the chart, see the topic “Titles”in Section 10, “Charts.”

120 SQCpack 2000
Characteristics proceduresClick on the Procedures tab to enter procedures for this characteristic.
The characteristic procedures option allows you to record operationaldefinitions, measurement instructions, corrective actions, preventiveactions, and other information that will help you comply with ISO 9000,QS-9000, and other industry standards. Users can display this informa-tion during data entry. To enter a procedure, type it in Procedures field.(You can set up general procedures for the group also.)
If your procedures are stored in a document, a drawing, sound file, orvideo file, use the Media file field to link this file to the group. To do this,click on Browse. Select the path and file name of the media file and clickon Open.
Count characteristicsTo create a count (attributes or Pareto) characteristic:
1. Click on the New count icon or open the Columns Menu and selectNew count. The Count definition form will open. The Count tab willbe displayed.
2. Enter a name for the characteristic.
3. Enter a description in the Description field. This field is optional.
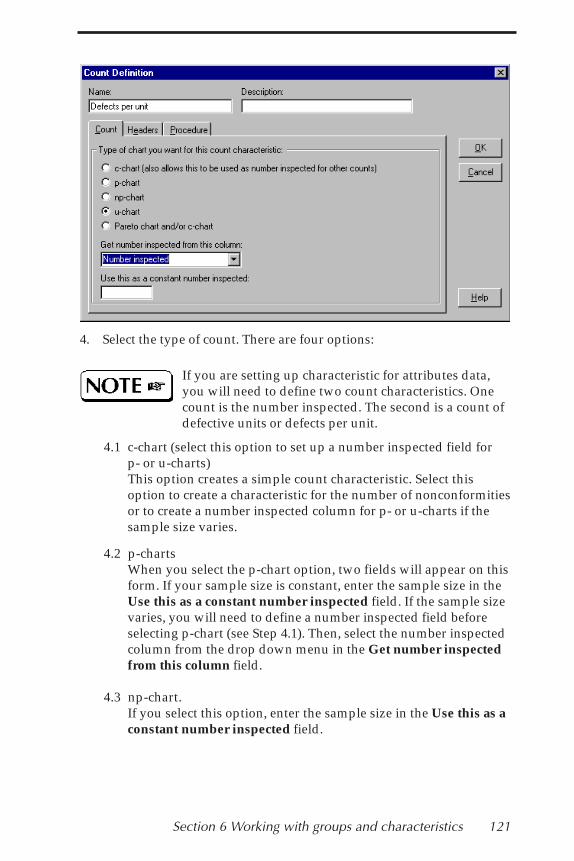
Section 6 Working with groups and characteristics 121
4. Select the type of count. There are four options:
If you are setting up characteristic for attributes data,you will need to define two count characteristics. Onecount is the number inspected. The second is a count ofdefective units or defects per unit.
4.1 c-chart (select this option to set up a number inspected field forp- or u-charts)This option creates a simple count characteristic. Select thisoption to create a characteristic for the number of nonconformitiesor to create a number inspected column for p- or u-charts if thesample size varies.
4.2 p-chartsWhen you select the p-chart option, two fields will appear on thisform. If your sample size is constant, enter the sample size in theUse this as a constant number inspected field. If the sample sizevaries, you will need to define a number inspected field beforeselecting p-chart (see Step 4.1). Then, select the number inspectedcolumn from the drop down menu in the Get number inspectedfrom this column field.
4.3 np-chart.If you select this option, enter the sample size in the Use this as aconstant number inspected field.
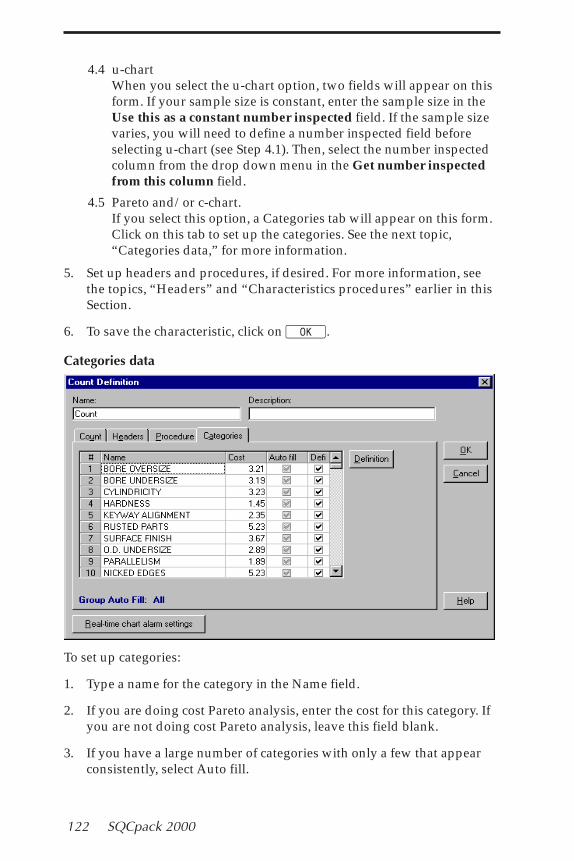
122 SQCpack 2000
4.4 u-chartWhen you select the u-chart option, two fields will appear on thisform. If your sample size is constant, enter the sample size in theUse this as a constant number inspected field. If the sample sizevaries, you will need to define a number inspected field beforeselecting u-chart (see Step 4.1). Then, select the number inspectedcolumn from the drop down menu in the Get number inspectedfrom this column field.
4.5 Pareto and/or c-chart.If you select this option, a Categories tab will appear on this form.Click on this tab to set up the categories. See the next topic,“Categories data,” for more information.
5. Set up headers and procedures, if desired. For more information, seethe topics, “Headers” and “Characteristics procedures” earlier in thisSection.
6. To save the characteristic, click on K.
Categories data
To set up categories:
1. Type a name for the category in the Name field.
2. If you are doing cost Pareto analysis, enter the cost for this category. Ifyou are not doing cost Pareto analysis, leave this field blank.
3. If you have a large number of categories with only a few that appearconsistently, select Auto fill.
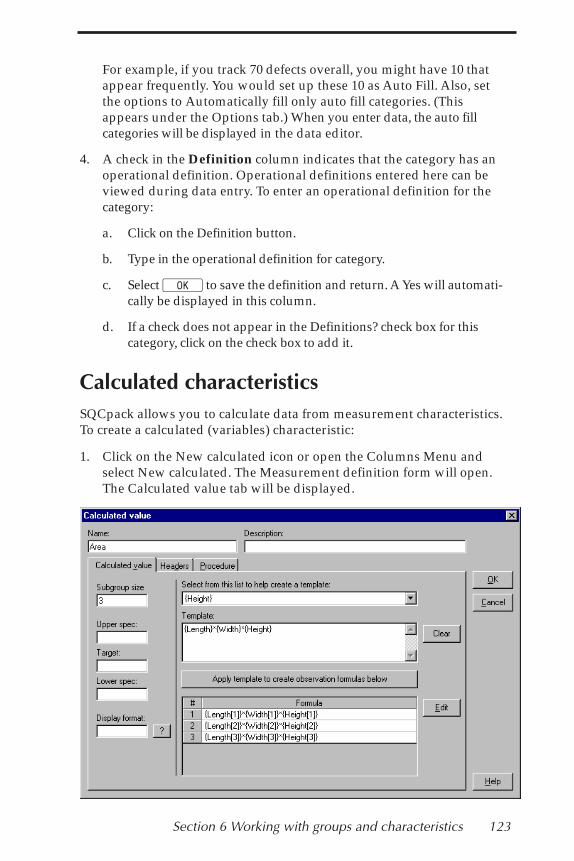
Section 6 Working with groups and characteristics 123
For example, if you track 70 defects overall, you might have 10 thatappear frequently. You would set up these 10 as Auto Fill. Also, setthe options to Automatically fill only auto fill categories. (Thisappears under the Options tab.) When you enter data, the auto fillcategories will be displayed in the data editor.
4. A check in the Definition column indicates that the category has anoperational definition. Operational definitions entered here can beviewed during data entry. To enter an operational definition for thecategory:
a. Click on the Definition button.
b. Type in the operational definition for category.
c. Select K to save the definition and return. A Yes will automati-cally be displayed in this column.
d. If a check does not appear in the Definitions? check box for thiscategory, click on the check box to add it.
Calculated characteristicsSQCpack allows you to calculate data from measurement characteristics.To create a calculated (variables) characteristic:
1. Click on the New calculated icon or open the Columns Menu andselect New calculated. The Measurement definition form will open.The Calculated value tab will be displayed.
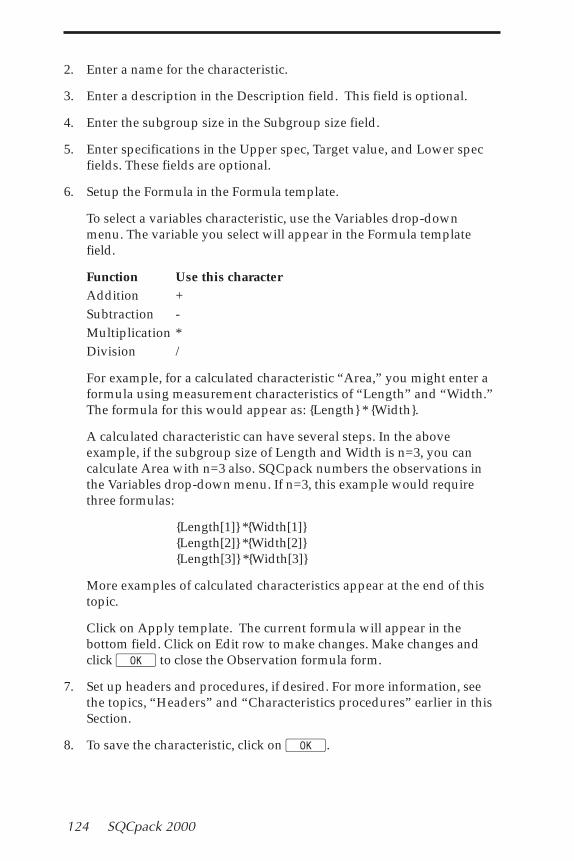
124 SQCpack 2000
2. Enter a name for the characteristic.
3. Enter a description in the Description field. This field is optional.
4. Enter the subgroup size in the Subgroup size field.
5. Enter specifications in the Upper spec, Target value, and Lower specfields. These fields are optional.
6. Setup the Formula in the Formula template.
To select a variables characteristic, use the Variables drop-downmenu. The variable you select will appear in the Formula templatefield.
Function Use this characterAddition +Subtraction -Multiplication *Division /
For example, for a calculated characteristic “Area,” you might enter aformula using measurement characteristics of “Length” and “Width.”The formula for this would appear as: {Length} * {Width}.
A calculated characteristic can have several steps. In the aboveexample, if the subgroup size of Length and Width is n=3, you cancalculate Area with n=3 also. SQCpack numbers the observations inthe Variables drop-down menu. If n=3, this example would requirethree formulas:
{Length[1]} *{Width[1]}{Length[2]} *{Width[2]}{Length[3]} *{Width[3]}
More examples of calculated characteristics appear at the end of thistopic.
Click on Apply template. The current formula will appear in thebottom field. Click on Edit row to make changes. Make changes andclick K to close the Observation formula form.
7. Set up headers and procedures, if desired. For more information, seethe topics, “Headers” and “Characteristics procedures” earlier in thisSection.
8. To save the characteristic, click on K.
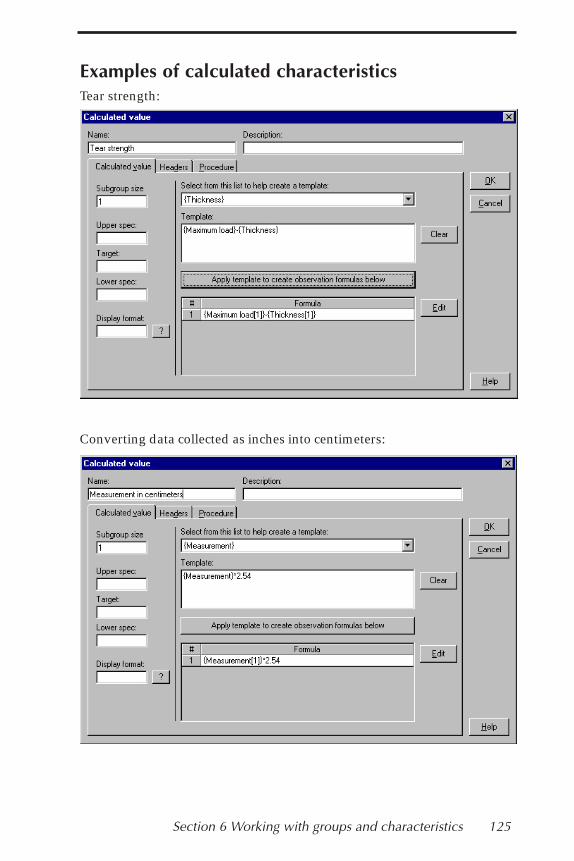
Section 6 Working with groups and characteristics 125
Examples of calculated characteristicsTear strength:
Converting data collected as inches into centimeters:
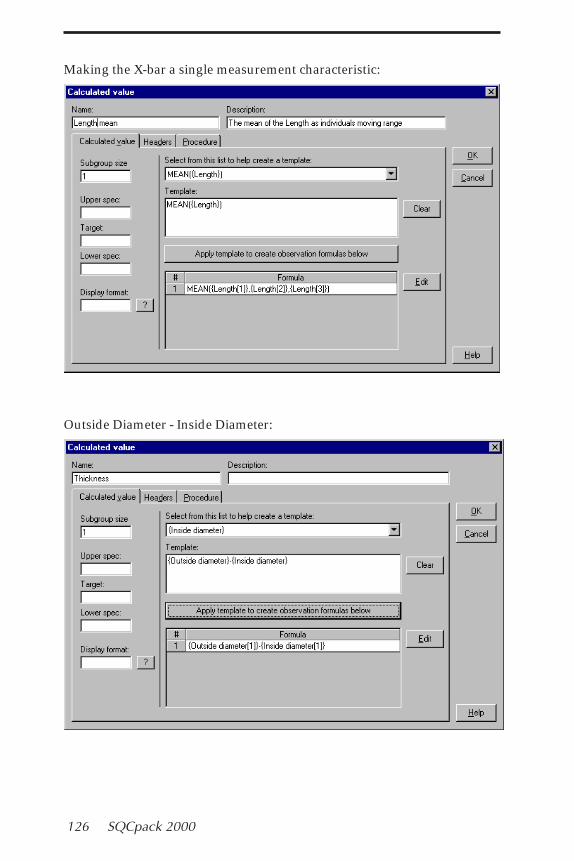
126 SQCpack 2000
Making the X-bar a single measurement characteristic:
Outside Diameter - Inside Diameter:
Section 6 Working with groups and characteristics 127
Modify groups, characteristics, and identifiersTo modify a group, characteristic, and/or identifier setup:
1. In the Tree, move the highlight to the group you want to edit.
2. Open the Group Menu or right-click on the group. Select Modify fromthe menu, or click on the Edit identifier or characteristic icon.
3. Make desired changes to the group settings.
4. Move the highlight to the identifier or characteristic that you want toedit. Open the Columns Menu and select Modify.
5. Make desired changes and click on K.
6. Click on the Save icon to save the changes and close the Group form.
Copying groups, characteristics, andidentifiersTo copy a group:
1. Move the highlight to the group you want to copy.
2. Open the Group Menu or right-click on the group. Select Copy fromthe menu.
To copy a characteristic or identifiers:
1. In the Tree, move the highlight to the group you want edit.
2. Open the Group Menu or right-click on the group. Select Modify fromthe menu. Or click on the Copy identifier or characteristic icon.
3. Move the highlight to the characteristic or identifier that you want toedit.
4. Open the Columns Menu and select Copy.
128 SQCpack 2000
Deleting groups, characteristics, andidentifiersTo delete a group:
1. Move the highlight to the group you want to delete.
2. Open the Group Menu or right-click on the group. Select Delete fromthe menu. You will be prompted to confirm the delete. Click on Yes todelete or No to cancel the deletion.
To delete a characteristic or identifiers:
1. In the Tree, move the highlight to the group you want to delete.
2. Open the Group Menu or right-click on the group. Select Modify fromthe menu.
3. Move the highlight to the characteristic or identifier that you want todelete.
4. Open the Columns Menu and select Delete. You will be prompted toconfirm the delete. Click on Yes to delete or No to cancel the deletion.
Purge groups marked for deletionWhen you delete a group from the database, the group is not permanentlydeleted until you run the Compact and repair utility or select this utility.To purge deleted groups:
� Open the File Menu and select Utilities, Purge groups marked fordeletion. You will be prompted to confirm the purge. Select Yes topermanently delete the groups, No to cancel the deletion.
Recall selected groupsWhen you delete a group from the database, the group is not permanentlydeleted until you run the Compact and repair utility or purge deletedgroups utilities. Groups that have not been permanently deleted can berestored. To do this:
1. Open the File Menu and select Utilities, Recall selected groups. TheRecall groups marked for deletion form will open.
2. Uncheck any group that you want to restore. Groups with a checkwill remain marked for deletion.
3. Click on the Recall button.
Section 6 Working with groups and characteristics 129
InformationTo view group information including name, description, date created, lastmodified date, identifiers, and characteristics:
1. Highlight a group in the Tree.
2. Open the Group Menu and select Information.
3. Click on K to close the Information window.
Print dataTo print or export data from the highlighted group:
1. Open the Group Menu and select Print data.
2. Select Print.
3. Select the items that you want to print.
4. Press K.
Export dataTo export data from the highlighted group:
1. Open the Group Menu and select Export data.
2. Select Export.
3. Select the items that you want to export.
4. Press K.

130 SQCpack 2000
Section 7 Data and chart types 131
7
Section 7
Data and chart types
In this sectionSQCpack provides tools for analyzing variables, attributes, and Paretodata. This chapter examines key data types and analytical tools so that youcan select the best one for your data. Note, however, that this chapterdoes not describe all possible applications of SQCpack’s charts.
This section covers:
� Variables data- What is variables data- What charts are used for analyzing variables data- X-bar and R charts- X-bar and S charts- Median charts- Individuals and moving range charts (X-MR)- Moving average and moving range- Run charts- Histograms- Capability analysis- Cusum
� Attributes data- What is attributes data- What charts are used for analyzing attributes data- np-charts- p-charts- c-charts- u-charts
� Pareto data- What is Pareto data- What charts are used to analyze Pareto data (Pareto diagrams)- Bar & column charts- Pie charts
The online SQC Quality Advisor provides more detail for each of thesecharts and data types. You can access this through the Help Menu.
132 SQCpack 2000
Variables Data
What is variables data?Variables data is data that is collected through measurements, such aslength, time, diameter, strength, weight, temperature, density, thickness, orheight. Variables data offers the advantage of choice in the degree ofaccuracy required. For example, you can measure an item to the nearestcentimeter, millimeter, or micron.
What charts are used for analyzing variables data?SQCpack offers control charts, histograms, trend charts, scatter diagrams,and run charts for analyzing variables data. Use variables control chartsto determine if a process is predictable or to see how changes affect theprocess. Use histograms to analyze the distribution of data from a stableprocess. Use histograms with capability analysis to determine the capabil-ity and/or performance of the system. Use run charts for a quick look at asystem’s direction or when you do not have enough data for conventionalcontrol chart analysis.
Variables Control ChartsVariables data is usually analyzed in pairs of charts that present data interms of location or central tendency and spread. Location, usually the topchart, shows data in relation to the process average. It is presented in X-bar or individuals charts. Spread, usually reflected in the bottom chart,looks at piece-by-piece variation. Range (R), sigma (s), or moving rangecharts are used to illustrate process spread. Because the median chartshows each observation, it illustrates both process spread and location.Another aspect of these variables control charts is that the subgroup sizeis typically constant.
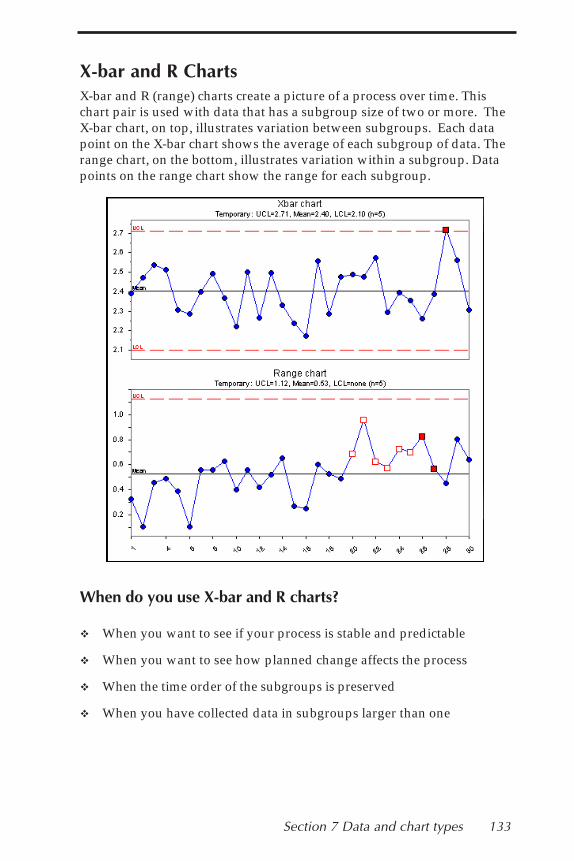
Section 7 Data and chart types 133
X-bar and R ChartsX-bar and R (range) charts create a picture of a process over time. Thischart pair is used with data that has a subgroup size of two or more. TheX-bar chart, on top, illustrates variation between subgroups. Each datapoint on the X-bar chart shows the average of each subgroup of data. Therange chart, on the bottom, illustrates variation within a subgroup. Datapoints on the range chart show the range for each subgroup.
When do you use X-bar and R charts?
� When you want to see if your process is stable and predictable
� When you want to see how planned change affects the process
� When the time order of the subgroups is preserved
� When you have collected data in subgroups larger than one

134 SQCpack 2000
X-bar and Sigma ChartsThe X-bar and sigma chart is a variation of the X-bar and R chart. Again,the X-bar chart (top) shows the average or mean of each subgroup of data.Instead of range, however, the lower chart shows the standard deviationof each subgroup. This chart combination is generally used when thesubgroup size is large; for example, eleven or more observations persubgroup.
When do you use X-bar and s charts?� When you want to see if your process is stable and predictable
� When you want to see how planned change affects the process
� When the time order of the subgroups is preserved
� When you have collected data with a subgroup size of eleven or more
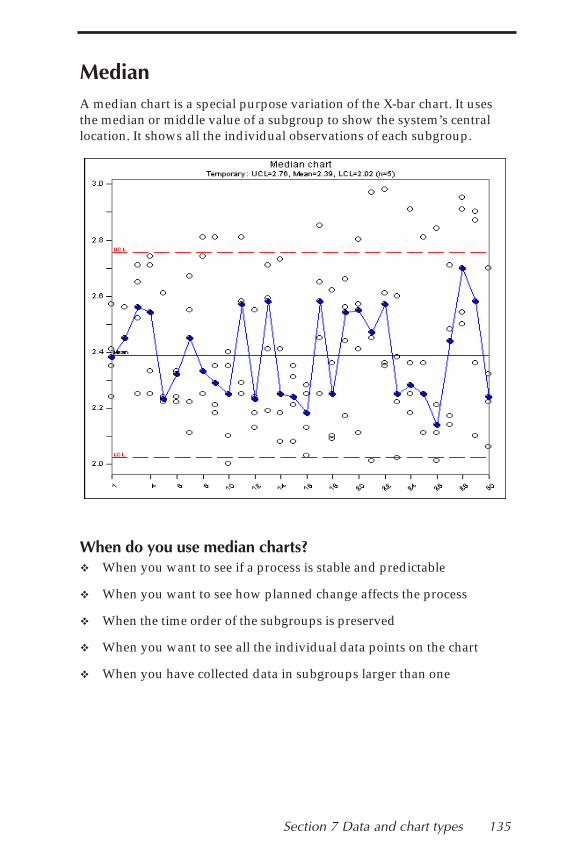
Section 7 Data and chart types 135
MedianA median chart is a special purpose variation of the X-bar chart. It usesthe median or middle value of a subgroup to show the system’s centrallocation. It shows all the individual observations of each subgroup.
When do you use median charts?� When you want to see if a process is stable and predictable
� When you want to see how planned change affects the process
� When the time order of the subgroups is preserved
� When you want to see all the individual data points on the chart
� When you have collected data in subgroups larger than one

136 SQCpack 2000
Individuals and Moving RangeIndividuals (X) and moving range (MR) chart combination is a variationof the X-bar and R chart. It is used with subgroups containing onereading. The X chart, on top, shows individual data values. The MRchart, on the bottom, creates ranges by finding the difference betweenconsecutive data values. It uses absolute values, thus avoiding negativemoving range values.
When do you use individuals and moving range charts?� When you want to see if your process is stable and predictable
� When you want to see how planned change affects the process
� When the time order of the subgroups is preserved
� When you have collected data in subgroups of one
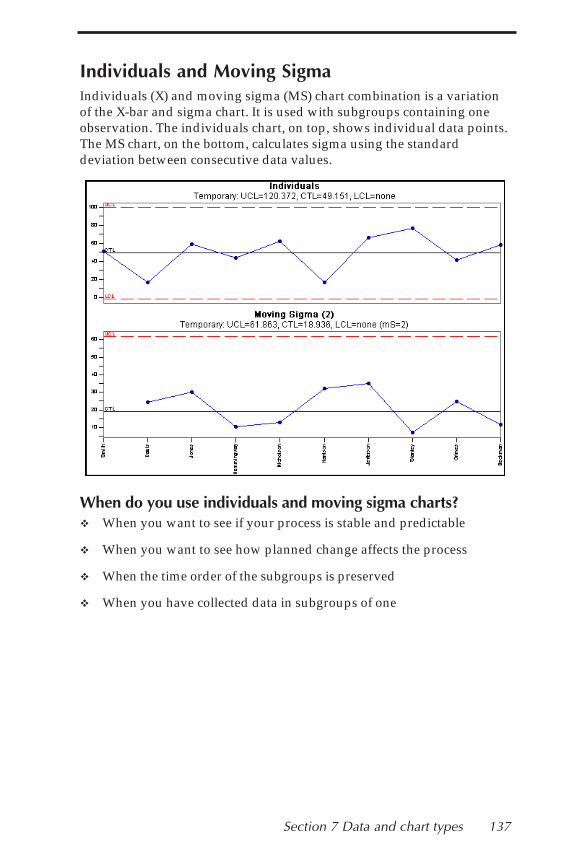
Section 7 Data and chart types 137
Individuals and Moving SigmaIndividuals (X) and moving sigma (MS) chart combination is a variationof the X-bar and sigma chart. It is used with subgroups containing oneobservation. The individuals chart, on top, shows individual data points.The MS chart, on the bottom, calculates sigma using the standarddeviation between consecutive data values.
When do you use individuals and moving sigma charts?� When you want to see if your process is stable and predictable
� When you want to see how planned change affects the process
� When the time order of the subgroups is preserved
� When you have collected data in subgroups of one
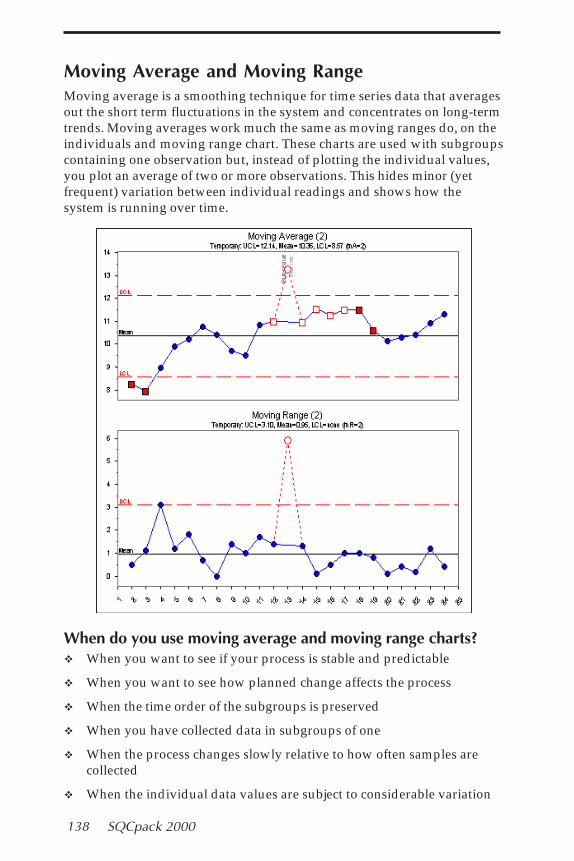
138 SQCpack 2000
Moving Average and Moving RangeMoving average is a smoothing technique for time series data that averagesout the short term fluctuations in the system and concentrates on long-termtrends. Moving averages work much the same as moving ranges do, on theindividuals and moving range chart. These charts are used with subgroupscontaining one observation but, instead of plotting the individual values,you plot an average of two or more observations. This hides minor (yetfrequent) variation between individual readings and shows how thesystem is running over time.
When do you use moving average and moving range charts?� When you want to see if your process is stable and predictable
� When you want to see how planned change affects the process
� When the time order of the subgroups is preserved
� When you have collected data in subgroups of one
� When the process changes slowly relative to how often samples arecollected
� When the individual data values are subject to considerable variation
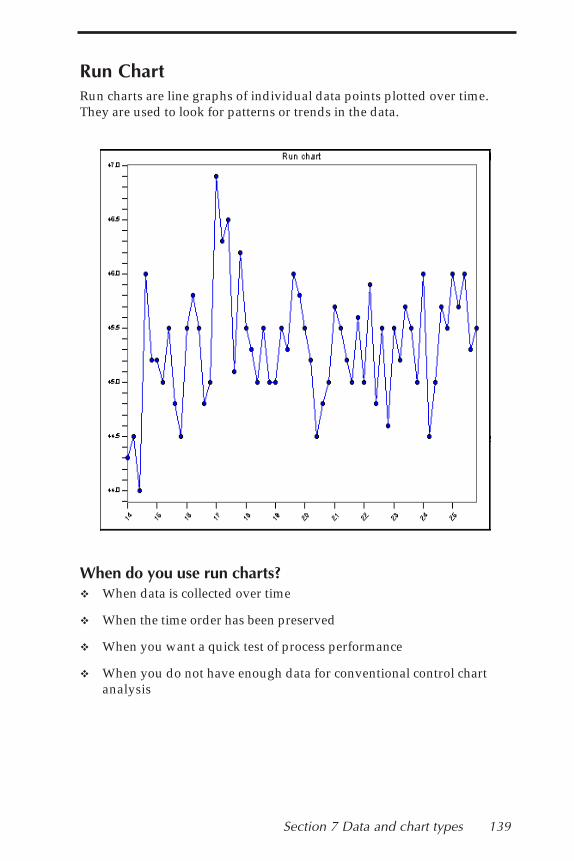
Section 7 Data and chart types 139
Run ChartRun charts are line graphs of individual data points plotted over time.They are used to look for patterns or trends in the data.
When do you use run charts?� When data is collected over time
� When the time order has been preserved
� When you want a quick test of process performance
� When you do not have enough data for conventional control chartanalysis
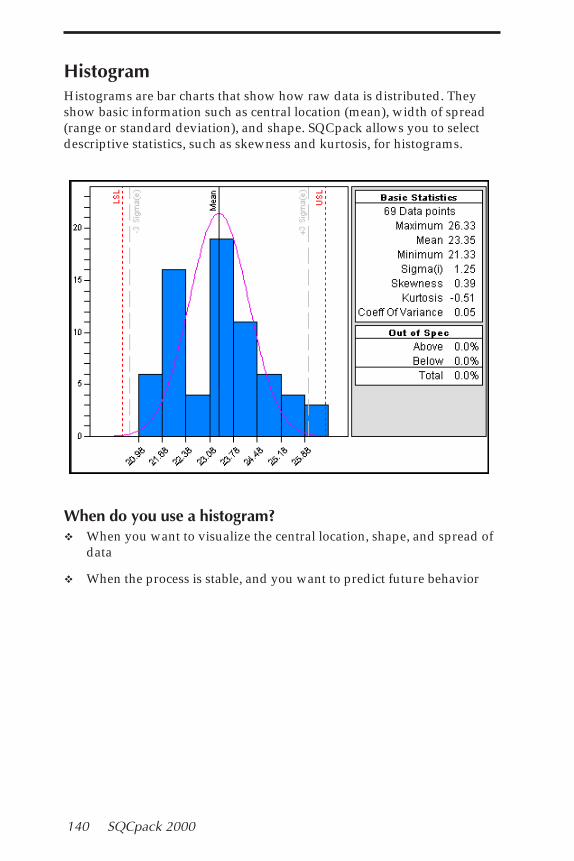
140 SQCpack 2000
HistogramHistograms are bar charts that show how raw data is distributed. Theyshow basic information such as central location (mean), width of spread(range or standard deviation), and shape. SQCpack allows you to selectdescriptive statistics, such as skewness and kurtosis, for histograms.
When do you use a histogram?� When you want to visualize the central location, shape, and spread of
data
� When the process is stable, and you want to predict future behavior
Section 7 Data and chart types 141
Capability AnalysisCapability analysis is a set of statistical calculations performed on a set ofdata in order to determine the capability of the system. The capability ofthe system refers to the ability of the system to perform with respect to itsspecification limits. A system is said to be capable if it is producing 100percent within specification limits.
SQCpack offers the following capability indices. Please refer to theQuality Advisor for a detailed description of each index and what youcan learn from it. You can also refer to Appendix A for the formulas.SQCpack capability indices include:
Cp Cpm Pp
Cpk Cpu Ppk
Cr Cpl Pr
When do you use capability analysis?� When the system is stable
� When the individual values of the variables data are normallydistributed. (If the system does not follow the normal distribution, youmay want to choose “assume the distribution is non-normal” whencreating a histogram in SQCpack.)
� When you want to know how the system performs in relation to thespecification limits
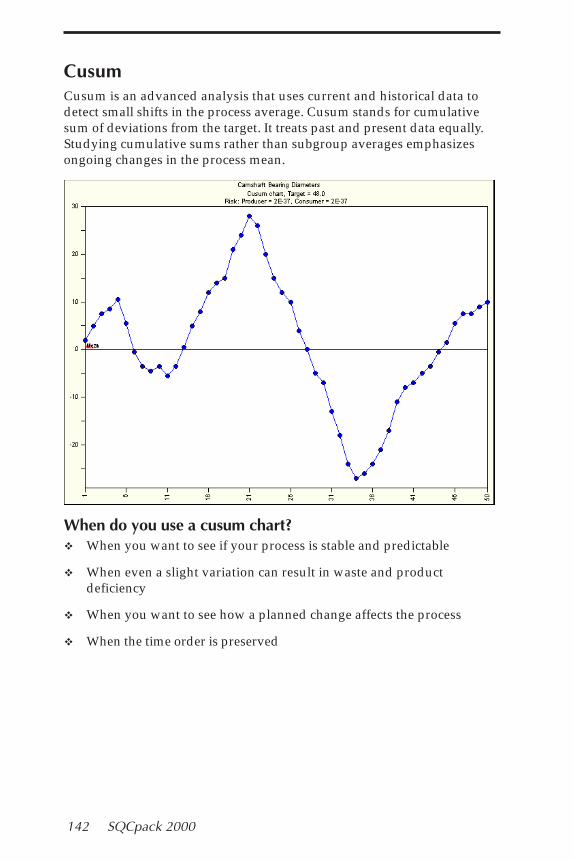
142 SQCpack 2000
CusumCusum is an advanced analysis that uses current and historical data todetect small shifts in the process average. Cusum stands for cumulativesum of deviations from the target. It treats past and present data equally.Studying cumulative sums rather than subgroup averages emphasizesongoing changes in the process mean.
When do you use a cusum chart?� When you want to see if your process is stable and predictable
� When even a slight variation can result in waste and productdeficiency
� When you want to see how a planned change affects the process
� When the time order is preserved
Section 7 Data and chart types 143
Attributes Data
What is attributes data?Attributes data is data that can be classified and counted. There are twotypes of attributes data: nonconformities and nonconforming.
Nonconformities data refers to defects or occurrences that should not bepresent but are. It also refers to any characteristics that should be presentbut are not. Dents, scratches, bubbles, and missing buttons are examplesof nonconformities.
Nonconforming data is a count of defective units. It is often described asgo/no go, pass/fail, or yes/no, since there are only two possible out-comes to any given check. It also refers to a count of defectives or rejects.For example, a light bulb either works or it does not. You can track eitherthe number failing or the number passing.
What charts are used to analyze attributes data?SQCpack offers two control charts for each type of attributes data. Fornonconforming units, these are p-charts and np-charts. Fornonconformities, these are u-charts and c-charts.
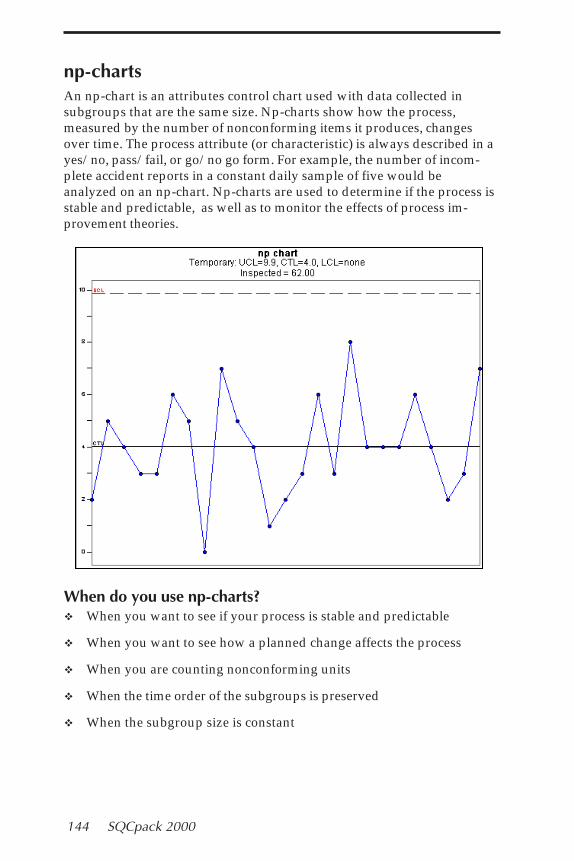
144 SQCpack 2000
np-chartsAn np-chart is an attributes control chart used with data collected insubgroups that are the same size. Np-charts show how the process,measured by the number of nonconforming items it produces, changesover time. The process attribute (or characteristic) is always described in ayes/no, pass/fail, or go/no go form. For example, the number of incom-plete accident reports in a constant daily sample of five would beanalyzed on an np-chart. Np-charts are used to determine if the process isstable and predictable, as well as to monitor the effects of process im-provement theories.
When do you use np-charts?� When you want to see if your process is stable and predictable
� When you want to see how a planned change affects the process
� When you are counting nonconforming units
� When the time order of the subgroups is preserved
� When the subgroup size is constant
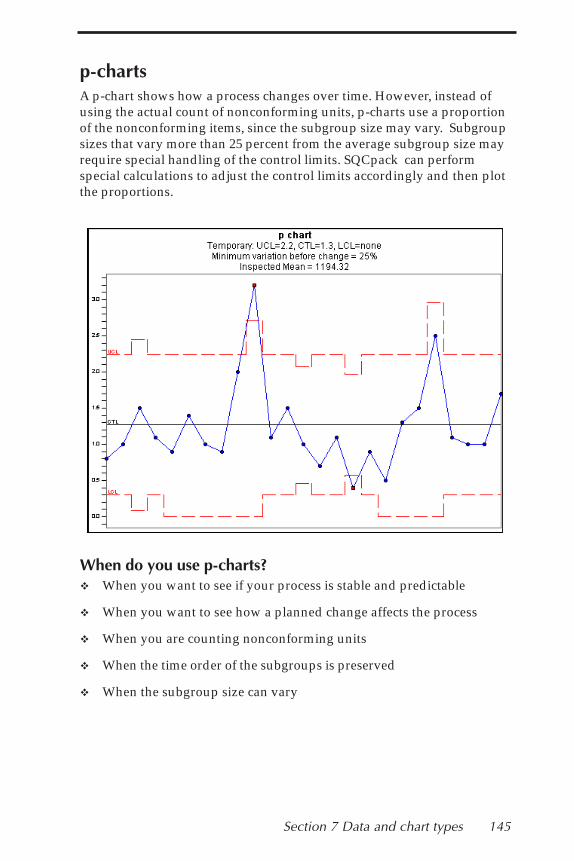
Section 7 Data and chart types 145
p-chartsA p-chart shows how a process changes over time. However, instead ofusing the actual count of nonconforming units, p-charts use a proportionof the nonconforming items, since the subgroup size may vary. Subgroupsizes that vary more than 25 percent from the average subgroup size mayrequire special handling of the control limits. SQCpack can performspecial calculations to adjust the control limits accordingly and then plotthe proportions.
When do you use p-charts?� When you want to see if your process is stable and predictable
� When you want to see how a planned change affects the process
� When you are counting nonconforming units
� When the time order of the subgroups is preserved
� When the subgroup size can vary
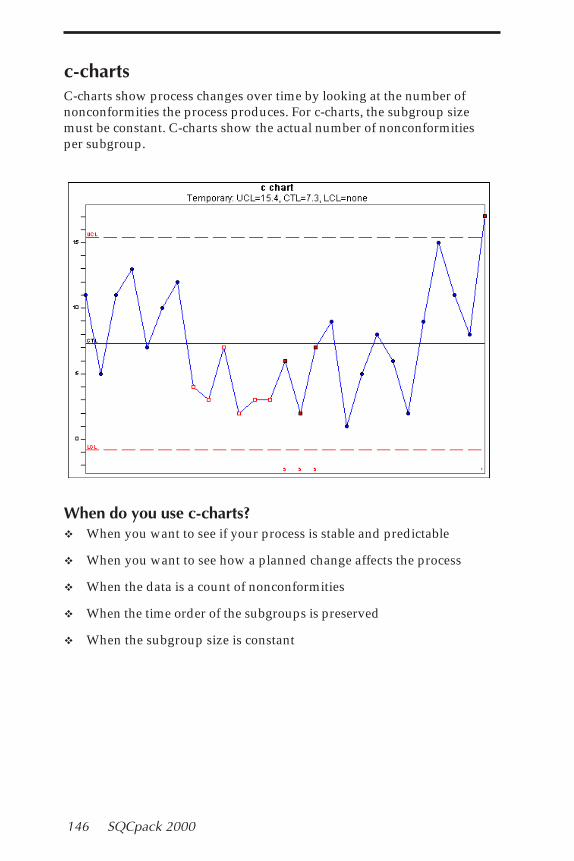
146 SQCpack 2000
c-chartsC-charts show process changes over time by looking at the number ofnonconformities the process produces. For c-charts, the subgroup sizemust be constant. C-charts show the actual number of nonconformitiesper subgroup.
When do you use c-charts?� When you want to see if your process is stable and predictable
� When you want to see how a planned change affects the process
� When the data is a count of nonconformities
� When the time order of the subgroups is preserved
� When the subgroup size is constant
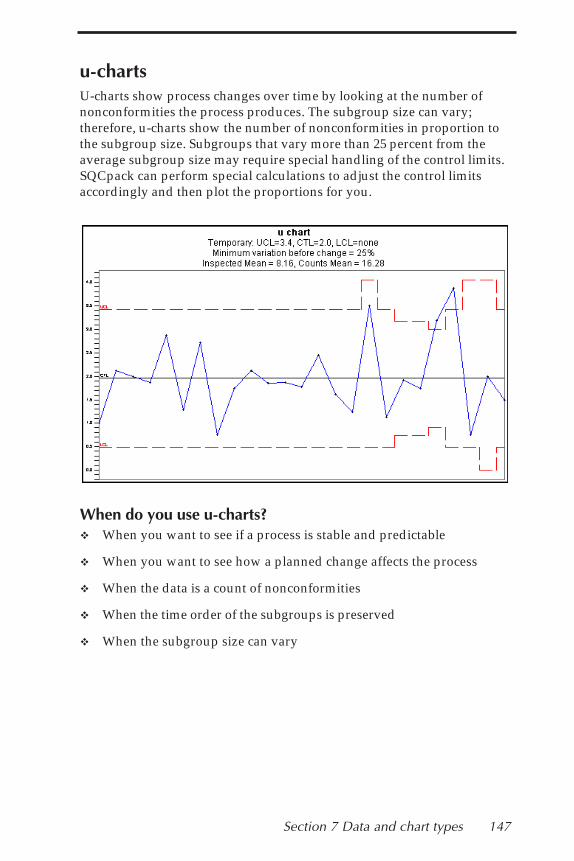
Section 7 Data and chart types 147
u-chartsU-charts show process changes over time by looking at the number ofnonconformities the process produces. The subgroup size can vary;therefore, u-charts show the number of nonconformities in proportion tothe subgroup size. Subgroups that vary more than 25 percent from theaverage subgroup size may require special handling of the control limits.SQCpack can perform special calculations to adjust the control limitsaccordingly and then plot the proportions for you.
When do you use u-charts?� When you want to see if a process is stable and predictable
� When you want to see how a planned change affects the process
� When the data is a count of nonconformities
� When the time order of the subgroups is preserved
� When the subgroup size can vary
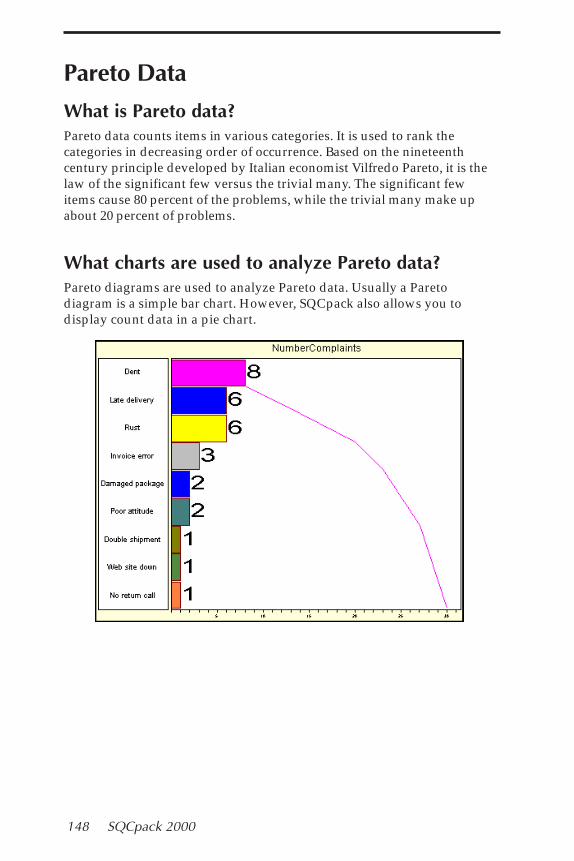
148 SQCpack 2000
Pareto Data
What is Pareto data?Pareto data counts items in various categories. It is used to rank thecategories in decreasing order of occurrence. Based on the nineteenthcentury principle developed by Italian economist Vilfredo Pareto, it is thelaw of the significant few versus the trivial many. The significant fewitems cause 80 percent of the problems, while the trivial many make upabout 20 percent of problems.
What charts are used to analyze Pareto data?Pareto diagrams are used to analyze Pareto data. Usually a Paretodiagram is a simple bar chart. However, SQCpack also allows you todisplay count data in a pie chart.
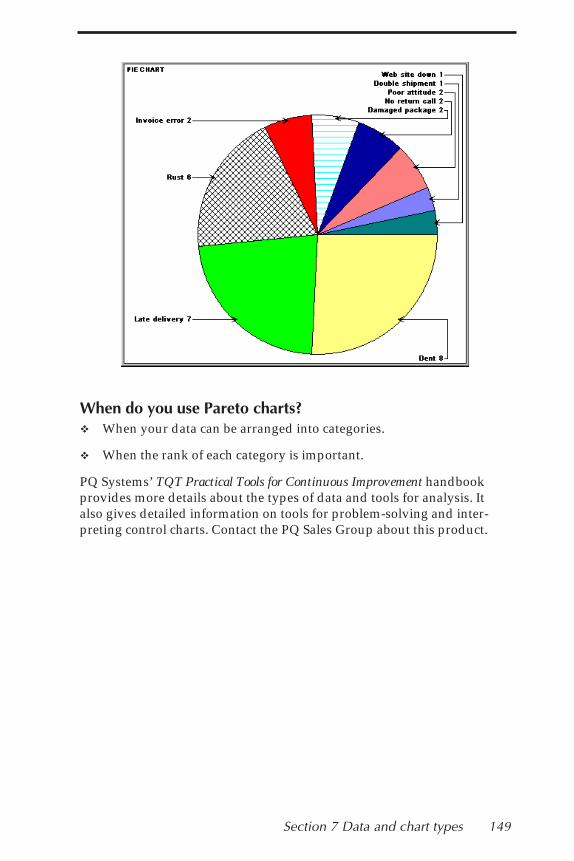
Section 7 Data and chart types 149
When do you use Pareto charts?� When your data can be arranged into categories.
� When the rank of each category is important.
PQ Systems’ TQT Practical Tools for Continuous Improvement handbookprovides more details about the types of data and tools for analysis. Italso gives detailed information on tools for problem-solving and inter-preting control charts. Contact the PQ Sales Group about this product.

150 SQCpack 2000