PPT Template - Invensysiom.invensys.com/EN/userGroupsPresentationsDallas2013/Wonderware… ·...
69
Slide 1
Transcript of PPT Template - Invensysiom.invensys.com/EN/userGroupsPresentationsDallas2013/Wonderware… ·...

Slide 1
WW TSS-02\03MS SQL Server ExtendedPerformance & Tuning
Pierluigi IodiceRegional Solution Support Engineer,Wonderware – Invensys SoftwareEmail: [email protected]
Javier AldanTechnical Account ManagerWonderware – Invensys SoftwareEmail: [email protected]
@InvensysOpsMgmt / #SoftwarerRevolution
/InvensysVideos
social.invensys.com
© 2013 Invensys. All Rights Reserved. The names, logos, and taglines identifying the products and services of Invensys are proprietary marks of Invensys or its subsidiaries.All third party trademarks and service marks are the proprietary marks of their respective owners.
Pierluigi IodiceRegional Solution Support Engineer,Wonderware – Invensys SoftwareEmail: [email protected]
Javier AldanTechnical Account ManagerWonderware – Invensys SoftwareEmail: [email protected]
/Wonderware
/company/Wonderware
Microsoft SQL Server• Wonderware Products has developed with
Microsoft Technologies
• All Microsoft development languages used are“Hand and Glove” with SQL Server
What we need to know about MS SQL Server?
Slide 3
What we need to know about MS SQL Server?
A. SQL Server within Wonderware DatabaseB. Database Maintenance, Troubleshooting
Tools & Diagnostic QueryC. Hands on Custom Project with SQL

Maintenance: The plan
One of the first tasks for a new DB is set up a maintenance plan:
• Understand how to have a backup
• Define a recovery strategy
• Truncate Log and Shrink DB
• Check DB fragmentation
• Keep the database clean
Slide 4
One of the first tasks for a new DB is set up a maintenance plan:
• Understand how to have a backup
• Define a recovery strategy
• Truncate Log and Shrink DB
• Check DB fragmentation
• Keep the database clean

Maintenance: The backup strategy
You could use the embedded SQL Server Maintenance:
Maintenance plans create a workflow of the tasksrequired to make sure that your database is optimized,regularly backed up, and free of inconsistencies.The Maintenance Plan Wizard also creates core maintenanceplans, but creating plans manually gives you much moreflexibility.
Slide 5
Maintenance plans create a workflow of the tasksrequired to make sure that your database is optimized,regularly backed up, and free of inconsistencies.The Maintenance Plan Wizard also creates core maintenanceplans, but creating plans manually gives you much moreflexibility.
Here all thetask you can
execute!

Maintenance: The backup strategyHere below an example of backup with SQL Server Maintenance:
Slide 6
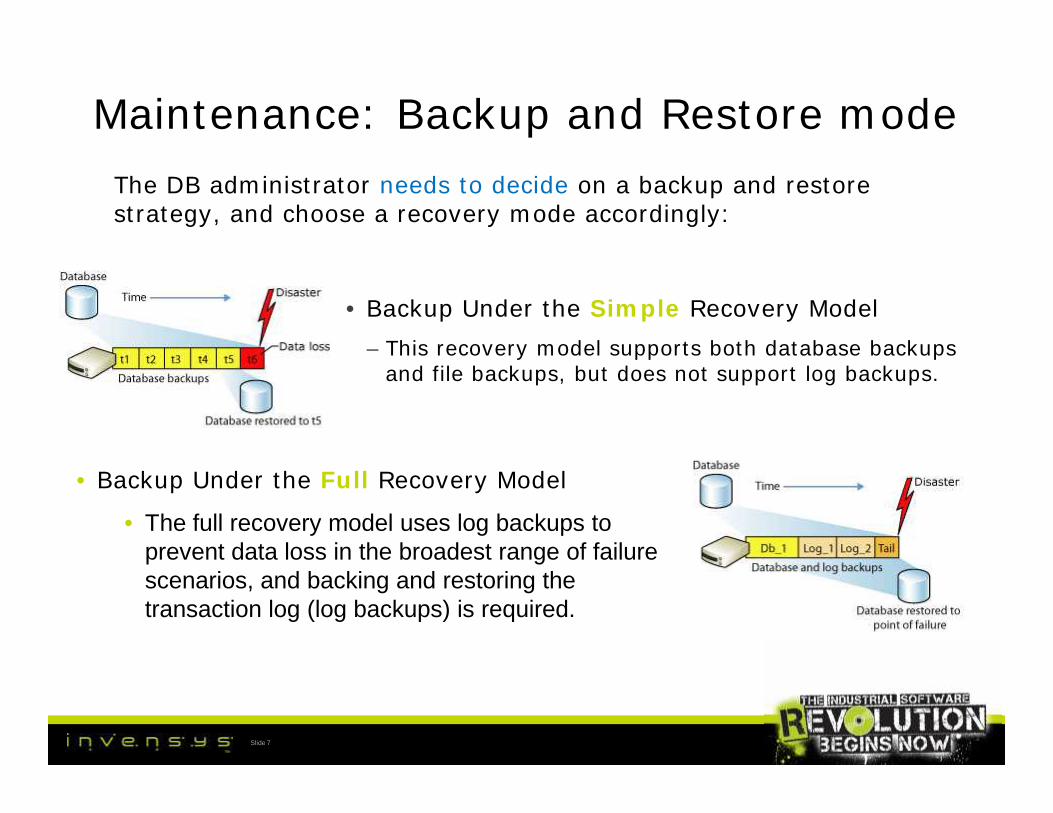
Maintenance: Backup and Restore mode
• Backup Under the Simple Recovery Model– This recovery model supports both database backups
and file backups, but does not support log backups.
The DB administrator needs to decide on a backup and restorestrategy, and choose a recovery mode accordingly:
Slide 7
• Backup Under the Full Recovery Model
• The full recovery model uses log backups toprevent data loss in the broadest range of failurescenarios, and backing and restoring thetransaction log (log backups) is required.

Maintenance: Impact of recovery model
All the databases can have his own recovery model:
If you have Full recovery model youcan take regular t-log backups sothat means the log file growth!!!
Slide 8
Each Sql Statement can create a log lines, The following are the major causesfor transaction log growth:• Uncommitted transactions• Rebuild/Create Index• Run extremely large transaction like Bulk Insert• Run Select INTO• More information about the causes on http://support.microsoft.com/kb/317375/

Maintenance: Transaction Log
You could define some rules for Transaction growth:
Slide 9
You can have a Log Shrink, but…Perform a regular t-log backup would be
better then run periodically theshrink command!

Maintenance: Transaction Log
One way to shrink immediately would be using the user interface:
Slide 10

Maintenance: Transaction Log
Shrinking the Database and Log by command would be helping inworse of cases:
• The size of the log files are physically reduced when:– A DBCC SHRINKDATABASE statement is executed.
– A DBCC SHRINKFILE statement referencing a log file is executed.
This an example oftruncate log andshrink database
using a littleSQL Script
Slide 11
More information onTN 599 or 837 onWDN Site

Maintenance: DB Fragmentation
• The amount of fragmentation can beanalyzed by using thesys.dm_db_index_physical_stats function.
• Fragmentation can be reduced by rebuildingand/or reorganizing indexes.
• The DB fill factor can help reducefragmentation.
• Physical disk fragmentation can also help.
Fragmentation occurs when data is modified in a table. When you insertor update data in a table (via INSERT or UPDATE), the table’scorresponding indexes are affected.
Slide 12
• The amount of fragmentation can beanalyzed by using thesys.dm_db_index_physical_stats function.
• Fragmentation can be reduced by rebuildingand/or reorganizing indexes.
• The DB fill factor can help reducefragmentation.
• Physical disk fragmentation can also help.

Maintenance: DB Fragmentation
TIP
•DBCCINDEXDEFRAG
•ALTER INDEX
REORGANIZE
•DBCCDBREINDEX
•ALTER INDEX
REBUILD
Slide 13
TIP
•DBCCINDEXDEFRAG
•ALTER INDEX
REORGANIZE
•DBCCDBREINDEX
•ALTER INDEX
REBUILD

Maintenance: clean Alarm DB
• The Alarm DB Purge and Archive utility can beused to reduce the amount of records in the DB.
• Use a known query to delete the duplicatesalarms periodically (fixed on ASP 2012)
• This DB is affected by a huge Fragmentation,then typically is not an issue, but could reducethe performance
Slide 14
• The Alarm DB Purge and Archive utility can beused to reduce the amount of records in the DB.
• Use a known query to delete the duplicatesalarms periodically (fixed on ASP 2012)
• This DB is affected by a huge Fragmentation,then typically is not an issue, but could reducethe performance

Maintenance: Galaxy Repository DB
Many of the GR DB maintenance tasks are wrapped by ArchestrAcomponents:
• Backup/Restore can be done from SMC, or from PowerShell script
• DB Scrubber utility
• Index reorganization, stats update, and SQL Server Log cleaningmust be setup by a DB admin.
• You can manually truncate the Change Log Table.
• You could execute some helpful stored procedure
Slide 15
Many of the GR DB maintenance tasks are wrapped by ArchestrAcomponents:
• Backup/Restore can be done from SMC, or from PowerShell script
• DB Scrubber utility
• Index reorganization, stats update, and SQL Server Log cleaningmust be setup by a DB admin.
• You can manually truncate the Change Log Table.
• You could execute some helpful stored procedure

Maintenance: Runtime DB• The Runtime DB size is not affected by the amount of history data.
Slide 16
• General settings let you purge event and summary data.
• You need to manually purge the change log (ModLogTracking).
• Avoid creating custom tables in the Runtime DB.
Maintenance: End! And now?
All the questions and doubts can be later treated in Hands On,
Slide 17

Troubleshooting and Diagnostic Tools
There are several tools that will allow you to:
1. Detect errors and exceptions
2. Monitor the SQL Server
3. Monitor the performance with counters
4. Log the SQL statements executed
5. Know system function / stored procedure
6. Understand SQL in ArchestrA Script
Slide 18
There are several tools that will allow you to:
1. Detect errors and exceptions
2. Monitor the SQL Server
3. Monitor the performance with counters
4. Log the SQL statements executed
5. Know system function / stored procedure
6. Understand SQL in ArchestrA Script

Detect errors: Logging Mechanisms
Useful logs to keep in mind:
• SQL Server Log• Export .log, .txt, .csv
• Filter condition
• Search
• Windows Event Viewer
Slide 19
• Windows Event Viewer

Monitor SQL: Activity Monitor
Use Activity Monitor to obtain information about SQLServer processes and how these processes affect thecurrent instance of SQL Server.
The first pane shows the following graphical displays of instanceinformation:
• % Processor Time: The percentage of elapsed time that theprocessor spends to execute non-idle threads for the instanceacross all CPUs.
• Waiting Tasks: The number of tasks that are waiting forprocessor, I/O, or memory resources.
• Database I/O: The transfer rate, in megabytes per second, ofdata from memory to disk, disk to memory, or disk to disk.
• Batch Requests/sec: The number of SQL Server batches thatare received by the instance.
Slide 20
The first pane shows the following graphical displays of instanceinformation:
• % Processor Time: The percentage of elapsed time that theprocessor spends to execute non-idle threads for the instanceacross all CPUs.
• Waiting Tasks: The number of tasks that are waiting forprocessor, I/O, or memory resources.
• Database I/O: The transfer rate, in megabytes per second, ofdata from memory to disk, disk to memory, or disk to disk.
• Batch Requests/sec: The number of SQL Server batches thatare received by the instance.

Monitor SQL: Activity Monitor
Processor Time %: What could be helpful to know
We can filter byWe can sort by
We can observe Session ID 66 is locked by Session ID 72
Slide 21
We can observe Session ID 66 is locked by Session ID 72
There was a transaction in progress that has notcommitted yet, and is still causing a table lock

Monitor SQL: Activity Monitor
Resource Wait: Nice to know all the operations that were consuming resources
Slide 22
Data file I/O: Nice to know all the Database files that were involved in R/W ops.

Monitor SQL: Activity Monitor
Recent Expensive Queries: Getting a look around
Slide 23
This would be useful to understand thecustomization, in order to improve
eventually

Performance Monitor
You cannot control what you don’t measure
Slide 24
• MS SQL Server exposes a set of performancecounters for virtually every subsystem
• These counters allow you to create aperformance baseline

Performance Monitor
Collects detailed information about theutilization of operating systemresources. SQL Server providesextensions to the Performance Monitortool to track a variety performancecounters.
• It allows you to track memory, disk,processor, and the networkperformance.
• Allows you to track both system-wideand SQL Server counters.
• Tracing can occur in real-time orcaptured as a log.
Slide 25
Collects detailed information about theutilization of operating systemresources. SQL Server providesextensions to the Performance Monitortool to track a variety performancecounters.
• It allows you to track memory, disk,processor, and the networkperformance.
• Allows you to track both system-wideand SQL Server counters.
• Tracing can occur in real-time orcaptured as a log.

Performance Monitor: SQL Pen
Object(Instance) Counter Description Target ValueSQLServer:AccessMethods
FreeSpace Scans/sec Rate of inserts into tableswith no indexes
No target. Should bemonitored over time.
SQLServer:AccessMethods
Full Scans/sec Rate of unrestricted fullscans on tables indexes
No target. Should bemonitored over time.
SQLServer:Latches Total Latch Wait Time Wait time before latchrequests are acquired
No target. Should bemonitored over time.
SQLServer:Locks Lock Timeouts/sec Amount of locks thattimeout and exit
Avg = 0
Slide 26
SQLServer:Locks Lock Timeouts/sec Amount of locks thattimeout and exit
Avg = 0
SQLServer:Locks Lock Wait Time Wait time before a lockcan be acquired
Avg < 10 ms
SQLServer:Locks Number ofDeadlocks/sec
Amount of deadlocks Avg = 0
SQLServer:GeneralStatistics
Processes Blocked Amount of processes thatare denied connection tothe DB
Avg = 0
SQLServer:GeneralStatistics
User Connections Total number of userconnections
No target. Should bemonitored over time.
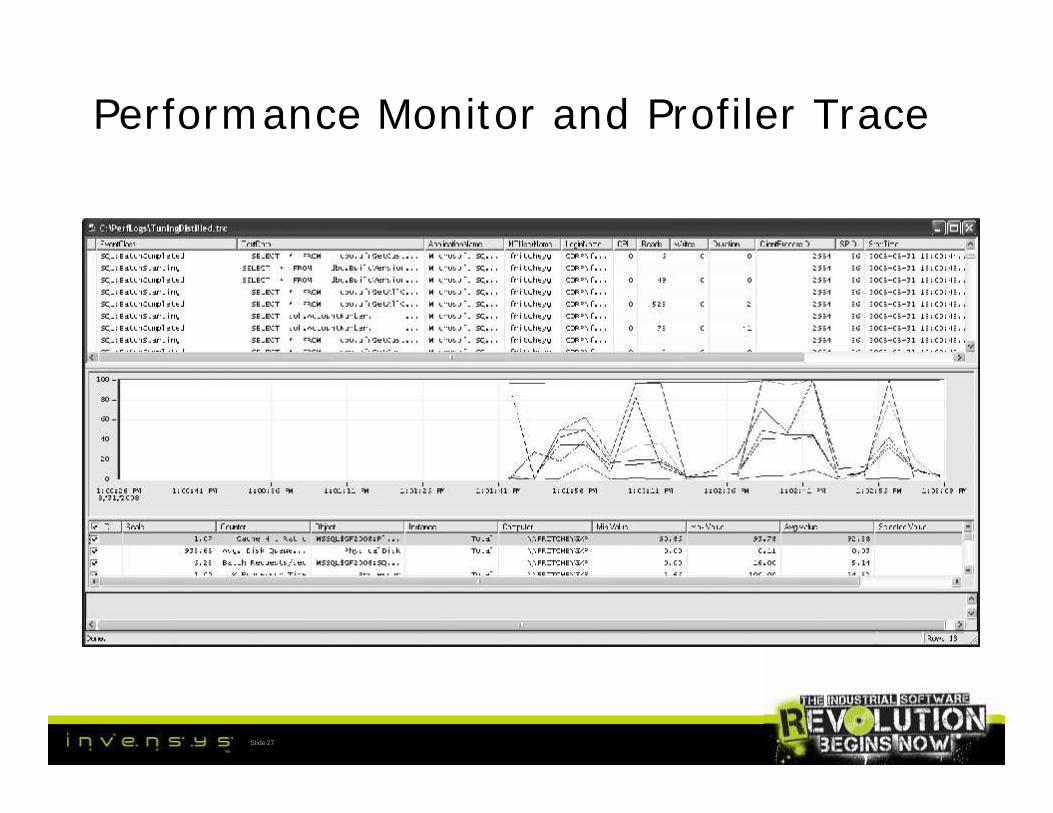
Performance Monitor and Profiler Trace
Slide 27

SQL Server Profiler
• Trace each query into SQL ServerDB
• Analyze performance and diagnoseproblems.
• Debug a T-SQL statements andStored Procedures.
• Replay SQL Server activity in asimulation.
• Combine with other debuginstruments
Is a rich interface to create and manage traces and analyze and replay trace results.
Slide 28
• Trace each query into SQL ServerDB
• Analyze performance and diagnoseproblems.
• Debug a T-SQL statements andStored Procedures.
• Replay SQL Server activity in asimulation.
• Combine with other debuginstruments

SQL Server Profiler: How to Run
General Setting• Trace Name• Trace Provider name• Trace Provider Type• Use template:
Standard TSQL TSQL Duration TSQL Lock And so on…
• Save to file {.trc, xml, …}• Save to table• Enable trace stop time
Slide 29
General Setting• Trace Name• Trace Provider name• Trace Provider Type• Use template:
Standard TSQL TSQL Duration TSQL Lock And so on…
• Save to file {.trc, xml, …}• Save to table• Enable trace stop time

SQL Server Profiler: How to Run
Slide 30

SQL Server Profiler: How to Run
Slide 31

SQL Server Profiler: How to Run
This would be a standard way to catch only the SQLquery and Stored procedure will be executed
Slide 32
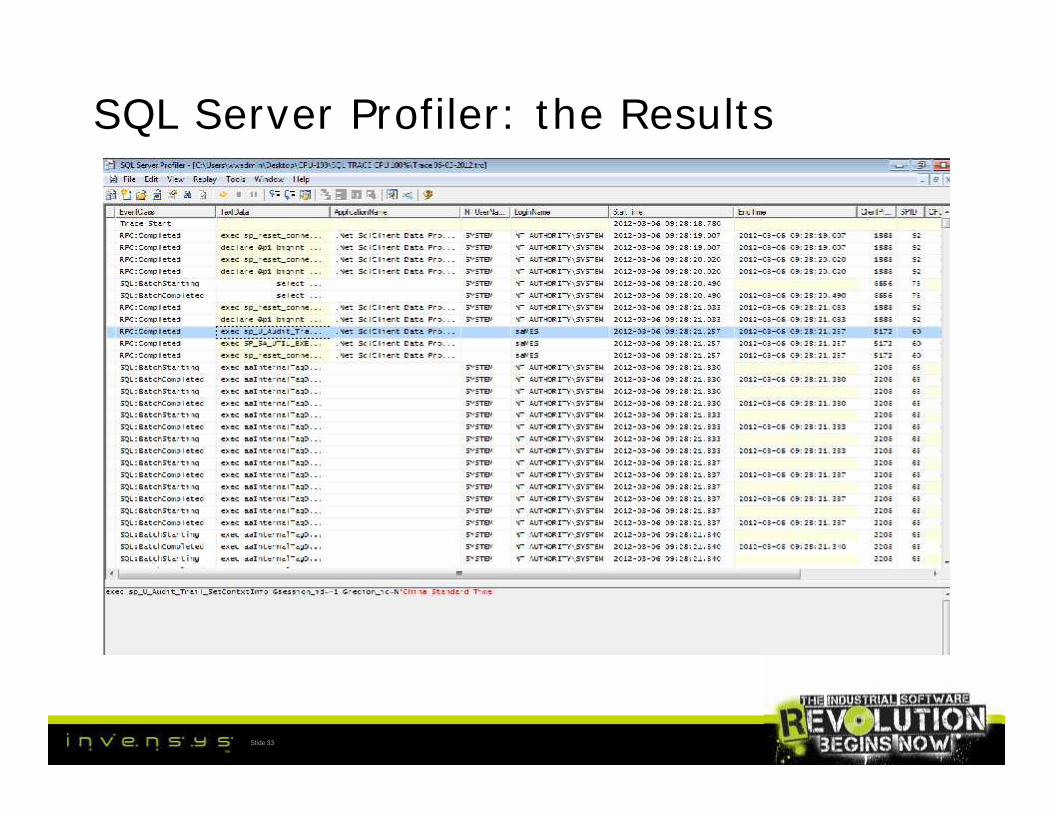
SQL Server Profiler: the Results
Slide 33

SQL Server Profiler: Debug and Execute
Slide 34

SQL Server Profiler: Lock Result
Slide 35

SQL Server Profiler: in Batch mode!
Run, Stop and Clear!And then…
This can be executed on demand…,on stored procedure…,on scheduled task!!!
You not need to be in front of theMonitor chasing the issues happening!!!
Slide 36
Once you have defined all the information need tobe collected, you can create a Batch Script!
All the Setting we haveearlier selected!
This can be executed on demand…,on stored procedure…,on scheduled task!!!
You not need to be in front of theMonitor chasing the issues happening!!!

SQL Server Profiler: wall of text
In this manner is very difficultanalyze the data flow!
And retrieving the issue stuck pointcan be requiring more and more
time, and we risk to have amisunderstanding!
Slide 37
In this manner is very difficultanalyze the data flow!
And retrieving the issue stuck pointcan be requiring more and more
time, and we risk to have amisunderstanding!

SQL Server Profiler: External free toolQURE Workload Analyzer
Slide 38

SQL Server: PID and SPID
Client Process ID reportexactly the PID of TaskManager or ProcessExplorer.
It has used to identifythe Application that stillrunning something intoSQL Server Database
A SPID in SQL Server is a ServerProcess ID. These process ID’sare essentially sessions in SQLServer.
Every time an applicationconnects to SQL Server, a newSPID is created.
This connection has a definedscope and memory space andcannot interact with other SPIDs.
The term SPID is synonymouswith Connection, or Session.
Slide 39
Client Process ID reportexactly the PID of TaskManager or ProcessExplorer.
It has used to identifythe Application that stillrunning something intoSQL Server Database
A SPID in SQL Server is a ServerProcess ID. These process ID’sare essentially sessions in SQLServer.
Every time an applicationconnects to SQL Server, a newSPID is created.
This connection has a definedscope and memory space andcannot interact with other SPIDs.
The term SPID is synonymouswith Connection, or Session.

Diagnostic Query: From SPID to SQL
TIP
Get LastRunningQuery Basedon SPID
Slide 40
TIP
Get LastRunningQuery Basedon SPID
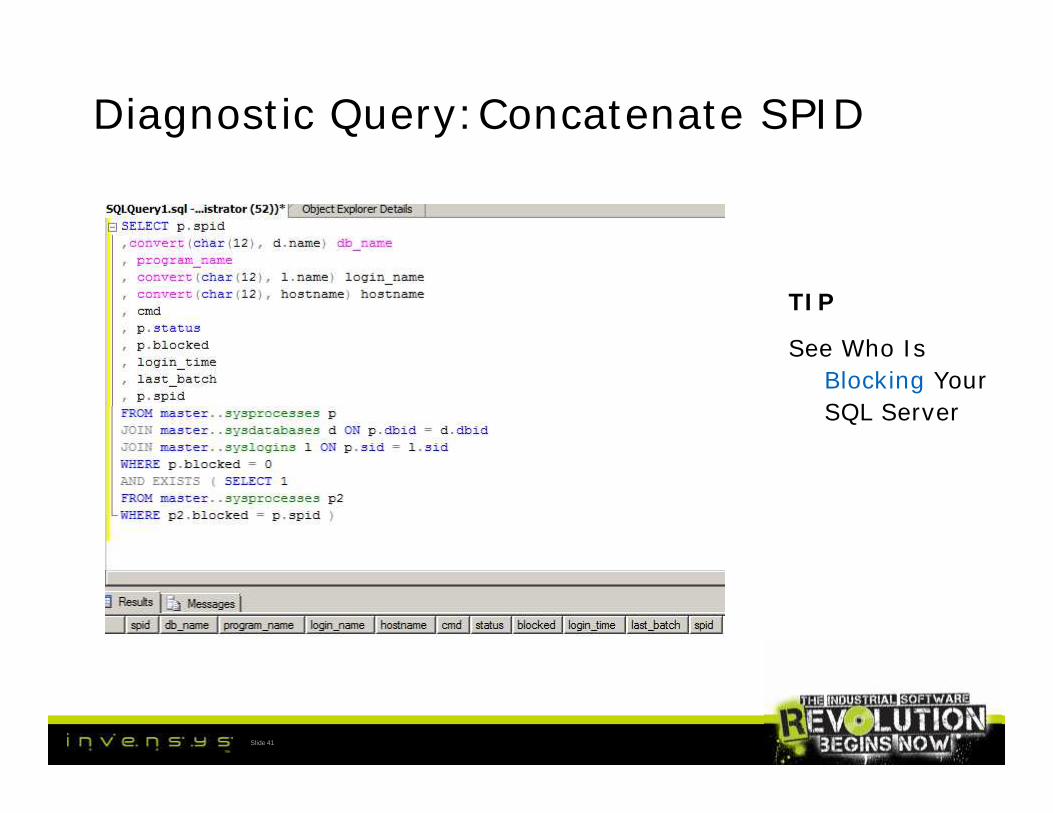
Diagnostic Query:Concatenate SPID
TIP
See Who IsBlocking YourSQL Server
Slide 41
TIP
See Who IsBlocking YourSQL Server
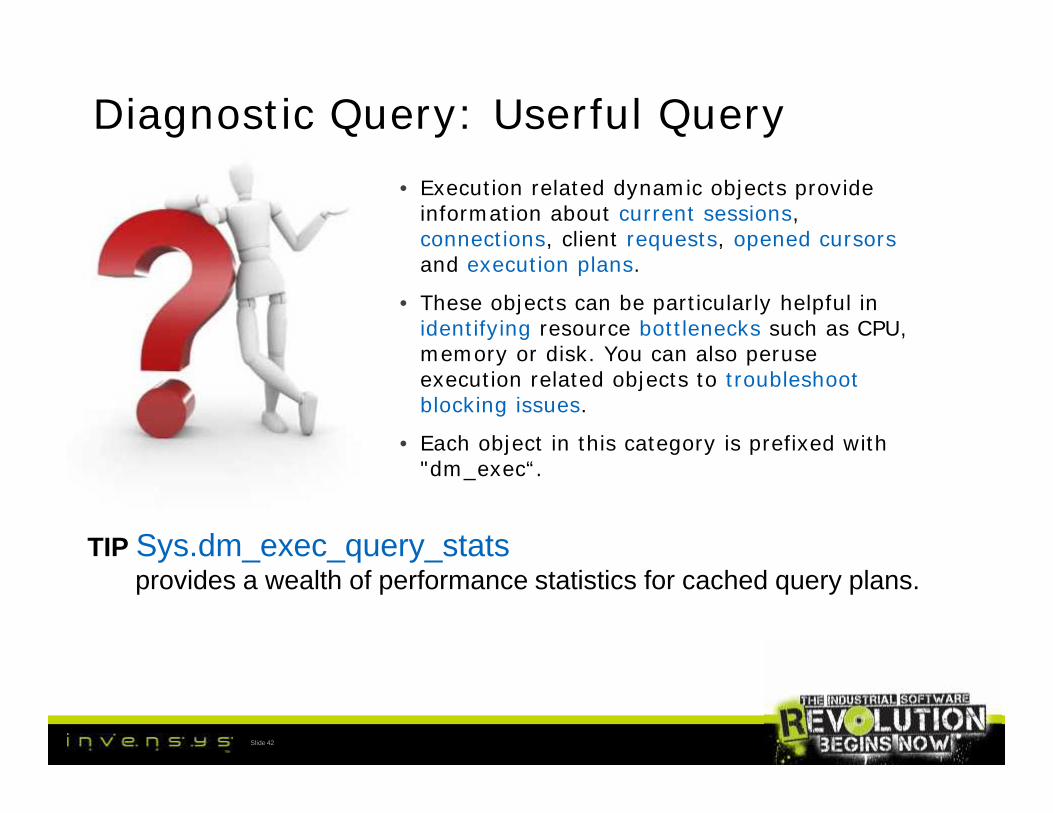
Diagnostic Query: Userful Query• Execution related dynamic objects provide
information about current sessions,connections, client requests, opened cursorsand execution plans.
• These objects can be particularly helpful inidentifying resource bottlenecks such as CPU,memory or disk. You can also peruseexecution related objects to troubleshootblocking issues.
• Each object in this category is prefixed with"dm_exec“.
Slide 42
• Execution related dynamic objects provideinformation about current sessions,connections, client requests, opened cursorsand execution plans.
• These objects can be particularly helpful inidentifying resource bottlenecks such as CPU,memory or disk. You can also peruseexecution related objects to troubleshootblocking issues.
• Each object in this category is prefixed with"dm_exec“.
TIP Sys.dm_exec_query_statsprovides a wealth of performance statistics for cached query plans.

Diagnostic Query: ...on CPU
TIPTop 10 mostCPU intensiveSQLStatements
Slide 43
TIPTop 10 mostCPU intensiveSQLStatements

Diagnostic Query: ...by frequency
TIPTop 10 StoredProceduresordered by thefrequency oftheir execution
Slide 44
TIPTop 10 StoredProceduresordered by thefrequency oftheir execution

Diagnostic Query: ...by recompile
TIPmost frequentlyre-compiledstatements
Slide 45
TIPmost frequentlyre-compiledstatements

Diagnostic Query: ...by I/O
TIPThe most I/Ointensivequeries:
Slide 46
TIPThe most I/Ointensivequeries:
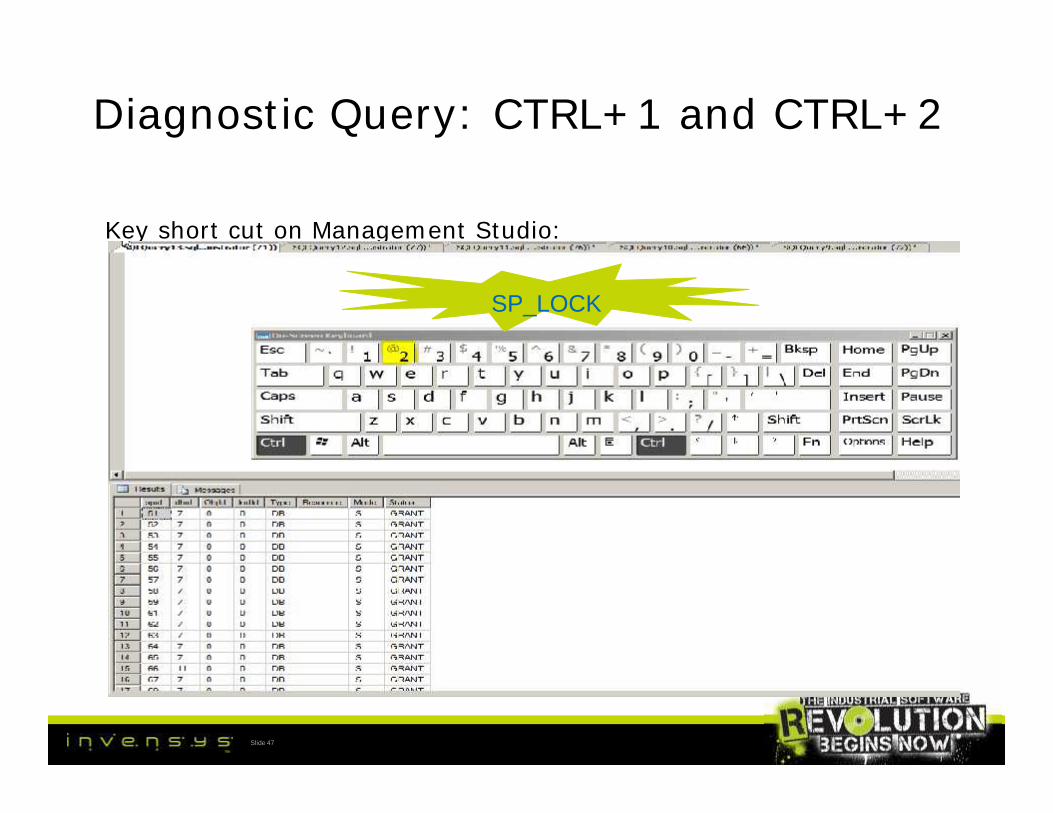
Diagnostic Query: CTRL+1 and CTRL+2
Key short cut on Management Studio:
• sp_who: CTRL+1• Provides information about current Microsoft® SQL Server™ usersand processes.
• The information returned can be filtered to return only thoseprocesses that are not idle.
• sp_lock: CTRL+2
• Reports information about locks.
SP_WHOSP_LOCK
Slide 47
Key short cut on Management Studio:
• sp_who: CTRL+1• Provides information about current Microsoft® SQL Server™ usersand processes.
• The information returned can be filtered to return only thoseprocesses that are not idle.
• sp_lock: CTRL+2
• Reports information about locks.

Tips: about SQL Server Customization
Nice To Know!!!Nice To Know!!!
Slide 48
Last part will be treating sometopics that could help out us with
software customization.

Tips: SQL Server CLR Integration
The Common Language Runtime (CLR) is the heart of the Microsoft.NET Framework and provides the execution environment for all.NET Framework code.
With the CLR hosted in Microsoft SQL Server (called CLR integration),you can create stored procedures, triggers, user-defined functions,user-defined types, and user-defined aggregates in managed code.
Because managed code compiles to native code prior to execution, youcan achieve significant performance increases in some scenarios.
How to Enable CLR on SQL server:
Slide 49
The Common Language Runtime (CLR) is the heart of the Microsoft.NET Framework and provides the execution environment for all.NET Framework code.
With the CLR hosted in Microsoft SQL Server (called CLR integration),you can create stored procedures, triggers, user-defined functions,user-defined types, and user-defined aggregates in managed code.
Because managed code compiles to native code prior to execution, youcan achieve significant performance increases in some scenarios.
How to Enable CLR on SQL server:
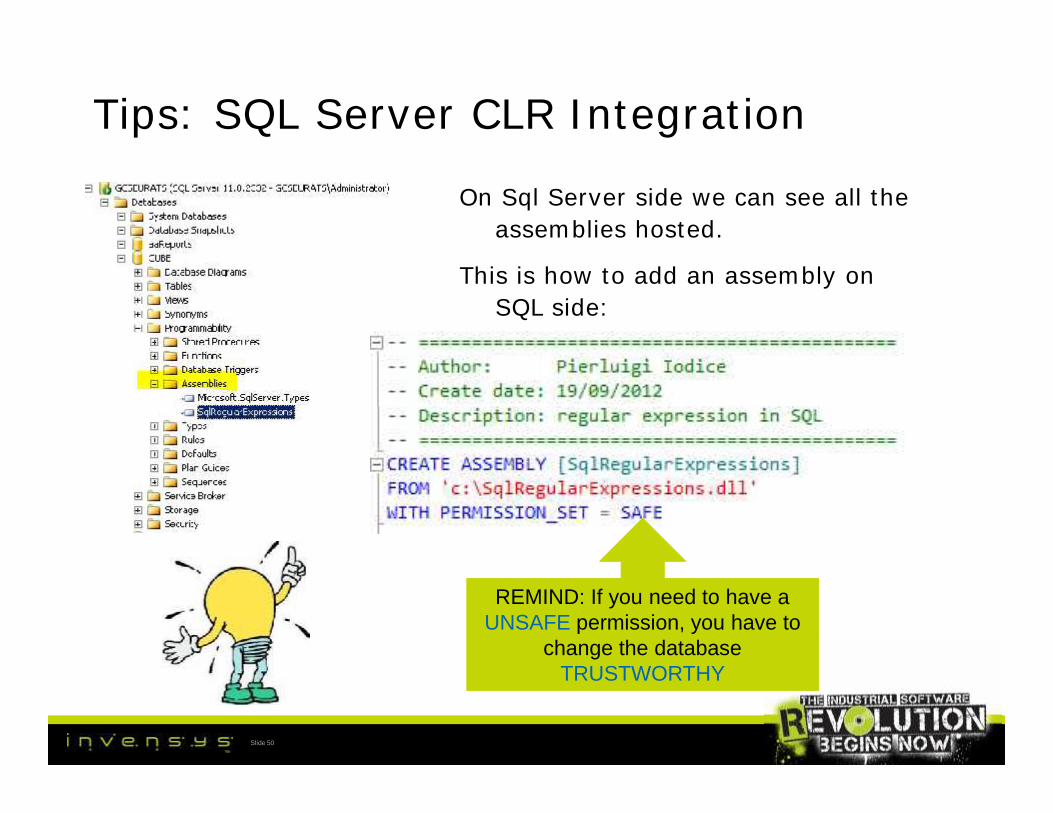
Tips: SQL Server CLR Integration
On Sql Server side we can see all theassemblies hosted.
This is how to add an assembly onSQL side:
Slide 50
REMIND: If you need to have aUNSAFE permission, you have to
change the databaseTRUSTWORTHY
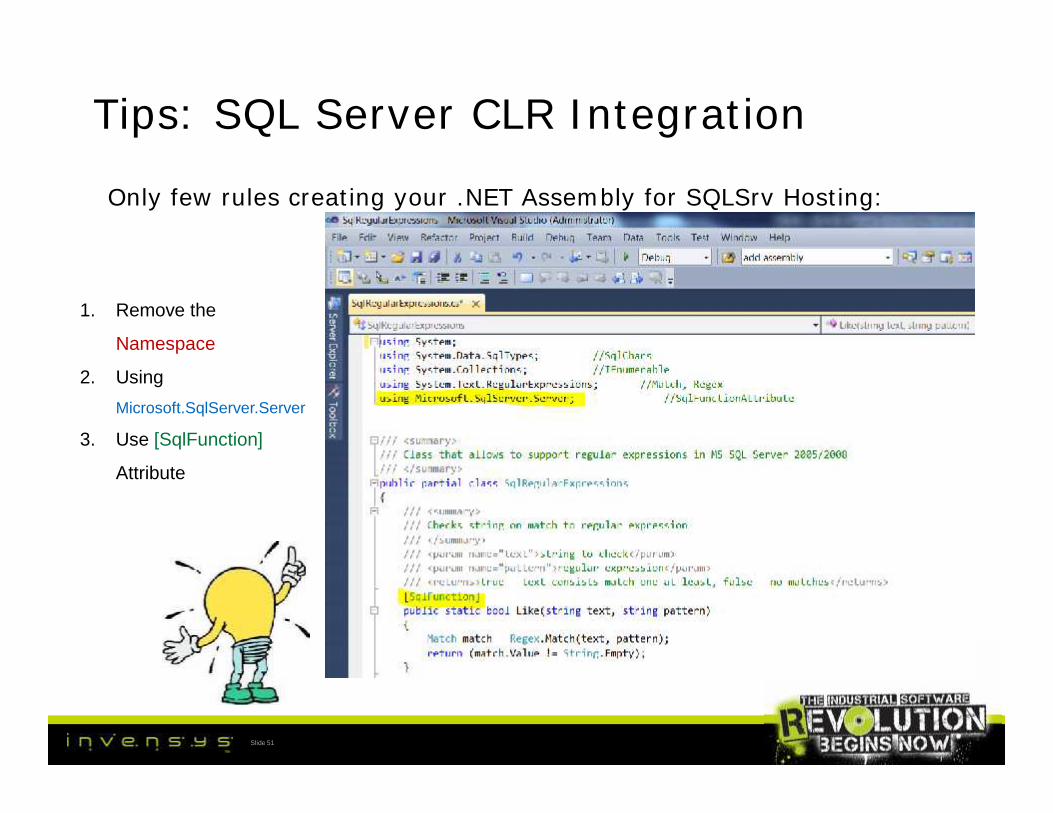
Tips: SQL Server CLR Integration
Only few rules creating your .NET Assembly for SQLSrv Hosting:
1. Remove the
Namespace
2. UsingMicrosoft.SqlServer.Server
3. Use [SqlFunction]
Attribute
Slide 51
1. Remove the
Namespace
2. UsingMicrosoft.SqlServer.Server
3. Use [SqlFunction]
Attribute

Tips: SQL Server CLR Integration
Mind to create the Function on SQL side:
Slide 52
The name of SQL Function parametersneed to match Exactly with
name of Net Function parameters!!!

Tips: SQL Server CLR Integration
HOW
it
WORKS
Slide 53
HOW
it
WORKS
This would be a simple regular expression, but canwork also with something of strongest!!!i.e. email RegExp: ^[a-z._-]+\@[a-z._-]+\.[a-z]{2,4}$
Tips: Optimizing your customization
Everything can be improved!
Next few slide will show you how to write
a performing query, what to use,
what would best to avoid, the means
of some SQL clause, …
Slide 54
Everything can be improved!
Next few slide will show you how to write
a performing query, what to use,
what would best to avoid, the means
of some SQL clause, …

Tips: Optimize SQL QueriesWhen Identified Long-Running Query:
– Put it on SQLS Management Studio and start to analyze the cause of slowness:
1. Using SET statements: SHOWPLAN_ALL, STATISTIC IO/TIME/PROFILE ON
2. Using SQL Query Analyzer options
Slide 55

Tips: Optimize SQL Queries• Analyzing the Results:
• Physical Operation: Avoid Table Scan
• Estimated cost: I/O vs CPU intensive
• Estimated Number of Execution Avoidno needed loops
• Estimate Row Size: Avoid Large size
Slide 56
Fastest query improve your application
• Analyzing the Results:
• Physical Operation: Avoid Table Scan
• Estimated cost: I/O vs CPU intensive
• Estimated Number of Execution Avoidno needed loops
• Estimate Row Size: Avoid Large size

Tips: Writing SQL Queries
• How to write an efficient query:– Write correctly formed queries, using correct ON clause and avoid DISINCT
– Return only the rows and columns needed, avoid * and use TOP x
– Avoid expensive operators such as NOT LIKE.
– Avoid explicit or implicit functions in WHERE clauses.
– Use stored procedures or parameterized queries.
– Minimize cursor use.
– Avoid long actions in triggers, or best, Avoid Trigger!
– Use temporary tables and table variables appropriately.
– Limit query and index hints use.
– Use SET NO COUNT ON
– NOT/IN vs NOT/EXIST especially with null value matching
– Use with (nolock/readpast) to have a dirty read
Slide 57
• How to write an efficient query:– Write correctly formed queries, using correct ON clause and avoid DISINCT
– Return only the rows and columns needed, avoid * and use TOP x
– Avoid expensive operators such as NOT LIKE.
– Avoid explicit or implicit functions in WHERE clauses.
– Use stored procedures or parameterized queries.
– Minimize cursor use.
– Avoid long actions in triggers, or best, Avoid Trigger!
– Use temporary tables and table variables appropriately.
– Limit query and index hints use.
– Use SET NO COUNT ON
– NOT/IN vs NOT/EXIST especially with null value matching
– Use with (nolock/readpast) to have a dirty read

Tips: Writing SQL Queries
Next video will show the difference writing a performing query.
Slide 58
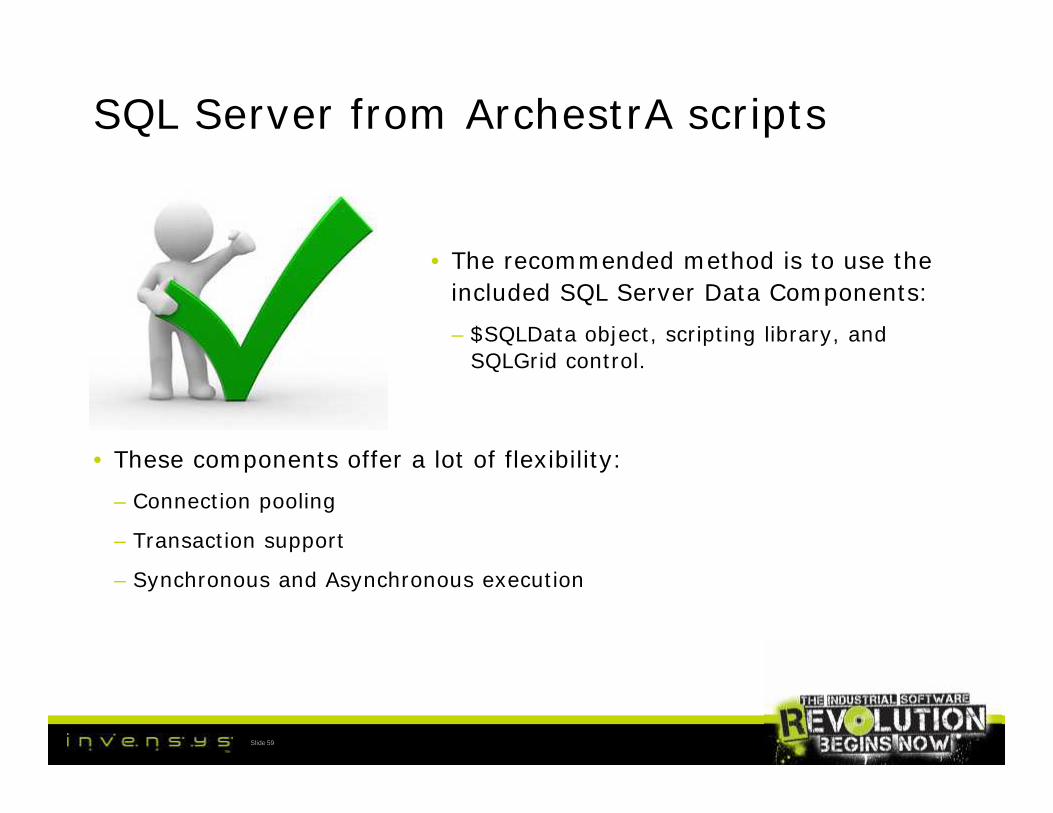
SQL Server from ArchestrA scripts
• The recommended method is to use theincluded SQL Server Data Components:
– $SQLData object, scripting library, andSQLGrid control.
Slide 59
• These components offer a lot of flexibility:
– Connection pooling
– Transaction support
– Synchronous and Asynchronous execution
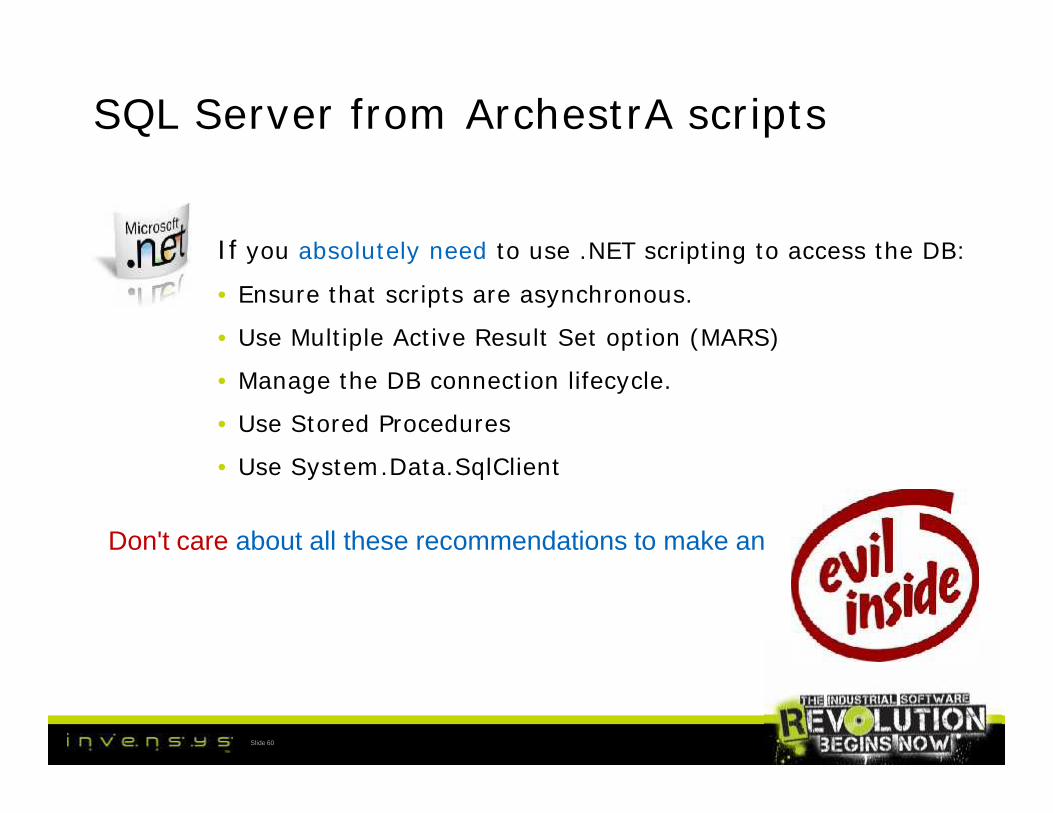
SQL Server from ArchestrA scripts
If you absolutely need to use .NET scripting to access the DB:
• Ensure that scripts are asynchronous.
• Use Multiple Active Result Set option (MARS)
• Manage the DB connection lifecycle.
• Use Stored Procedures
• Use System.Data.SqlClient
Slide 60
If you absolutely need to use .NET scripting to access the DB:
• Ensure that scripts are asynchronous.
• Use Multiple Active Result Set option (MARS)
• Manage the DB connection lifecycle.
• Use Stored Procedures
• Use System.Data.SqlClient
Don't care about all these recommendations to make an
Question/ feedbacks/ request
Slide 61

Hands on Time! Custom SQL Project
Project: Replicate the Historian tag on Performance Monitor
Knowledge: .NET, SQL, and Performance Monitor Tools
Slide 62
Hands on Time! Summary
Project: Replicate the Historian tag on Performance Monitor
Step 1: Creating .NET Function
Step 2: Creating SQL Function
Step 3: Creating SQL Job scheduled each minute
Step 4: Observing the results on Process Monitor
Slide 63
Project: Replicate the Historian tag on Performance Monitor
Step 1: Creating .NET Function
Step 2: Creating SQL Function
Step 3: Creating SQL Job scheduled each minute
Step 4: Observing the results on Process Monitor

Hands on Time! Create .NET Function
Slide 64

Hands on Time! Create SQL Function
Slide 65
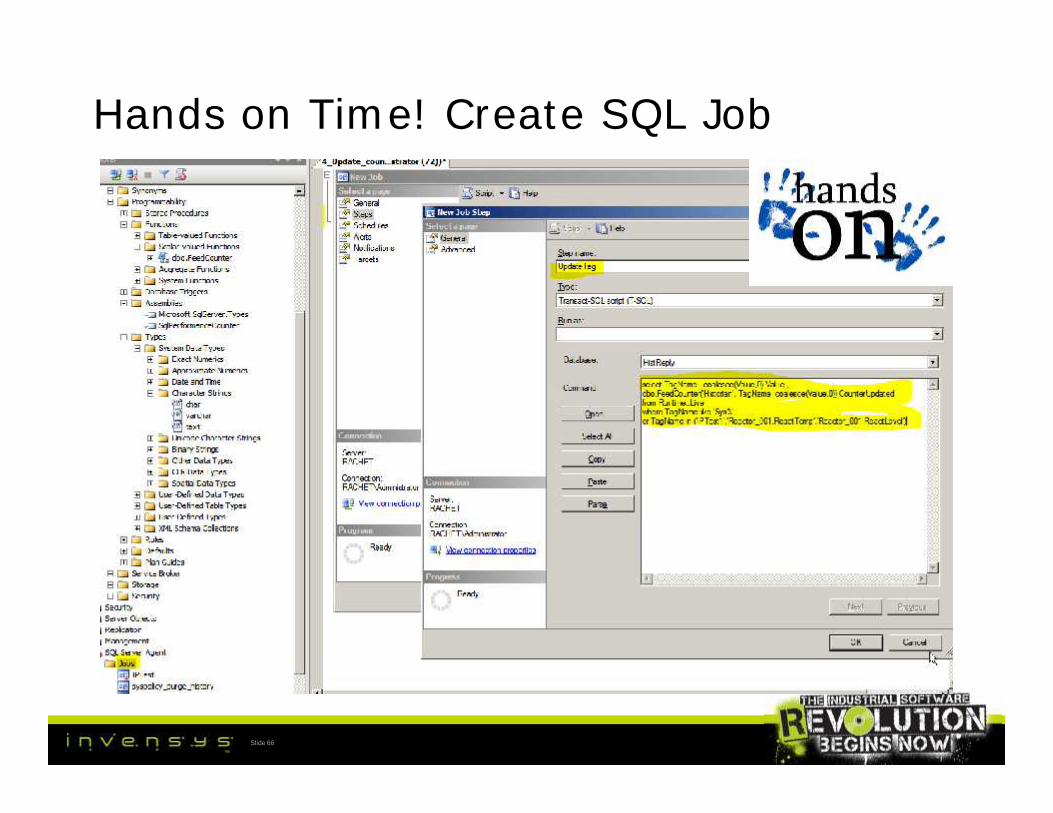
Hands on Time! Create SQL Job
Slide 66
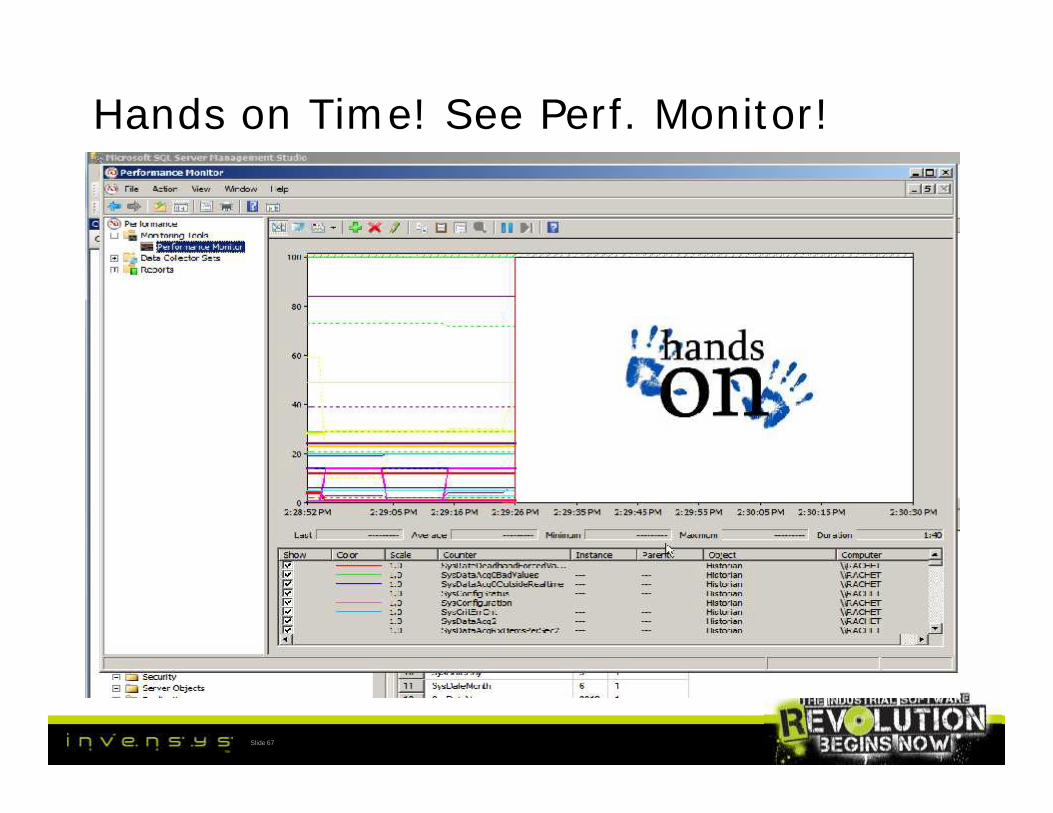
Hands on Time! See Perf. Monitor!
Slide 67

Question/ feedbacks/ request
Slide 68
Thanks !!!

Slide 69