1 The Parabolic Variance (PVAR), a Wavelet Variance Based ...

PPrriivvaattee HHoommee RReennttaallss
Visitor Survey Results and Economic Impact Analysis
2013
Prepared for
Alliance for Neighborhood Prosperity
by
July 2014
Visitor Profile and Economic Impact Analysis Private Home Rentals - 2013
Acknowledgments This report was prepared by Maria J. Ortiz, Project Manager in the Hospitality Research Center
(HRC) at the University of New Orleans (UNO). Special recognition is given to Marius M. Mihai,
Research Analyst, and Stefanie J. Perez, Graduate Research Assistant, for their assistance in
preparing this report. Further thanks also go Karen Brakel, Project and Budget Coordinator, for
her valuable support.
Special thanks also go to Polly Hardie and her team at Alliance for Neighborhood Prosperity
(ANP) for their ongoing assistance and support throughout this study.
Visitor Profile and Economic Impact Analysis Private Home Rentals - 2013
Table of Contents
Executive Summary ............................................................................................................... 1
Introduction .......................................................................................................................... 5
Methodology ......................................................................................................................... 5
Visitor Profile ........................................................................................................................ 7
Residency Questions ........................................................................................................... 7
Stay-Specific Questions ..................................................................................................... 10
Activity/Satisfaction Questions ......................................................................................... 20
Demographic Questions .................................................................................................... 24
Importance/Performance Indicators ................................................................................ 28
Economic Impact ................................................................................................................. 30
Introduction ....................................................................................................................... 30
Direct and Secondary Spending ........................................................................................ 30
Earnings ............................................................................................................................ 32
Employment ...................................................................................................................... 32
Tax Revenues..................................................................................................................... 32
Appendix A: Activities Participated in While Visiting the New Orleans Area ......................... 36
Appendix B: Definitions of Key Terms .................................................................................. 41

Visitor Profile and Economic Impact Analysis Private Home Rentals - 2013
List of Tables
Table 1: International Respondents ................................................................................................... 7
Table 2: Country of Residence of International Respondents ........................................................... 7
Table 3: U.S. City of Entrance for International Respondents ........................................................... 8
Table 4: State of Residence of Domestic Visitors .............................................................................. 9
Table 5: First Visit to New Orleans ................................................................................................... 10
Table 6: Number of Nights in New Orleans ..................................................................................... 11
Table 7: Nightly Rate ........................................................................................................................ 11
Table 8: Number of People per Accommodation ............................................................................ 11
Table 9: Travel Party Size ................................................................................................................. 12
Table 10: Number of Adults per Travel Party .................................................................................. 12
Table 11: Visitors with Children in Their Travel Party ..................................................................... 12
Table 12: Number of Children per Travel Party ............................................................................... 13
Table 13: New Orleans Morial Convention Center Visitation ......................................................... 15
Table 14: Visitors Who Extended Their Trip for Pleasure ................................................................ 15
Table 15: Number of Nights Trips Were Extended for Pleasure ..................................................... 16
Table 16: Number of Nights in New Orleans Before or After a Cruise ............................................ 16
Table 17: Average Individual Visitor Trip Expenditures ................................................................... 17
Table 18: Likelihood to Recommend New Orleans as Destination ................................................. 20
Table 19: Respondents With Children in Their Households ............................................................ 24
Table 20: Retired Respondents ........................................................................................................ 25
Table 21: Respondents Who Are Students ...................................................................................... 25
Table 22: Important/Performance Indicators Variance .................................................................. 28
Table 23: Average Individual Visitor Trip Expenditures ................................................................... 30
Table 24: Estimated Total Private Home Rentals Visitor Expenditures ........................................... 31
Table 25: State Tax Revenue ............................................................................................................ 33
Table 26: Local Tax Revenue ............................................................................................................ 34
Visitor Profile and Economic Impact Analysis Private Home Rentals - 2013
List of Figures Figure 1: Month of Visit ................................................................................................................... 10
Figure 2: Primary Purpose of Visit ................................................................................................... 13
Figure 3: Primary Purpose of Visit (Expanded) ................................................................................ 14
Figure 4: Primary Method of Travel to New Orleans ....................................................................... 18
Figure 5: Primary Source of Information ......................................................................................... 19
Figure 6: Activities Participated in While Visiting the New Orleans Area (All Visitors) ................... 21
Figure 7: Activities Participated in While in New Orleans (With vs. Without Children) .................. 22
Figure 8: Activities Participated in While in New Orleans (First Time vs. Repeat Visitor) ............... 23
Figure 9: Marital Status of Respondents ......................................................................................... 24
Figure 10: Age of Respondents ........................................................................................................ 26
Figure 11: Household Annual Income of Respondents ................................................................... 27
Figure 12: Importance/Performance Indicators .............................................................................. 29
Figure 13: Total Visitor Spending ..................................................................................................... 31

Visitor Profile and Economic Impact Analysis Private Home Rentals - 2013
1
Executive Summary
Residency Questions
International visitors accounted for 18.0% of the total number of respondents who stayed in private home rentals.
The majority of international respondents came from Canada (53.4%), followed by Australia (15.9%) and the United Kingdom (10.2%).
International respondents entered the United States mostly through New Orleans (16.7%), followed by Houston (14.4%). Atlanta, Los Angeles and New York were also mentioned as cities of entrance by 8.9% of the respondents.
Domestic visitation was originated mostly from Texas (12.3%), California (10.7%), and Louisiana, outside the metropolitan area (5.6%).
Stay-Specific Questions
During 2013, visitors who chose to rent a private home came to New Orleans mostly in April (18.1%), February (13.5%) and October (12.3%).
About half (51.4%) of respondents reported that this was their first visit to New Orleans.
Overnight visitors to New Orleans who stayed in a private home rental spent an average of 5 nights in the area.
In 2013, the average nightly rate reported by visitors was $168, while the median was $141.
The average number of people who stayed in home rentals was 3.9, while the median was 3.0.
Visitors had an average travel party size of 3.8 people.
The average number of adults per party was 3.5, while the median was 3.0.
About 12% of all visitor parties had children under 18 accompanying them on their trip to New Orleans.
The average number of children per party was about 2, while the median was one child.
Nearly all (97.2%) visitors surveyed were in the New Orleans area for vacation or pleasure purposes.

Visitor Profile and Economic Impact Analysis Private Home Rentals - 2013
2
Less than half (40.0%) of business and convention visitors who stayed in private home rentals reported attending activities at the New Orleans Morial Convention Center.
About 80% of business and convention visitors extended their stay in the New Orleans area for pleasure.
Private home rental visitors who came for business or convention purposes and extended their stay for pleasure spent an average of 3.8 additional nights in the New Orleans area.
Cruise visitors comprised about 1.3% of the total number of visitor responses. These visitors stayed in the New Orleans area for an average of 4.6 nights before or after their cruise.
Visitors to the New Orleans area who stayed in private home rentals spent an average of $993 during their trip to the city. The largest proportion of visitor trip expenditures was for meals ($282), followed by lodging ($254).
During 2013, the majority of visitors to the New Orleans area arrived by airplane (61.4%) or in their personal vehicle (34.2%).
37.2% of visitors indicated that they just knew about New Orleans when asked about their primary source of information used in making their decision to come to the area. Other sources included the internet (25.9%), friends (16.5%) and family (9.2%).
Activity/Satisfaction Questions
Satisfaction levels with New Orleans as a destination among private rental home visitors was strong. About 76% of them indicated they would be very likely to recommend New Orleans as a destination to their friends and family. Another 21% indicated they would be likely to recommend the city.
98.9% of visitors reported visiting the French Quarter, while 84.6% went specifically to Bourbon Street. 86.0% of respondents reported eating in casual dining restaurants.
The travel behavior of visitors traveling with and without children in their party can vary widely, depending on the activity. As expected, the Aquarium, Zoo and Insectarium were much more likely to be attended by parties traveling with children than those without.
First time visitors were more likely than repeat visitors to participate in those activities that are considered typical “tourist” activities, such as visiting the French Quarter, Bourbon Street, Canal Street, French Market and various other tourist attractions.
Visitor Profile and Economic Impact Analysis Private Home Rentals - 2013
3
Demographic Questions
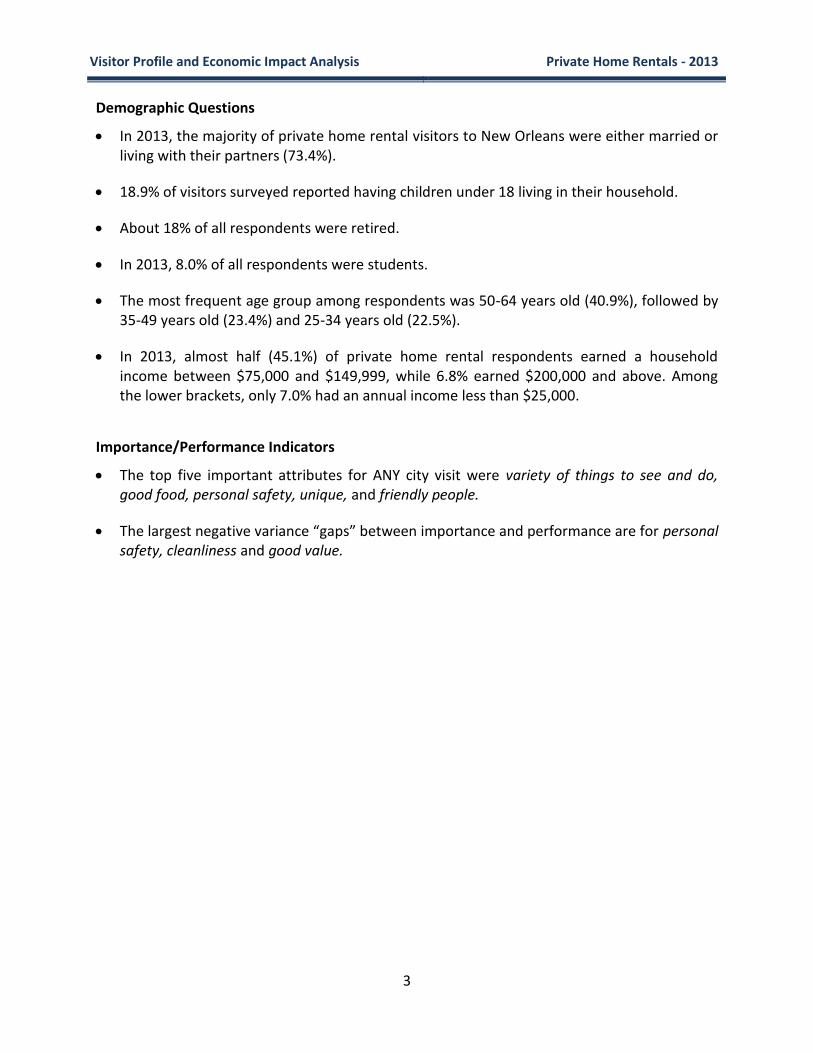
In 2013, the majority of private home rental visitors to New Orleans were either married or living with their partners (73.4%).
18.9% of visitors surveyed reported having children under 18 living in their household.
About 18% of all respondents were retired.
In 2013, 8.0% of all respondents were students.
The most frequent age group among respondents was 50-64 years old (40.9%), followed by 35-49 years old (23.4%) and 25-34 years old (22.5%).
In 2013, almost half (45.1%) of private home rental respondents earned a household income between $75,000 and $149,999, while 6.8% earned $200,000 and above. Among the lower brackets, only 7.0% had an annual income less than $25,000.
Importance/Performance Indicators
The top five important attributes for ANY city visit were variety of things to see and do, good food, personal safety, unique, and friendly people.
The largest negative variance “gaps” between importance and performance are for personal safety, cleanliness and good value.

Visitor Profile and Economic Impact Analysis Private Home Rentals - 2013
4
Economic Impact In 2013, approximately 100,000 visitors to the New Orleans area stayed in private home rentals. These visitors made a substantial contribution to the New Orleans metro area economy. They generated a total economic impact of $174.8 million, comprised of $99.8 million in direct spending and $74.9 million in secondary spending. Visitor spending also resulted in the creation or support of nearly 2,200 full-and part-time jobs. These jobs are expected to create a total of $56.1 million in additional earnings for residents of the New Orleans area. Visitor spending is also estimated to generate a total of $10.8 million in tax revenue for state and local governments. Of that total, roughly $6.1 million will go to the State of Louisiana, and $4.7 million will be claimed by local governments in the New Orleans area.

Visitor Profile and Economic Impact Analysis Private Home Rentals - 2013
5
Introduction
Representatives from Alliance for Neighborhood Prosperity contacted the Hospitality Research Center at the University of New Orleans to provide them with information about visitors to the New Orleans metro area who stayed in private home rentals during 2013. The purpose of this report is to provide a thorough profile and economic impact analysis of visitors who stayed in these accommodations. The analysis of the visitor profile survey follows. Throughout the report, totals in some of the tables may not add up due to rounding. A description of the economic impact is presented in a separate section.
Methodology This report presents results based on data collected by HRC to prepare the 2013 New Orleans Area Visitor Profile for the New Orleans Convention and Visitors Bureau (NOCVB) and New Orleans Tourism Marketing Corporation (NOTMC). The HRC analyzed the complete data set and selected only information for visitors who stayed overnight in the New Orleans metro area in a paid accommodation defined as a private home rental. It is important to note that respondents self-select their accommodation category. The selected data contained information used to determine visitor characteristics and total visitation in the New Orleans area during the last calendar year.
Survey Instrument The survey instruments developed by HRC, with input from NOCVB and NOTMC, consisted in electronic and paper surveys. The online survey was posted on Qualtrics.com, while paper surveys were used to intercept visitors at festivals and other events. Other non-visitor surveys, including hotelier and Visiting Friends and Relatives (VFR), were also part of the analysis.
Data Collection This report presents the results of data collected during 2013. The online survey was sent to a database of email addresses collected throughout the year. These email addresses belonged to people who had inquired for information about New Orleans at the NOCVB and NOTMC, and from visitors who provided their contact information when intercepted by a group of surveyors representing the HRC at different locations throughout New Orleans. The intercept locations included the Airport, Aquarium/Insectarium, Bourbon Street, Convention Center, French Market, Garden District, Jackson Square, Riverwalk, Museum District and Canal Street. It is important to note that the Riverwalk was closed during part of 2013 due to renovations. During this period, surveyors collected the remaining addresses among other locations. Visitors were sent the survey electronically after they returned home, and were only emailed once. Visitors

Visitor Profile and Economic Impact Analysis Private Home Rentals - 2013
6
who inquired for information about New Orleans were surveyed quarterly, while visitors who were intercepted were surveyed every month. The online surveys remained active until January 24th, 2014. In an effort to balance any biases inherent in an online collection methodology (such as low responses rate for certain groups), additional sources of data available to the HRC were used. The additional sources include intercept survey data collected during 2013 at sporting events and festivals, intercept data from the WWII Museum, data purchased from TNS email panel, the VFR phone survey to residents, and a separate hotelier survey. The hotel survey was administered to New Orleans hoteliers to determine an accurate mix of hotel visitors to New Orleans. In addition, visitors who were intercepted for their email addresses were asked some basic information about purpose of their visit and lodging arrangements, even if they did not provide an email address. External information, including Smith Travel Research and other travel statistics, was also collected and included as part of the analysis.
Data Analysis The surveys were downloaded from the host site and merged with comparable data from intercept surveys. When data were selected for visitors who stayed in private home rentals, a total of 242 usable responses comprised the final data set. The total number of observations includes both national and international visitation. The total number of visitors who stayed in private home rentals was estimated based on survey results along with the total number of people who visited New Orleans in 2013. The total number of visitors to the New Orleans area was determined using Smith Travel Research data, online surveys results, TNS, VFR survey, hotelier survey, and DBER intercept data from festivals, sporting events and the WWII Museum. In an effort to correct for any biases contained in the various data sets, the data were then weighted to the proper mix of visitors, as determined by the results of the hotelier survey, the VFR survey, intercept visitor characteristics, travel and hotel statistics, gambling indicators, historical data, and other relevant tourism information. Staff from the HRC edited the data for accuracy and logical consistency. Statistical software was then used to analyze the information collected from visitor surveys. Total primary visitor spending was determined using the average trip spending per person along with total visitation. Average individual expenditures of the New Orleans area visitors were determined based on responses obtained through all visitor survey data sources, except for data from WWII Museum, which does not collect spending figures. These figures can then be multiplied by the number of visitors obtained from the previously defined methodological steps to determine the total impact of tourism activity in the New Orleans area.

Visitor Profile and Economic Impact Analysis Private Home Rentals - 2013
7
Visitor Profile
Residency Questions
Do you live in the U.S.?
Table 1: International Respondents
Response Valid Percent
Yes 82.0 No 18.0
Total 100.0
International visitors accounted for 18.0% of the total number of respondents who stayed in private home rentals.
What country are you from?
Table 2: Country of Residence of International Respondents
Response Valid Percent
Canada 53.4
Australia 15.9
United Kingdom 10.2 France 4.5
Turkey 4.5
Germany 3.4
Ireland 3.4
Denmark 2.3
Mexico 2.3
Total* 100.0 *Caution should be used when interpreting these results as the survey was not
offered in different languages. Results are based on a small number of responses.
The majority of international respondents came from Canada (53.4%), followed by Australia (15.9%) and the United Kingdom (10.2%).

Visitor Profile and Economic Impact Analysis Private Home Rentals - 2013
8
Which city did you enter the U.S. through?
Table 3: U.S. City of Entrance for International Respondents
Response Valid Percent
New Orleans, LA 16.7 Houston, TX 14.4
Atlanta, GA 8.9
Los Angeles, CA 8.9
New York, NY 8.9
Dallas, TX 6.7
San Francisco 4.4
Washington DC 4.4
Boston (MA) 3.3
Philadelphia, PA 3.3
Other 20.0
Total* 100.0 *Caution should be used when interpreting these numbers, as they are
based on a small number of responses.
International respondents entered the United States mostly through New Orleans (16.7%), followed by Houston (14.4%). Atlanta, Los Angeles and New York were also mentioned as cities of entrance by 8.9% of the respondents.

Visitor Profile and Economic Impact Analysis Private Home Rentals - 2013
9
What is your home Zip Code? Zip codes were identified with state of residence as follows:
Table 4: State of Residence of Domestic Visitors
Response Valid Percent
Texas 12.3 California 10.7 Louisiana 5.6 Illinois 4.7 North Carolina 4.5 Maryland 4.2 Oregon 4.2 New York 3.9 Pennsylvania 3.9 Ohio 3.6 Georgia 3.6 Wisconsin 3.2 New Jersey 2.9 Connecticut 2.9 Florida 2.9 Washington 2.9 Massachusetts 2.6 Alabama 1.9 Mississippi 1.9 Other 17.6
Total* 100.0 *Caution should be used when interpreting these numbers, as they are
based on a small number of responses.
Domestic visitation was originated mostly from Texas (12.3%), California (10.7%), and Louisiana, outside the metropolitan area (5.6%).

Visitor Profile and Economic Impact Analysis Private Home Rentals - 2013
10
Stay-Specific Questions When did you visit New Orleans?
Figure 1: Month of Visit
During 2013, visitors who chose to rent a private home came to New Orleans mostly in April (18.1%), February (13.5%) and October (12.3%).
Was this your first visit to New Orleans?
Table 5: First Visit to New Orleans
Response Valid Percent
Yes 51.4 No 48.6
Total 100.0
About half (51.4%) of respondents reported that this was their first visit to New Orleans.
1.4%
13.5%
10.2%
18.1%
6.5%
5.3%
5.9%
2.2%
7.1%
12.3%
8.1%
9.3%
0% 5% 10% 15% 20%
January
February
March
April
May
June
July
August
September
October
November
December

Visitor Profile and Economic Impact Analysis Private Home Rentals - 2013
11
How many nights did you spend in New Orleans?
Table 6: Number of Nights in New Orleans
Year Average Number
of Nights Median Number
of Nights
2013 5.0 5.0
Overnight visitors to New Orleans who stayed in a private home rental spent an average of 5 nights in the area.
What was your nightly rate?
Table 7: Nightly Rate
Year Average Nightly
Rate Median Nightly
Rate
2013 $168.26 $140.95
In 2013, the average nightly rate reported by visitors was $168, while the median was $141. How many people stayed in your accommodation, including yourself?
Table 8: Number of People per Accommodation
Year Average Number
of People Median Number
of People
2013 3.9 3.0
The average number of people who stayed in home rentals was 3.9, while the median was 3.0.
Visitor Profile and Economic Impact Analysis Private Home Rentals - 2013
12
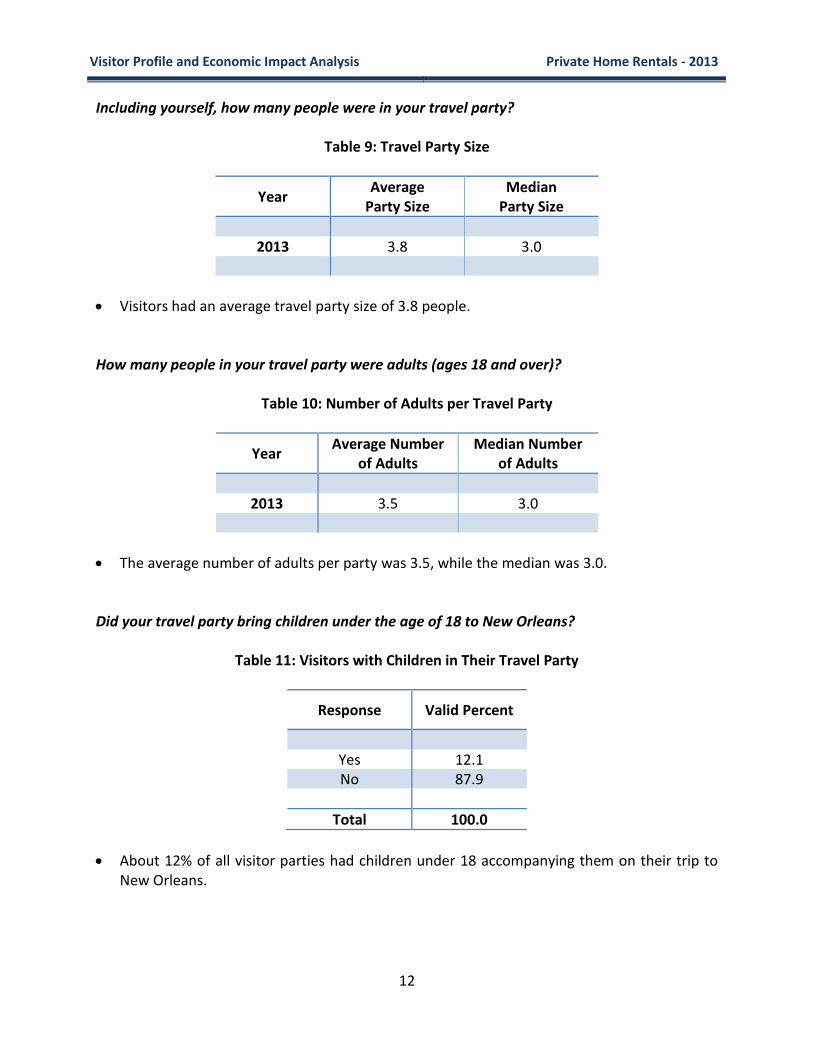
Including yourself, how many people were in your travel party?
Table 9: Travel Party Size
Year Average
Party Size Median
Party Size
2013 3.8 3.0
Visitors had an average travel party size of 3.8 people. How many people in your travel party were adults (ages 18 and over)?
Table 10: Number of Adults per Travel Party
Year Average Number
of Adults Median Number
of Adults
2013 3.5 3.0
The average number of adults per party was 3.5, while the median was 3.0. Did your travel party bring children under the age of 18 to New Orleans?
Table 11: Visitors with Children in Their Travel Party
Response Valid Percent
Yes 12.1 No 87.9
Total 100.0
About 12% of all visitor parties had children under 18 accompanying them on their trip to New Orleans.

Visitor Profile and Economic Impact Analysis Private Home Rentals - 2013
13
If your travel party brought children, how many of them were under the age of 18?
Table 12: Number of Children per Travel Party
Year Average Number
of Children Median Number
of Children
2013* 2.2 1.0
*Caution should be used when interpreting these numbers, as they are
based on a small number of responses.
The average number of children per party was about 2, while the median was one child. What was the primary purpose of your visit?
Figure 2: Primary Purpose of Visit
Nearly all (97.2%) visitors surveyed were in the New Orleans area for vacation or pleasure purposes.
97.2%
1.7% 1.1% 0%
20%
40%
60%
80%
100%
Vacation/Pleasure
Association/ Convention/Trade Show/ Corp. Meeting
GeneralBusiness

Visitor Profile and Economic Impact Analysis Private Home Rentals - 2013
14
Figure 3: Primary Purpose of Visit (Expanded)
38.6%
10.5%
8.6%
8.2%
6.4%
6.0%
5.4%
2.6%
2.6%
2.4%
2.3%
1.7%
1.3%
0.8%
0.8%
0.8%
0.4%
0.4%
0.4%
0% 10% 20% 30% 40% 50%
Other Vacation/Leisure/Pleasure
Other Sporting Event
Atmosphere/Ambience
Visit friends/relatives
Food/Dining
Other Special Event
French Quarter Fest
Jazz Fest
Family Attractions
Mardi Gras
Music
Association/Convention/Trade Show
Cruise
Business Trip
Saints
Museum(s)/Arts
Other Business
Passing through
Shopping
Visitor Profile and Economic Impact Analysis Private Home Rentals - 2013
15
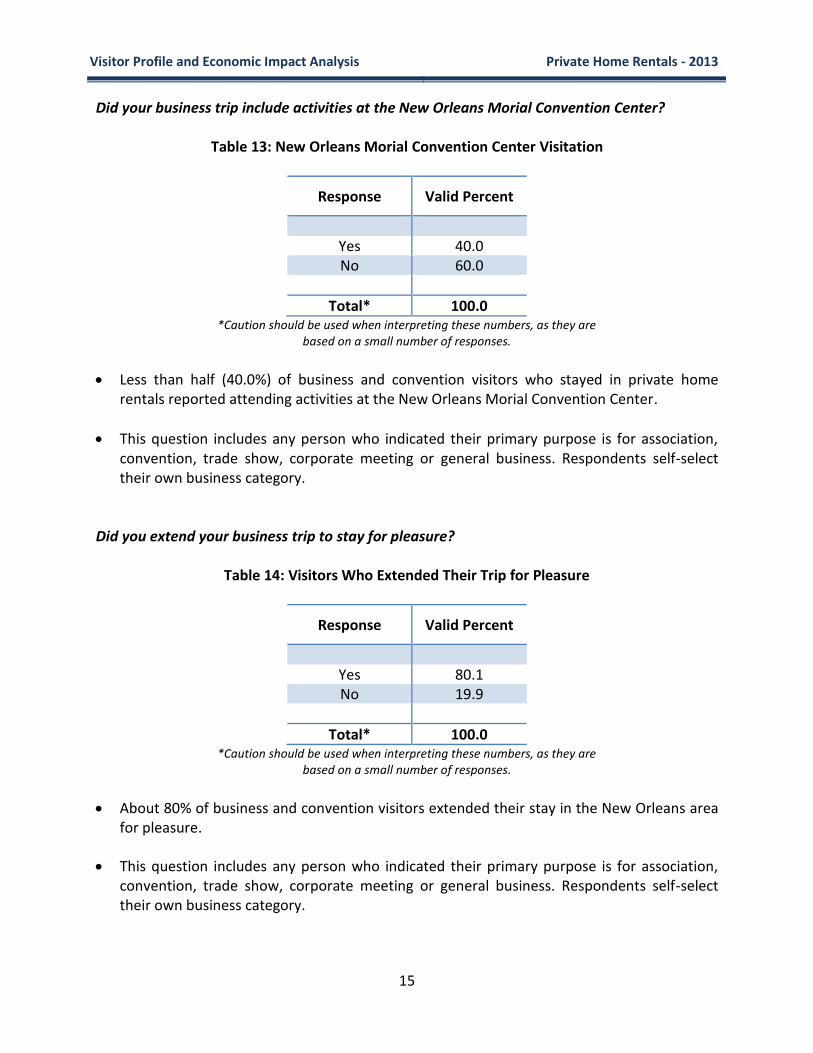
Did your business trip include activities at the New Orleans Morial Convention Center?
Table 13: New Orleans Morial Convention Center Visitation
Response Valid Percent
Yes 40.0 No 60.0
Total* 100.0 *Caution should be used when interpreting these numbers, as they are
based on a small number of responses.
Less than half (40.0%) of business and convention visitors who stayed in private home rentals reported attending activities at the New Orleans Morial Convention Center.
This question includes any person who indicated their primary purpose is for association, convention, trade show, corporate meeting or general business. Respondents self-select their own business category.
Did you extend your business trip to stay for pleasure?
Table 14: Visitors Who Extended Their Trip for Pleasure
Response Valid Percent
Yes 80.1 No 19.9
Total* 100.0 *Caution should be used when interpreting these numbers, as they are
based on a small number of responses.
About 80% of business and convention visitors extended their stay in the New Orleans area for pleasure.
This question includes any person who indicated their primary purpose is for association, convention, trade show, corporate meeting or general business. Respondents self-select their own business category.

Visitor Profile and Economic Impact Analysis Private Home Rentals - 2013
16
If you extended your business or convention trip to stay for pleasure, by how many nights did you extend it?
Table 15: Number of Nights Trips Were Extended for Pleasure
Year Average Number
of Nights Median Number
of Nights
2013* 3.8 4.0
*Caution should be used when interpreting these numbers, as they are
based on a small number of responses.
Private home rental visitors who came for business or convention purposes and extended their stay for pleasure spent an average of 3.8 additional nights in the New Orleans area.
How many nights did you spend in New Orleans before or after your cruise?
Table 16: Number of Nights in New Orleans Before or After a Cruise
Year Average Number
of Nights Median Number
of Nights
2013* 4.6 5.0
*Caution should be used when interpreting these numbers, as they are
based on a small number of responses.
Cruise visitors comprised about 1.3% of the total number of visitor responses. These visitors stayed in the New Orleans area for an average of 4.6 nights before or after their cruise.

Visitor Profile and Economic Impact Analysis Private Home Rentals - 2013
17
How much money did you personally spend in total in the New Orleans Metro Area during your visit?
Table 17: Average Individual Visitor Trip Expenditures
Response Average
Expenditure
Restaurants/Meals $282 Bars and Nightclubs $104 Recreation and Entertainment $117 Shopping $162 Local Transportation $51 Gambling $23 Lodging $254
Total $993
Visitors to the New Orleans area who stayed in private home rentals spent an average of $993 during their trip to the city. The largest proportion of visitor trip expenditures was for meals ($282), followed by lodging ($254).

Visitor Profile and Economic Impact Analysis Private Home Rentals - 2013
18
What was your primary method of travel to the New Orleans area?
Figure 4: Primary Method of Travel to New Orleans
During 2013, the majority of visitors to the New Orleans area arrived by airplane (61.4%) or in their personal vehicle (34.2%).
61.4%
34.2%
4.4%
0% 20% 40% 60% 80%
Airplane
PersonalVehicle
Other

Visitor Profile and Economic Impact Analysis Private Home Rentals - 2013
19
What was the primary source of information you used in making the decision to come to New Orleans?
Figure 5: Primary Source of Information
37.2% of visitors indicated that they just knew about New Orleans when asked about their primary source of information used in making their decision to come to the area. Other sources included the internet (25.9%), friends (16.5%) and family (9.2%).
37.2%
25.9%
16.5%
9.2%
3.0%
0.7%
0.7%
0.5%
0.5%
6.0%
0% 10% 20% 30% 40%
Just Knew
Internet
Friends
Family
Convention/Conference
Travel Agent
Advertisement
Volunteer Contacts
Job/Business/Company
Other

Visitor Profile and Economic Impact Analysis Private Home Rentals - 2013
20
Activity/Satisfaction Questions How likely would you be to recommend New Orleans as a destination to your friends and family?
Table 18: Likelihood to Recommend New Orleans as Destination
Response Valid Percent
Very Likely 76.1
Likely 20.6
Neutral 2.8
Not Likely -
Not Very Likely 0.5
Total 100.0
Satisfaction levels with New Orleans as a destination among private rental home visitors was strong. About 76% of them indicated they would be very likely to recommend New Orleans as a destination to their friends and family. Another 21% indicated they would be likely to recommend the city.

Visitor Profile and Economic Impact Analysis Private Home Rentals - 2013
21
On this trip, what places did you visit or activities did you participate in?
Figure 6: Activities Participated in While Visiting the New Orleans Area (All Visitors)
*See Appendix A for a list of “Other” activities and places. Total equals more than 100% due to multiple responses.
98.9% of visitors reported visiting the French Quarter, while 84.6% went specifically to Bourbon Street. 86.0% of respondents reported eating in casual dining restaurants.
98.9% 86.0%
84.6% 83.5% 82.8%
76.4% 72.5%
70.9% 70.2% 70.0%
67.7% 66.7%
65.4% 63.8%
59.9% 59.9%
47.0% 46.8%
41.5% 32.8%
26.2% 22.9% 22.7% 22.2%
20.9% 20.6% 20.6% 20.0%
16.5% 14.5% 13.5%
10.8% 10.8% 10.1% 9.0%
7.6% 7.6% 7.3%
5.7% 5.5% 5.5% 5.5% 5.5% 5.3% 4.6%
1.4% 0.9%
10.8% 22.5%
0% 20% 40% 60% 80% 100%
French QuarterCasual Dining
Bourbon StreetJackson SquareFrench Market
Other French QuarterCanal Street
Cafe du MondeGarden District
Bars/NightclubsFrenchmen Street
ShoppingMusic
Street CarCemeteries
Magazine StreetSt. Louis Cathedral
Historic SitesFine Dining
Riverwalk MallSwamp Tour
City TourPlantations
Harrah's CasinoRiver Boat Tour
GamblingOther Guided Tours
WWII MuseumFerry on Mississippi
Mardi Gras WorldParades
Other MuseumsAudubon Zoo
N.O. Museum of ArtHaunted Tour
Hurricane Katrina TourN.O. School of Cooking
Carriage RideBicycle TourSuperdome
Sporting EventsLA State Museum
Ogden MuseumAquarium
InsectariumChildren's Museum
Volunteering/VoluntourismOther Activities*
Other Places*

Visitor Profile and Economic Impact Analysis Private Home Rentals - 2013
22
Figure 7: Activities Participated in While in New Orleans (With vs. Without Children)
*See Appendix A for a list of “Other”. Total equals more than 100% due to multiple responses
The travel behavior of visitors traveling with and without children in their party can vary widely, depending on the activity. As expected, the Aquarium, Zoo and Insectarium were much more likely to be attended by parties traveling with children than those without.
100%
95%
87%
82%
82%
78%
75%
67%
65%
62%
62%
55%
53%
45%
45%
45%
44%
44%
40%
38%
35%
33%
33%
29%
29%
27%
25%
24%
22%
20%
20%
18%
16%
99%
85%
82%
85%
71%
66%
69%
86%
71%
64%
78%
46%
61%
62%
69%
6%
47%
20%
18%
32%
20%
73%
25%
44%
76%
20%
2%
13%
22%
21%
16%
3%
6%
0% 20% 40% 60% 80% 100%
French Quarter
Casual Dining
French Market
Bourbon Street
Canal Street
Shopping
Garden District
Jackson Square
Cafe du Monde
Street Car
Other French Quarter
Historic Sites
Cemeteries
Magazine Street
Music
Audubon Zoo
St. Louis Cathedral
City Tour
Other Guided Tours
Riverwalk Mall
Plantations
Frenchmen Street
Swamp Tour
Fine Dining
Bars/Nightclubs
Gambling
Aquarium
Mardi Gras World
Harrah's Casino
River Boat Tour
Ferry on Mississippi
Insectarium
N.O. School of Cooking
Other*
Visitors With Children
Visitors Without Children

Visitor Profile and Economic Impact Analysis Private Home Rentals - 2013
23
Figure 8: Activities Participated in While in New Orleans (First Time vs. Repeat Visitor)
*See Appendix A for a list of “Other”. Total equals more than 100% due to multiple responses
First time visitors were more likely than repeat visitors to participate in those activities that are considered typical “tourist” activities, such as visiting the French Quarter, Bourbon Street, Canal Street, French Market and various other tourist attractions.
100%
90%
87%
83%
82%
79%
79%
79%
77%
72%
71%
69%
68%
63%
58%
56%
49%
44%
40%
36%
35%
29%
26%
23%
23%
22%
20%
17%
16%
16%
97%
77%
86%
84%
87%
72%
66%
55%
62%
59%
70%
65%
73%
57%
70%
66%
44%
51%
43%
15%
30%
15%
18%
20%
19%
19%
23%
9%
18%
25%
0% 20% 40% 60% 80% 100% 120%
French Quarter
Bourbon Street
Casual Dining
French Market
Jackson Square
Other French Quarter
Canal Street
Frenchmen Street
Bars/Nightclubs
Music
Garden District
Shopping
Cafe du Monde
Cemeteries
Street Car
Magazine Street
Historic Sites
St. Louis Cathedral
Fine Dining
Swamp Tour
Riverwalk Mall
City Tour
Plantations
River Boat Tour
Other Guided Tours
WWII Museum
Harrah's Casino
Parades
Ferry on Mississippi
Gambling
Other*
First Time Visitors
Repeat Visitors

Visitor Profile and Economic Impact Analysis Private Home Rentals - 2013
24
Demographic Questions What is your marital status?
Figure 9: Marital Status of Respondents
In 2013, the majority of private home rental visitors to New Orleans were either married or living with their partners (73.4%).
Are there any children under 18 that live in your household?
Table 19: Respondents With Children in Their Households
Response Valid Percent
Yes 18.9 No 81.1
Total 100.0
18.9% of visitors surveyed reported having children under 18 living in their household.
73.4%
18.6%
7.9%
0% 20% 40% 60% 80% 100%
Married/ Livingwith Partner
Single
Divorced/Widowed/Separated

Visitor Profile and Economic Impact Analysis Private Home Rentals - 2013
25
Are you retired?
Table 20: Retired Respondents
Response Valid Percent
Yes 17.6 No 82.4
Total 100.0
About 18% of all respondents were retired. Are you a student?
Table 21: Respondents Who Are Students
Response Valid Percent
Yes 8.0 No 92.0
Total 100.0
In 2013, 8.0% of all respondents were students.
Visitor Profile and Economic Impact Analysis Private Home Rentals - 2013
26
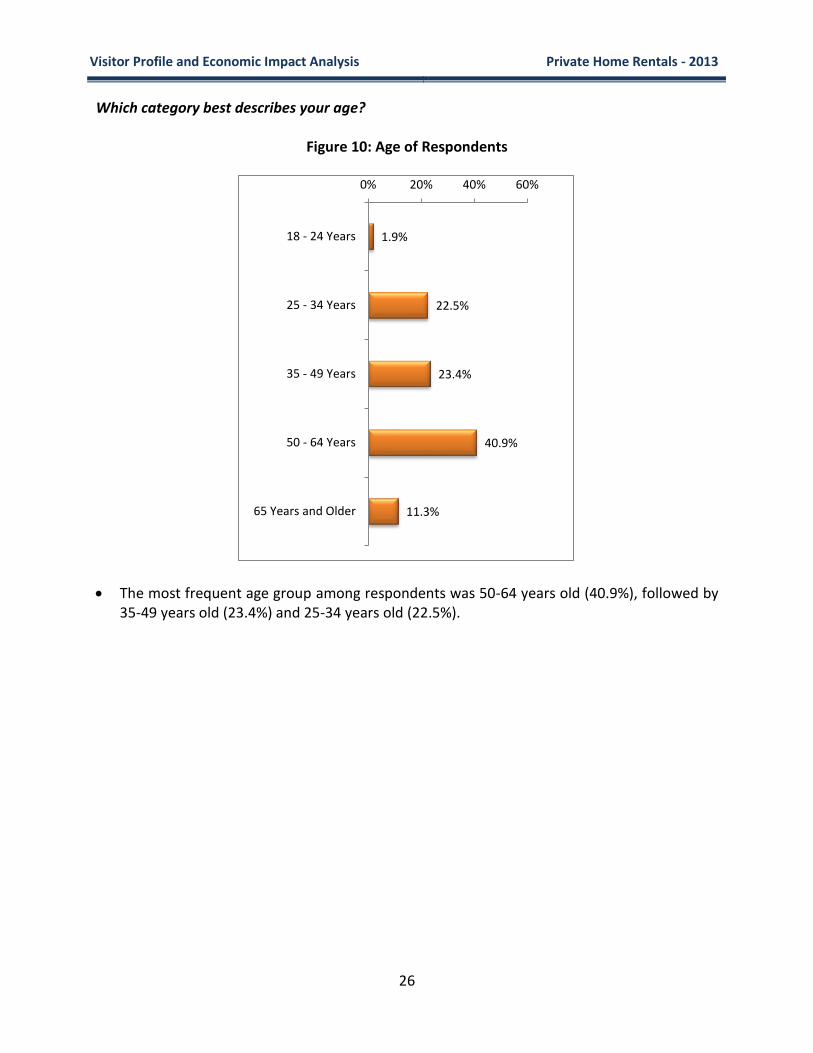
Which category best describes your age?
Figure 10: Age of Respondents
The most frequent age group among respondents was 50-64 years old (40.9%), followed by 35-49 years old (23.4%) and 25-34 years old (22.5%).
1.9%
22.5%
23.4%
40.9%
11.3%
0% 20% 40% 60%
18 - 24 Years
25 - 34 Years
35 - 49 Years
50 - 64 Years
65 Years and Older
Visitor Profile and Economic Impact Analysis Private Home Rentals - 2013
27
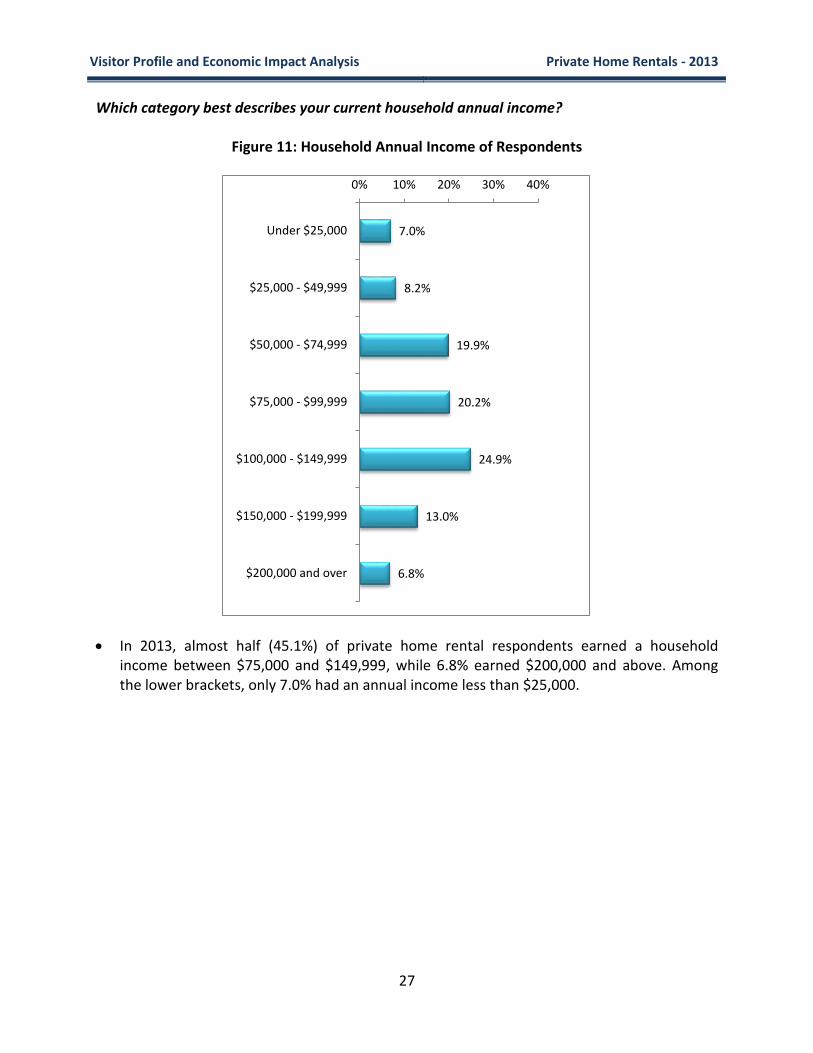
Which category best describes your current household annual income?
Figure 11: Household Annual Income of Respondents
In 2013, almost half (45.1%) of private home rental respondents earned a household income between $75,000 and $149,999, while 6.8% earned $200,000 and above. Among the lower brackets, only 7.0% had an annual income less than $25,000.
7.0%
8.2%
19.9%
20.2%
24.9%
13.0%
6.8%
0% 10% 20% 30% 40%
Under $25,000
$25,000 - $49,999
$50,000 - $74,999
$75,000 - $99,999
$100,000 - $149,999
$150,000 - $199,999
$200,000 and over

Visitor Profile and Economic Impact Analysis Private Home Rentals - 2013
28
Importance/Performance Indicators
Respondents were asked to rate the importance of destination attributes for ANY city trip on a five point scale (1=Not at all important; 5=Very important). Later in the survey, visitors were asked to rate their satisfaction with these same attributes specifically for their visit to New Orleans using a similar scale (1=Not at all satisfied; 5=Very satisfied). The destination attributes along with their mean scores for importance and performance are presented in Table 22.
The top five important attributes for ANY city visit were variety of things to see and do, good food, personal safety, unique, and friendly people.
The satisfaction of visitors with these attributes is often essential to their overall trip satisfaction. One way to assess the performance of New Orleans is to look at the “gaps” between importance and performance for the different attributes by examining the variance between the means.
The largest negative variance “gaps” between importance and performance are for personal safety, cleanliness and good value.
Table 22: Important/Performance Indicators Variance
Attribute Importance Performance Variance*
Variety of Things to See and Do
4.58 4.70 0.12
Good Food 4.49 4.62 0.13
Personal Safety 4.41 3.83 -0.57
Unique 4.28 4.69 0.42
Friendly People 4.22 4.50 0.28
Quality of Service 4.13 4.20 0.07
Good Value 4.09 4.03 -0.06
Entertainment 4.08 4.45 0.38
Exciting 4.06 4.54 0.47
Easy to Travel to 4.06 4.16 0.10
Cleanliness 3.84 3.43 -0.41
Nightlife 3.37 4.33 0.96
Family Oriented 2.83 3.31 0.48
*Variance may not add due to rounding

Visitor Profile and Economic Impact Analysis Private Home Rentals - 2013
29
The means of the importance/performance indicators were then graphed on a grid and divided into quadrants according to level of importance and satisfaction. Most of the attributes ranked high in importance also ranked very highly in visitor satisfaction. Special note should be taken to those attributes that visitors rank as high in importance, but low in satisfaction. These attributes are personal safety and easy to travel to. Attention also should be paid to those attributes that are changing quadrants, specifically good value.
Figure 12: Importance/Performance Indicators
Unique
Exciting Friendly People
Nightlife
Good Value
Family Oriented
Cleanliness
Personal Safety Easy to Travel to
Quality of Service
Good Food
Entertainment
Variety of Things to See and Do
2.75
3.00
3.25
3.50
3.75
4.00
4.25
4.50
4.75
5.00
5.25
2.75 3.00 3.25 3.50 3.75 4.00 4.25 4.50 4.75 5.00 5.25
Pe
rfo
rma
nce
Importance
LO IMP/HI PER
LO IMP/LO PER
HI IMP/HI PER
HI IMP/LO PER

Visitor Profile and Economic Impact Analysis Private Home Rentals - 2013
30
Economic Impact
Introduction
The purpose of this section is to estimate the total economic impact created on the New Orleans metro area economy by visitors who stayed in private home rentals during 2013. Over the course of their stay, visitors’ spending generated a substantial economic activity in the New Orleans area. The economic impact includes total spending, total income, total employment, and total state and local tax revenues created by these visitors.
Direct and Secondary Spending
According to estimates obtained from the 2013 New Orleans Area Visitor Profile Annual Report, the number of New Orleans visitors who stayed in private home rentals was approximately 100,000. Estimates of individual trip expenditures for typical overnight visitors who stayed in these accommodations were also derived from survey results (Table 23).
Table 23: Average Individual Visitor Trip Expenditures
Response Average
Expenditure
Restaurants/Meals $282 Bars and Nightclubs $104 Recreation and Entertainment $117 Shopping $162 Local Transportation $51 Gambling $23 Lodging $254
Total $993

Visitor Profile and Economic Impact Analysis Private Home Rentals - 2013
31
Based on individual trip expenditures presented above, estimates can be made of the total direct spending attributable to visitors who came to New Orleans and stayed in private home rentals. Total direct spending for these visitors is determined as the product of their respective average trip expenditures and the total number of visitors.
Secondary spending, or the ripple effect, is based on the indirect and induced spending generated from the direct impact. For every new dollar of direct spending, additional dollars of secondary spending are generated in the economy. Secondary spending is calculated as a proportion of direct spending using multipliers provided by the United States Department of Commerce, Bureau of Economic Analysis (BEA). The 2010 BEA Regional Input-Output Modeling System (RIMS II) values for the New Orleans metro area were used for this analysis. These multipliers are specific to each industry in a given area, and those used here are for the respective industries in the New Orleans metro area represented by each expenditure category (Table 24).
Table 24: Estimated Total Private Home Rentals Visitor Expenditures
Spending Category Direct Visitor Expenditures
Secondary Visitor Expenditures
Total Visitor Expenditures
Restaurants/Meals $28,324,453 $23,452,647 $51,777,100
Bars and Nightclubs $10,445,971 $8,649,264 $19,095,235
Recreation and Entertainment $11,775,787 $9,992,933 $21,768,720
Shopping $16,319,818 $3,803,660 $20,123,478
Local Transportation $5,175,446 $4,798,156 $9,973,602
Gambling $2,289,607 $1,942,961 $4,232,568
Lodging $25,505,865 $22,302,328 $47,808,193
Total $99,836,947 $74,941,949 $174,778,896
Total visitor impact was determined as the sum of direct and secondary spending by all visitors. A total of $99.8 million was spent in the New Orleans area directly by visitors. This spending generated an additional $74.9 million in secondary expenditures. Therefore, the total impact produced by visitors to New Orleans who stayed in private home rentals during 2013 was approximately $174.8 million.
Figure 13: Total Visitor Spending
Restaurants 30%
Bars and Nightclubs
11%
Recreation 12%
Shopping 12%
Transportation 6%
Gambling 2%
Lodging 27%

Visitor Profile and Economic Impact Analysis Private Home Rentals - 2013
32
Earnings
Direct spending by visitors generated new earnings in the economy. For each industry impacted by direct spending, the 2010 BEA RIMS II Multipliers were used to estimate new earnings created due to visitor activity. In total, these visitors were responsible for generating nearly $56.1 million of new earnings in the New Orleans area economy.
Employment
Direct spending by visitors was also responsible for the creation or support of new full-and part-time jobs in the economy. For each industry impacted by this direct spending, the respective 2010 BEA RIMS II Multipliers for employment were used to estimate the spin-off jobs that resulted from visitors. In total, private home rental visitor spending was responsible for the creation or support of about 2,200 full-and part-time jobs in the New Orleans area economy.
Tax Revenues
As a result of spending and employment in the New Orleans area created by visitors, tax revenues are generated for state and local governments. There are two types of tax revenues estimated in this report. The first is direct revenue for state and local governments – direct revenue is the tax revenue that visitors pay to state and local governments directly. Examples include state and local sales taxes that they pay on their retail purchases, including food and drinks. It is important to note that no hotel/motel taxes were included in this analysis. Indirect taxes are the taxes paid on the income generated by direct spending. On that income, the recipient pays state income taxes; in addition, the taxpayer buys goods and services and pays taxes that apply to those goods and services. The retail sales tax applies to the purchase of some of those goods and services. Other goods and services, however, are not taxable under the retail sales tax, but are taxable under various other taxes. Examples of these are the gasoline tax, the insurance premium tax, and the beer tax. These are referred to as excise taxes. The assumption used to estimate the revenue from these taxes is that the recipient of newly created income is no different from the average Louisiana consumer. Therefore the proportion of secondary income that is paid in these various taxes is equal to average values for the state as a whole.

Visitor Profile and Economic Impact Analysis Private Home Rentals - 2013
33
State Tax Impact
Visitors who stayed in private home rentals are expected to raise just under $6.1 million of state tax revenue during the calendar year 2013. These state tax collections included $3.2 million in direct state taxes paid from visitor spending within the local economy, plus $2.9 million of indirect tax revenue resulting from the earnings attributable to visitor spending (Table 25).
Table 25: State Tax Revenue
Government and Tax Total Revenue
Direct Tax Revenue
Sales Tax $2,674,641
Gambling Tax $492,266
Total Direct Taxes $3,166,907
Indirect Tax Revenue Sales Tax $1,088,966
Excise Tax $920,017
Income Tax $877,967
Total Indirect Taxes $2,886,950
Total State Tax Revenue $6,053,856

Visitor Profile and Economic Impact Analysis Private Home Rentals - 2013
34
Local Tax Impact
In addition to state taxes, local governments in the New Orleans area are expected to receive about $4.7 million in tax revenue attributable to these visitors. This figure is comprised of $3.3 million in direct local taxes, and another $1.4 million of indirect local tax revenue (Table 26).
Table 26: Local Tax Revenue
Government and Tax Total Revenue
Direct Tax Revenue Sales Tax $3,343,301
Total Direct Taxes $3,343,301 Indirect Tax Revenue Sales Tax $1,361,208
Total Indirect Taxes $1,361,208
Total Local Tax Revenue $4,704,509
Total Tax Impact
In summary, visitors to New Orleans who stayed in private home rentals during 2013 are expected to generate a total of $10.8 million in tax revenue for state and local governments. The State of Louisiana will receive nearly $6.1 million in total taxes, and the local governments in the New Orleans area expected to receive about $4.7 million.

Visitor Profile and Economic Impact Analysis Private Home Rentals - 2013
35
Conclusion
In 2013, approximately 100,000 visitors to the New Orleans area stayed in private home rentals. These visitors made a substantial contribution to the New Orleans metro area economy. They generated a total economic impact of $174.8 million, comprised of $99.8 million in direct spending and $74.9 million in secondary spending. Visitor spending also resulted in the creation or support of nearly 2,200 full-and part-time jobs. These jobs are expected to create a total of $56.1 million in additional earnings for residents of the New Orleans area. Visitor spending is also estimated to generate a total of $10.8 million in tax revenue for state and local governments. Of that total, roughly $6.1 million will go to the State of Louisiana, and $4.7 million will be claimed by local governments in the New Orleans area.

Visitor Profile and Economic Impact Analysis Private Home Rentals - 2013
36
Appendix A
Activities Participated in While Visiting the New Orleans Area

Visitor Profile and Economic Impact Analysis Private Home Rentals - 2013
37
Activities Participated in While in New Orleans (“Other Places and Other Activities”)
On this trip, what places did you visit or activities did you participate in? (Check all that apply)
“OTHER” RESPONSES 2013
Response Frequency
City Park 9 Bywater Neighborhoods 5 Self-Guided Tour 4 Jean Laffite Park 3 Marigny Neighborhoods 3 Ninth Ward 3 Treme 3 Audubon Park 2 Bicycle Rentals 2 Cooking School 2 Fishing 2 Kermit Ruffins 2 Oak Street 2 Antoines 1 Bayou 1 Bus Vision Boo 1 Butterfly Park 1 Canoe Trip In Bayou 1 Chalmette Battlefield 1 Cheaper Dining 1 Church 1 Concert At Saenger 1 Contemporary Arts Center 1 Court Of Two Sisters 1 Dalai Lama Fri And Sat 1 Dooky Chase Restaurant In Treme 1 Freret 1 Healing Center 1 Hermann-Grima House 1 House Of Dance & Feathers 1 Impromptu Wedding Line 1 Jazz Clubs 1 La Seafood Festival 1

Visitor Profile and Economic Impact Analysis Private Home Rentals - 2013
38
Lake Pontchartrain
1 Lakeside Mall 1 Laplace 1 Lightning Ceremony 1 Lil Dizzy 1 Louis Armstrong Park 1 Louisiana Music Factory 1 Louisiana Seafood Festival 1 Loyola 1 Maple Street 1 Metairie 1 Museum At Tulane 1 Music In Clubs 1 Nola Brewery 1 Northshore 1 Old Ursulines Convent 1 Parks 1 Pontchartrain Causeway 1 Presbytere 1 Preservation Hall 1 Restaurants 1 Rock-N-Bowl 1 Running Of The Bulls 1 Scooter Rental 1 Spotted Cat 1 Super Bowl 1 Table Tennis Local Club 1 The Howlin Wolf 1 Theatre 1 Tipitinas 1 Tips 1 Tulane 1 USNP Re-Enactment 1 Visit Family/Friends 1
Total 96

Visitor Profile and Economic Impact Analysis Private Home Rentals - 2013
39
Activities Participated in While in New Orleans – Other
(With vs. Without Children)
Activity Visitors With
Children Visitors Without
Children
WWII Museum 14.6 20.9 Haunted Tour 12.7 8.5 Parades 12.7 13.8 Children's Museum 10.9 5.8 Other Museums 10.9 10.9 Carriage Ride 9.1 7.1 Hurricane Katrina Tour 9.1 7.4
Superdome 5.4 5.6 N.O. Museum of Art 3.6 11.1 Ogden Museum 3.6 6.4 Bicycle Tour - 6.6 Sporting Events - 6.4 Volunteering/Voluntourism - 1.1 Other Places 20.0 22.2 Other Activities 5.4 11.6
Visitor Profile and Economic Impact Analysis Private Home Rentals - 2013
40
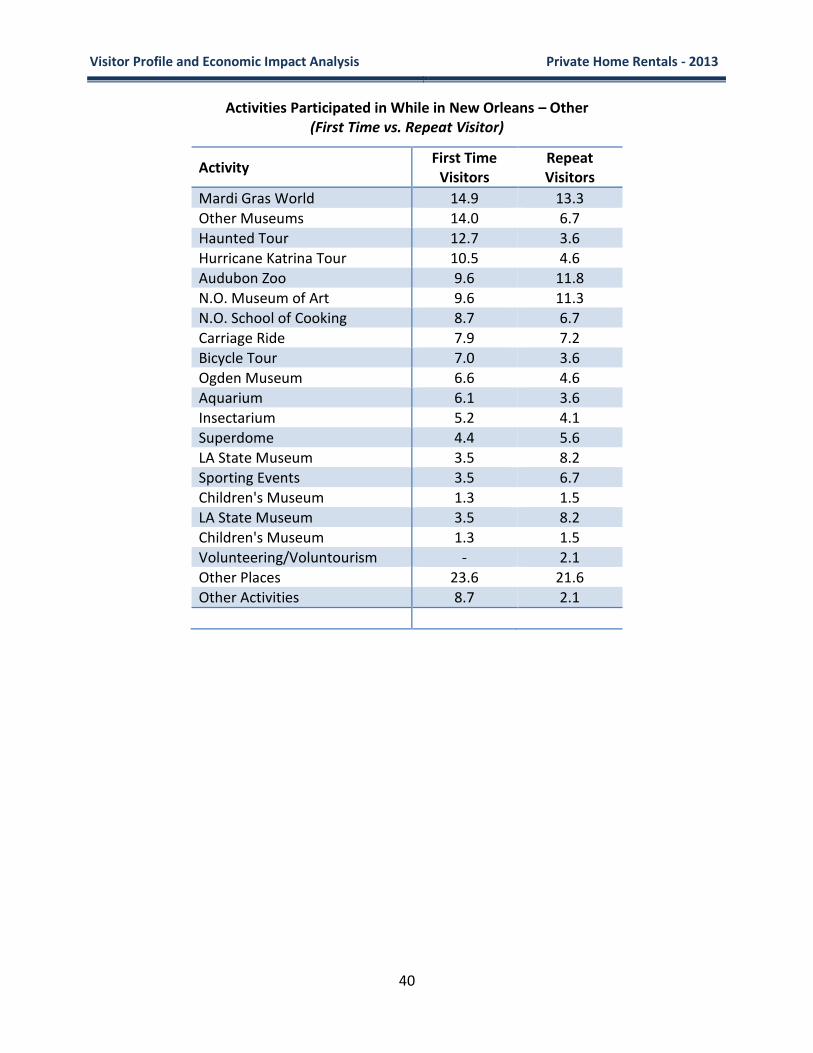
Activities Participated in While in New Orleans – Other (First Time vs. Repeat Visitor)
Activity First Time
Visitors Repeat Visitors
Mardi Gras World 14.9 13.3 Other Museums 14.0 6.7 Haunted Tour 12.7 3.6 Hurricane Katrina Tour 10.5 4.6 Audubon Zoo 9.6 11.8 N.O. Museum of Art 9.6 11.3 N.O. School of Cooking 8.7 6.7
Carriage Ride 7.9 7.2 Bicycle Tour 7.0 3.6
Ogden Museum 6.6 4.6 Aquarium 6.1 3.6 Insectarium 5.2 4.1 Superdome 4.4 5.6 LA State Museum 3.5 8.2 Sporting Events 3.5 6.7 Children's Museum 1.3 1.5 LA State Museum 3.5 8.2 Children's Museum 1.3 1.5 Volunteering/Voluntourism - 2.1
Other Places 23.6 21.6 Other Activities 8.7 2.1

Visitor Profile and Economic Impact Analysis Private Home Rentals - 2013
41
Appendix B
Definitions of Key Terms

Visitor Profile and Economic Impact Analysis Private Home Rentals - 2013
42
Definitions of Key Terms
Tourist or Visitor: Any person who comes to New Orleans and who lives outside the New Orleans Metropolitan Area. The term traveler is also used as synonym. Using the word “tourist” may be confusing to people who do not understand that business travelers or meeting attendees are tourists as much as leisure travelers. This is why we prefer to use “visitor”.
Overnight Visitor: Any visitor who spends at least one night in the New Orleans metro area.
Daytripper: Any visitor who does not stay overnight in the New Orleans metro area.
Short Term Visitor: Any visitor who stayed in the New Orleans metro area for less than 15 days.
Long Term Visitor: Any visitor who stayed in the New Orleans metro area for 15 or more days.
Association/Convention/Trade Show/Corporate Meeting Visitors: All visitors who indicate that their primary purpose of visit is to attend a gathering such as a convention, a trade-show, an exposition or corporate meeting.
Business Visitors: All visitors who indicate that their primary purpose of visit is to conduct business in the New Orleans metro area.
Leisure Visitors: All visitors who indicate that their primary purpose of visit is to vacation, or to visit friends and relatives, attend a special event, a sporting event, to dine out, or to gamble. Visitors who pass through are also categorized as leisure visitors.
Statistical Terms:
Median: The median is the number that lies at the midpoint of the distribution of responses ranked from lowest to highest; it divides the distribution of scores into two equal halves. For example, if the scores are 2, 3, 5, 7, and 8, the median would be 5 (5 is the midpoint with two scores above and two scores below).
Mean: The arithmetic mean is the sum of all the scores divided by the number of scores. This mean is often called average, but the word average can also be used to describe other measures of central tendency, such as the median.
The mean and the median are measures of central tendency. In other words, they indicate the most representative score in the group. The median is helpful when the mean does not make sense (e.g., “average party size” or “average number of kids per family” of 2.35), or when the mean is affected by extreme scores (i.e., outliers). For example, some very high spenders pull the mean expenditure up. In such a situation, it is preferable to report a measure that is a more appropriate representation of the average, the median.