PPG Industries, Inc. Fourth Quarter 2015 Financial Results · 2016-07-07 · PPG’s consolidated...
16
Information current as of January 21, 2016 Michael H. McGarry, President and Chief Executive Officer Frank S. Sklarsky, Executive Vice President and Chief Financial Officer Vincent J. Morales, Vice President Investor Relations and Treasurer Scott A. Minder, Director Investor Relations PPG Industries, Inc. – Fourth Quarter 2015 Financial Results
Transcript of PPG Industries, Inc. Fourth Quarter 2015 Financial Results · 2016-07-07 · PPG’s consolidated...

Information current as of January 21, 2016
Michael H. McGarry, President and Chief Executive Officer
Frank S. Sklarsky, Executive Vice President and Chief Financial Officer
Vincent J. Morales, Vice President Investor Relations and Treasurer
Scott A. Minder, Director Investor Relations
PPG Industries, Inc. – Fourth Quarter 2015 Financial Results
Forward-Looking Statements
2
Statements contained herein relating to matters that are not historical facts are forward-looking statements
reflecting PPG’s current view with respect to future events and financial performance. These matters within
the meaning of Section 27A of the Securities Act of 1933, as amended, and Section 21E of the Securities
Exchange Act of 1934, as amended, involve risks and uncertainties that may affect PPG’s operations, as
discussed in PPG’s filings with the Securities and Exchange Commission pursuant to Sections 13(a), 13(c) or
15(d) of the Exchange Act, and the rules and regulations promulgated thereunder. Accordingly, many factors
could cause actual results to differ materially from the forward-looking statements contained herein. Such
factors include global economic conditions, increasing price and product competition by foreign and
domestic competitors, fluctuations in cost and availability of raw materials, the ability to maintain favorable
supplier relationships and arrangements, the timing realization of anticipated cost savings from restructuring
initiatives, difficulties in integrating acquired businesses and achieving expected synergies therefrom,
economic and political conditions in international markets, the ability to penetrate existing, developing and
emerging foreign and domestic markets, foreign exchange rates and fluctuations in such rates, fluctuations
in tax rates, the impact of future legislation, the impact of environmental regulations, unexpected business
disruptions, and the unpredictability of existing and possible future litigation, including litigation that could
result if the asbestos settlement discussed in PPG’s filings with the Securities and Exchange Commission
does not become effective. However, it is not possible to predict or identify all such factors. Consequently,
while the list of factors presented here and in PPG’s 2014 Form 10-K are considered representative, no such
list should be considered to be a complete statement of all potential risks and uncertainties. Unlisted factors
may present significant additional obstacles to the realization of forward-looking statements. Consequences
of material differences in results compared with those anticipated in the forward-looking statements could
include, among other things, lower sales or earnings, business disruption, operational problems, financial
loss, legal liability to third parties and similar risks, any of which could have a material adverse effect on
PPG’s consolidated financial condition, results of operations or liquidity. All information in this presentation
speaks only as of January 21, 2016, and any distribution of this presentation after that date is not intended
and will not be construed as updating or confirming such information. PPG undertakes no obligation to
update any forward-looking statement, except as otherwise required by applicable law.

Fourth Quarter 2015 Financial Highlights
• Sales up 7 percent in local currencies aided by higher volumes
Aggregate sales volumes increased nearly 2 percent year-over-year; highest 2015 quarterly growth rate
Acquisition-related sales contributed 5 percent, including 1 month of Comex (acquired in Nov. 2014)
and 6 other acquisitions
Foreign currency translation reduced sales by 7 percent or approximately $250 million
• Continued, strong earnings growth; sales volume and cost driven
Fourth quarter record adjusted earnings per diluted share from continuing operations up 17 percent
versus prior year, despite an unfavorable $25 million pre-tax earnings impact from foreign currency
translation
Segment income improved by 12 percent in local currencies aided by sales volume growth, acquisition-
related sales and synergies, and lower costs, including initial restructuring benefits
• Cash deployment continues
Deployed $1.15 billion in cash for full year 2015
Business acquisitions totaled more than $400 million (purchase price); share repurchases of ~$750 million
Full-year shareholder dividends of ~$385 million, annual per share payout increased for the 44th
consecutive year
Year-end cash and short-term investments of $1.5 billion
Company remains on pace for earnings-accretive cash deployment in 2015 and 2016 (combined) of
$2.0 -to- $2.5 billion, including ~$1.15 billion deployed in 2015
3
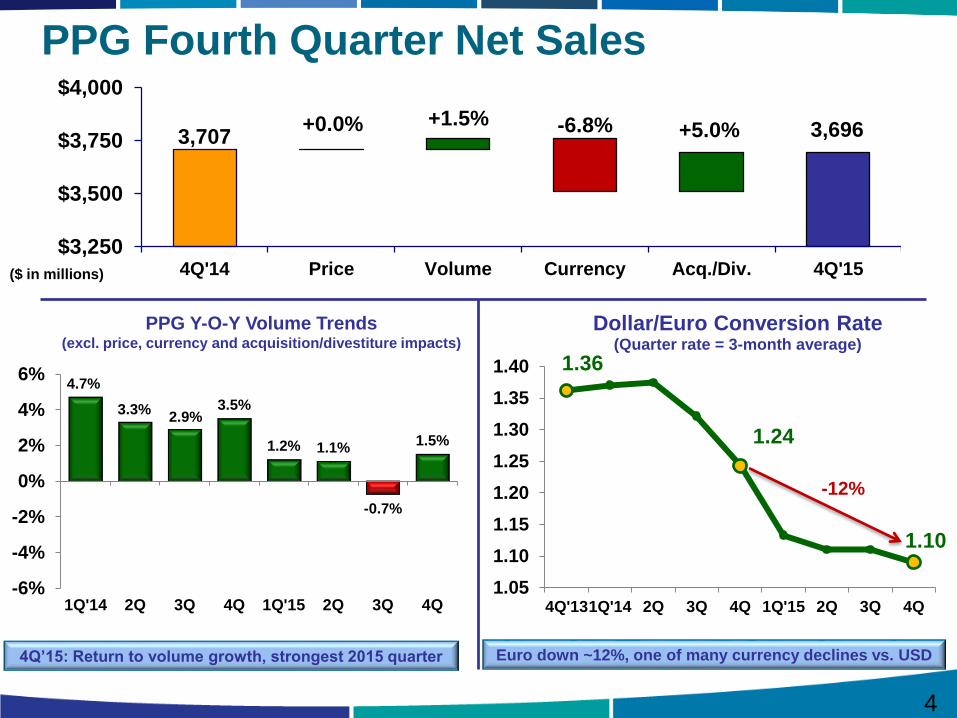
PPG Fourth Quarter Net Sales
3,707 3,696+0.0% +1.5% -6.8% +5.0%
$3,250
$3,500
$3,750
$4,000
4Q'14 Price Volume Currency Acq./Div. 4Q'15($ in millions)
4
4.7%
3.3%2.9%
3.5%
1.2% 1.1%
-0.7%
1.5%
-6%
-4%
-2%
0%
2%
4%
6%
1Q'14 2Q 3Q 4Q 1Q'15 2Q 3Q 4Q
PPG Y-O-Y Volume Trends (excl. price, currency and acquisition/divestiture impacts)
4Q’15: Return to volume growth, strongest 2015 quarter
1.36
1.24
1.10
1.05
1.10
1.15
1.20
1.25
1.30
1.35
1.40
4Q'131Q'14 2Q 3Q 4Q 1Q'15 2Q 3Q 4Q
Dollar/Euro Conversion Rate(Quarter rate = 3-month average)
Euro down ~12%, one of many currency declines vs. USD
-12%
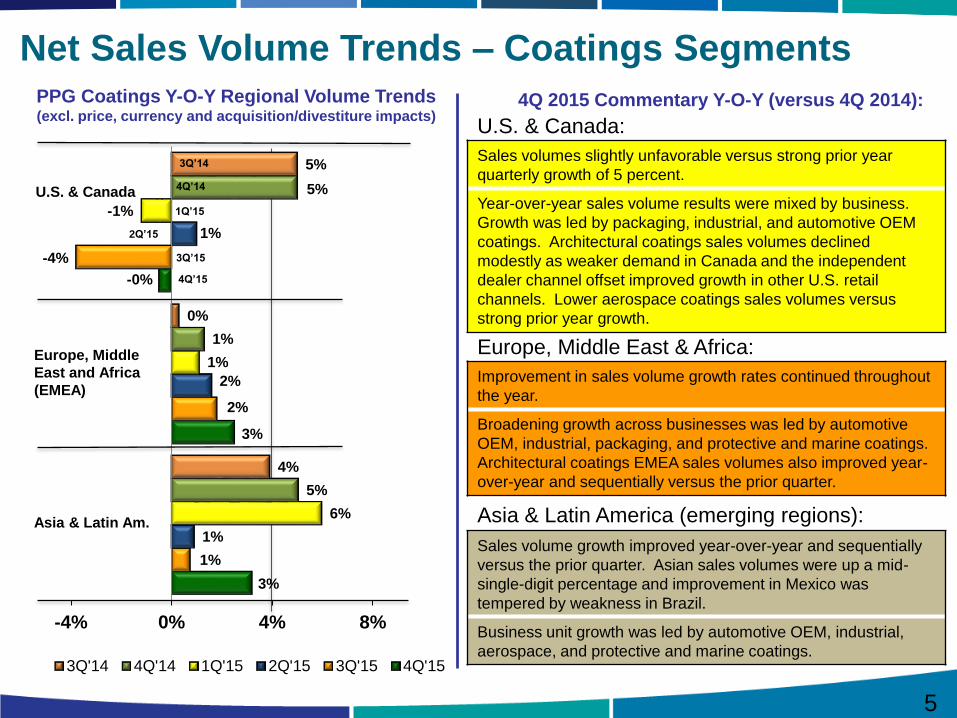
Sales volumes slightly unfavorable versus strong prior year
quarterly growth of 5 percent.
Year-over-year sales volume results were mixed by business.
Growth was led by packaging, industrial, and automotive OEM
coatings. Architectural coatings sales volumes declined
modestly as weaker demand in Canada and the independent
dealer channel offset improved growth in other U.S. retail
channels. Lower aerospace coatings sales volumes versus
strong prior year growth.
3%
3%
-0%
1%
2%
-4%
1%
2%
1%
6%
1%
-1%
5%
1%
5%
4%
0%
5%
-4% 0% 4% 8%
3Q'14 4Q'14 1Q'15 2Q'15 3Q'15 4Q'15
U.S. & Canada
Asia & Latin Am.
Europe, Middle
East and Africa
(EMEA)Improvement in sales volume growth rates continued throughout
the year.
Broadening growth across businesses was led by automotive
OEM, industrial, packaging, and protective and marine coatings.
Architectural coatings EMEA sales volumes also improved year-
over-year and sequentially versus the prior quarter.
Net Sales Volume Trends – Coatings SegmentsPPG Coatings Y-O-Y Regional Volume Trends(excl. price, currency and acquisition/divestiture impacts)
U.S. & Canada:
Asia & Latin America (emerging regions):
Europe, Middle East & Africa:
4Q 2015 Commentary Y-O-Y (versus 4Q 2014):
Sales volume growth improved year-over-year and sequentially
versus the prior quarter. Asian sales volumes were up a mid-
single-digit percentage and improvement in Mexico was
tempered by weakness in Brazil.
Business unit growth was led by automotive OEM, industrial,
aerospace, and protective and marine coatings.
5
3Q’14
4Q’14
4Q’15
1Q’15
2Q’15
3Q’15

PPG Full Year Net Sales
15,360 15,330+0.2%+0.9% -7.4%
+6.1%
$14,000
$15,000
$16,000
FY'14 Price Volume Currency Acq./Div. FY'15
Sales growth in local currencies of 7 percent, offset by foreign currency translation
United
States &
Canada
Europe
Latin
America
Asia
2015 Net Sales Mix by Major Region
46%
10%
28%
16%
6
($ in millions)
Mexico
All
Other
PPG Coatings Volume Trend*
(indexed to 2008)
-20%
1%
-15% -17%
-6%
25%
-30%
-20%
-10%
0%
10%
20%
30%
2008 2009 2010 2011 2012 2013 2014 2015U.S. & Canada Europe Emerging Regions
* As originally reported, not adjusted for segment reporting changes

2.92
3.83
4.88
5.69
$0.00
$1.50
$3.00
$4.50
$6.00
2012 2013 2014 2015
PPG Adjusted Earnings Per Diluted Share*
0.57
0.84
1.05
1.23
$0.00
$0.50
$1.00
$1.50
4Q '12 4Q '13 4Q '14 4Q '15
Results up 17% versus record prior year
* Adjusted EPS – see presentation appendix for reconciliation to reported EPS
Fourth Quarter Full Year
CAGR = 24%
7
+17%
+17%

Fourth Quarter (Y-O-Y):
Refinish volume growth at industry levels
Architectural coatings EMEA volumes continued to increase, growing by a low-single-digit percentage
Flat sales in architectural coatings Americas & Asia Pacific; increased demand in Mexico & U.S. offset weak demand in Canada, Brazil, & China
Mid-single-digit percentage volume growth in protective & marine coatings, led by protective coatings, including Comex-related synergies
Lower aerospace coatings volumes due to strong prior year and customer order patterns
Acquisition-related sales ~$120MM, primarily Comex (1 month)
Unfavorable foreign currency impact on segment sales (~$150MM) & earnings (~$15MM)
Performance Coatings
1Q, 2016 Outlook:
Aerospace coatings volume growth; normal customer order patterns, increased demand for PPG products
Recent trends continuing in automotive refinish and protective and marine coatings
Improved demand in N.A. architectural coatings partly tempered by Canada and Brazil weakness
New product/brand launch initiatives with major home centers (~$15 million) aligned with PPG’s multi-year rebranding announced in 2015
End-market conditions continue to improve in architectural EMEA
Acquisition-related sales growth of $25-to-$30MM
Unfavorable Y-O-Y foreign currency translation, less than 2015 fourth quarter at current rates
8
$MM (USD) 4Q14 4Q15 Chg % Year 2014 Year 2015 Chg %
Net Sales 2,091 2,060 -31 -2% 8,698 8,765 67 1%
Earnings 239 250 11 5% 1,205 1,302 97 8%
Margin % 11.4% 12.1% -- -- 13.9% 14.9% -- --
Select Net Sales Detail Total Volume Currency
4Q Y-O-Y Change -2% 0% -8%
Select Net Sales Detail Total Volume Currency
2015 Y-O-Y Change 1% -1% -8%

Fourth Quarter (Y-O-Y):
Mid-single-digit percentage PPG global automotive OEM volume growth:
o PPG outpaced global auto industry production growth of 4%
Industrial and specialty coatings and materials businesses returned to volume growth
o Higher volumes in all regions
Mid-single-digit percentage packaging coatings volume growth continued, aided by customer adoption of new technologies
Unfavorable foreign currency impact on segment sales (~$90MM) and earnings (~$10MM)
1Q, 2016 Outlook:
Y-O-Y global automotive OEM industry volume growth
Modest general industrial-related demand growth, varying by region and industrial sub-sector
Packaging coatings industry technology-related product conversions continue to benefit PPG
Acquisition-related sales growth $80-to-$90MM
Unfavorable Y-O-Y foreign currency translation, less than 2015 fourth quarter at current rates
Industrial Coatings
9
$MM (USD) 4Q14 4Q15 Chg % Year 2014 Year 2015 Chg %
Net Sales 1,344 1,371 27 2% 5,552 5,476 -76 -1%
Earnings 223 240 17 8% 951 985 34 4%
Margin % 16.6% 17.5% -- -- 17.1% 18.0% -- --
Select Net Sales Detail Total Volume Currency
4Q Y-O-Y Change 2% 4% -7%
Select Net Sales Detail Total Volume Currency
2015 Y-O-Y Change -1% 3% -7%
Fourth Quarter (Y-O-Y):
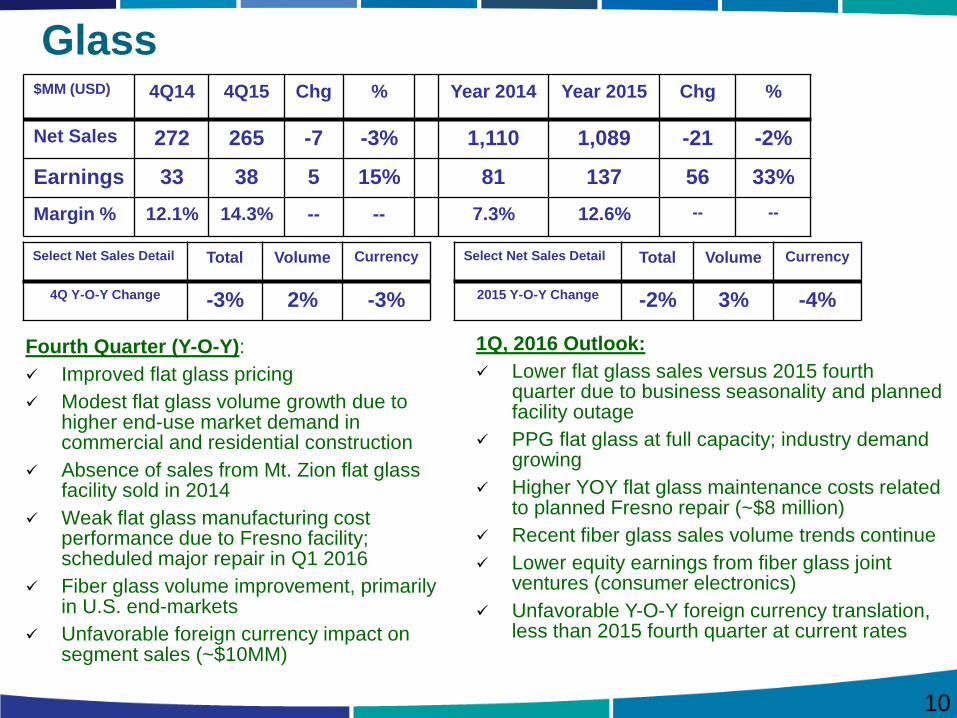
Improved flat glass pricing
Modest flat glass volume growth due to higher end-use market demand in commercial and residential construction
Absence of sales from Mt. Zion flat glass facility sold in 2014
Weak flat glass manufacturing cost performance due to Fresno facility; scheduled major repair in Q1 2016
Fiber glass volume improvement, primarily in U.S. end-markets
Unfavorable foreign currency impact on segment sales (~$10MM)
1Q, 2016 Outlook:
Lower flat glass sales versus 2015 fourth quarter due to business seasonality and planned facility outage
PPG flat glass at full capacity; industry demand growing
Higher YOY flat glass maintenance costs related to planned Fresno repair (~$8 million)
Recent fiber glass sales volume trends continue
Lower equity earnings from fiber glass joint ventures (consumer electronics)
Unfavorable Y-O-Y foreign currency translation, less than 2015 fourth quarter at current rates
Glass
10
Select Net Sales Detail Total Volume Currency
4Q Y-O-Y Change -3% 2% -3%
Select Net Sales Detail Total Volume Currency
2015 Y-O-Y Change -2% 3% -4%
$MM (USD) 4Q14 4Q15 Chg % Year 2014 Year 2015 Chg %
Net Sales 272 265 -7 -3% 1,110 1,089 -21 -2%
Earnings 33 38 5 15% 81 137 56 33%
Margin % 12.1% 14.3% -- -- 7.3% 12.6% -- --

$0
$250
$500
$750
$1,000
$1,250
$1,500
$1,750
$2,000
Cash Generated Returned toShareholders
Share
Repurchases
~$750
Dividends
~$385
Cash
From
Continuing
Operations
~$1,840
~$1,135
$385
$750$475
$400Dividends
Share Buyback
Capital Spending
Acquisitions (PurchasePrice)
Cash
$2,393
$1,745
$1,183$1,455
$0
$500
$1,000
$1,500
$2,000
$2,500
$3,000
2012 2013 2014 2015
>60% of Cash Generated from Operations
was Returned to Shareholders
2015 Cash Returned to Shareholders Cash and Short Term Investments
11
($ in millions)
Approximate 2015 Cash Uses
12
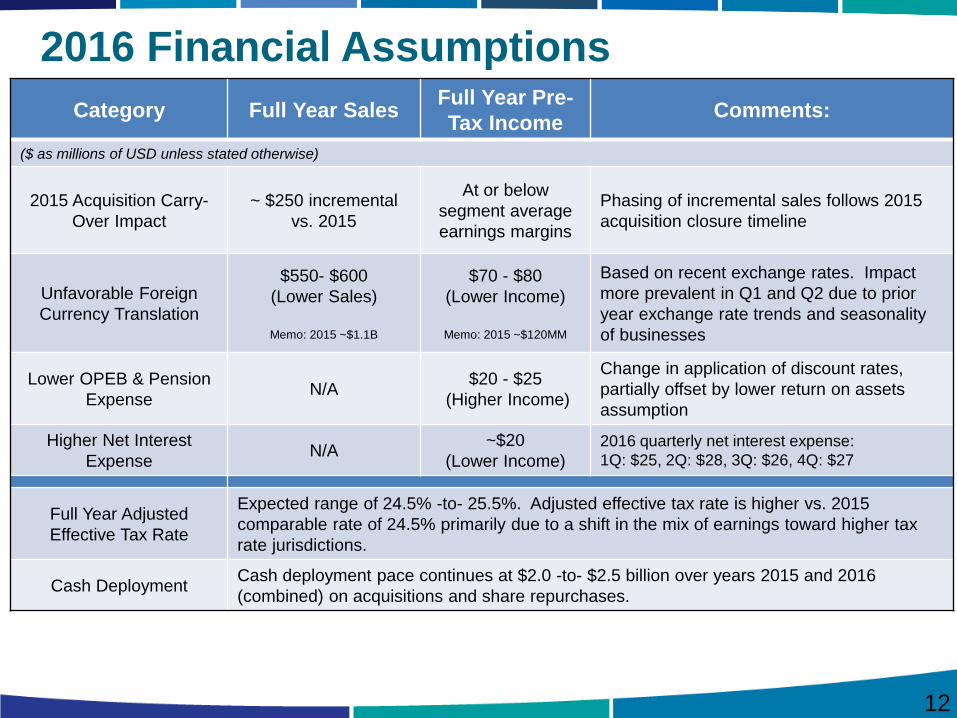
2016 Financial Assumptions
Category Full Year SalesFull Year Pre-
Tax IncomeComments:
($ as millions of USD unless stated otherwise)
2015 Acquisition Carry-
Over Impact
~ $250 incremental
vs. 2015
At or below
segment average
earnings margins
Phasing of incremental sales follows 2015
acquisition closure timeline
Unfavorable Foreign
Currency Translation
$550- $600
(Lower Sales)
Memo: 2015 ~$1.1B
$70 - $80
(Lower Income)
Memo: 2015 ~$120MM
Based on recent exchange rates. Impact
more prevalent in Q1 and Q2 due to prior
year exchange rate trends and seasonality
of businesses
Lower OPEB & Pension
ExpenseN/A
$20 - $25
(Higher Income)
Change in application of discount rates,
partially offset by lower return on assets
assumption
Higher Net Interest
ExpenseN/A
~$20
(Lower Income)
2016 quarterly net interest expense:
1Q: $25, 2Q: $28, 3Q: $26, 4Q: $27
Full Year Adjusted
Effective Tax Rate
Expected range of 24.5% -to- 25.5%. Adjusted effective tax rate is higher vs. 2015
comparable rate of 24.5% primarily due to a shift in the mix of earnings toward higher tax
rate jurisdictions.
Cash DeploymentCash deployment pace continues at $2.0 -to- $2.5 billion over years 2015 and 2016
(combined) on acquisitions and share repurchases.

2015 Full Year Summary
Robust operational and financial performance Record full-year adjusted earnings per diluted share up 17 percent year-over-year
Segment income up 14 percent in local currencies; improved results in each segment
Strong results despite unfavorable currency translation on sales ($1.1 billion) and reported pre-tax income (~$120 million)
Announced restructuring in April; initial savings realized by year end
Accretive expansion of coatings portfolio and cash deployment Successful integration of Comex acquisition; synergies on track
On pace to deliver earnings-accretive cash deployment of $2.0 -to- $2.5 billion (2015 and 2016 combined)
Bolt-on acquisitions totaled more than $400 million (purchase price)
Share repurchases of ~$750 million for 2015
Significant financial flexibility remains Record cash generation from operations of ~$1.8 billion for 2015
Returned ~60 percent of cash generated to share holders via dividends and share repurchases
Cash and short-term investments totaling ~$1.5 billion at year-end
13
Thank you for your interest in PPG Industries, Inc.
Contact Information:
Investors:
Scott Minder- (412) 434-3466
Media:
Mark Silvey - (412) 434-3046
www.ppg.comAdditional Materials and Appendix

4th Quarter Reporting Period
Adjusted EPS Reconciliation
Amounts in Millions of USD except EPS
Continued Operations Discontinued Operations Total PPGNet Income EPS Net Income EPS Net Income EPS
Year 2015
Net Income Attributable to PPG as Reported $ 314 $ 1.16 $ - $ - $ 314 $ 1.16
Transaction-related costs 11 0.04 - - 11 0.04
Equity affiliate debt refinancing charge 7 0.03 - - 7 0.03
Adjusted Net Income Attributable to PPG $ 332 $ 1.23 $ - $ - $ 332 $ 1.23
Year 2014
Net Income/(Loss) Attributable to PPG as
Reported $ 86 $ 0.31 $ (3) $ (0.01) $ 83 $ 0.30
Debt refinancing charge 200 0.72 - - 200 0.72
Transaction-related costs 36 0.13 - - 36 0.13
Favorable foreign tax ruling (29) (0.11) - - (29) (0.11)
Adjusted Net Income/(Loss) Attributable to PPG $ 293 $ 1.05 $ (3) $ (0.01) $ 290 $ 1.04
Year 2013
Net Income Attributable to PPG as Reported $ 237 $ 0.83 $ 17 $ 0.05 $ 254 $ 0.88
Transaction-related costs 3 0.01 1 0.01 4 0.02
Adjusted Net Income Attributable to PPG $ 240 $ 0.84 $ 18 $ 0.06 $ 258 $ 0.90
Year 2012
Net Income Attributable to PPG as Reported $ 175 $ 0.56 $ 52 $ 0.17 $ 227 $ 0.73
Business separation costs 3 0.01 8 0.02 11 0.03
Adjusted Net Income Attributable to PPG $ 178 $ 0.57 $ 60 $ 0.19 $ 238 $ 0.76
15

PPG Adjusted Earnings Per Share Trend Reconciliation
Amounts in Millions of USD except EPS
Adjusted EPS from Continuing Operations
Y-O-Y Change in Adjusted EPS from Continuing
Operations
Period 2011 2012 2013 2014 2015 2012 vs. 2011 2013 vs. 2012 2014 vs. 2013 2015 vs. 2014
1Q $ 0.44 $ 0.62 $ 0.69 $ 0.99 $ 1.18 $ 0.18 $ 0.07 $ 0.30 $ 0.19
2Q 0.76 0.86 1.14 1.42 1.67 0.10 0.28 0.28 0.25
3Q 0.70 0.86 1.15 1.41 1.61 0.16 0.29 0.26 0.20
4Q 0.53 0.57 .084 1.05 1.23 0.04 0.27 0.21 0.18
Full Year* $ 2.44 $ 2.92 $ 3.83 $ 4.88 $ 5.69 $ 0.48 $ 0.91 $ 1.05 $ 0.81
*Full year diluted EPS was calculated using the full year weighted average shares outstanding. As
such, the sum of the quarters may not equal the total EPS for the year.
Year over year percentage increase in EPS +20% +31% +27% +17%
16