
PPCP in water - SCIEX · PDF filequantify PPCP reproducibly at trace levels without time...
4
p 1 Quantitation and Identification of Pharmaceuticals and Personal Care Products (PPCP) in Water Samples André Schreiber and Rolf Kern AB SCIEX Concord, Ontario (Canada) and AB SCIEX Foster City, California (USA) Overview A wide range of Pharmaceuticals and Personal Care Products (PPCP) were determined in river water samples using Liquid Chromatography tandem Mass Spectrometry (LC-MS/MS). Different water samples were injected directly into the LC- MS/MS to quantify PPCP at low parts-per-trillion levels (ng/L). Multiple Reaction Monitoring was used for detection on an AB SCIEX QTRAP ® 5500 system for highest sensitivity and selectivity with the Scheduled MRM™ algorithm activated for best accuracy and reproducibility. Introduction PPCP encompass a wide range of pollutants, including Endocrine Disrupting Compounds (EDC), pesticides, hormones, antibiotics, drugs of abuse, x-ray contrast agents, drinking water disinfection by-products to name a few. In order to properly assess the effects of these compounds on our environment, it is necessary to accurately monitor their presence. The diversity of chemical properties of these compounds makes method development challenging. LC-MS/MS is able to analyze polar, semi-volatile, and thermally labile compounds covering a wide molecular weight range. In addition, state-of the-art LC-MS/MS instruments operated in selective Multiple Reaction Monitoring (MRM) mode, offer unmatched selectivity and sensitivity to quantify PPCP reproducibly at trace levels without time consuming and extensive sample preparation. 1-4 A method is presented for analyzing 80 EDC and PPCP compounds using LC-MS/MS. This method is a straight forward approach for the analysis and identification of these compounds with excellent sensitivity and ruggedness. 5 Experimental Sampling and Sample Preparation More than 70 water samples in different cities and countries from different type of waters, including drinking water, creeks, rivers, lakes, sea etc were collected by different scientist. Samples were kept frozen until analysis. Water samples were injected directly after filtration without additional cleanup. LC Separation A Dionex Ultimate 3000 Rapid Separation LC system was used with a Phenomenex LUNA 2.5u C18(2)-HST 100 x3 mm column and fast gradients of water and acetonitrile with 0.1% formic acid at a flow rate of 0.8 mL/min. An injection volume of 100 μL was used. MS/MS Detection The AB SCIEX QTRAP ® 5500 LC/MS/MS system with Turbo V™ source and Electrospray Ionization (ESI) probe was used. The mass spectrometer was operated in MRM mode using the Scheduled MRM™ algorithm. MRM mode allowed screening and quantifying targeted compounds with highest selectivity and sensitivity by monitoring the transition from the precursor ion (filtered in Q1) to a product ion (generated in a collision cell Q2 and filtered in Q3). The Scheduled MRM™ algorithm monitors transitions automatically during a short retention time window only. This allows many more MRM transitions to be monitored in a single LC run, while still maintaining maximized dwell time and optimized cycle time.
Transcript of PPCP in water - SCIEX · PDF filequantify PPCP reproducibly at trace levels without time...
p 1
Quantitation and Identification of Pharmaceuticals and Personal Care Products (PPCP) in Water Samples André Schreiber and Rolf Kern AB SCIEX Concord, Ontario (Canada) and AB SCIEX Foster City, California (USA)
Overview A wide range of Pharmaceuticals and Personal Care Products (PPCP) were determined in river water samples using Liquid Chromatography tandem Mass Spectrometry (LC-MS/MS). Different water samples were injected directly into the LC-MS/MS to quantify PPCP at low parts-per-trillion levels (ng/L). Multiple Reaction Monitoring was used for detection on an AB SCIEX QTRAP® 5500 system for highest sensitivity and selectivity with the Scheduled MRM™ algorithm activated for best accuracy and reproducibility.
Introduction PPCP encompass a wide range of pollutants, including Endocrine Disrupting Compounds (EDC), pesticides, hormones, antibiotics, drugs of abuse, x-ray contrast agents, drinking water disinfection by-products to name a few. In order to properly assess the effects of these compounds on our environment, it is necessary to accurately monitor their presence. The diversity of chemical properties of these compounds makes method development challenging. LC-MS/MS is able to analyze polar, semi-volatile, and thermally labile compounds covering a wide molecular weight range. In addition, state-of the-art LC-MS/MS instruments operated in selective Multiple Reaction Monitoring (MRM) mode, offer unmatched selectivity and sensitivity to quantify PPCP reproducibly at trace levels without time consuming and extensive sample preparation.1-4
A method is presented for analyzing 80 EDC and PPCP compounds using LC-MS/MS. This method is a straight forward approach for the analysis and identification of these compounds with excellent sensitivity and ruggedness.5
Experimental Sampling and Sample Preparation
More than 70 water samples in different cities and countries from different type of waters, including drinking water, creeks, rivers, lakes, sea etc were collected by different scientist. Samples were kept frozen until analysis.
Water samples were injected directly after filtration without additional cleanup.
LC Separation
A Dionex Ultimate 3000 Rapid Separation LC system was used with a Phenomenex LUNA 2.5u C18(2)-HST 100 x3 mm column and fast gradients of water and acetonitrile with 0.1% formic acid at a flow rate of 0.8 mL/min. An injection volume of 100 µL was used.
MS/MS Detection
The AB SCIEX QTRAP® 5500 LC/MS/MS system with Turbo V™ source and Electrospray Ionization (ESI) probe was used. The mass spectrometer was operated in MRM mode using the Scheduled MRM™ algorithm. MRM mode allowed screening and quantifying targeted compounds with highest selectivity and sensitivity by monitoring the transition from the precursor ion (filtered in Q1) to a product ion (generated in a collision cell Q2 and filtered in Q3). The Scheduled MRM™ algorithm monitors transitions automatically during a short retention time window only. This allows many more MRM transitions to be monitored in a single LC run, while still maintaining maximized dwell time and optimized cycle time.
p 2
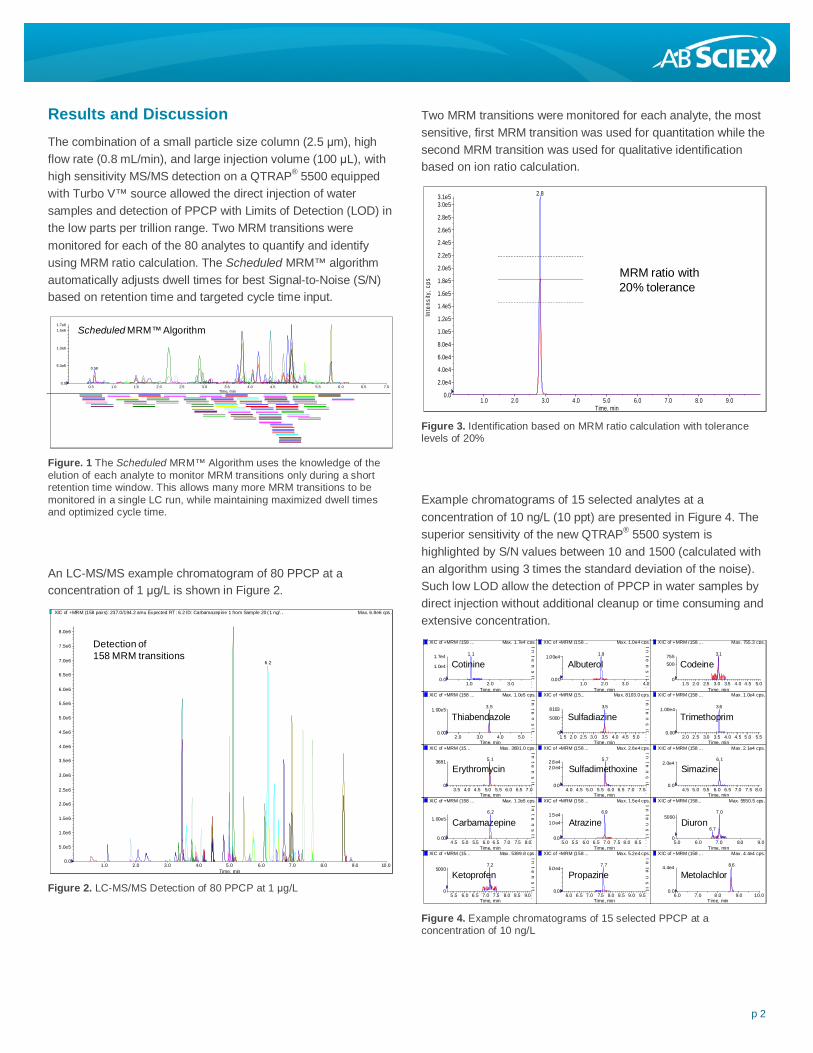
Results and Discussion The combination of a small particle size column (2.5 μm), high flow rate (0.8 mL/min), and large injection volume (100 μL), with high sensitivity MS/MS detection on a QTRAP® 5500 equipped with Turbo V™ source allowed the direct injection of water samples and detection of PPCP with Limits of Detection (LOD) in the low parts per trillion range. Two MRM transitions were monitored for each of the 80 analytes to quantify and identify using MRM ratio calculation. The Scheduled MRM™ algorithm automatically adjusts dwell times for best Signal-to-Noise (S/N) based on retention time and targeted cycle time input.
Figure. 1 The Scheduled MRM™ Algorithm uses the knowledge of the elution of each analyte to monitor MRM transitions only during a short retention time window. This allows many more MRM transitions to be monitored in a single LC run, while maintaining maximized dwell times and optimized cycle time.
An LC-MS/MS example chromatogram of 80 PPCP at a concentration of 1 μg/L is shown in Figure 2.
Figure 2. LC-MS/MS Detection of 80 PPCP at 1 μg/L
Two MRM transitions were monitored for each analyte, the most sensitive, first MRM transition was used for quantitation while the second MRM transition was used for qualitative identification based on ion ratio calculation.
Figure 3. Identification based on MRM ratio calculation with tolerance levels of 20%
Example chromatograms of 15 selected analytes at a concentration of 10 ng/L (10 ppt) are presented in Figure 4. The superior sensitivity of the new QTRAP® 5500 system is highlighted by S/N values between 10 and 1500 (calculated with an algorithm using 3 times the standard deviation of the noise). Such low LOD allow the detection of PPCP in water samples by direct injection without additional cleanup or time consuming and extensive concentration.
Figure 4. Example chromatograms of 15 selected PPCP at a concentration of 10 ng/L
0.5 1.0 1.5 2.0 2.5 3.0 3.5 4.0 4.5 5.0 5.5 6.0 6.5 7.0Time, min
0.0
5.0e5
1.0e6
1.5e61.7e6
0.58
Scheduled MRM™ Algorithm
XIC of +MRM (158 pairs): 237.0/194.2 amu Expected RT: 6.2 ID: Carbamazepine 1 from Sample 20 (1 ng/. .. Max. 6.8e6 cps .
1.0 2.0 3.0 4.0 5.0 6.0 7.0 8.0 9.0 10.0Time, min
0.0
5.0e5
1.0e6
1.5e6
2.0e6
2.5e6
3.0e6
3.5e6
4.0e6
4.5e6
5.0e6
5.5e6
6.0e6
6.5e6
7.0e6
7.5e6
8.0e6
6.2
Detection of 158 MRM transitions
1.0 2.0 3.0 4.0 5.0 6.0 7.0 8.0 9.0Time, min
0.0
2.0e4
4.0e4
6.0e4
8.0e4
1.0e5
1.2e5
1.4e5
1.6e5
1.8e5
2.0e5
2.2e5
2.4e5
2.6e5
2.8e5
3.0e53.1e5
Inte
nsity
, cps
2.8
MRM ratio with20% tolerance
XIC of +MRM (158 ... Max. 1.7e4 cps.
1.0 2.0 3.0Time, min
0.0
1.0e4
1.7e4 1.1
XIC of +MRM (158 ... Max. 1.0e4 cps.
1.0 2.0 3.0 4.0Time, min
0.00
1.00e4
In
te
ns
it...
1.9
XIC of +MRM (158 .. . Max. 755.3 cps.
1.5 2.0 2.5 3.0 3.5 4.0 4.5 5.0Time, min
0
500755
In
te
ns
it...
3.1
XIC of +MRM (158 ... Max. 1.0e5 cps.
2 .0 3.0 4.0 5.0Time, min
0.00
1.00e53.5
XIC of +MRM (15... Max. 8103.0 cps.
1.5 2.0 2.5 3.0 3.5 4.0 4.5 5.0Time, min
0
5000
8103
Int
en
sit
...
3.5
XIC of +MRM (158 .. . Max. 1.0e4 cps.
2.0 2.5 3.0 3.5 4.0 4.5 5 .0 5.5Time, min
0.00
1.00e4
In
te
ns
it...
3.6
XIC of +MRM (15... Max. 3681.0 cps.
3.5 4.0 4.5 5.0 5.5 6.0 6.5 7.0Time, min
0
3681 5.1
XIC of +MRM (158 ... Max. 2.6e4 cps.
4.0 4.5 5.0 5.5 6.0 6.5 7.0 7.5Time, min
0.0
2.0e42.6e4
Int
en
sit.
..
5.7
XIC of +MRM (158 .. . Max. 2.1e4 cps.
4.5 5.0 5.5 6.0 6.5 7.0 7.5 8.0Time, min
0.0
2.0e4
In
ten
sit.
..
6.1
XIC of +MRM (158 ... Max. 1.2e5 cps.
4.5 5.0 5.5 6.0 6.5 7.0 7.5 8.0Time, min
0.00
1.00e56.2
XIC of +MRM (158 ... Max. 1.5e4 cps.
5.0 5.5 6.0 6.5 7.0 7.5 8.0 8.5Time, min
0.0
1.0e4
1.5e4
Int
en
sit
...
6.9
XIC of +MRM (158... Max. 5550.5 cps.
5.0 6.0 7.0 8.0 9.0Time, min
0
5000
In
ten
sit.
..
7.0
6.7
XIC of +MRM (15... Max. 5399.8 cps.
5.5 6.0 6.5 7.0 7.5 8.0 8.5 9.0Time, min
0
50007.2
XIC of +MRM (158 ... Max. 5.2e4 cps.
6.0 6.5 7.0 7.5 8.0 8.5 9.0 9.5Time, min
0.0
5.0e4
Int
en
sit...
7.7
XIC of +MRM (158 .. . Max. 4.4e4 cps.
6.0 7.0 8.0 9.0 10.0Time, min
0.0
4.4e4
In
ten
sit.
..
8.6
Cotinine Albuterol Codeine
Thiabendazole Sulfadiazine Trimethoprim
Erythromycin Sulfadimethoxine Simazine
Carbamazepine Atrazine Diuron
Ketoprofen Propazine Metolachlor

p 3
Figure 5. Quantitation of PPCP in different water samples, A: sample from an agricultural area, B: sample from a farmland drain, C: sample from an urban area
The developed LC-MS/MS method was used to screen collected water samples. Results of quantified PPCP are shown in Figure 3 A-C. All findings were identified by comparing the MRM ratio of the unknown sample with the average MRM ratio of standard injections.
Figure 6 shows the quantitative results of Benzoylecgonine, a metabolite of Cocaine, in the studied water samples. All drinking water samples had a concentration of benzoylecgonine below 5 ng/L. As expected, Benzoylecgonine was found in rivers running through major cities at concentrations of up to 200 ng/L indicating the abuse of cocaine. The concentration of Benzoylecgonine in water samples collected in less urban and wilderness areas was much lower with the exception of one creek and one lake in popular vacation destinations. The concentration of benzoylecgonine reflects the amount collectively excreted in urine and can be used the estimate drug consumption. Also when analyzed over time drug consumption habits can be investigated.6
Figure 6. Findings of Benzoylecgonine, a metabolite of cocaine and indicative for cocaine abuse, in various water samples
XIC of +MRM (158 pairs): 237.0/194.2 amu Expected RT: 6.2 ID: Carbamazepine 1 from Sample 35 (Agric... Max. 1.4e5 cps.
1.0 2.0 3.0 4.0 5.0 6.0 7.0 8.0 9.0 10.0Time, min
0.0
5000.0
1.0e4
1.5e4
2.0e4
2.5e4
3.0e4
3.5e4
4.0e4
4.5e4
5.0e4
5.5e4
6.0e4
6.5e4
7.0e4
7.5e4
8.0e4
8.5e4
9.0e4
9.5e4
1.0e5
1.1e5
1.1e5
1.2e5
1.2e5
1.3e5
1.3e5
1.4e56.2
36ppt Atrazine
10ppt Carbamazepine
3ppt Cotinine 3ppt Diuron
5ppt Metolachlor3ppt Simazine
1ppt Sulfadimethoxazine
A
XIC of +MRM (158 pairs): 216.1/96.1 amu Expected RT: 6.9 ID: Atrazine 2 from Sample 37 (Farmland Drai... Max. 1.1e5 cps.
1.0 2.0 3.0 4.0 5.0 6.0 7.0 8.0 9.0 10.0Time, min
0.00
5000.00
1.00e4
1.50e4
2.00e4
2.50e4
3.00e4
3.50e4
4.00e4
4.50e4
5.00e4
5.50e4
6.00e4
6.50e4
7.00e4
7.50e4
8.00e4
8.50e4
9.00e4
9.50e4
1.00e5
1.05e5
1.10e51.13e5 6.9
70ppt Atrazine
6ppt Metolachlor2ppt
Sulfadimethoxazine
2pptPropazine
B
XIC of +MRM (158 pairs): 216.1/96.1 amu Expected RT: 6.9 ID: Atrazine 2 from Sample 36 (Urban) of 200... Max. 1.9e4 cps.
1.0 2.0 3.0 4.0 5.0 6.0 7.0 8.0 9.0 10.0Time, min
0.00
5000.00
1.00e4
1.50e4
2.00e4
2.50e4
3.00e4
3.50e4
4.00e4
4.50e4
5.00e4
5.50e4
6.00e4
6.50e4
7.00e4
7.50e4
8.00e4
8.50e4
9.00e4
9.50e4
1.00e5
1.05e5
1.10e5
1.15e5
6.9
7.26.96.6
C
10ppt Atrazine
200ppt Cotinine
5ppt Metolachlor
2ppt Simazine1ppt Thiabendazole
420ppt Caffeine
NCH3O
OH
O
O
NCH3O
O
O
CH3
O
Cocaine Benzoylecgonine (BE)
Metabolism
0.00
0.03
0.05
0.08
0.10
0.13
0.15
0.18
0.20
BE C
onc
entr
atio
n (p
pt)
Sample
Standard 0.1µg/L
Drinking water
Rivers
CreeksDresden
Philadelphia
Santa Fe
Vienna
Berlin
RioRom Toronto
Canoe Lake (Algonquin)Lake Zürich
Zermatt
LakesTorino
Winnipeg

For Research Use Only. Not for use in diagnostic procedures.
© 2010 AB SCIEX. The trademarks mentioned herein are the property of AB Sciex Pte. Ltd. or their respective owners. AB SCIEX™ is being used under license.
Publication number: 1790210-01 Headquarters International Sales 353 Hatch Drive Foster City CA 353 Hatch Drive Foster City CA 94404 USA For our office locations please call the division Phone 650-638-5800 headquarters or refer to our website at www.absciex.com www.absciex.com/offices
Figure 7 shows the quantitative results of Atrazine in the studied water samples. The herbicide was found in two river samples collected in Canada at a concentration above 100 ng/L. Atrazine was detected in several water samples, including drinking water, in samples, collected throughout the world at concentrations above 10 ng/L. Atrazine was also found in a river water sample from Italy at a concentration of 12 ng/L although Atrazine is banned in the European Union.
Figure 7. Findings of the herbicide Atrazine in various water samples
Summary A method using fast LC coupled MS/MS using the Scheduled MRM™ algorithm for the quantitation of 80 PPCP in environmental water samples was developed and successfully applied to real samples.
The AB SCIEX QTRAP® 5500 system operated in MRM mode offers superior selectivity and sensitivity allowing the direct injection of water to quantify PPCP with Limits of Detection in the low ppt range. Quantified compounds were further identified using a quantifier and qualifier ratio.
As an example, results of findings of benzoylecgonine, a cocaine metabolite, and Atrazine were discussed.
Acknowledgement The authors would like to thank colleagues of AB SCIEX for collecting water samples all over the world during their vacation or while attending conferences.
References 1 Brett J. Vanderford et al.: ‘Analysis of Endocrine Disruptors,
Pharmaceuticals, and Personal Care Products in Water Using Liquid Chromatography/Tandem Mass Spectrometry’ Anal. Chem. 75 (2003) 6265-6274
2 Paul E. Stackelberg et al.: ‘Persistence of pharmaceutical compounds and other organic wastewater contaminants in a conventional drinking-water-treatment plant’ Science of the Total Environment 329 (2004) 99-113
3 Susan D. Richardson and Thomas Ternes: ‘Water Analysis: Emerging Contaminants and Current Issues’ Anal. Chem. 77 (2005) 3807-3838
4 M. Gros et al.: ‘Tracing Pharmaceutical Residues of Different Therapeutic Classes in Environmental Waters by Using Liquid Chromatography/Quadrupole-Linear Ion Trap Mass Spectrometry and Automated Library Searching’ Anal. Chem. 81/3 (2009) 898-912
5 A. Schreiber et al.: ‘Accelerated LC/MS/MS for the Quantitation and Identification of Pharmaceuticals and Personal Care Products (PPCP) in Water Samples’ Poster presentation (2009) Pittcon, Chicago
6 S. Castiglioni et al.: ‘Mass spectrometric analysis of illicit drugs in wastewater and surface water’ Mass Spectrometry Reviews 27 (2008) 378-394
0.000
0.020
0.040
0.060
0.080
0.100
0.120
0.140
Atr
azin
e Co
nce
ntra
tion
(pp
t)
Sample
Standard 0.1µg/L
Drinking water
Rivers
Creeks Lakes
(Highest # of samples)
(Only 2 samples)
(Only 2 samples)
(Atrazine is banned in EU.)


![SCIENCECHINA Chemistry · indispensable way to reproducibly synthesize structurally ... concept in polymer science [35], 2D “oligomers” can be introducedhereto representthelinkbetweenthe“mono-](https://static.fdocuments.us/doc/165x107/5f6de5e8c34ced2b2f3b41db/sciencechina-chemistry-indispensable-way-to-reproducibly-synthesize-structurally.jpg)