PPAC Book for website - Home:Petroleum Planning & …€¦ · To prepare periodic reports on...
93
Transcript of PPAC Book for website - Home:Petroleum Planning & …€¦ · To prepare periodic reports on...


VisionTo be the most authentic official source for data and policy analysis on the hydrocarbon sector in the country.
Mission1. To strengthen the existing data system in PPAC by adopting the latest techniques
and best practices.2. To render effective assistance to the Ministry of Petroleum & Natural Gas in the
discharge of its responsibilities, particularly pricing of petroleum products and administration of subsidy schemes.
3. To monitor and analyze developments in the domestic oil and gas sector.4. To undertake analysis of domestic and international energy markets.5. To develop a cooperative framework for exchange of information and conduct of
studies with other countries and international organizations in the energy sector.
Objectives1. To ensure effective administration of the subsidy schemes notified by the
Government2. To monitor and analyze trends in prices of crude oil, petroleum products and
natural gas and their impact on the oil companies and consumers, and prepare appropriate technical inputs for policy making.
3. To monitor developments in the domestic market and analyze options for policy changes in pricing, transportation and distribution of petroleum products.
4. To collect, compile and disseminate data on the domestic oil and gas sector in a continuous manner and maintain the data bank.
5. To ensure quality of data in terms of prescribed parameters such as accuracy, completeness and timeliness.
6. To prepare periodic reports on various aspects of oil and gas sector.
Petroleum Planning & Analysis Cell(Ministry of Petroleum & Natural Gas)
Vision & MissionVision &i i &

CHAPTER NO. TITLE PAGE NO.
1 GENERAL
Selected indicators of the Indian economy 2
Global energy consumption 3
2 EXPLORATION & CRUDE OIL PRODUCTION
Crude oil proved reserves 5
Crude oil production 6
Crude oil consumption 7
Crude oil: Refinery capacities 8
Indigenous crude oil production 9
Self sufficiency in petroleum products 9
Status of blocks under NELP 10
Hydrocarbon reserves in India 10
Domestic oil & gas production vis a vis overseas production 10
Coal Bed Methane (CBM) Gas development in India 11
Status of shale gas and oil development in India 11
3 NATURAL GAS
World top 30 natural gas reserve countries 13
World top 30 natural gas producing countries 14
World top 30 natural gas consuming countries 15
Natural gas at a glance 16
PNG data 16
CNG activities in India 17
CNG stations and vehicles 17
LNG terminals (Operational) 18
Domestic natural gas price and gas price ceiling 18
4 REFINING & PRODUCTION
Map of refineries in India 20
Simplified block flow diagram of a typical refinery 21
Refineries: Installed capacity and crude oil processing 22
High Sulphur (HS) & Low Sulphur (LS) crude oil processing 22
Imported crude & indigenous crude oil processing 22
Production of petroleum products 23
Production of petroleum products: All sources 24
Production vs consumption of petroleum products 24
Gross Refining Margins (GRM) of refineries 25
GRM of North East refineries excluding excise duty benefit 26
Distillate yield of PSU refineries 26
Fuel and Loss 27
Specific energy consumption (MBN number) of PSU refineries 27
Import / export of crude oil and petroleum products 28
Exchange rates of Indian rupee (`) 29
CONTENTS

CHAPTER NO. TITLE PAGE NO.
5 MAJOR PIPELINES IN INDIA
Map of pipeline network in India 31
Gas pipeline network 32
Gas pipeline under execution/construction 33
Major crude oil pipelines in India 34
Major petroleum products pipelines in India 35
6 SALES
Consumption of petroleum products 37
Petroleum products demand & Gross Domestic Product (GDP) during Plan periods End use analysis of HSD sales & diesel consumption by sectors
37
State-wise sales of selected petroleum products 38
PDS SKO allocation 39
Oil industry Retail Outlets & SKO / LDO agencies 40
Category wise retail outlets and SKO / LDO agencies 41
Industry marketing infrastructure 42
Break-up of petroleum products consumption data (PSU and Private) 42
7 LPG
LPG marketing at a glance 44
Number of LPG distributors 45
LPG domestic customer population (registered) of PSU OMCs 46
LPG coverage (estimated) 47
LPG domestic customers enrolment (14.2 kg/5 kg) by PSU OMCs 48
8 PRICES AND TAXES
Price of crude oil in India 50
Chart: Trend in prices of international benchmark crude oils 51
Chart: Trend in price of Indian basket crude oil and petroleum products in international markets 52
Price build-up of PDS kerosene at Mumbai 53
Element wise explanation of price build up of PDS kerosene 54
Price build-up of domestic LPG at Delhi 55
Element wise explanation of price build up of domestic LPG 56
Summarised buildup of Retail Selling Price (RSP) of petrol at Delhi 57
Summarised buildup of Retail Selling Price (RSP) of diesel at Delhi 57
Summarised buildup of Retail Selling Price (RSP) of PDS kerosene at Mumbai 58
Summarised buildup of Retail Selling Price (RSP) of domestic LPG at Delhi 58
Share of taxes in Retail Selling Price (RSP) of petroleum products: Petrol 59
Share of taxes in Retail Selling Price (RSP) of petroleum products: Diesel 59
Break up of current excise duty on petrol & diesel 59
Share of taxes in RSP of PDS kerosene 60
Share of taxes in RSP of domestic LPG 60
Weightage of petroleum products in Wholesale Price Index (WPI) 61
Estimated impact of increase in Retail Selling Price (RSP) of major petroleum products on inflation (WPI index)
61
Important terms in pricing of petroleum products 62
Dealer's /distributor’s commission on petrol & diesel 62
CHAPTER NO. TITLE PAGE NO.
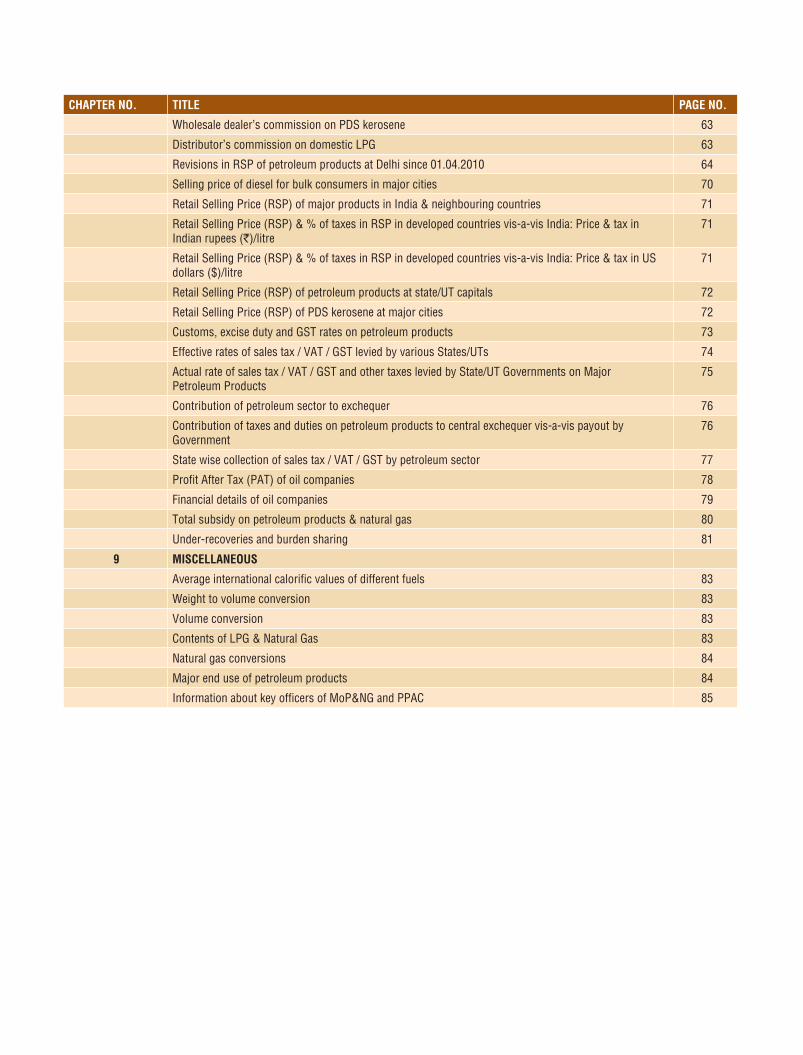
Wholesale dealer's commission on PDS kerosene 63
Distributor's commission on domestic LPG 63
Revisions in RSP of petroleum products at Delhi since 01.04.2010 64
Selling price of diesel for bulk consumers in major cities 70
Retail Selling Price (RSP) of major products in India & neighbouring countries 71
Retail Selling Price (RSP) & % of taxes in RSP in developed countries vis-a-vis India: Price & tax in Indian rupees (`)/litre
71
Retail Selling Price (RSP) & % of taxes in RSP in developed countries vis-a-vis India: Price & tax in US dollars ($)/litre
71
Retail Selling Price (RSP) of petroleum products at state/UT capitals 72
Retail Selling Price (RSP) of PDS kerosene at major cities 72
Customs, excise duty and GST rates on petroleum products 73
Effective rates of sales tax / VAT / GST levied by various States/UTs 74
Actual rate of sales tax / VAT / GST and other taxes levied by State/UT Governments on Major Petroleum Products
75
Contribution of petroleum sector to exchequer 76
Contribution of taxes and duties on petroleum products to central exchequer vis-a-vis payout by Government
76
State wise collection of sales tax / VAT / GST by petroleum sector 77
Profit After Tax (PAT) of oil companies 78
Financial details of oil companies 79
Total subsidy on petroleum products & natural gas 80
Under-recoveries and burden sharing 81
9 MISCELLANEOUS
Average international calorific values of different fuels 83
Weight to volume conversion 83
Volume conversion 83
Contents of LPG & Natural Gas 83
Natural gas conversions 84
Major end use of petroleum products 84
Information about key officers of MoP&NG and PPAC 85

PPAC Ready Reckoner
1

PPAC Ready Reckoner
2
General
Sl.no.
Particulars Source Unit/ Base 2013-14 2014-15 2015-16 2016-17 Apr-Sep 2016
Apr-Sep 2017 (P)
1 Population (as on 1st March 2011) Census of India Billion 1.2 - - - - -
2 GDP at factor cost (constant prices) MOC&I (GR.%) 6.4 7.5 8.0 7.1(PE)
7.9(Q1)
5.7(Q1) (E)
3 Agricultural production (foodgrains) MoAMillion tonne 265.0 252.0 251.6 275.7
(4th AE)135.0(1st AE)
134.7(1st AE)
(GR.%) 3.1 -4.9 -0.2 9.6 8.9 -0.3
4 Index of Industrial Production* MOSPI (GR.%)2011-12=100
3.3 4.0 3.3 4.6 5.8 2.5
5 Imports MOC&I $ Billion 450.2 448.0 381.0 384.4 175.3 219.3
6 Exports MOC&I $ Billion 314.4 310.3 262.3 275.9 132.0 147.2
7 Trade balance MOC&I $ Billion -135.8 -137.7 -118.7 -108.5 -43.4 -72.1
8 Wholesale Price Index (all commodities) (average) MOC&I 2011-12=100 112.5 113.9 109.7 111.6 110.9 113.6
9 All India Consumer Price Index (average):
i) Industrial workersLabour Bureau, Govt. of India
2001=100 236.0 250.8 265.0 275.9 276.3 281.7
ii) Agricultural labourers 1986-87=100 749.8 799.5 834.9 869.8 867.2 881.7
iii) Rural labourers 1986-87=100 750.5 802.2 839.4 875.0 872.2 887.8
10 Foreign exchange reserves- Total# RBI $ Billion 303.7 341.4 355.6 370.0 372.0 399.7
11 Outstanding external liabilities (as of end of financial year)
MOF ` Crore 1,84,581 1,97,514 2,10,262 2,25,135(RE)
- 2,40,924(BE)
12 Outstanding internal debt (as of end of financial year)
MOF ` Crore 54,84,548 60,44,707 66,91,409 72,15,439(RE)
- 77,21,782(BE)
13 Central plan outlay MOF ` Crore 6,03,573(Actual)
4,20,882(Actual)
- - - -
14 Centrally Sponsored Schemes & other transfers MOF ` Crore 3,41,630(Actual)
3,97,696(RE)
4,23,328(BE)
15 Gross fiscal deficit MOF % -4.5 -4.1 -3.9 -3.5(RE)
- -3.2(BE)
PetroleumSl. no. Particulars Source Unit/ Base 2013-14 2014-15 2015-16 2016-17 Apr-Sep 2016 Apr-Sep 2017 (P)
1 Crude oil production in India ONGC/OIL/DGH MMT 37.8 37.5 36.9 36.0 18.1 18.0
2 Consumption of petroleum products in India OMCs/PPAC MMT 158.4 165.5 184.7 194.6 97.2 98.7
3 Petroleum products production in India Oil Cos MMT 220.7 221.1 231.9 243.5 120.1 122.7
4 Imports & exports
Crude oil imports Oil Cos $ Billion 143.0 112.7 64.0 70.2 32.2 37.6
Petroleum products imports Oil Cos & DGCIS $ Billion 12.5 12.1 10.0 10.6 4.8 6.0
Total petroleum imports (crude oil + petroleum products)
Oil Cos & DGCIS $ Billion 155.4 124.9 73.9 80.8 37.0 43.5
Petroleum products exports Oil Cos $ Billion 60.7 47.3 27.1 29.0 13.5 15.5
5 Gross petroleum imports as % of India's gross imports in value terms
MOC&I/PPAC % 34.5 27.9 19.4 21.0 21.1 19.8
6 Gross petroleum exports as % of India's gross exports in value terms
MOC&I/PPAC % 19.3 15.2 10.3 10.5 10.2 10.5
7 Import dependency (based on consumption) PPAC % 77.3 78.3 80.6 81.7 81.9 82.3
Natural gas
Sl. no. Particulars Source Unit/ Base 2013-14 2014-15 2015-16 2016-17(P) Apr-Sep 2016 Apr-Sep 2017
1 Gross Production ONGC/OIL/DGH MMSCMD 97.0 92.2 88.1 87.4 85.9 89.7
2 Net Production (net of flare and loss) ONGC/OIL/DGH MMSCMD 94.7 89.6 85.1 84.5 83.0 87.2
3 *LNG Import LNG importing Cos MMSCMD 47.1 50.8 58.4 67.6 69.1 68.0
4 Total Consumption including internal use (Net Production+ LNG import)
MMSCMD 141.8 140.4 143.5 152.1 152.1 155.2
5 Import dependency (based on consumption) PPAC % 33.2 36.2 40.7 44.5 45.4 43.8
Table 1.1 : Selected indicators of the Indian economy
Note : *LNG imports include both term and spot cargo, MMSCMD : Million Standard Cubic Meter per Day
Note : (P): Provisional, *Revision in base year of all India index of Industrial Production from 2004-05 to 2011-12, #as of March 28, 2014, March 27, 2015, March 25, 2016, March 31, 2017, Sep 30, 2016 & Sep 29, 2017, RBI: Reserve Bank of India, MoF: Ministry of Finance, MOC&I: Ministry of Commerce & Industry, MoA: Ministry of Agriculture, E: Estimates, PE: Provisional Estimates, BE: Budget Estimate; AE: Advance Estimates, RE: Revised Estimates, MOSPI- Ministry of Statistics and Programme Implementation
Note : OMCs: Oil Marketing Companies, PPAC: Petroleum Planning & Analysis Cell
PPAC Ready Reckoner
3
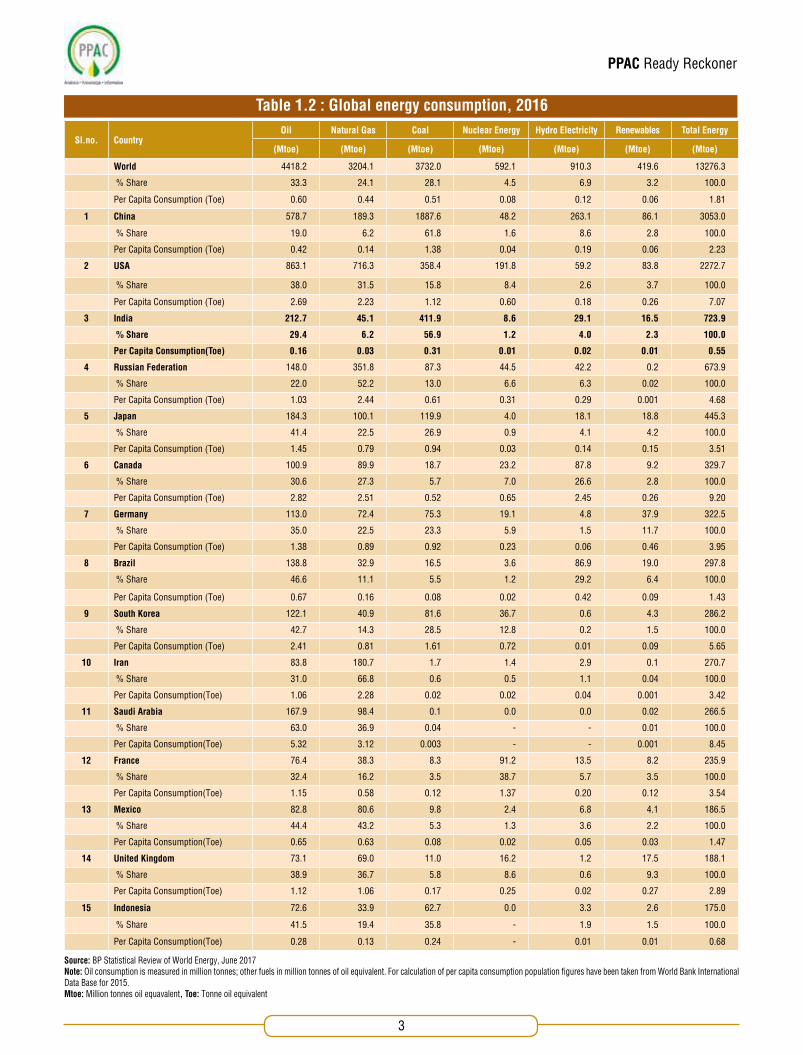
Source: BP Statistical Review of World Energy, June 2017 Note: Oil consumption is measured in million tonnes; other fuels in million tonnes of oil equivalent. For calculation of per capita consumption population figures have been taken from World Bank International Data Base for 2015. Mtoe: Million tonnes oil equavalent, Toe: Tonne oil equivalent
Sl.no. CountryOil Natural Gas Coal Nuclear Energy Hydro Electricity Renewables Total Energy
(Mtoe) (Mtoe) (Mtoe) (Mtoe) (Mtoe) (Mtoe) (Mtoe)
World 4418.2 3204.1 3732.0 592.1 910.3 419.6 13276.3
% Share 33.3 24.1 28.1 4.5 6.9 3.2 100.0
Per Capita Consumption (Toe) 0.60 0.44 0.51 0.08 0.12 0.06 1.81
1 China 578.7 189.3 1887.6 48.2 263.1 86.1 3053.0
% Share 19.0 6.2 61.8 1.6 8.6 2.8 100.0
Per Capita Consumption (Toe) 0.42 0.14 1.38 0.04 0.19 0.06 2.23
2 USA 863.1 716.3 358.4 191.8 59.2 83.8 2272.7
% Share 38.0 31.5 15.8 8.4 2.6 3.7 100.0
Per Capita Consumption (Toe) 2.69 2.23 1.12 0.60 0.18 0.26 7.07
3 India 212.7 45.1 411.9 8.6 29.1 16.5 723.9
% Share 29.4 6.2 56.9 1.2 4.0 2.3 100.0
Per Capita Consumption(Toe) 0.16 0.03 0.31 0.01 0.02 0.01 0.55
4 Russian Federation 148.0 351.8 87.3 44.5 42.2 0.2 673.9
% Share 22.0 52.2 13.0 6.6 6.3 0.02 100.0
Per Capita Consumption (Toe) 1.03 2.44 0.61 0.31 0.29 0.001 4.68
5 Japan 184.3 100.1 119.9 4.0 18.1 18.8 445.3
% Share 41.4 22.5 26.9 0.9 4.1 4.2 100.0
Per Capita Consumption (Toe) 1.45 0.79 0.94 0.03 0.14 0.15 3.51
6 Canada 100.9 89.9 18.7 23.2 87.8 9.2 329.7
% Share 30.6 27.3 5.7 7.0 26.6 2.8 100.0
Per Capita Consumption (Toe) 2.82 2.51 0.52 0.65 2.45 0.26 9.20
7 Germany 113.0 72.4 75.3 19.1 4.8 37.9 322.5
% Share 35.0 22.5 23.3 5.9 1.5 11.7 100.0
Per Capita Consumption (Toe) 1.38 0.89 0.92 0.23 0.06 0.46 3.95
8 Brazil 138.8 32.9 16.5 3.6 86.9 19.0 297.8
% Share 46.6 11.1 5.5 1.2 29.2 6.4 100.0
Per Capita Consumption (Toe) 0.67 0.16 0.08 0.02 0.42 0.09 1.43
9 South Korea 122.1 40.9 81.6 36.7 0.6 4.3 286.2
% Share 42.7 14.3 28.5 12.8 0.2 1.5 100.0
Per Capita Consumption (Toe) 2.41 0.81 1.61 0.72 0.01 0.09 5.65
10 Iran 83.8 180.7 1.7 1.4 2.9 0.1 270.7
% Share 31.0 66.8 0.6 0.5 1.1 0.04 100.0
Per Capita Consumption(Toe) 1.06 2.28 0.02 0.02 0.04 0.001 3.42
11 Saudi Arabia 167.9 98.4 0.1 0.0 0.0 0.02 266.5
% Share 63.0 36.9 0.04 - - 0.01 100.0
Per Capita Consumption(Toe) 5.32 3.12 0.003 - - 0.001 8.45
12 France 76.4 38.3 8.3 91.2 13.5 8.2 235.9
% Share 32.4 16.2 3.5 38.7 5.7 3.5 100.0
Per Capita Consumption(Toe) 1.15 0.58 0.12 1.37 0.20 0.12 3.54
13 Mexico 82.8 80.6 9.8 2.4 6.8 4.1 186.5
% Share 44.4 43.2 5.3 1.3 3.6 2.2 100.0
Per Capita Consumption(Toe) 0.65 0.63 0.08 0.02 0.05 0.03 1.47
14 United Kingdom 73.1 69.0 11.0 16.2 1.2 17.5 188.1
% Share 38.9 36.7 5.8 8.6 0.6 9.3 100.0
Per Capita Consumption(Toe) 1.12 1.06 0.17 0.25 0.02 0.27 2.89
15 Indonesia 72.6 33.9 62.7 0.0 3.3 2.6 175.0
% Share 41.5 19.4 35.8 - 1.9 1.5 100.0
Per Capita Consumption(Toe) 0.28 0.13 0.24 - 0.01 0.01 0.68
Table 1.2 : Global energy consumption, 2016
PPAC Ready Reckoner
4

PPAC Ready Reckoner
5
Sl.no. CountryAt the end 2016
Thousand million tonnes Thousand million barrels Reserves /Production ratio
1 Venezuela 47.0 300.9 341.12 Saudi Arabia 36.6 266.5 59.03 Canada 27.6 171.5 105.14 Iran 21.8 158.4 94.15 Iraq 20.6 153.0 93.66 Russian Federation 15.0 109.5 26.67 Kuwait 14.0 101.5 88.08 United Arab Emirates 13.0 97.8 65.69 US 6.3 48.4 310.110 Libya 5.8 48.0 10.611 Nigeria 5.0 37.1 49.312 Kazakhstan 3.9 30.0 49.013 Qatar 3.5 25.7 17.514 China 2.6 25.2 36.315 Brazil 1.8 12.6 13.316 Angola 1.6 11.6 17.517 Algeria 1.5 12.2 21.118 Mexico 1.2 8.0 40.119 Ecuador 1.1 8.0 8.920 Norway 1.0 7.0 23.121 Azerbaijan 0.9 7.6 10.422 India 0.7 5.4 14.623 Oman 0.6 4.7 14.924 Vietnam 0.6 4.4 36.225 Indonesia 0.5 3.7 43.226 South Sudan 0.5 3.5 80.927 Malaysia 0.5 3.6 14.028 Egypt 0.5 3.5 13.729 Australia 0.5 3.3 10.330 Yemen 0.4 4.0 30.3
Sub total 236.6 1676.3Others 4.1 30.3Total World 240.7 1706.7 50.6of which: OECD 36.6 244.0 28.8 Non-OECD 204.1 1462.7 57.9 OPEC 171.2 1220.5 84.7 Non-OPEC 69.6 486.2 25.2
European Union 0.7 5.1 9.3Commonwealth of Independent States (CIS)
20.1 148.2 28.6
Canadian oil sands: Total 26.9 165.3of which: Under active development 3.9 24.0 Venezuela: Orinoco Belt 35.7 222.3
Table 2.1 : Crude oil proved reserves
Source: BP Statistical review of World Energy, June 2017 which includs data from ICIS. Note: Total proved reserves of oil - Generally taken to be those quantities that geological and engineering information indicates with reasonable certainty can be recovered in the future from known reservoirs under existing economic and operating conditions. The data series for total proved oil does not necessarily meet the definitions, guidelines and practices used for determining proved reserves at company level, for instance as published by the US Securities and Exchange Commission, nor does it necessarily represent BP’s view of proved reserves by country. Reserves-to-production (R/P) ratio - If the reserves remaining at the end of any year are divided by the production in that year, the result is the length of time that those remaining reserves would last if production were to continue at that rate.Reserves include gas condensate and natural gas liquids (NGLs) as well as crude oil.

PPAC Ready Reckoner
6
Source: BP Statistical Review of World Energy, June 2017 which includes data from ICIS. Note: * Includes crude oil, shale oil, oil sands and NGLs (natural gas liquids-the liquid content of natural gas where this is recovered separately). Excludes liquid fuels
from other sources such as biomass and derivatives of coal and natural gas.
Sl.no. CountryProduction*
Million tonnes Million barrels daily
1 Saudi Arabia 585.7 12.3
2 Russian Federation 554.3 11.23 US 543.0 12.44 Iraq 218.9 4.55 Canada 218.2 4.56 Iran 216.4 4.67 China 199.7 4.08 United Arab Emirates 182.4 4.19 Kuwait 152.7 3.210 Brazil 136.7 2.611 Venezuela 124.1 2.412 Mexico 121.4 2.513 Nigeria 98.8 2.114 Norway 90.4 2.015 Angola 87.9 1.816 Qatar 79.4 1.917 Kazakhstan 79.3 1.718 Algeria 68.5 1.619 Oman 49.3 1.020 Colombia 48.8 0.921 United Kingdom 47.5 1.022 Indonesia 43.0 0.923 Azerbaijan 41.0 0.824 India 40.2 0.925 Egypt 33.8 0.7
26 Malaysia 32.7 0.727 Ecuador 29.3 0.528 Argentina 28.8 0.629 Libya 20.0 0.430 Thailand 17.6 0.5
Sub total 4189.9 88.1Others 192.5 4.0Total World 4382.4 92.2of which: OECD 1060.0 23.1 Non-OECD 3322.4 69.0 OPEC 1864.2 39.4 Non-OPEC 2518.2 52.8 European Union 70.8 1.5 Commonwealth of Independent States (CIS) 694.5 14.1
Table 2.2 : Crude oil production, 2016

PPAC Ready Reckoner
7
Sl. no. CountryConsumption *
Million tonnes Thousand barrels daily
1 US 863.1 19631
2 China 578.7 12381
3 India 212.7 4489
4 Japan 184.3 4037
5 Saudi Arabia 167.9 3906
6 Russian Federation 148.0 3203
7 Brazil 138.8 3018
8 South Korea 122.1 2763
9 Germany 113.0 2394
10 Canada 100.9 2343
11 Iran 83.8 1848
12 Mexico 82.8 1869
13 France 76.4 1602
14 United Kingdom 73.1 1597
15 Indonesia 72.6 1615
16 Singapore 72.2 1382
17 Spain 62.5 1268
18 Thailand 59.0 1382
19 Italy 58.1 1232
20 Australia 47.8 1036
21 Taiwan 46.7 1046
22 United Arab Emirates 43.5 987
23 Turkey 41.2 886
24 Egypt 40.6 853
25 Netherlands 39.9 851
26 Malaysia 36.3 829
27 Argentina 31.9 687
28 Belgium 31.8 675
29 Venezuela 28.7 611
30 Pakistan 27.5 566
Sub total 3685.9 80988
Others 732.3 15570
Total World 4418.2 96558
of which: OECD 2086.8 46217
Non-OECD 2331.4 50341
European Union 613.3 12942
CIS countries 195.5 4223
Table 2.3 : Crude oil consumption, 2016
* Inland demand plus international aviation and marine bunkers and refinery fuel and loss. Consumption of biogasoline (such as ethanol), biodiesel and derivatives of coal and natural gas are also included. Source: BP Statistical Review of World Energy, June 2017 Note: Differences between these world consumption figures and world production statistics are accounted for by stock changes, consumption of non-petroleum additives and substitute fuels, and unavoidable disparities in the definition, measurement or conversion of oil supply and demand data.

PPAC Ready Reckoner
8
(Thousand barrels daily)
Sl.no. Country 2006 2016 Addition % Change
1 US 17443 18621 1178 6.8
2 China 8508 14177 5669 66.6
3 Russian Federation 5524 6418 894 16.2
4 India 2872 4620 1749 60.9
5 Japan 4588 3600 -988 -21.5
6 South Korea 2633 3234 600 22.8
7 Saudi Arabia 2107 2899 792 37.6
8 Brazil 1942 2289 347 17.9
9 Germany 2390 2024 -366 -15.3
10 Iran 1772 1985 213 12.0
11 Canada 1914 1967 53 2.7
12 Italy 2526 1915 -611 -24.2
13 Spain 1362 1562 201 14.7
14 Mexico 1463 1522 59 4.0
15 Singapore 1422 1514 92 6.5
16 Venezuela 1294 1303 9 0.7
17 Netherlands 1274 1293 19 1.5
18 Thailand 1100 1235 135 12.3
19 United Kingdom 1836 1227 -608 -33.2
20 France 1959 1224 -735 -37.5
21 Indonesia 1157 1155 -2 -0.2
22 United Arab Emirates 620 1143 523 84.4
23 Taiwan 1140 988 -152 -13.3
24 Kuwait 936 936 0 0.0
25 Iraq 743 919 176 23.7
26 Egypt 810 810 0 0.0
27 Belgium 766 776 10 1.3
28 Argentina 617 657 40 6.5
29 Algeria 443 651 208 46.9
30 Turkey 613 613 0 0.0
Sub total 73775 83277 9502 12.9
Others 14445 14153 -292 -2.0
Total World 88220 97430 9211 10.4
of which: OECD 45396 44105 -1291 -2.8
Non-OECD 42824 53325 10501 24.5
European Union 15991 13882 -2109 -13.2
Commonwealth of independent states (CIS)
7537 8221 684 9.1
Table 2.4 : Crude Oil: Refinery capacities*
Source: BP Statistical Review of World Energy, June 2017 which includes data from ICIS. Note: * Atmospheric distillation capacity at year end on a calender-day basis.

PPAC Ready Reckoner
9
Table 2.5 : Indigenous crude oil production
Table 2.6 : Self sufficiency in petroleum products
(Million metric tonne)
Particulars 2013-14 2014-15 2015-16 2016-17 Apr-Sep 2016 Apr-Sep 2017 (P)
PSU companies
ONGC 20.4 20.8 21.1 20.9 10.4 10.6
OIL 3.5 3.4 3.2 3.3 1.6 1.7
PSU total 23.9 24.2 24.3 24.1 12.0 12.3
PSU total (crore barrels) 17.5 17.8 17.8 17.7 8.8 9.0
Under PSC contracts
PSC total 12.0 11.7 11.2 10.4 5.4 4.9
PSC total (crore barrels) 8.8 8.5 8.2 7.6 3.9 3.6
Total crude oil 35.9 35.9 35.5 34.5 17.3 17.2
Condensate 1.9 1.6 1.4 1.5 0.7 0.8
Total (crude oil + condensate) 37.8 37.5 36.9 36.0 18.1 18.0
Total (crude oil + condensate) (crore barrels) 27.7 27.5 27.1 26.4 13.2 13.2
(Million metric tonne)
Particulars 2013-14 2014-15 2015-16 2016-17 Apr-Sep 2016 Apr-Sep 2017 (P)
i) Indigenous crude oil processing 33.9 34.2 34.1 33.5 16.7 16.4
a) Products from indigeneous crude 31.6 32.0 31.8 31.3 15.5 15.3
b) Products from fractionators (including LPG and Gas) 4.3 4.0 4.0 4.3 2.1 2.2
ii) Total production from indigenous crude, condensate (a+b) 35.9 35.9 35.8 35.6 17.6 17.5
iii) Total domestic consumption 158.4 165.5 184.7 194.6 97.2 98.7
Percentage of self sufficiency (ii/iii) 22.7 21.7 19.4 18.3 18.1 17.7
Source: Oil Companies and DGH
Source: Oil companiesNote: 1. Production of petroleum products from indigenous crude considered at 93.3% of indigenous crude oil processing. 2. The balance demand of petroleum products is met through import of crude oil and POL products.
PPAC Ready Reckoner
10
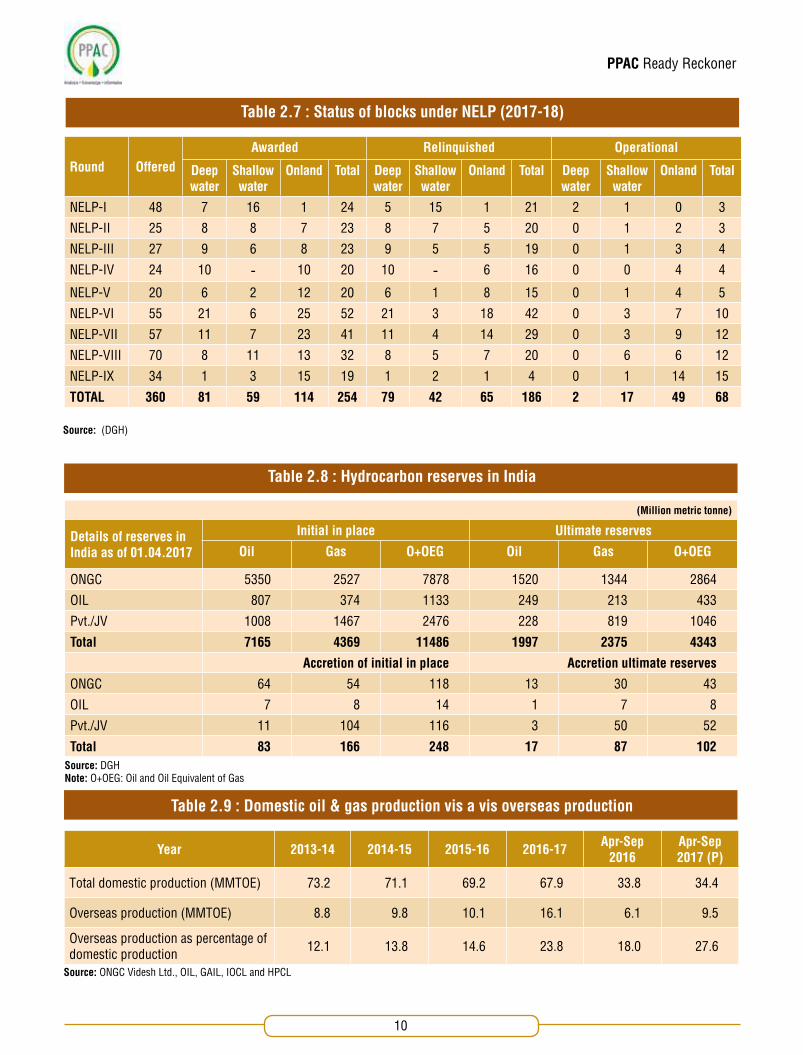
Round OfferedAwarded Relinquished Operational
Deep water
Shallow water
Onland Total Deep water
Shallow water
Onland Total Deep water
Shallow water
Onland Total
NELP-I 48 7 16 1 24 5 15 1 21 2 1 0 3
NELP-II 25 8 8 7 23 8 7 5 20 0 1 2 3
NELP-III 27 9 6 8 23 9 5 5 19 0 1 3 4
NELP-IV 24 10 - 10 20 10 - 6 16 0 0 4 4
NELP-V 20 6 2 12 20 6 1 8 15 0 1 4 5
NELP-VI 55 21 6 25 52 21 3 18 42 0 3 7 10
NELP-VII 57 11 7 23 41 11 4 14 29 0 3 9 12
NELP-VIII 70 8 11 13 32 8 5 7 20 0 6 6 12
NELP-IX 34 1 3 15 19 1 2 1 4 0 1 14 15
TOTAL 360 81 59 114 254 79 42 65 186 2 17 49 68
Table 2.7 : Status of blocks under NELP (2017-18)
Source: (DGH)
(Million metric tonne)
Details of reserves in India as of 01.04.2017
Initial in place Ultimate reserves
Oil Gas O+OEG Oil Gas O+OEG
ONGC 5350 2527 7878 1520 1344 2864
OIL 807 374 1133 249 213 433
Pvt./JV 1008 1467 2476 228 819 1046
Total 7165 4369 11486 1997 2375 4343
Accretion of initial in place Accretion ultimate reserves
ONGC 64 54 118 13 30 43
OIL 7 8 14 1 7 8
Pvt./JV 11 104 116 3 50 52
Total 83 166 248 17 87 102
Table 2.8 : Hydrocarbon reserves in India
Source: DGH Note: O+OEG: Oil and Oil Equivalent of Gas
Year 2013-14 2014-15 2015-16 2016-17 Apr-Sep 2016
Apr-Sep 2017 (P)
Total domestic production (MMTOE) 73.2 71.1 69.2 67.9 33.8 34.4
Overseas production (MMTOE) 8.8 9.8 10.1 16.1 6.1 9.5
Overseas production as percentage of domestic production 12.1 13.8 14.6 23.8 18.0 27.6
Table 2.9 : Domestic oil & gas production vis a vis overseas production
Source: ONGC Videsh Ltd., OIL, GAIL, IOCL and HPCL

PPAC Ready Reckoner
11
Prognosticated CBM resources 92 TCF
Established CBM resources 9.9 TCF
Total available coal bearing area 26000 Sq.KM
Blocks awarded* 33 Nos.
Commercial production of CBM Gas (April - September 2017) 1.82 MMSCMD
Table 2.10 : Coal Bed Methane (CBM) Gas development in India
Source : DGH*CBM blocks have been awarded in the states of Andhra Pradesh, Assam, Chhattisgarh, Gujarat, Jharkhand, Madhya Pradesh, Maharashtra, Odisha, Rajasthan, Tamil Nadu and West Bengal.
a) Policy Guidelines for Exploration and exploitation of Shale gas and oil
Shale gas policy was announced in October 2013. ONGC and Oil India Limited (OIL) have been allotted 50 and 6 blocks respectively for carrying out Phase-I shale gas assessment studies.
b) OIL : Activities during 2016-17
OIL has drilled one well in Jaisalmer basin. Four runs of conventional coring were completed within Baisakhi-Bedeshir Shale Section. Canister Core gas desorption, Residual/ Crush Gas, Gas composition, Spectral Gamma Ray, CT scanning, Rock Eval Pyrolysis, Vitrinite Relectance, organic richness and source rock (VRo) analysis, Cluster Analysis have been completed till March 2017.
OIL has released three locations in Assam - DIBK Dibrugarh, DHS Dumdum and CAC Chabua PMLs (petroleum mining lease). Two more locations were released by OIL in Arunachal Pradesh - DML-2 Demoali and Jairampur Extn. PELs (petroleum exploration licenses ).
c) ONGC: Activities during 2016-17
ONGC has released three pilot shale gas/ oil locations and completed drilling of four dual objective wells in north Cambay basin. Total 20 conventional cores in Cambay Shale section were collected for shale specific studies. Hydro-fracturing is in progress in three hydro-fracturing objects and activities are in different stages of progress.
The drilled wells have given information about various properties of the shale formations. Most of the blocks in the four basins (Cambay, KG, Cauvery, Assam & Assam Arakan) are prospective mainly for shale oil. Area prospective for shale gas in most of the blocks is likely to be limited.
ONGC drilled first shale gas well in Jambusar field. Another shale gas well was drilled in Gandhar Ext-II in Gandhar area. Hydro-fracturing was carried out in one of the identified intervals (Object-II) of well in Jambusar field. The well produced 191 m3 of liquid which included 19 m3 of oil and 172 m3 of water during different stages of extended testing. It established unconventional Shale Oil reservoir for the first time in an Indian Basin.
Oil indication is encouraging and prevalence of unconventional petroleum system in the Broach sub-basin seems to be an attractive proposition for shale oil exploration. A proper quantitative estimation of oil-in-place will require the results from other wells which have been drilled in the same area of Cambay basin and which are identified for hydrofracturing.
Table 2.11 : Status of Shale Gas and oil development in India
Source: DGH

PPAC Ready Reckoner
12

PPAC Ready Reckoner
13
(Billion cubic metre)
Sl. no. Country 2015 2016
1 Iran 33500 33500
2 Russian Federation 32271 32271
3 Qatar 24299 24299
4 Turkmenistan 17479 17479
5 US 8714 8714
6 Saudi Arabia 8427 8427
7 United Arab Emirates 6091 6091
8 Venezuela 5702 5702
9 China 4797 5366
10 Nigeria 5284 5284
11 Algeria 4504 4504
12 Iraq 3694 3694
13 Australia 3471 3471
14 Indonesia 2775 2866
15 Canada 2171 2171
16 Egypt 1846 1846
17 Kuwait 1784 1784
18 Norway 1857 1763
19 Libya 1505 1505
20 India 1252 1227
21 Myanmar 528 1189
22 Malaysia 1169 1169
23 Azerbaijan 1148 1148
24 Uzbekistan 1086 1086
25 Kazakhstan 962 962
26 Oman 705 705
27 Netherlands 697 697
27 Vietnam 617 617
29 Ukraine 604 591
30 Pakistan 453 453Sub total 179393 180583
Others 6026 5991
Total World 185419 186574
of which: OECD 17938 17813
Non-OECD 167480 168761
European Union 1302 1282
CIS 53583 53570
Table 3.1 : World top 30 natural gas reserve countries
Source: BP Statistical Review of World Energy, June 2017
PPAC Ready Reckoner
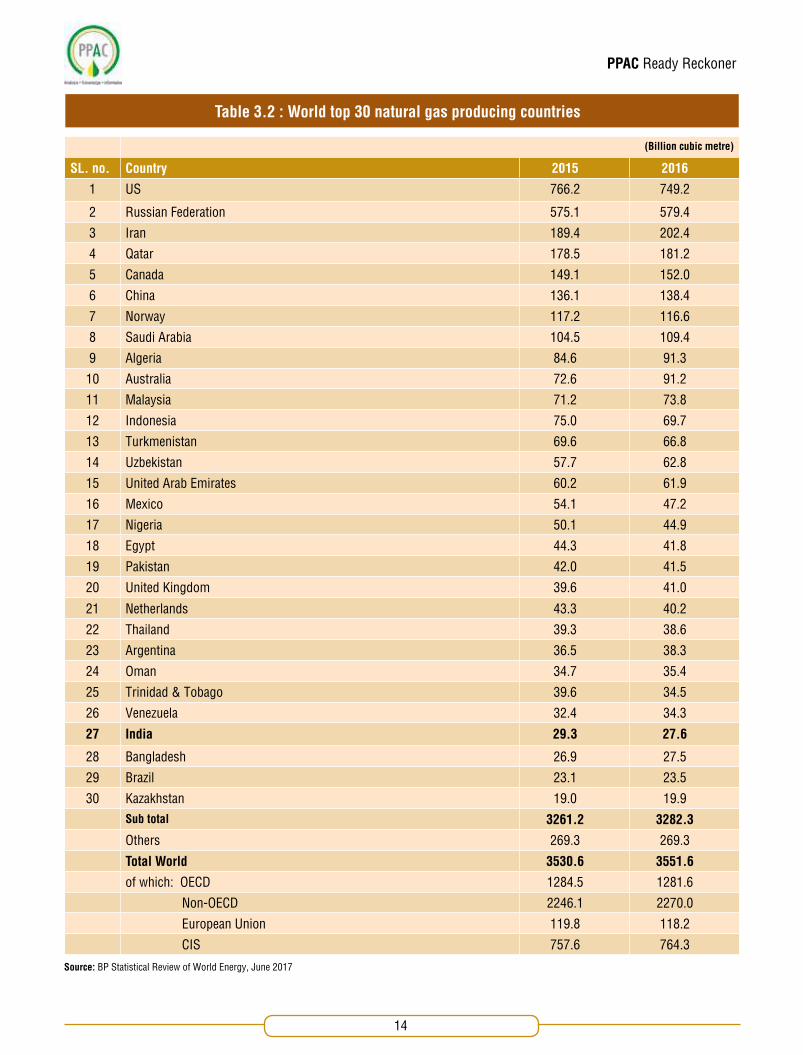
14
(Billion cubic metre)
SL. no. Country 2015 2016
1 US 766.2 749.2
2 Russian Federation 575.1 579.4
3 Iran 189.4 202.4
4 Qatar 178.5 181.2
5 Canada 149.1 152.0
6 China 136.1 138.4
7 Norway 117.2 116.6
8 Saudi Arabia 104.5 109.4
9 Algeria 84.6 91.3
10 Australia 72.6 91.2
11 Malaysia 71.2 73.8
12 Indonesia 75.0 69.7
13 Turkmenistan 69.6 66.8
14 Uzbekistan 57.7 62.8
15 United Arab Emirates 60.2 61.9
16 Mexico 54.1 47.2
17 Nigeria 50.1 44.9
18 Egypt 44.3 41.8
19 Pakistan 42.0 41.5
20 United Kingdom 39.6 41.0
21 Netherlands 43.3 40.2
22 Thailand 39.3 38.6
23 Argentina 36.5 38.3
24 Oman 34.7 35.4
25 Trinidad & Tobago 39.6 34.5
26 Venezuela 32.4 34.3
27 India 29.3 27.6
28 Bangladesh 26.9 27.5
29 Brazil 23.1 23.5
30 Kazakhstan 19.0 19.9Sub total 3261.2 3282.3
Others 269.3 269.3
Total World 3530.6 3551.6
of which: OECD 1284.5 1281.6
Non-OECD 2246.1 2270.0
European Union 119.8 118.2
CIS 757.6 764.3
Table 3.2 : World top 30 natural gas producing countries
Source: BP Statistical Review of World Energy, June 2017

PPAC Ready Reckoner
15
(Billion cubic metre)
Sl. no. Country 2015 2016
1 US 773.2 778.6
2 Russian Federation 402.8 390.9
3 China 194.8 210.3
4 Iran 190.8 200.8
5 Japan 113.4 111.2
6 Saudi Arabia 104.5 109.4
7 Canada 102.5 99.9
8 Mexico 87.1 89.5
9 Germany 73.5 80.5
10 United Kingdom 68.1 76.7
11 United Arab Emirates 73.8 76.6
12 Italy 61.4 64.5
13 Other Middle East 51.0 52.3
14 Uzbekistan 50.2 51.4
15 Egypt 47.8 51.3
16 India 45.7 50.1
17 Argentina 48.2 49.6
18 Thailand 48.7 48.3
19 Pakistan 43.5 45.5
20 South Korea 43.6 45.5
21 Malaysia 41.8 43.0
22 France 38.9 42.6
23 Turkey 43.6 42.1
24 Qatar 43.9 41.7
25 Australia 42.9 41.1
26 Algeria 39.4 40.0
27 Indonesia 40.4 37.7
28 Brazil 41.7 36.6
29 Venezuela 34.5 35.6
30 Netherlands 31.5 33.6
Sub total 3023.4 3076.8
Others 456.8 466.1
Total World 3480.1 3542.9
of which: OECD 1611.4 1644.1
Non-OECD 1868.7 1898.8
European Union 399.1 428.8
Former Soviet Union 555.4 546.7
Table 3.3 : World top 30 natural gas consuming countries
Source: BP Statistical Review of World Energy, June 2017

PPAC Ready Reckoner
16
(MMSCMD)
Particulars 2013-14 2014-15 2015-16 2016-17 Apr-Sep 2016 Apr-Sep 2017 (P)
Gross Production 97.0 92.2 88.1 87.4 85.9 89.7
Net Availability (net of flare and loss) 94.7 89.6 85.1 84.5 83.0 87.2
*LNG Import 47.1 50.8 58.4 67.6 69.1 68.0
Total Consumption including internal use (Net Availability + LNG import)
141.8 140.4 143.5 152.1 152.1 155.2
Total Consumption (in BCM) 51.8 51.2 52.5 55.5 27.8 28.4
Total Consumption (in MMSCM) 51757 51238 52517 55534 27843 28400
Table 3.4 : Natural gas at a glance
Source : CGD companies
State Geographical area covered EntityPNG connections
Domestic Industrial Commercial
Delhi / NCR National Capital Territory of Delhi (Including Noida and Ghaziabad) Indraprastha Gas Ltd. 802939 1071 2043
Maharashtra Mumbai, Thane, Mira-Bhayender, Navi Mumbai, Pune, Kalyan, Ambernath, Panvel, Bhiwandi
Mahanagar Gas Ltd., Maharashtra Natural Gas Ltd., Gujarat Gas Ltd. 1089574 205 3578
GujaratGandhinagar, Mehsana, Sabakantha,Nadiad, Halol, Hazira, Rajkot, Khambhat, Palej, Valsad, Navsari, Surendra Nagar, Ahmedabad, Vadodara, Surat, Ankeleswar, Bhavnara, Anand.
Sabarmati Gas Ltd., Gujarat Gas Ltd., Hindustan Petroelum Corporation Ltd., Vadodara Gas Ltd, Adani Gas Ltd., Charotar Gas Sahkari Mandali Ltd.
1745731 4417 17439
Uttar Pradesh Merrut, Mathura, Agra, Firozabad,Kanpur, Bareilly, Lucknow, Moradabad, Khurja, Allahabad.
Green Gas Ltd. (Lucknow), Central UP Gas Limited (Kanpur), GAIL Gas Ltd.,Sanwariya Gas Ltd., Siti Energy Ltd.,Adani Gas Ltd., Indian Oil-Adani Gas Pvt. Ltd.
65593 509 317
Tripura Agartala Tripura Natural Gas Company Ltd. 30961 50 399
Madhya Pradesh Dewas, Indore, Ujjain, Gwalior GAIL Gas Ltd., Aavantika Gas Ltd. 19193 110 82
Rajasthan Kota GAIL Gas Ltd. 235 15 2
Assam Tinsukia, Dibrugarh, Sibsagar,Jorhat Assam Gas Co. Ltd. 30804 404 1036
Andhra Pradesh/ Telangana Kakinada, Hyderabad,Vijayawada, Kovvur Bhagyanagar Gas Ltd., Godavari Gas
Pvt. Ltd. 10348 6 47
Haryana Sonepat, Gurgaon, Faridabad GAIL Gas Ltd, Adani Gas Ltd., Haryan City Gas Distribution Ltd. 66363 273 197
Karnataka Bengaluru GAIL Gas Ltd. 3744 12 26
Chandigarh Chandigarh Indian Oil-Adani Gas Pvt. Ltd. 4346 0 0
Kerala Ernakulam Indian Oil-Adani Gas Pvt. Ltd. 691 0 3
Dadra & Nagar Haveli Dadra & Nagar Haveli Gujarat Gas Ltd. 169 6 8
Daman and Diu Daman and Diu Indian Oil-Adani Gas Pvt. Ltd. 68 1 3
Total 3870759 7079 25180
Table 3.5 : PNG data as on 01.10.2017

PPAC Ready Reckoner
17
(Sales in TMT)
State Company name No. of companies 2013-14 2014-15 2015-16 2016-17 Apr-Sep
2016Apr-Sep 2017 (P)
Gujarat
Adani Energy Ltd., Gujarat Gas Ltd., (An amalgamated entity of Gujarat State Petroleum Corporation Gas Company Ltd. and Gujarat Gas Company Ltd.), Sabarmati Gas Ltd. (SGL), Hindustan Petroleum Corporation Ltd. (HPCL), Vadodara Gas Ltd. (JV of GAIL Gas Ltd. and Vadodara Mahanagar Seva Sadan), Charotar Gas Sahkari Mandali Ltd.
6 464 476 503 546 268 298
Delhi Indraprastha Gas Ltd. (IGL), New Delhi 1 698 717 738 804 400 435
Rajasthan (Kota) Rajasthan State Gas Limited 1 2 3 4 4 2 2
Maharashtra Mahanagar Gas Ltd. (MGL) Mumbai and Maharashtra Natural Gas Ltd.(MNGL), Pune 2 476 531 565 593 296 311
Andhra Pradesh / Telangana
Bhagyanagar Gas Ltd. (BGL) and Hyderabad Godavari Gas Pvt. Ltd., Hyderabad 2 25 26 27 29 14 15
Uttar Pradesh
Green Gas Ltd., Lucknow, Central UP Gas Ltd., Kanpur, Siti Energy Ltd., GAIL Gas Ltd., Sanwaria Gas Ltd., Indraprastha Gas Ltd., Adani Gas Ltd., Indian Oil-Adani Gas Pvt. Ltd.
8 163 185 212 245 120 141
Tripura Tripura Natural Gas Co. Ltd. (TNGCL), Agartala 1 7 10 11 12 6 7
Madhya Pradesh Aavantika Gas Ltd. (Indore) and GAIL Gas Ltd. 2 16 17 19 22 11 12
Haryana Haryana City Gas Ltd., GAIL Gas Ltd. and Adani Gas Ltd. 3 78 72 75 109 52 70
West Bengal Great Eastern Energy Corporation Ltd. 1 1 1 1 2 1 0
Karnataka GAIL Gas Ltd. 1 0 0 0 0 0 0
Chandigarh Indian Oil-Adani Gas Pvt. Ltd. 1 0 0 0 0 0 2
Total 21* 1928 2037 2155 2365 1170 1294
State Company name No. of CNG stations
No. of CNG vehicles
Gujarat
Adani Energy Ltd., Gujarat Gas Ltd., (An amalgamated entity of Gujarat State Petroleum Corporation Gas Company Ltd. and Gujarat Gas Company Ltd.), Sabarmati Gas Ltd., Hindustan Petroleum Corporation Ltd., Vadodara Gas Ltd. (JV of GAIL Gas Ltd. and Vadodara Mahanagar Seva Sadan), Charotar Gas Sahkari Mandali Ltd.
403 872370
Delhi / NCR Indraprastha Gas Ltd. (IGL), New Delhi 423 987817
Maharashtra Mahanagar Gas Ltd. (MGL), Mumbai, Maharashtra Natural Gas Ltd. (MNGL), Pune 253 740058
Andhra Pradesh / Telangana Bhagyanagar Gas Ltd.( BGL), Hyderabad, Godavari Gas Pvt. Ltd.Hyderabad 47 40183
Rajasthan Rajasthan State Gas Limited 3 6421
Uttar Pradesh Green Gas Ltd., Lucknow, Central UP Gas Ltd.,cKanpur, Siti Energy Ltd., Adani Energy Ltd., GAIL Gas Ltd., Sanwaria Gas Ltd., Indian Oil-Adani Gas Pvt. Ltd. 62 124242
Tripura Tripura Natural Gas Co. Ltd., Agartala 6 10110
Madhya Pradesh Aavantika Gas Ltd. Indore, GAIL Gas Ltd. 26 26319
Haryana Haryana City Gas Ltd, GAIL Gas Ltd., Adani Gas Ltd. 37 125227
West Bengal Great Eastern Energy Corporation Ltd. 7 3274
Karnataka Gail Gas Ltd. 3 224
Chandigarh Indian Oil-Adani Gas Pvt. Ltd. 2 1500
Daman Indian Oil-Adani Gas Pvt. Ltd. 1 250
All India 1273 2937995
Table 3.6: CNG activities in India as on 01.10.2017
Table 3.7: CNG stations and vehicles as on 01.10.2017
Source : CGD companies Note : *GAIL Gas Ltd. is operating in five States, Adani Gas in three States, Bhagyanagar Gas Ltd, Indraprastha Gas Ltd. and Indian Oil-Adani Gas Pvt. Ltd. are operating in two States. Hence, their number is taken once only.
Source : CGD companies, RTO

Sl. no. Name of terminal Promoters Capacity (MMTPA) Capacity Utilization (%)
(Apr-Sep 2017)
1 Dahej (Gujarat) Petronet LNG Ltd. (PLL) 15 MMTPA 101.7
2 Hazira (Gujarat) Hazira LNG Pvt. Ltd. (HLPL) 5 MMTPA 56.5
3 Dabhol(Maharashtra)
Ratnagiri Gas and Power Pvt. Ltd. (RGPPL- JV of GAIL & NTPC)
1.69 MMTPA presently without breakwater to be increased to 5 MMTPA 13.8
4 Kochi (Kerala) Petronet LNG Ltd. (PLL) 5 MMTPA 13.8
Table 3.8 : LNG terminals (Operational)
Table 3.9 : Domestic natural gas price and gas price ceiling
Source: LNG operating companies
Period Domestic natural gas price in US$/MMBTU (GCV basis)*
Gas price ceiling in US$/MMBTU (GCV basis)**
November 2014 - March 2015 5.05 -
April 2015 - September 2015 4.66 -
October 2015 - March 2016 3.82 -
April 2016 - September 2016 3.06 6.61
October 2016 - March 2017 2.50 5.30
April 2017-September 2017 2.48 5.56
October 2017 - March 2018 2.89 6.30
Note:* As per the “New Domestic Natural Gas Pricing Guidelines, 2014” issued by Ministry of Petroleum & Natural Gas dated October 25, 2014** As per the notification issed by Ministry of Petroleum and Natural Gas dated 21.03.2016 on marketing including pricing freedom for the gas to be produced from discoveries in Deepwater, Ultra Deepwater and High Pressure-High Temperature areas.
18

PPAC Ready Reckoner
19


PPAC Ready Reckoner
22
Sl. no. Refinery
Installed capacity (MMTPA) Crude oil processing (MMT)
01.04.2013 01.04.2014 01.04.2015 01.04.2016 01.04.2017 2013-14 2014-15 2015-16 2016-17 Apr-Sep 2016
Apr-Sep 2017 (P)
1 Barauni 6.0 6.0 6.0 6.0 6.0 6.5 5.9 6.5 6.5 3.3 2.5
2 Koyali 13.7 13.7 13.7 13.7 13.7 13.0 13.3 13.8 14.0 7.3 6.3
3 Haldia 7.5 7.5 7.5 7.5 7.5 8.0 7.7 7.8 7.7 4.0 4.1
4 Mathura 8.0 8.0 8.0 8.0 8.0 6.6 8.5 8.9 9.2 4.6 4.3
5 Panipat 15.0 15.0 15.0 15.0 15.0 15.1 14.2 15.3 15.6 7.7 7.5
6 Guwahati 1.0 1.0 1.0 1.0 1.0 1.0 1.0 0.9 0.9 0.4 0.5
7 Digboi 0.7 0.7 0.7 0.7 0.7 0.7 0.6 0.6 0.5 0.3 0.3
8 Bongaigaon 2.4 2.4 2.4 2.4 2.4 2.3 2.4 2.4 2.5 1.2 1.2
9 Paradip - - - 15.0 15.0 - - 1.8 8.2 2.8 6.9
IOCL total 54.2 54.2 54.2 69.2 69.2 53.1 53.6 58.0 65.2 31.7 33.6
10 Mumbai 6.5 6.5 6.5 6.5 7.5 7.7 7.4 8.0 8.5 4.1 4.3
11 Visakh 8.3 8.3 8.3 8.3 8.3 7.8 8.8 9.2 9.3 4.4 4.9
12 HMEL-Bathinda 9.0 9.0 9.0 9.0 9.0 9.3 7.3 10.7 10.5 5.5 2.9
HPCL total 23.8 23.8 23.8 23.8 24.8 24.8 23.5 27.9 28.3 14.0 12.0
13 Mumbai 12.0 12.0 12.0 12.0 12.0 12.7 12.8 13.4 13.5 7.1 6.7
14 Kochi 9.5 9.5 9.5 9.5 12.4 10.3 10.4 10.7 11.8 5.5 6.5
15 BORL-Bina 6.0 6.0 6.0 6.0 6.0 5.4 6.2 6.4 6.4 3.3 3.6
BPCL total 27.5 27.5 27.5 27.5 30.4 28.4 29.4 30.5 31.7 15.9 16.9
16 Manali 10.5 10.5 10.5 10.5 10.5 10.1 10.2 9.1 9.8 5.3 5.0
17 CBR 1.0 1.0 1.0 1.0 1.0 0.6 0.5 0.5 0.5 0.3 0.2
CPCL total 11.5 11.5 11.5 11.5 11.5 10.6 10.8 9.6 10.3 5.6 5.2
18 Numaligarh 3.0 3.0 3.0 3.0 3.0 2.6 2.8 2.5 2.7 1.2 1.4
19 Tatipaka 0.07 0.07 0.07 0.07 0.07 0.07 0.05 0.07 0.09 0.04 0.04
20 MRPL-Mangalore 15.0 15.0 15.0 15.0 15.0 14.6 14.6 15.5 16.0 7.7 7.5
ONGC total 15.1 15.1 15.1 15.1 15.1 14.7 14.7 15.6 16.1 7.7 7.6
21 RIL-Jamnagar (DTA) 33.0 33.0 33.0 33.0 33.0 30.3 30.9 32.4 32.8 16.6 16.4
22 RIL-Jamnagar (SEZ) 27.0 27.0 27.0 27.0 27.0 37.7 37.2 37.1 37.4 18.3 19.1
23 EOL-Vadinar 20.0 20.0 20.0 20.0 20.0 20.2 20.5 19.1 20.9 10.5 10.4
All India 215.1 215.1 215.1 230.1 234.0 222.5 223.3 232.9 245.4 121.5 122.5
Table 4.1 : Refineries: Installed capacity and crude oil processing
(Million metric tonne)
Sl. no. Type of crude 2013-14 2014-15 2015-16 2016-17 Apr-Sep 2016
Apr-Sep 2017 (P)
1 HS crude 160.2 161.4 166.1 177.4 87.5 90.42 LS crude 62.2 61.9 66.7 67.9 34.0 32.1
Total crude 222.5 223.3 232.9 245.4 121.5 122.5Share of HS crude in total crude processing 72.0% 72.3% 71.3% 72.3% 72.0% 73.8%
(Million metric tonne)
Sl. no.
Indigenous/ Imported crude 2013-14 2014-15 2015-16 2016-17 Apr-Sep 2016
Apr-Sep 2017 (P)
1 Imported crude 188.6 189.0 198.7 211.8 104.8 106.12 Indigenous crude 33.9 34.2 34.1 33.5 16.7 16.4
Total crude 222.5 223.3 232.9 245.4 121.5 122.5Share of imported crude in total crude processing 84.8% 84.7% 85.3% 86.3% 86.3% 86.7%
Table 4.2 : High Sulphur (HS) & Low Sulphur (LS) crude oil processing
Table 4.3 : Imported crude & indigenous crude oil processing
Source: Oil companies
Source: Oil companiesMMTPA: Million Metric Tonne per Annum, MMT: Million Metric Tonne
Source: Oil companies

PPAC Ready Reckoner
23
(Million metric tonne)
2013-14 2014-15 2015-16 2016-17 Apr-Sep 2016
Apr-Sep 2017 (P)
A) From crude oil/ refineries
Light ends 62.6 64.6 70.6 75.0 36.5 40.2
of which: LPG 7.9 7.7 8.6 9.2 4.3 4.7
MS 30.3 32.2 35.3 36.6 17.9 18.5
Naphtha 17.0 16.2 16.8 18.6 9.0 9.2
Others 7.4 8.5 9.9 10.7 5.3 7.8
Middle distillates 117.3 117.5 122.9 127.9 63.4 63.3
of which: SKO 7.4 7.6 7.4 5.9 3.3 2.2
ATF 11.2 11.1 11.8 13.8 6.7 6.9
HSD 93.8 94.3 98.6 102.1 50.2 52.3
LDO 0.4 0.4 0.4 0.6 0.2 0.2
Others 4.6 4.2 4.7 5.4 2.9 1.7
Heavy ends 36.6 34.9 34.4 36.3 18.1 16.9
of which: Furnace Oil 13.0 11.5 10.3 11.8 6.0 5.3
LSHS 0.5 0.7 0.4 0.3 0.1 0.1
Lube Oil 0.9 0.9 1.0 1.0 0.5 0.5
Bitumen 4.8 4.7 5.2 5.2 2.4 2.3
RPC/Petcoke 11.3 11.7 13.3 12.9 6.2 6.8
Others 6.1 5.5 4.2 5.2 2.8 2.0
Sub total (A) 216.4 217.1 227.9 239.2 118.1 120.5
B) From natural gas/ fractionators
Sub total (B) 4.3 4.0 4.0 4.3 2.1 2.2
of which: LPG 2.1 2.2 2.0 2.1 1.0 1.1
Naphtha 1.5 1.2 1.1 1.2 0.6 0.6
SKO 0.1 0.1 0.1 0.03 0.02 0.02
HSD 0.02 0.01 0.01 0.01 0.004 0.005
Others 0.6 0.5 0.8 1.0 0.4 0.5
Total indigenous production (A +B) 220.7 221.1 231.9 243.5 120.1 122.7
Table 4.4 : Production of petroleum products
Source: Oil companies
PPAC Ready Reckoner
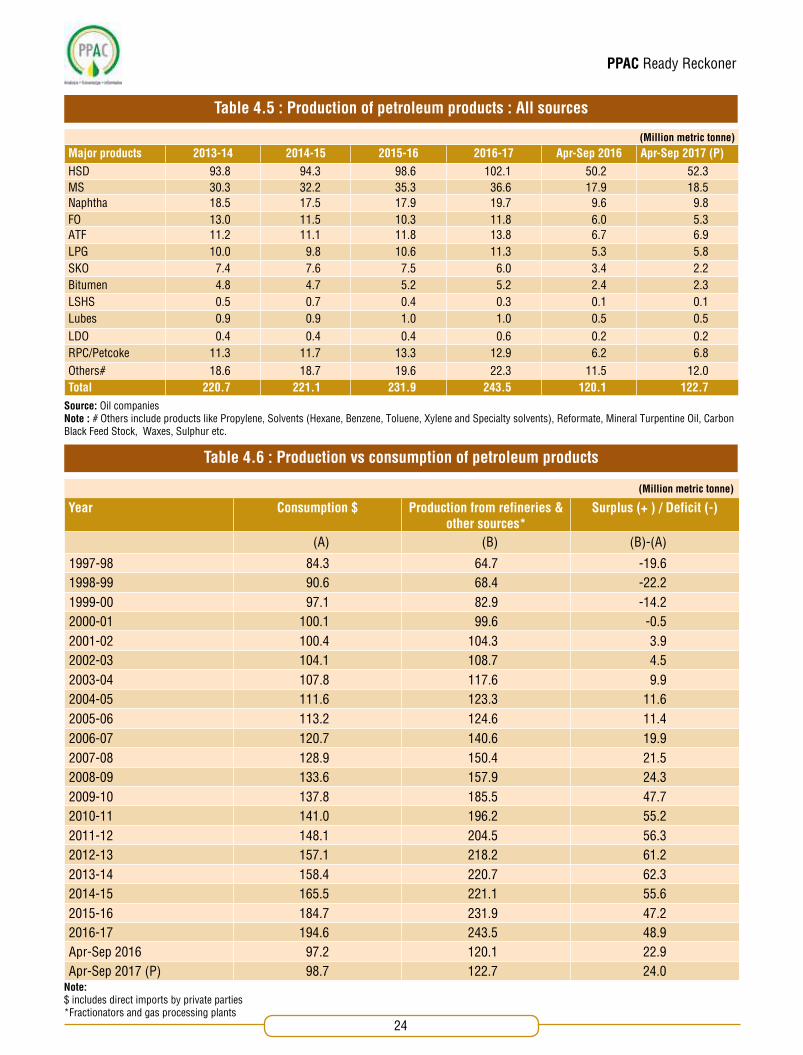
24
(Million metric tonne)
Major products 2013-14 2014-15 2015-16 2016-17 Apr-Sep 2016 Apr-Sep 2017 (P)
HSD 93.8 94.3 98.6 102.1 50.2 52.3MS 30.3 32.2 35.3 36.6 17.9 18.5Naphtha 18.5 17.5 17.9 19.7 9.6 9.8FO 13.0 11.5 10.3 11.8 6.0 5.3ATF 11.2 11.1 11.8 13.8 6.7 6.9LPG 10.0 9.8 10.6 11.3 5.3 5.8SKO 7.4 7.6 7.5 6.0 3.4 2.2Bitumen 4.8 4.7 5.2 5.2 2.4 2.3LSHS 0.5 0.7 0.4 0.3 0.1 0.1Lubes 0.9 0.9 1.0 1.0 0.5 0.5LDO 0.4 0.4 0.4 0.6 0.2 0.2RPC/Petcoke 11.3 11.7 13.3 12.9 6.2 6.8Others# 18.6 18.7 19.6 22.3 11.5 12.0Total 220.7 221.1 231.9 243.5 120.1 122.7
(Million metric tonne)
Year Consumption $ Production from refineries & other sources*
Surplus (+ ) / Deficit (-)
(A) (B) (B)-(A)
1997-98 84.3 64.7 -19.61998-99 90.6 68.4 -22.21999-00 97.1 82.9 -14.22000-01 100.1 99.6 -0.52001-02 100.4 104.3 3.92002-03 104.1 108.7 4.52003-04 107.8 117.6 9.92004-05 111.6 123.3 11.62005-06 113.2 124.6 11.42006-07 120.7 140.6 19.92007-08 128.9 150.4 21.52008-09 133.6 157.9 24.32009-10 137.8 185.5 47.72010-11 141.0 196.2 55.22011-12 148.1 204.5 56.32012-13 157.1 218.2 61.22013-14 158.4 220.7 62.32014-15 165.5 221.1 55.62015-16 184.7 231.9 47.22016-17 194.6 243.5 48.9Apr-Sep 2016 97.2 120.1 22.9Apr-Sep 2017 (P) 98.7 122.7 24.0
Table 4.5 : Production of petroleum products : All sources
Table 4.6 : Production vs consumption of petroleum products
Source: Oil companies Note : # Others include products like Propylene, Solvents (Hexane, Benzene, Toluene, Xylene and Specialty solvents), Reformate, Mineral Turpentine Oil, Carbon Black Feed Stock, Waxes, Sulphur etc.
Note: $ includes direct imports by private parties *Fractionators and gas processing plants
PPAC Ready Reckoner
25
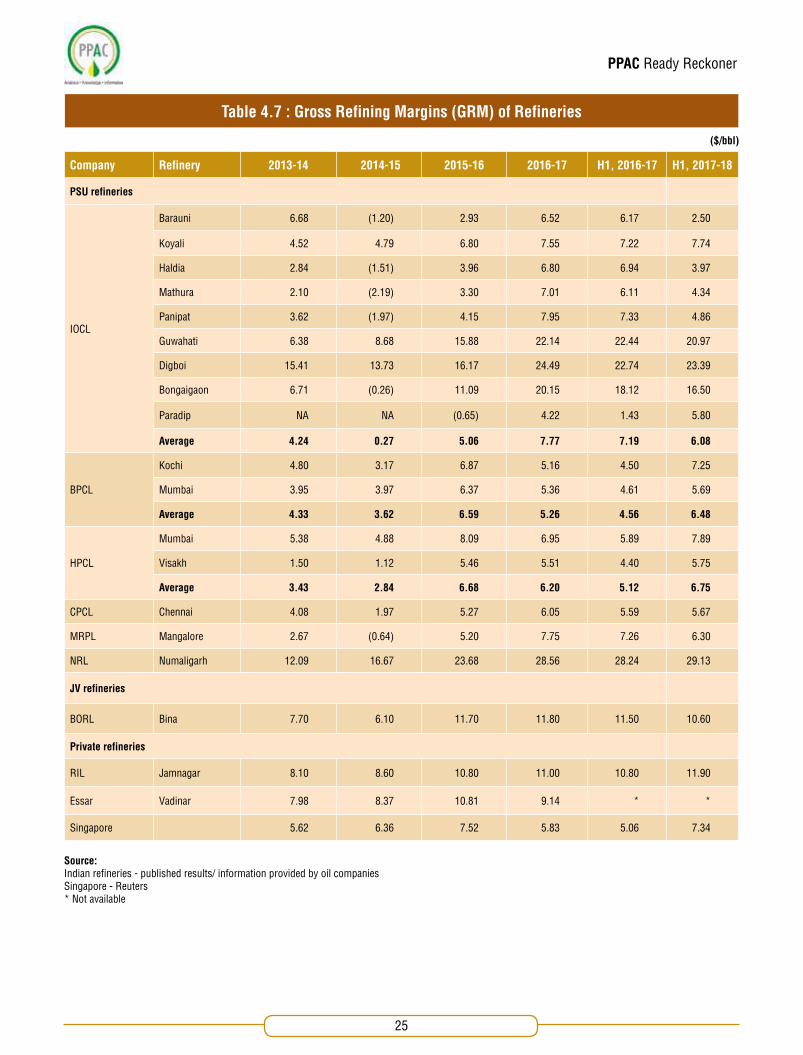
Company Refinery 2013-14 2014-15 2015-16 2016-17 H1, 2016-17 H1, 2017-18
PSU refineries
IOCL
Barauni 6.68 (1.20) 2.93 6.52 6.17 2.50
Koyali 4.52 4.79 6.80 7.55 7.22 7.74
Haldia 2.84 (1.51) 3.96 6.80 6.94 3.97
Mathura 2.10 (2.19) 3.30 7.01 6.11 4.34
Panipat 3.62 (1.97) 4.15 7.95 7.33 4.86
Guwahati 6.38 8.68 15.88 22.14 22.44 20.97
Digboi 15.41 13.73 16.17 24.49 22.74 23.39
Bongaigaon 6.71 (0.26) 11.09 20.15 18.12 16.50
Paradip NA NA (0.65) 4.22 1.43 5.80
Average 4.24 0.27 5.06 7.77 7.19 6.08
BPCL
Kochi 4.80 3.17 6.87 5.16 4.50 7.25
Mumbai 3.95 3.97 6.37 5.36 4.61 5.69
Average 4.33 3.62 6.59 5.26 4.56 6.48
HPCL
Mumbai 5.38 4.88 8.09 6.95 5.89 7.89
Visakh 1.50 1.12 5.46 5.51 4.40 5.75
Average 3.43 2.84 6.68 6.20 5.12 6.75
CPCL Chennai 4.08 1.97 5.27 6.05 5.59 5.67
MRPL Mangalore 2.67 (0.64) 5.20 7.75 7.26 6.30
NRL Numaligarh 12.09 16.67 23.68 28.56 28.24 29.13
JV refineries
BORL Bina 7.70 6.10 11.70 11.80 11.50 10.60
Private refineries
RIL Jamnagar 8.10 8.60 10.80 11.00 10.80 11.90
Essar Vadinar 7.98 8.37 10.81 9.14 * *
Singapore 5.62 6.36 7.52 5.83 5.06 7.34
Table 4.7 : Gross Refining Margins (GRM) of Refineries
Source: Indian refineries - published results/ information provided by oil companiesSingapore - Reuters* Not available
($/bbl)

PPAC Ready Reckoner
26
Company Refinery 2013-14 2014-15 2015-16 2016-17 H1, 2016-17 H1, 2017-18
IOCL
Guwahati 0.88 0.96 1.26 1.12 1.15 2.82
Digboi 8.50 5.42 4.16 7.73 6.84 5.61
Bongaigaon 2.34 (6.51) 0.08 6.03 5.17 2.30
NRL Numaligarh 6.98 9.46 8.06 8.50 8.40 8.54
Table 4.8 : GRM of North East refineries excluding excise duty benefit
Source: Information provided by oil companies
($/bbl)
(Distillate %)
Company Refinery 2012-13 2013-14 2014-15 2015-16 2016-17
IOCL
Barauni 86.1 87.9 87.3 88.7 85.3
Koyali 78.0 78.4 80.1 83.1 81.0
Haldia 69.3 68.5 69.0 69.6 66.7
Mathura 73.3 68.9 71.9 74.7 73.6
Panipat 82.0 82.0 82.4 83.8 84.1
Guwahati 79.7 83.1 81.1 80.8 83.5
Digboi 73.7 73.5 74.8 69.7 75.3
Bongaigaon 82.3 85.9 84.0 84.5 83.8
Paradip - - - - 75.3
CPCLManali 68.0 72.1 71.5 71.4 71.6
CBR 87.5 85.1 71.6 79.3 78.2
HPCLMumbai 74.6 72.6 75.9 76.0 77.6
Visakh 72.1 75.7 78.8 75.7 74.0
BPCLMumbai 80.5 81.0 81.8 84.3 86.1
Kochi 78.9 81.9 84.7 85.7 85.2
NRL Numaligarh 91.1 92.2 90.7 89.9 90.5
MRPL Mangalore 76.5 74.6 72.3 76.9 77.4
PSU oil cos. average 77.3 77.7 78.3 79.9 79.3
Table 4.9 : Distillate yield of PSU refineries
Source : CHT

PPAC Ready Reckoner
27
(Million metric tonne)
Sl. no. Company Refinery
2013-14 2014-15 2015-16 2016-17 Apr-Sep 2016 Apr-Sep 2017 (P)
Crude T’put + other inputs
Fuel & Loss Crude T’put + other inputs
Fuel & Loss Crude T’put + other inputs
Fuel & Loss Crude T’put + other inputs
Fuel & Loss Crude T'put + other inputs
Fuel & Loss Crude T'put + other inputs
Fuel & Loss
Qty % Qty % Qty % Qty % Qty % Qty %
1
IOCL
Barauni 6.5 0.6 9.0 6.0 0.5 9.1 6.6 0.6 8.7 6.6 0.6 9.2 3.4 0.3 9.0 2.6 0.2 9.5
2 Koyali 13.5 1.3 9.3 13.8 1.3 9.2 14.4 1.3 8.8 14.6 1.3 9.0 7.6 0.7 8.9 6.7 0.6 9.4
3 Haldia 8.0 0.7 9.2 7.7 0.7 8.7 7.8 0.7 8.7 7.7 0.7 8.8 4.1 0.4 8.8 4.1 0.3 8.3
4 Mathura 7.0 0.6 8.5 8.9 0.7 7.8 9.3 0.7 7.7 9.7 0.7 7.5 4.8 0.4 7.7 4.6 0.3 7.3
5 Panipat 16.3 1.5 9.2 15.7 1.4 9.2 16.8 1.5 8.8 17.2 1.5 8.4 8.5 0.7 8.4 8.2 0.7 8.3
6 Guwahati 1.2 0.1 9.9 1.2 0.1 10.2 1.2 0.1 9.6 1.2 0.1 9.4 0.6 0.1 9.3 0.6 0.1 10.0
7 Digboi 0.7 0.1 9.1 0.7 0.1 9.3 0.6 0.1 10.2 0.6 0.1 11.7 0.3 0.03 11.9 0.4 0.04 10.3
8 Bongaigaon 2.3 0.2 9.7 2.4 0.2 9.1 2.4 0.2 8.5 2.5 0.2 8.3 1.2 0.1 8.2 1.2 0.1 8.5
9 Paradip - - - - - - 1.9 0.5 24.2 8.3 1.3 15.9 2.8 0.5 19.3 6.9 0.8 11.0
IOCL Total 55.5 5.1 56.4 5.0 61.0 5.6 68.4 6.5 33.2 3.2 35.3 3.2
10
HPCL
Mumbai 7.8 0.5 6.9 7.5 0.6 7.4 8.0 0.6 7.8 8.5 0.6 7.2 4.1 0.3 7.3 4.3 0.3 7.3
11 Visakh 7.8 0.6 7.5 8.8 0.7 7.4 9.2 0.7 7.7 9.3 0.7 7.3 4.4 0.3 7.4 4.9 0.3 6.7
12 HMEL-Bathinda 9.3 0.6 6.4 7.4 0.5 6.5 10.8 0.7 6.3 10.6 0.7 6.3 5.5 0.3 6.1 2.9 0.2 6.8
HPCL Total 24.9 1.7 23.7 1.7 28.0 2.0 28.4 2.0 14.1 1.0 12.1 0.8
13
BPCL
Mumbai 13.1 0.7 5.1 12.9 0.6 4.7 13.4 0.6 4.4 13.6 0.6 4.4 7.1 0.3 4.3 6.8 0.3 4.5
14 Kochi 10.3 0.6 6.3 10.4 0.7 6.3 10.8 0.6 5.9 12.0 0.7 6.0 5.6 0.3 5.9 6.8 0.5 6.6
15 BORL-Bina 5.4 0.5 8.6 6.2 0.5 7.7 6.4 0.5 7.0 6.4 0.6 8.8 3.3 0.3 8.4 3.6 0.3 9.4
16 Numaligarh 2.8 0.3 9.5 3.0 0.3 9.4 2.8 0.3 9.2 3.0 0.3 9.8 1.4 0.1 9.4 1.6 0.2 9.9
BPCL Total 31.6 2.0 32.6 2.0 33.4 1.9 34.9 2.2 17.3 1.0 18.9 1.3
17
CPCL
Manali 10.1 0.9 9.0 10.3 0.9 8.8 9.2 0.9 9.5 9.8 0.9 9.3 5.3 0.5 9.2 5.0 0.5 9.4
18 CBR 0.6 0.03 4.5 0.6 0.02 4.1 0.6 0.03 4.4 0.6 0.03 4.6 0.3 0.01 4.4 0.2 0.01 4.8
CPCL Total 10.7 0.9 10.9 0.9 9.8 0.9 10.4 0.9 5.6 0.5 5.3 0.5
19
ONGC
Tatipaka 0.1 0.001 1.3 0.1 0.001 1.4 0.1 0.001 1.7 0.1 0.003 3.7 0.04 0.002 3.9 0.04 0.002 4.2
20 MRPL-Mangalore 14.6 1.1 7.9 14.7 1.5 10.1 15.7 1.5 9.7 16.3 1.6 10.1 7.8 0.8 10.1 7.6 0.8 10.2
ONGC Total 14.7 1.2 14.8 1.5 15.8 1.5 16.3 1.6 7.8 0.8 7.6 0.8
21RIL
Jamnagar (DTA) 33.5 2.6 7.7 33.3 2.3 6.9 35.1 2.6 7.4 35.9 2.5 6.9 18.2 1.2 6.9 17.7 1.3 7.5
22 Jamnagar (SEZ) 43.1 3.3 7.7 42.8 3.2 7.5 44.2 3.4 7.8 44.8 3.3 7.5 22.3 1.7 7.6 23.6 1.9 7.9
23 EOL Vadinar 20.6 1.0 5.0 20.9 1.1 5.2 19.4 1.1 5.7 21.3 1.2 5.5 10.7 0.6 5.5 10.5 0.6 5.6
Total 234.5 17.9 235.4 17.8 246.8 19.1 260.4 20.2 129.3 10.0 131.0 10.4
Table 4.10 : Fuel & Loss
Source: Oil companies
Source: CHT
(MBTU/Bbl/NRGF)
Company Refinery 2012-13 2013-14 2014-15 2015-16 (New MBN) 2016-17 (New MBN)
IOCL
Barauni 58.1 60.5 61.8 81.0 80.8
Koyali 58.0 59.4 57.1 75.8 75.3
Haldia 54.9 52.7 51.2 80.1 83.2
Mathura 59.0 60.5 60.0 73.6 72.5
Panipat 50.6 49.9 49.0 70.3 65.1
Guwahati 65.0 58.6 63.7 121.9 114.0
Digboi 65.0 61.5 60.8 112.4 114.5
Bongaigaon 74.9 72.9 69.0 91.3 90.5
Paradip - - - - 118.2
CPCLManali 67.9 64.0 64.5 96.1 92.8
CBR 102.3 123.2 118.6 113.1 117.8
HPCLMumbai 82.6 75.4 79.8 90.5 87.9
Visakh 85.0 83.6 83.7 81.6 78.8
BPCLMumbai 65.5 66.6 69.2 75.1 71.1
Kochi 79.4 77.4 79.8 77.8 86.2
NRL Numaligarh 53.3 53.5 51.5 71.1 72.3
MRPL Mangalore 61.0 60.9 67.5 80.3 80.3
PSU oil cos. average 62.7 61.9 62.9 79.7 81.6 /78.5 *
Table 4.11 : Specific energy consumption (MBN number) of PSU refineries
Source: CHT*excluding Paradip
PPAC Ready Reckoner
28
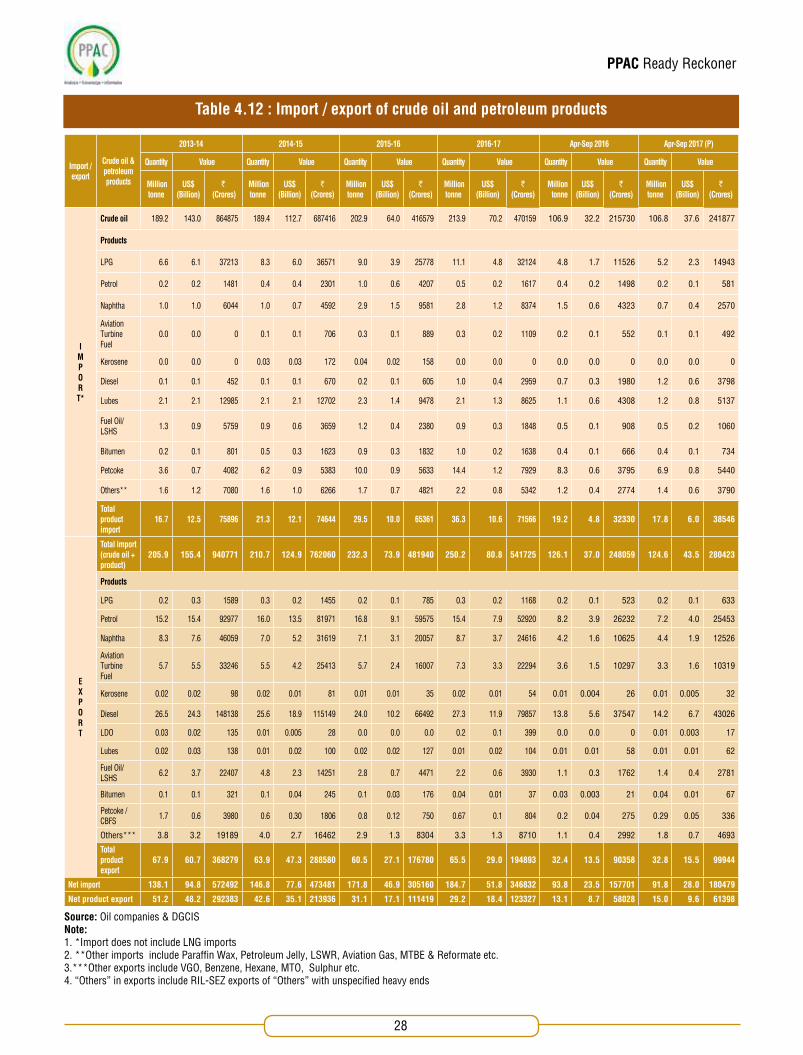
Table 4.12 : Import / export of crude oil and petroleum products
Import / export
Crude oil & petroleum products
2013-14 2014-15 2015-16 2016-17 Apr-Sep 2016 Apr-Sep 2017 (P)
Quantity Value Quantity Value Quantity Value Quantity Value Quantity Value Quantity Value
Million tonne
US$ (Billion)
` (Crores)
Million tonne
US$ (Billion)
`(Crores)
Million tonne
US$ (Billion)
`(Crores)
Million tonne
US$ (Billion)
`(Crores)
Million tonne
US$ (Billion)
`(Crores)
Million tonne
US$ (Billion)
`(Crores)
IMPORT*
Crude oil 189.2 143.0 864875 189.4 112.7 687416 202.9 64.0 416579 213.9 70.2 470159 106.9 32.2 215730 106.8 37.6 241877
Products
LPG 6.6 6.1 37213 8.3 6.0 36571 9.0 3.9 25778 11.1 4.8 32124 4.8 1.7 11526 5.2 2.3 14943
Petrol 0.2 0.2 1481 0.4 0.4 2301 1.0 0.6 4207 0.5 0.2 1617 0.4 0.2 1498 0.2 0.1 581
Naphtha 1.0 1.0 6044 1.0 0.7 4592 2.9 1.5 9581 2.8 1.2 8374 1.5 0.6 4323 0.7 0.4 2570
Aviation Turbine Fuel
0.0 0.0 0 0.1 0.1 706 0.3 0.1 889 0.3 0.2 1109 0.2 0.1 552 0.1 0.1 492
Kerosene 0.0 0.0 0 0.03 0.03 172 0.04 0.02 158 0.0 0.0 0 0.0 0.0 0 0.0 0.0 0
Diesel 0.1 0.1 452 0.1 0.1 670 0.2 0.1 605 1.0 0.4 2959 0.7 0.3 1980 1.2 0.6 3798
Lubes 2.1 2.1 12985 2.1 2.1 12702 2.3 1.4 9478 2.1 1.3 8625 1.1 0.6 4308 1.2 0.8 5137
Fuel Oil/LSHS 1.3 0.9 5759 0.9 0.6 3659 1.2 0.4 2380 0.9 0.3 1848 0.5 0.1 908 0.5 0.2 1060
Bitumen 0.2 0.1 801 0.5 0.3 1623 0.9 0.3 1832 1.0 0.2 1638 0.4 0.1 666 0.4 0.1 734
Petcoke 3.6 0.7 4082 6.2 0.9 5383 10.0 0.9 5633 14.4 1.2 7929 8.3 0.6 3795 6.9 0.8 5440
Others** 1.6 1.2 7080 1.6 1.0 6266 1.7 0.7 4821 2.2 0.8 5342 1.2 0.4 2774 1.4 0.6 3790
Total product import
16.7 12.5 75896 21.3 12.1 74644 29.5 10.0 65361 36.3 10.6 71566 19.2 4.8 32330 17.8 6.0 38546
EXPORT
Total import (crude oil + product)
205.9 155.4 940771 210.7 124.9 762060 232.3 73.9 481940 250.2 80.8 541725 126.1 37.0 248059 124.6 43.5 280423
Products
LPG 0.2 0.3 1589 0.3 0.2 1455 0.2 0.1 785 0.3 0.2 1168 0.2 0.1 523 0.2 0.1 633
Petrol 15.2 15.4 92977 16.0 13.5 81971 16.8 9.1 59575 15.4 7.9 52920 8.2 3.9 26232 7.2 4.0 25453
Naphtha 8.3 7.6 46059 7.0 5.2 31619 7.1 3.1 20057 8.7 3.7 24616 4.2 1.6 10625 4.4 1.9 12526
Aviation Turbine Fuel
5.7 5.5 33246 5.5 4.2 25413 5.7 2.4 16007 7.3 3.3 22294 3.6 1.5 10297 3.3 1.6 10319
Kerosene 0.02 0.02 98 0.02 0.01 81 0.01 0.01 35 0.02 0.01 54 0.01 0.004 26 0.01 0.005 32
Diesel 26.5 24.3 148138 25.6 18.9 115149 24.0 10.2 66492 27.3 11.9 79857 13.8 5.6 37547 14.2 6.7 43026
LDO 0.03 0.02 135 0.01 0.005 28 0.0 0.0 0.0 0.2 0.1 399 0.0 0.0 0 0.01 0.003 17
Lubes 0.02 0.03 138 0.01 0.02 100 0.02 0.02 127 0.01 0.02 104 0.01 0.01 58 0.01 0.01 62
Fuel Oil/LSHS 6.2 3.7 22407 4.8 2.3 14251 2.8 0.7 4471 2.2 0.6 3930 1.1 0.3 1762 1.4 0.4 2781
Bitumen 0.1 0.1 321 0.1 0.04 245 0.1 0.03 176 0.04 0.01 37 0.03 0.003 21 0.04 0.01 67
Petcoke / CBFS 1.7 0.6 3980 0.6 0.30 1806 0.8 0.12 750 0.67 0.1 804 0.2 0.04 275 0.29 0.05 336
Others*** 3.8 3.2 19189 4.0 2.7 16462 2.9 1.3 8304 3.3 1.3 8710 1.1 0.4 2992 1.8 0.7 4693
Total product export
67.9 60.7 368279 63.9 47.3 288580 60.5 27.1 176780 65.5 29.0 194893 32.4 13.5 90358 32.8 15.5 99944
Net import 138.1 94.8 572492 146.8 77.6 473481 171.8 46.9 305160 184.7 51.8 346832 93.8 23.5 157701 91.8 28.0 180479
Net product export 51.2 48.2 292383 42.6 35.1 213936 31.1 17.1 111419 29.2 18.4 123327 13.1 8.7 58028 15.0 9.6 61398
Source: Oil companies & DGCIS Note: 1. *Import does not include LNG imports 2. **Other imports include Paraffin Wax, Petroleum Jelly, LSWR, Aviation Gas, MTBE & Reformate etc. 3.***Other exports include VGO, Benzene, Hexane, MTO, Sulphur etc.4. “Others” in exports include RIL-SEZ exports of “Others” with unspecified heavy ends

PPAC Ready Reckoner
29
Year US dollar($)
British pound(£)
Euro(€)
Japanese yen(¥)
Indian rupee (`) / foreign currency
2002-03 48.41 74.84 48.07 0.40
2003-04 45.92 77.74 54.01 0.41
2004-05 44.95 82.95 56.55 0.42
2005-06 44.28 79.02 53.88 0.39
2006-07 45.29 85.72 58.11 0.39
2007-08 40.24 80.80 56.99 0.35
2008-09 45.91 78.45 65.14 0.46
2009-10 47.42 75.88 67.08 0.51
2010-11 45.58 70.88 60.21 0.53
2011-12 47.95 76.40 65.90 0.61
2012-13 54.45 86.02 70.06 0.66
2013-14 60.50 96.23 81.14 0.60
2014-15 61.15 98.56 77.47 0.56
2015-16 65.46 98.76 72.31 0.55
2016-17 67.09 87.71 73.61 0.62
2017-18(up to 31.10.2017)
64.47 83.69 73.74 0.58
2017 : Month wise
Jan-17 68.08 83.86 72.33 0.59
Feb-17 67.08 83.82 71.46 0.59
Mar-17 65.88 81.24 70.34 0.58
Apr-17 64.51 81.54 69.17 0.59
May-17 64.42 83.21 71.23 0.57
Jun-17 64.44 82.51 72.41 0.58
Jul-17 64.46 83.75 74.20 0.57
Aug-17 63.97 83.04 75.60 0.58
Sep-17 64.44 85.73 76.79 0.58
Oct-17 65.08 85.92 76.48 0.58
Table 4.13 : Exchange rates of Indian Rupee (`)
Source: Reserve Bank of India (RBI) website.Note : The rates are average for the period.

PPAC Ready Reckoner
30


PPAC Ready Reckoner
32
Network/Region Entity Length(Kms)
Designcapacity
(mmscmd)Pipeline size
Average flow Apr-Sep
2017(P)(mmscmd)
% Capacity utilisationApr-Sep
2017
Hazira-Vijaipur-Jagdishpur Pipeline/Gas rehabilitation and expansion project pipeline/Dahej-Vijaipur Pipeline & spur/ Vijaipur-Dadri Pipeline
GAIL 4659 53.0 36" 31.15 58.77
DVPL-GREP upgradation (DVPL-2 & VDPL) GAIL 1119 54.0 48" 33.13 61.35
*Chhainsa-Jhajjar-Hissar Pipeline (CJPL) (Including spur lines) commisioned up to Sultanpur, Jhajjar-Hissar under hold (111 Km)
GAIL 265 5.0 36" /16" 1.05 21.00
Dahej-Uran-Panvel Pipeline (DUPL/ DPPL)including spur lines GAIL 875 19.9 30"/18" 15.39 77.34
*Dadri- Bawana-Nangal Pipeline (DBPL), Dadri-Bawana: 106 Km, Bawana-Nangal: 501 KM, spur line of BNPL: 196 Km
GAIL 835 31.0 36"/30"/24"/18" 5.77 18.61
Dabhol-Bengaluru Pipeline (Including spur) Phase -1- 997 km, Phase 2 - 114.6 km GAIL 1112 16.0 36"/4" 1.26 7.88
Kochi-Koottanad-Bengaluru-Mangalore(Phase-1) GAIL 48 6.0 16"/4" 2.97 49.50
Assam (Lakwa) GAIL 8 2.5 24" 0.39 15.60
Tripura (Agartala) GAIL 61 2.3 12" 1.22 53.04
Ahmedabad GAIL 133 2.9 12" 0.25 8.59
Rajasthan (Focus Energy) GAIL 151 2.4 12" 1.44 61.28
Bharuch, Vadodara (Undera) including RLNG+RIL GAIL 538 15.4 24"/16" 3.65 23.67
Mumbai GAIL 129 7.0 26" 6.02 85.63
KG Basin (including RLNG+RIL) GAIL 881 16.0 18" 5.24 32.76
Cauvery Basin GAIL 278 8.7 18" 3.32 38.33
East- West Pipeline (RGTIL) Reliance 1480 80.0 48" 15.00 18.75
Shahdol-Phulpur Pipeline (RGPL) Reliance 304 3.5 16" 0.29 8.29
GSPL network including spur lines GSPL 2613 43.0 Assorted 29.24 68.00
Assam Regional Network AGCL,DNPL 817 3.2 16" and
others 1.64 50.69
Dadri-Panipat IOCL 140 9.5 30"/10" 4.33 45.55
Uran-Trombay ONGC 24 6.0 20" 3.50 58.31
Total 16470 387.3
Table 5.1 : Gas pipeline network as on 01.10.2017
Source : Pipeline operating companies Note : *CJPL and DBPL pipelines are the extension of DVPL-2 / VDPL

PPAC Ready Reckoner
33
Sl. no. Network/Region Entity Length in Kms
Designcapacity
(mmscmd)Pipeline size
Status of pipeline laid
(Km)
1 Kochi - Kottanad - Bengaluru - Mangalore GAIL(India) Ltd. 1056 16.0 24”/18”/12” 70.8
2 Dabhol -Bengaluru (DBPL) Spur Lines, Phase-2 GAIL(India) Ltd. 302 16.0 36"/30"/24"/18" 0
3 Surat - Paradip* GAIL(India) Ltd. 2112 74.8 36"/24"/18" 0
4
Jagdishpur- Haldia-Bokaro-Dhamra (JHBDPL) (Phase-I, 755 Km, 7.44 MMSCMD Capacity)
GAIL(India) Ltd. 2539 16.0 30”/24"/18"/12”/8”/4” 189.4
5 Mallavaram - Bhilwada* GSPC India Transco Ltd. 2042 78.3 42”/36"/30"/
24"/18"/12” 0
6 Mehsana - Bathinda * GSPC India Gasnet Ltd. 2052 77.1 36”/24”/18”/12” 0
7 Bathinda -Jammu-Srinagar*
GSPC India Gasnet Ltd. 725 42.4 24”/18”/16”/
12”/8”/6” 0
8 Kakinada - Vizag-Srikakulam *
AP Gas Distribution Corporation. 391 90.0 24”/18 0
9 Ennore- Nellore* Gas Transmission India Pvt. Ltd. 250 36.0 24”/18” 0
10
Ennore-Thiruvallur-Bengaluru-Puducherry-Nagapattinam-Madurai-Tuticorin*
Indian Oil Corporation Ltd. 1385 84.7 28"/24”/16”/
12"/10" 0
11 Jaigarh-Mangalore* H-Energy Pvt. Ltd. 635 17.0 24" 0
Total 13489
Table 5.2 : Gas pipeline under execution / construction (as on 01.10.2017)
Source : PNGRB, GAIL (India) Ltd, Pipeline authorized companies *Competitive bidding.

PPAC Ready Reckoner
34
Onshore / Offshore Oil Pipelines
Existing pipelines Oilcompany Length in Kms
Annual capacity 2017-18
Actual utilisation upto September 2017 (P) Utilisation %
(MMT) (MMT)
CTF (Central Tank Farm) Kalol to CTF Nawagam - New (New line commissioned in Aug'2010)
ONGC
63 3.1 0.5 15.7
Nawagam-Koyali (18" line) 78 5.4 1.1 20.4
Nawagam-Koyali (14" line) (1) 78 3.3 0.7 20.4
MHN-NGM (Mehsana-Nawagam) trunk line - New (New crude oil trunk line commissioned. Under operation since Dec'2010) 77 2.3 1.0 45.8
CTF (Central Tank Farm), Ankleshwar to Koyali oil pipeline (AKCL- Ankleshwar Koyali Crude Line) excluding Cambay(2) 95 2.2 0.5 20.8
CTF (Central Tank Farm), Ankleshwar to CPF (Central Processing Facility), Gandhar (3) 44 0.4 0.0 0.0
CPF (Central Processing Facility), Gandhar to Saraswani ‘T’ point (4) 57 1.8 0.3 17.5
Akholjuni- Koyali oil pipe line (Commissioned in July 2010). Akholjuni to Laxmipura T' point 66 0.5 0.1 19.1
Lakwa-Moran oil line (New) (5) 18 1.5 0.0 3.1
Lakwa-Moran oil line (Old) 15 1.5 0.2 10.9
Geleki-Jorhat oil line 49 1.5 0.2 14.2
Borholla- Jorhat oil line 43 0.6 0.1 12.3
NRM (Narimanam) to CPCL (Chennai Petroleum Corporation Limited) 5 0.7 0.2 23.1
KSP-WGGS to TPK Refinery (Kesnapalli-West-Group Gathering Station to Tatipaka) 14 0.1 0.0 15.8
GMAA EPT (Gopavaram Early Production Terminal) to S. Yanam Unloading Terminal (3.5 Km long and 4"). New line commissioned on 28.07.10 4 0.1 0.0 27.5
Mumbai High - Uran - Trunk (MUT) 30’’ pipeline 204 15.6 5.1 32.4
Heera - Uran - Trunk (HUT) 24’’ pipeline 81 11.5 1.6 13.7
Bombay-Uran Trunk (BUT) 30’’ pipeline 203 6.4 0.0 0.0
Salaya-Mathura pipeline (SMPL) (1)
IOCL
2660 25.0 11.9 47.6
Paradip-Haldia-Barauni pipeline (PHBPL) (2) 1447 15.2 8.0 52.5
Mundra-Panipat pipeline 1194 8.4 4.1 49.0
Duliajan-Digboi-Bongaigaon-Barauni pipeline OIL 1193 8.4 3.3 39.3
Mangla-Bhogat pipeline CAIRN 660 8.7 3.8 44.1
Mundra- Bathinda pipeline HMPL 1017 9.0 2.7 30.4
Vadinar-Bina pipeline BPCL / BORL 937 6.0 3.6 59.8
Total: 10299 139.2 49.0 35.2
Table 5.3 : Major crude oil pipelines in India
Source: Oil companies Note:ONGC:1. ONGC: 78 km X 14” Nawagam-Koyali line was given on lease to IOC in 2000 and was handed back to ONGC on 1st April 2010. The line was restored and re-commissioned in October
2012. 2. CTF Ankleshwar to Makan ‘T’ point section i.e. HOEC Junction (about 47.51 km) of CTF Ankleshwar-Koyali Refinery trunk pipeline was not in use up to August 2013. After damage
/ rupture of 8” CTF to CPF line on 25.08.2013, CTF to Koyali Trunk pipeline is in use from 31.08.2013 for dispatch of Ankleshwar crude oil including PSC & JV. CTF Ankleshwar to Koyali Crude Line (AKCL) actual quantity includes Ankleshwar, PSC, JV and Cambay crude oil also.
3. Crude oil from CTF Ankleshwar was being dispatched to CPF, Gandhar through 8” X 44.30 km pipeline up to 25.8.2013. Crude oil dispatched includes crude oil of PSC and JV also. After damage / rupture of 8” CTF to CPF line on 25.08.2013, this line is not in use.
4. Length and capacity includes length capacity of branch lines from GNAQ (well) and Dabka meeting at Magnad ‘T’ point and Mobha ‘T’ point respectively. 5. New 12” Lakwa-Moran Oil Line commissioned on 22.08.16. IOCL:1. 434 km added in SMPL since 1st April 2016 by commissioning of SMPL- Surendranagar Viramgam loopline on 7.8.16, Viramgam - Sidhpur section on 14.8.16, Abu road - Rajola
section on 21.3.17 and Sidhpur Abu road section on 29.4.17 along with capacity augmention from 21 MMTPA to 25 MMTPA on 7.8.16.2. Capacity augmented from 11 MMTPA to 15.2 MMTPA with commissioning of Balasore pump station on 29.3.17.


PPAC Ready Reckoner
36


PPAC Ready Reckoner
38
PPAC Ready Reckoner
Source: Oil companies Note: * Total (all product) sales include other petroleum products such as Naphtha, FO, ATF, Lubricants, Bitumen etc. - Per capita sales figures are based on provisional sales figures for the period April 2017-September 2017 - Population figures have been taken from Census of India, 2011
Highest per capita
(Sales figures in thousand metric tonnes)
State/UTLPG MS SKO HSD Total (All products)*
Sales Per capita sales (Kg) Sales Per capita
sales (Kg) Sales Per capita sales (Kg) Sales Per capita
sales (Kg) Total sales Per capita sales (Kg)
Chandigarh 26.2 24.8 50.8 48.1 0.1 0.1 55.6 52.8 225.6 213.9
Delhi 378.0 22.6 477.6 28.5 0.5 0.0 614.7 36.7 2498.2 149.1
Haryana 336.7 13.3 479.8 18.9 1.6 0.1 2623.9 103.5 5450.9 215.0
Himachal Pradesh 75.0 10.9 105.1 15.3 6.5 0.9 319.2 46.5 715.6 104.4
Jammu and Kashmir 92.7 7.4 128.4 10.2 64.3 5.1 362.5 28.9 741.9 59.1
Punjab 401.5 14.5 428.6 15.5 1.1 0.0 1711.0 61.8 3254.0 117.5
Rajasthan 573.3 8.4 724.0 10.6 42.5 0.6 2739.1 39.9 5891.9 85.9
Uttar Pradesh 1420.2 7.1 1379.6 6.9 362.4 1.8 4092.8 20.5 8216.7 41.2
Uttarakhand 128.8 12.7 144.4 14.3 10.6 1.0 345.7 34.2 720.5 71.2
SUB TOTAL NORTH 3432.2 9.3 3918.2 10.6 489.5 1.3 12864.5 34.9 27715.3 75.2
Andaman & Nicobar Islands
4.8 12.5 8.0 21.1 1.6 4.3 67.7 178.3 94.6 249.1
Bihar 552.2 5.3 354.4 3.4 234.6 2.3 1119.3 10.8 2479.8 23.9
Jharkhand 143.6 4.4 210.2 6.4 69.8 2.1 843.0 25.6 1519.2 46.1
Odisha 266.0 6.3 348.2 8.3 95.8 2.3 1209.3 28.8 2771.9 66.1
West Bengal 786.4 8.6 404.9 4.4 235.5 2.6 1632.3 17.9 4135.9 45.3
SUB TOTAL EAST 1753.0 6.5 1325.7 4.9 637.2 2.4 4871.6 18.0 11001.4 40.7
Arunachal Pradesh 9.7 7.0 18.8 13.6 5.4 3.9 66.0 47.7 108.6 78.5
Assam 175.0 5.6 170.8 5.5 95.8 3.1 422.9 13.6 1188.2 38.1
Manipur 11.8 4.3 25.8 9.5 7.8 2.9 44.8 16.4 94.0 34.5
Meghalaya 10.3 3.5 40.8 13.8 7.6 2.5 142.6 48.1 213.9 72.2
Mizoram 10.2 9.3 12.4 11.4 1.9 1.7 29.3 26.8 55.5 50.9
Nagaland 10.9 5.5 17.9 9.1 3.5 1.8 31.2 15.7 65.3 32.9
Sikkim 7.0 11.5 8.7 14.3 4.8 7.9 34.3 56.4 56.4 92.9
Tripura 20.6 5.6 23.2 6.3 11.4 3.1 43.4 11.8 105.8 28.8
SUB TOTAL NORTH EAST 255.4 5.6 318.4 7.0 138.2 3.0 814.3 17.9 1887.6 41.4
Chhattisgarh 123.7 4.8 254.9 10.0 36.6 1.4 788.0 30.9 1716.6 67.2
Dadra & Nagar Haveli 8.8 25.7 10.7 31.2 0.2 0.6 104.7 305.3 198.7 579.6
Daman & Diu 5.3 21.7 11.0 45.2 0.1 0.3 53.8 221.4 110.0 452.9
Goa 31.6 21.7 83.1 57.0 0.6 0.4 155.6 106.7 357.8 245.5
Gujarat 494.7 8.2 889.8 14.7 135.9 2.3 2496.1 41.3 8966.5 148.5
Madhya Pradesh 442.2 6.1 622.4 8.6 132.9 1.8 1641.3 22.6 3389.0 46.7
Maharashtra 1340.1 11.9 1602.1 14.3 156.4 1.4 4138.2 36.8 9868.0 87.8
SUB TOTAL WEST 2446.4 9.0 3473.9 12.7 462.8 1.7 9377.6 34.4 24606.5 90.2
Andhra Pradesh 528.4 10.7 522.8 10.6 21.8 0.4 1848.5 37.4 3406.8 69.0
Karnataka 765.7 12.5 967.0 15.8 52.5 0.9 3140.8 51.4 5916.2 96.8
Kerala 460.0 13.8 682.5 20.4 34.7 1.0 1280.0 38.3 2983.5 89.4
Lakshadweep 0.1 2.2 0.0 0.0 0.2 3.4 7.0 108.2 7.4 114.9
Puducherry 20.5 16.4 66.5 53.4 0.5 0.4 175.7 141.2 287.5 231.0
Tamil Nadu 965.1 13.4 1209.9 16.8 105.3 1.5 3344.0 46.4 6908.8 95.8
Telangana 424.9 12.0 539.0 15.3 41.2 1.2 1823.0 51.7 3214.5 91.1
SUB TOTAL SOUTH 3164.6 12.5 3987.7 15.8 256.1 1.0 11618.9 46.0 22724.6 90.0
All India 11051.7 9.1 13024.0 10.8 1983.8 1.6 39546.9 32.7 87935.4 72.7
Table 6.3 : State-wise sales of selected petroleum products : Apr-Sep 2017 (P)

PPAC Ready Reckoner
39
State/UT 2013-14 2014-15 2015-16 2016-17 Apr-Sep 2016 Apr-Sep 2017
Chandigarh 3528 3324 2988 0 0 0
Delhi 21636 0 0 0 0 0
Haryana 91260 90144 88344 66252 40956 0
Himachal Pradesh 24660 24636 24144 18120 11184 7248
Jammu & Kashmir 94698 90198 81180 73056 32760 25500
Punjab 90132 89664 85380 74334 39528 0
Rajasthan 508764 505284 495180 371400 229344 129984
Uttar Pradesh 1590000 1589388 1557600 1168212 721380 467280
Uttarakhand 36168 35916 35196 31692 16308 12672
SUB TOTAL NORTH 2460846 2428554 2370012 1803066 1091460 642684
Andaman & Nicobar Islands
6912 6408 5772 5160 2688 2064
Bihar 814068 812964 796704 710736 368976 302064
Jharkhand 268704 267936 262572 219696 121632 93384
Odisha 398988 397680 389724 292296 180504 124224
West Bengal 963528 962580 943332 788868 436860 352008
SUB TOTAL EAST 2452200 2447568 2398104 2016756 1110660 873744
Arunachal Pradesh 11479 11460 10320 9288 4776 3960
Assam 327966 327924 321372 289248 148848 122928
Manipur 24967 24960 23388 21060 10860 8952
Meghalaya 25943 25944 25428 22884 11772 9720
Mizoram 7800 7416 6672 6012 3084 2400
Nagaland 17100 17088 16752 15084 7764 6408
Sikkim 6348 6348 5712 4296 2640 1728
Tripura 39179 39180 38400 34560 17784 14688
SUB TOTAL NORTH EAST 460782 460320 448044 402432 207528 170784
Chhattisgarh 180072 175788 172272 135384 79800 57528
Dadra & Nagar Haveli 2280 2040 1836 1656 864 288
Daman & Diu 876 876 828 756 396 132
Goa 5244 5244 5136 4620 2388 1152
Gujarat 673416 670752 657336 493008 304392 172560
Madhya Pradesh 625668 625572 589824 442368 273168 176952
Maharashtra 730464 695844 626256 563640 290040 197280
SUB TOTAL WEST 2218020 2176116 2053488 1641432 951048 605892
Andhra Pradesh 465996 320580 266676 225696 123480 56424
Karnataka 522888 522768 509832 287532 194532 78000
Kerala 120192 120180 117780 88344 54528 30912
Lakshadweep 1008 1008 984 936 936 768
Puducherry 4440 4344 4260 3840 1968 800
Tamil Nadu 348696 348696 341724 307560 158280 107640
Telengana - 145404 174480 155436 80796 54408
SUB TOTAL SOUTH 1463220 1462980 1415736 1069344 614520 328952
All India 9055068 8975538 8685384 6933030 3975216 2622056
Table 6.4 : PDS SKO allocation
Source: MoP&NGNote: Delhi and Chandigarh have been declared Kerosene free from Q3, 2013-14 and Q1, 2016-17 respectively. Panjab and Haryana have been declared Kerosene free from Q1, 2017-18. SKO
allocation of Puducherry and Andhra Pradesh has been reduced to “Zero” w.e.f. 1.09.2017 and 1.10.2017 respectively.
(Kilo litre)
PPAC Ready Reckoner
40
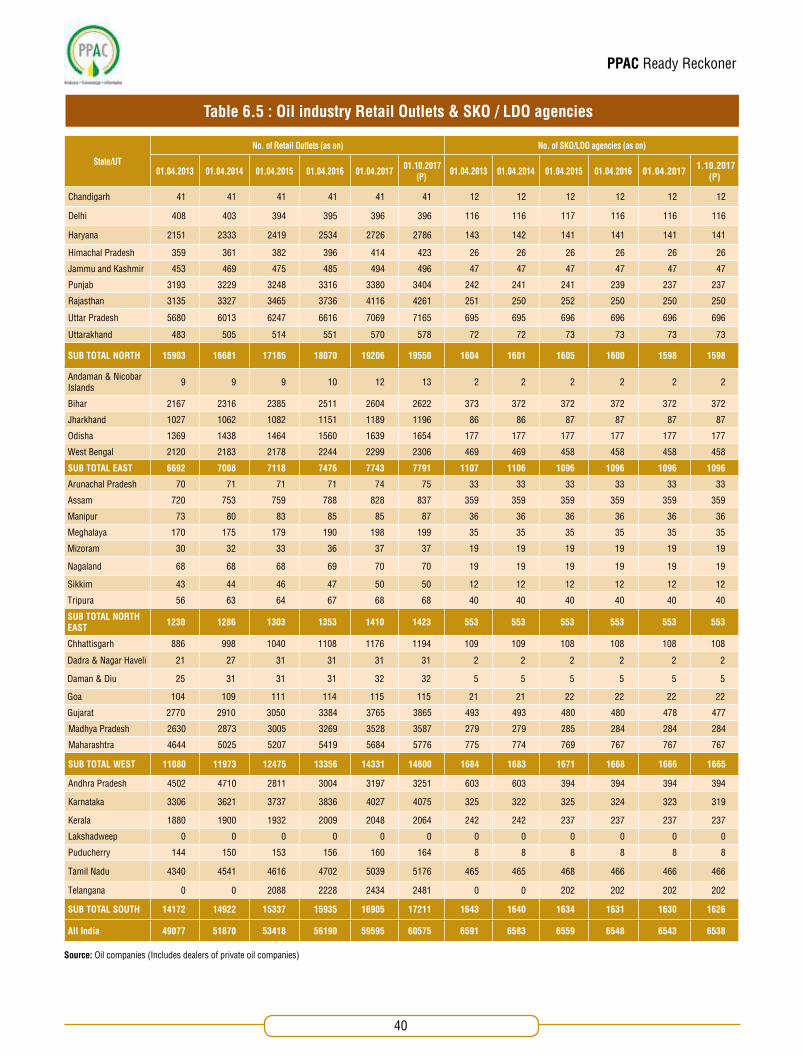
Source: Oil companies (Includes dealers of private oil companies)
State/UT
No. of Retail Outlets (as on) No. of SKO/LDO agencies (as on)
01.04.2013 01.04.2014 01.04.2015 01.04.2016 01.04.2017 01.10.2017 (P) 01.04.2013 01.04.2014 01.04.2015 01.04.2016 01.04.2017 1.10.2017
(P)
Chandigarh 41 41 41 41 41 41 12 12 12 12 12 12
Delhi 408 403 394 395 396 396 116 116 117 116 116 116
Haryana 2151 2333 2419 2534 2726 2786 143 142 141 141 141 141
Himachal Pradesh 359 361 382 396 414 423 26 26 26 26 26 26
Jammu and Kashmir 453 469 475 485 494 496 47 47 47 47 47 47
Punjab 3193 3229 3248 3316 3380 3404 242 241 241 239 237 237
Rajasthan 3135 3327 3465 3736 4116 4261 251 250 252 250 250 250
Uttar Pradesh 5680 6013 6247 6616 7069 7165 695 695 696 696 696 696
Uttarakhand 483 505 514 551 570 578 72 72 73 73 73 73
SUB TOTAL NORTH 15903 16681 17185 18070 19206 19550 1604 1601 1605 1600 1598 1598
Andaman & Nicobar Islands 9 9 9 10 12 13 2 2 2 2 2 2
Bihar 2167 2316 2385 2511 2604 2622 373 372 372 372 372 372
Jharkhand 1027 1062 1082 1151 1189 1196 86 86 87 87 87 87
Odisha 1369 1438 1464 1560 1639 1654 177 177 177 177 177 177
West Bengal 2120 2183 2178 2244 2299 2306 469 469 458 458 458 458
SUB TOTAL EAST 6692 7008 7118 7476 7743 7791 1107 1106 1096 1096 1096 1096
Arunachal Pradesh 70 71 71 71 74 75 33 33 33 33 33 33
Assam 720 753 759 788 828 837 359 359 359 359 359 359
Manipur 73 80 83 85 85 87 36 36 36 36 36 36
Meghalaya 170 175 179 190 198 199 35 35 35 35 35 35
Mizoram 30 32 33 36 37 37 19 19 19 19 19 19
Nagaland 68 68 68 69 70 70 19 19 19 19 19 19
Sikkim 43 44 46 47 50 50 12 12 12 12 12 12
Tripura 56 63 64 67 68 68 40 40 40 40 40 40
SUB TOTAL NORTH EAST 1230 1286 1303 1353 1410 1423 553 553 553 553 553 553
Chhattisgarh 886 998 1040 1108 1176 1194 109 109 108 108 108 108
Dadra & Nagar Haveli 21 27 31 31 31 31 2 2 2 2 2 2
Daman & Diu 25 31 31 31 32 32 5 5 5 5 5 5
Goa 104 109 111 114 115 115 21 21 22 22 22 22
Gujarat 2770 2910 3050 3384 3765 3865 493 493 480 480 478 477
Madhya Pradesh 2630 2873 3005 3269 3528 3587 279 279 285 284 284 284
Maharashtra 4644 5025 5207 5419 5684 5776 775 774 769 767 767 767
SUB TOTAL WEST 11080 11973 12475 13356 14331 14600 1684 1683 1671 1668 1666 1665
Andhra Pradesh 4502 4710 2811 3004 3197 3251 603 603 394 394 394 394
Karnataka 3306 3621 3737 3836 4027 4075 325 322 325 324 323 319
Kerala 1880 1900 1932 2009 2048 2064 242 242 237 237 237 237
Lakshadweep 0 0 0 0 0 0 0 0 0 0 0 0
Puducherry 144 150 153 156 160 164 8 8 8 8 8 8
Tamil Nadu 4340 4541 4616 4702 5039 5176 465 465 468 466 466 466
Telangana 0 0 2088 2228 2434 2481 0 0 202 202 202 202
SUB TOTAL SOUTH 14172 14922 15337 15935 16905 17211 1643 1640 1634 1631 1630 1626
All India 49077 51870 53418 56190 59595 60575 6591 6583 6559 6548 6543 6538
Table 6.5 : Oil industry Retail Outlets & SKO / LDO agencies


PPAC Ready Reckoner
42
Particulars IOCL BPCL HPCL RIL ESSAR Shell Others Total
POL terminal/depots (Nos.) 129 83 81 18$ 2 6* 319
Aviation fuel stations (Nos.) 105 50 38 28 1@ 222
Retail Outlets (total) (Nos.)
Out of which, Rural ROs (Nos)
26429 14137 14628 1400 3888 89 4^ 60575
7201 2542 3142 127 1333 11 14356
SKO/LDO agencies (Nos.) 3899 1001 1638 6538
LPG distributors (total) (Nos.) (PSUs only)
Out of which, Durgam Kshetriya Vitrak (Nos.)
9808 4783 4632 19223
1601 864 878 3343
LPG bottling plants (Nos.) (PSUs only) 91 50 47 1# 189
LPG bottling capacity (TMTPA) (PSUs only) 9025 3693 3762 24~ 16504
LPG registered domestic consumers (Nos. crore) (PSUs only)
12.12 6.40 6.59 25.11
Table 6.6 : Industry marketing infrastructure as on 01.10.2017 (P)
Table 6.7 : Break-up of consumption data (PSU and Pvt.)
Source: Oil companiesNote:$ RIL- 5 Terminals and 13 mini Depots * MRPL-4 and NRL-2; @ Shell MRPL-1; ^ MRPL-4# NRL-1; ~ NRL-24
(Thousand metric tonne)
Source: Oil companies Note : Private consumption also include private imports
Product 2014-15 2015-16 2016-17 Apr-Sep 2016 Apr-Sep 2017 (P)
PSU Private Total PSU Private Total PSU Private Total PSU Private Total PSU Private Total
LPG 17571 429 18000 19134 489 19623 21179 429 21608 10033 223 10257 11052 218 11269
MS 18588 487 19075 21079 768 21847 22518 1247 23765 11289 572 11862 12176 848 13024
Naphtha 4814 6268 11082 4790 8481 13271 4905 8335 13241 2509 4313 6822 2575 3361 5936
ATF 5319 404 5723 5629 632 6262 6186 812 6998 2966 402 3368 3342 322 3663
SKO 7087 0 7087 6826 0 6826 5397 0 5397 3079 0 3079 1984 0 1984
HSD 68701 715 69416 72092 2555 74647 71450 4577 76027 35341 1924 37265 36449 3132 39581
LDO 365 0 365 407 0 407 449 0 449 220 0 220 224 0 224
Lubes 1162 2148 3310 1312 2259 3571 1339 2131 3470 637 1106 1743 582 1096 1678
FO/LSHS 5167 794 5961 5665 968 6632 6009 1142 7150 3122 617 3739 2800 601 3401
Bitumen 4366 707 5073 4819 1118 5938 4721 1214 5936 2053 523 2577 1891 545 2436
PetCoke 2391 12167 14557 3483 15815 19297 3952 20012 23964 1701 11256 12957 2322 9416 11737
Others 2085 3785 5870 2299 4053 6352 2799 3795 6593 1266 2037 3302 1690 2030 3720
Total 137616 27904 165520 147535 37139 184674 150904 43693 194597 74217 22974 97191 77086 21569 98655

PPAC Ready Reckoner
43

PPAC Ready Reckoner
44
Source: Oil companies & Directorate General of Commercial Intelligence and Statistics (DGCIS)Note:1. Data in respect of enrolment, customers, distributors, ALDS and rated bottling capacity pertains to PSU OMCs only.2. Gross tankage includes LPG tankage at all refineries and fractionators, PSU OMCs bottling plants and LPG tankage available to PSU OMCs at import locations. 3. MOPNG vide letter no. P-20019/2/2016-LPG dated 23 June 2016 had issued unified guidelines for selection of LPG distributors. In the said guidelines, LPG distributor categories have
been redefined. The historical data on LPG distributors has been rearranged in line with the new classification for comparison.
(Thousand metric tonne )
Particulars 2013-14 2014-15 2015-16 2016-17 Apr-Sep 2016 Apr-Sep 2017 (P)
LPG Production 10032 9840 10600 11252 5301 5802
LPG Consumption 16294 18000 19623 21608 10257 11269
PSU Sales 15925 17571 19134 21179 10033 11052
Domestic 14412 16040 17182 18871 8943 9795
Non-Domestic 1074 1051 1464 1776 831 976
Bulk 246 316 317 364 178 188
Auto LPG 194 164 171 167 82 93
Imports
PSU Imports 6199 7884 8470 10668 4593 4985
Private Imports 369 429 489 429 223 218
(Number in lakhs)
Enrolment (domestic) 159.1 163.4 204.5 331.7 140.2 168.2
As on 1.4.2014 1.4.2015 1.4.2016 1.4.2017 1.10.2016 1.10.2017
LPG Customers (registered) 1682.6 1840.1 2041.1 2371.4 2180.6 2537.8
of which
Domestic customers 1662.6 1819.0 2017.9 2346.1 2156.4 2511.3
Non-domestic customers 20.1 21.1 23.3 25.3 24.2 26.5
LPG Active domestic customers - 1485.6 1662.5 1987.6 1810.2 2140.4
DBC Customers (registered) 827.4 917.0 1019.0 1089.3 1056.4 1123.2
(Nos.)
LPG Distributors 13896 15930 17916 18786 18214 19223
of which
Shehri Vitrak 7172 7334 7492 7677 7558 7739
Rurban Vitrak 1885 2263 2852 3152 2948 3302
Gramin & Durgam Kshetriya Vitrak 4839 6333 7572 7957 7708 8182
Auto LPG dispensing stations (ALDS)
678 681 676 675 677 677
LPG Markets (excluding RGGLVY) 5245 5485 5805 6015 5880 6176
(Thousand metric tonne per annum)
Bottling capacity (rated) 13515 14044 15172 16264 15502 16504
(Thousand metric tonne)
Gross tankage 777 781 869 878 874 881
Table 7.1 : LPG marketing at a glance

PPAC Ready Reckoner
45
Figures in Numbers
State/UT Sheheri Vitrak Rurban Vitrak Gramin Vitrak Durgam Kshetriya
VitrakTotal
Chandigarh 27 0 0 0 27Delhi 320 0 0 0 320Haryana 248 90 132 37 507Himachal Pradesh 69 12 64 22 167Jammu & Kashmir 128 39 33 50 250Punjab 335 205 178 63 781Rajasthan 418 156 318 179 1071Uttar Pradesh 987 649 966 437 3039Uttarakhand 109 100 31 17 257Sub Total North 2641 1251 1722 805 6419Arunachal Pradesh 5 5 24 29 63Assam 129 106 136 87 458Manipur 15 13 15 40 83Meghalaya 22 9 9 10 50Mizoram 11 6 12 25 54Nagaland 15 11 11 24 61Sikkim 8 1 3 3 15Tripura 17 9 26 11 63Sub Total North-East 222 160 236 229 847Andaman & Nicobar Islands 0 2 3 0 5Bihar 238 231 376 245 1090Jharkhand 161 38 77 122 398Odisha 172 86 117 214 589West Bengal 397 139 316 195 1047Sub Total East 968 496 889 776 3129Chhattisgarh 103 73 57 193 426Dadra & Nagar Haveli 2 0 0 0 2Daman & Diu 3 0 0 0 3Goa 44 2 5 0 51Gujarat 416 109 122 121 768Madhya Pradesh 464 212 137 437 1250Maharashtra 974 169 391 237 1771Sub Total West 2006 565 712 988 4271Andhra Pradesh 314 182 291 114 901Karnataka 516 124 212 173 1025Kerala 225 119 224 33 601Lakshadweep 1 0 0 0 1Puducherry 15 9 2 1 27Tamil Nadu 558 305 307 130 1300Telangana 273 91 244 94 702Sub Total South 1902 830 1280 545 4557All India 7739 3302 4839 3343 19223
Table 7.2 : Number of LPG distributors as on 01.10.2017 (P)
Source: PSU OMCs (IOCL,BPCL and HPCL) Note: MOPNG vide letter no. P-20019/2/2016-LPG dated 23 June 2016 has issued unified guidelines for selection of LPG distributors. In the said guidelines, LPG distributor categories have
been redefined as above.
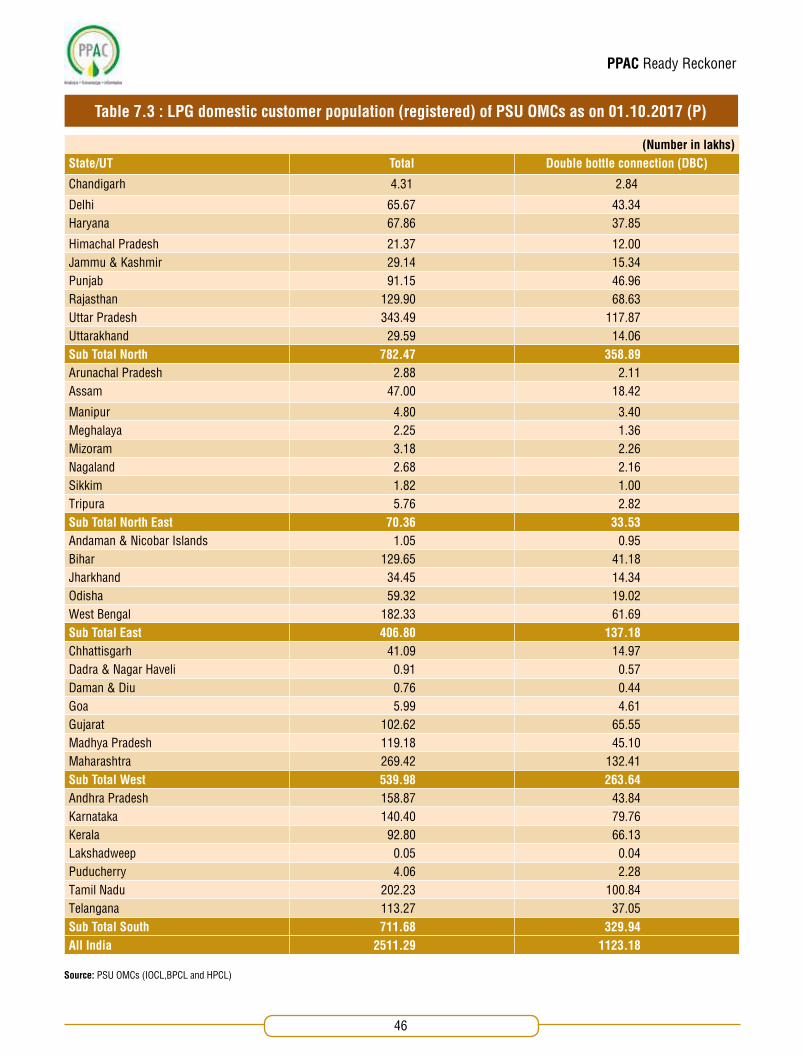
PPAC Ready Reckoner
46
(Number in lakhs)State/UT Total Double bottle connection (DBC)
Chandigarh 4.31 2.84
Delhi 65.67 43.34Haryana 67.86 37.85
Himachal Pradesh 21.37 12.00Jammu & Kashmir 29.14 15.34Punjab 91.15 46.96Rajasthan 129.90 68.63Uttar Pradesh 343.49 117.87Uttarakhand 29.59 14.06Sub Total North 782.47 358.89Arunachal Pradesh 2.88 2.11Assam 47.00 18.42
Manipur 4.80 3.40Meghalaya 2.25 1.36Mizoram 3.18 2.26Nagaland 2.68 2.16Sikkim 1.82 1.00Tripura 5.76 2.82Sub Total North East 70.36 33.53Andaman & Nicobar Islands 1.05 0.95Bihar 129.65 41.18Jharkhand 34.45 14.34Odisha 59.32 19.02West Bengal 182.33 61.69Sub Total East 406.80 137.18Chhattisgarh 41.09 14.97Dadra & Nagar Haveli 0.91 0.57Daman & Diu 0.76 0.44Goa 5.99 4.61Gujarat 102.62 65.55Madhya Pradesh 119.18 45.10Maharashtra 269.42 132.41Sub Total West 539.98 263.64Andhra Pradesh 158.87 43.84Karnataka 140.40 79.76Kerala 92.80 66.13Lakshadweep 0.05 0.04Puducherry 4.06 2.28Tamil Nadu 202.23 100.84Telangana 113.27 37.05Sub Total South 711.68 329.94All India 2511.29 1123.18
Table 7.3 : LPG domestic customer population (registered) of PSU OMCs as on 01.10.2017 (P)
Source: PSU OMCs (IOCL,BPCL and HPCL)

PPAC Ready Reckoner
47
(Number in lakhs)
State/UT No. of householdsCensus 2011
Estimated house-holds as on 01.10.2017
Active connections as on 01.10.2017 LPG coverage (%)
Chandigarh 2.35 2.62 2.72 103.8Delhi 33.41 38.07 48.20 126.6Haryana 47.18 53.36 56.73 106.3Himachal Pradesh 14.77 16.02 14.49 90.4Jammu & Kashmir 20.15 23.28 21.68 93.1Punjab 54.10 59.05 71.50 121.1Rajasthan 125.81 143.46 117.41 81.8Uttar Pradesh 329.24 373.03 289.71 77.7Uttarakhand 19.97 22.44 21.95 97.8Sub Total North 646.98 731.32 644.38 88.1Arunachal Pradesh 2.62 3.06 2.04 66.5Assam 63.67 70.84 36.44 51.4Manipur 5.07 5.69 3.68 64.6Meghalaya 5.38 6.37 1.58 24.8Mizoram 2.21 2.55 2.50 97.8Nagaland 4.00 3.98 1.88 47.3Sikkim 1.28 1.39 1.20 86.6Tripura 8.43 9.25 4.61 49.8Sub Total North East 92.66 103.14 53.93 52.3Andaman & Nicobar Islands 0.93 0.97 0.72 74.2
Bihar 189.41 221.08 119.09 53.9Jharkhand 61.82 70.93 29.68 41.8Odisha 96.61 105.52 51.98 49.3West Bengal 200.67 218.90 169.52 77.4Sub Total East 549.44 617.40 371.00 60.1Chhattisgarh 56.23 64.59 36.08 55.9Dadra & Nagar Haveli 0.73 1.00 0.81 80.8Daman & Diu 0.60 0.82 0.57 70.0Goa 3.23 3.40 4.64 136.4Gujarat 121.82 137.30 83.18 60.6Madhya Pradesh 149.68 169.68 101.08 59.6Maharashtra 238.31 263.41 233.85 88.8Sub Total West 570.59 640.19 460.21 71.9Andhra Pradesh 126.04 135.17 130.19 96.3Karnataka 131.80 145.33 124.85 85.9Kerala 77.16 79.65 81.54 102.4Lakshadweep 0.11 0.11 0.04 36.2Puducherry 3.01 3.57 3.50 98.0Tamil Nadu 184.93 203.92 178.72 87.6Telangana 84.21 90.30 92.03 101.9Sub Total South 607.26 658.06 610.87 92.8All India 2466.93 2750.12 2140.39 77.8
Table 7.4: LPG coverage (estimated) as on 01.10.2017 (P)
Source: PSU OMCs (IOCL, BPCL and HPCL)

PPAC Ready Reckoner
48
(Number in lakhs)
State/UT 2016-17 Apr-Sep 2017
14.2 Kg 5 Kg Total 14.2 Kg 5 Kg Total
Chandigarh 0.14 0.0000 0.14 0.05 0.0000 0.05
Delhi 1.90 0.0003 1.90 0.85 0.0001 0.85
Haryana 7.10 0.0000 7.10 2.82 0.0000 2.82
Himachal Pradesh 0.71 0.0000 0.71 0.55 0.0000 0.55
Jammu & Kashmir 3.84 0.0016 3.84 1.92 0.0009 1.92
Punjab 7.39 0.0004 7.39 2.71 0.0001 2.71
Rajasthan 22.46 0.0002 22.46 8.21 0.0001 8.21
Uttar Pradesh 77.33 0.0239 77.35 18.51 0.0049 18.52
Uttarakhand 2.55 0.0000 2.55 0.96 0.0000 0.96
Sub Total North 123.40 0.0265 123.42 36.57 0.0060 36.58
Arunachal Pradesh 0.16 0.0000 0.16 0.12 0.0000 0.12
Assam 3.64 0.0000 3.64 4.07 0.0001 4.07
Manipur 0.28 0.0000 0.28 0.33 0.0000 0.33
Meghalaya 0.12 0.0000 0.12 0.16 0.0000 0.16
Mizoram 0.07 0.0000 0.07 0.04 0.0000 0.04
Nagaland 0.14 0.0001 0.14 0.11 0.0000 0.11
Sikkim 0.08 0.0000 0.08 0.06 0.0000 0.06
Tripura 0.39 0.0000 0.39 0.25 0.0000 0.25
Sub Total North East 4.88 0.0001 4.88 5.13 0.0001 5.13
Andaman & Nicobar Islands 0.08 0.0000 0.08 0.03 0.0000 0.03
Bihar 33.45 0.0053 33.45 20.40 0.0025 20.41
Jharkhand 7.10 0.0006 7.10 3.99 0.0002 3.99
Odisha 12.75 0.0144 12.76 7.48 0.0013 7.48
West Bengal 36.15 0.0002 36.15 24.80 0.0000 24.80
Sub Total East 89.53 0.0204 89.55 56.70 0.0040 56.70
Chhattisgarh 12.17 0.0003 12.17 5.35 0.0003 5.35
Dadra & Nagar Haveli 0.07 0.0000 0.07 0.10 0.0000 0.10
Daman & Diu 0.04 0.0000 0.04 0.02 0.0000 0.02
Goa 0.20 0.0001 0.21 0.09 0.0000 0.09
Gujarat 11.01 0.0000 11.01 6.28 0.0000 6.28
Madhya Pradesh 26.04 0.0004 26.04 7.61 0.0037 7.61
Maharashtra 22.97 0.0005 22.97 13.64 0.0002 13.64
Sub Total West 72.49 0.0012 72.50 33.09 0.0041 33.09
Andhra Pradesh 10.67 0.0000 10.67 13.39 0.4739 13.86
Karnataka 9.72 0.0072 9.73 10.07 0.0021 10.07
Kerala 3.14 0.0000 3.14 1.71 0.0000 1.71
Lakshadweep 0.00 0.0000 0.00 0.00 0.0000 0.00
Puducherry 0.12 0.0000 0.12 0.07 0.0000 0.07
Tamil Nadu 11.73 0.0000 11.73 8.02 0.0000 8.02
Telangana 6.00 0.0001 6.00 2.93 0.0000 2.93
Sub Total South 41.38 0.0074 41.39 36.20 0.4760 36.67
All India 331.68 0.0557 331.73 167.69 0.4903 168.18
Table 7.5 : LPG domestic customers enrolment (14.2 kg/5 kg) by PSU OMCs
Source: PSU OMCs (IOCL, BPCL and HPCL)

PPAC Ready Reckoner

PPAC Ready Reckoner
50
Table 8.1 : Price of crude oil in India
Note : The Indian basket of Crude Oil (for 2017-18) represents a derived basket comprising of Sour grade (Oman & Dubai average) and Sweet grade (Brent Dated) of Crude oil processed in Indian refineries in the ratio of 72.38:27.62 during 2016-17.
Year Indian basket crude oil ($/bbl)
2002-03 26.60
2003-04 27.98
2004-05 39.21
2005-06 55.72
2006-07 62.46
2007-08 79.25
2008-09 83.57
2009-10 69.76
2010-11 85.09
2011-12 111.89
2012-13 107.97
2013-14 105.52
2014-15 84.16
2015-16 46.18
2016-17 47.56
2017-18(up to 31.10.2017)
51.20
2017 : Month wise
Jan-17 54.08
Feb-17 54.86
Mar-17 51.47
Apr-17 52.49
May-17 50.57
Jun-17 46.56
Jul-17 47.86
Aug-17 50.63
Sep-17 54.52
Oct-17 56.06


PPAC Ready Reckoner
53
Sl. no. Elements Unit Effective15.11.2017
1* FOB Price at Arab Gulf of jet / kero (kerosene) $/bbl 67.34
2* Add: Ocean freight from AG to Indian ports $/bbl 1.38
3 C&F (cost & freight) price $/bbl 68.72
or `/litre 27.78
4* Import charges (insurance/ocean loss/ LC charge/port dues) `/litre 0.22
5* Customs duty `/litre NIL
6* Import Parity Price (IPP) (at 29.5º C) (sum of 3 to 5) `/litre 28.00
7* Refinery Transfer Price (RTP) for PDS Kerosene** (price paid by the oil marketing companies to refineries) `/litre 28.00
8* Add : Inland freight and delivery charges `/litre 0.77
9* Add : Marketing cost of OMCs `/litre 0.37
10* Add : Marketing margin of OMCs `/litre 0.23
11 Total cost price (sum of 7 to 10)(Before GST and wholesale & retail dealer commission) `/litre 29.37
12* Less: Under-recovery to OMCs `/litre 10.31
13 Price charged to dealers (depot price) (11-12)(Excluding GST) `/litre 19.05
14* Add : Wholesale & retail dealer commission and other charges fixed by state Govern-ment `/litre 1.80
15* Add : GST (including GST on wholesale & retail dealer commission) @5% `/litre 1.04
16 Retail Selling Price (RSP) at Mumbai *** (sum of 13 to 15) `/litre 21.89
Table 8.2 : Price build-up of PDS SKO at Mumbai
* The explanatory notes are given in Table 8.3.**Monthly RTP is weighted average of all Indian pricing ports.*** The price revision is subject to notification from the state Govt.

PPAC Ready Reckoner
54
Sl. no. Elements Description
1 FOB price FOB (free on board) daily quotes of jet/kerosene at Arab Gulf including premium / discount published by Platts and Argus publications are averaged for the previous month.
2 Ocean freight Ocean freight from Arab Gulf to destination Indian ports as per World Scale freight rates adjusted for AFRA.
4 Import charges Import charges comprises of insurance, ocean loss, LC charges & port dues applicable on import of product.
5 Customs duty Customs duty on PDS kerosene is nil.
6 Import Parity Price (IPP) IPP represents the price that importers would pay in case of actual import of kerosene at the respective Indian ports.
7 Refinery Transfer Price (RTP) RTP based on Import Parity Price is the price paid by OMCs to refineries.
8 Inland freight & delivery charges It comprises of average freight from ports to inland locations and delivery charges.
9& 10 Marketing cost & margin Marketing cost & margin are as fixed in the 'PDS Kerosene and LPG (Domestic) Subsidy
Scheme, 2002'.
12 Under recovery to OMCsDifference between desired price (based on import parity) and actual selling price (excluding GST, wholesale & retail dealer commission and other charges) represents under-recoveries to OMCs.
14
Wholesale & retail dealer commission and other charges fixed by state Government
Commission fixed for wholesale & retail dealer and other charges like delivery charges by district authorities / state Government.
15 GST GST Rate as applicable on PDS SKO is 5%.
Table 8.3 : Element wise explanation of price build up of PDS kerosene

PPAC Ready Reckoner
55
Sl. no. Elements Unit Effective01.11.2017
1* FOB Price at Arab Gulf (AG) of LPG $/MT 564.88
2* Add: Ocean freight from AG to Jamnagar $/MT 16.05
3 C&F (Cost & Freight) price $/MT 580.92
or `/cylinder 537.47
4* Import charges (insurance/ocean loss/ LC charge/port dues) `/cylinder 4.89
5* Customs Duty `/cylinder NIL
6* Import Parity Price (IPP) (sum of 3 to 5) `/cylinder 542.36
7* Refinery Transfer Price (RTP) for domestic LPG(price paid by the oil marketing companies to refineries) `/cylinder 542.36
8* Add: Storage / distribution cost & return on investment `/cylinder 9.82
9* Add: Bottling charges `/cylinder 20.58
10* Add: Charges for cylinder cost `/cylinder 18.11
11* Add: Inland freight `/cylinder 30.56
12 Bottling plant cost before stock loss and working capital (sum of 7 to 11) `/cylinder 621.43
13* Add: Cost of working capital `/cylinder 2.81
14 Cost price at LPG bottling plant (sum of 12 to 13) `/cylinder 624.23
15* Add: Delivery charges `/cylinder 10.00
16* Add : Uncompensated Costs `/cylinder 23.63
17 Market determined price (sum of 14 to 16) `/cylinder 657.86
18* Add : GST(including GST on Distributor Commission) @5% `/cylinder 35.36
19* Add : Distributor commission `/cylinder 49.25
20 Retail Selling Price (RSP) (sum of 17 to 19) `/cylinder 742.47
21 RSP at Delhi (Rounded) `/cylinder 742.00
22* Less: Cash compensation on LPG by Government to consumers under DBTL `/cylinder 222.68
23* Less: Cash compensation on LPG by OMCs, towards 'Uncompensated Costs' charged in the current RSP, to consumers `/cylinder 23.63
24 Effective cost to consumer after subsidy (21-22-23) `/cylinder 495.69
Table 8.4 : Price build-up of domestic LPG at Delhi
* The explanatory notes are given in table 8.5.

PPAC Ready Reckoner
56
Sl. no. Elements Description
1 FOB price FOB (free on board) of LPG is weighted average of Saudi Aramco contract price (CP) for butane (60%) & propane (40%) for previous month and also includes daily quotes of premium / discount (published by Platts Gaswire) averaged for the previous month.
2 Ocean freight Ocean freight from Arab Gulf to destination Indian port (i.e. Jamnagar) based on charter hire rates obtained from Clarkson Shipping Intelligence weekly.
4 Import charges Import charges comprises of insurance, ocean loss, LC charges & port dues applicable on import of LPG.
5 Customs duty Customs duty on domestic LPG is nil.
6 Import Parity Price (IPP)IPP represents the price that importers would pay in case of actual import of product at the respective Indian ports. Import parity principle is as envisaged in the 'PAHAL (DBTL) Scheme, 2014'.
7 Refinery Transfer Price (RTP)RTP is based on import parity price. This is the price paid by the oil marketing companies to domestic refineries for purchase of finished petroleum products at refinery gate.
8 Storage/distribution cost & return on investment
Storage/distribution cost & return on investment as fixed under notified 'PAHAL (DBTL) Scheme, 2014'.
9 Bottling charges The cost incurred towards filling LPG in 14.2 Kg. cylinders as per notified ‘PAHAL (DBTL) Scheme, 2014'.10 Charges for cylinder cost
11 Inland freight It comprises of freight from port to inland locations i.e. bottling plant.
13 Cost of working capital Interest on working capital for 18 days stock holding at SBI prime lending rate (PLR) as fixed under notified ‘PAHAL (DBTL) Scheme, 2014'.
15 Delivery charges It comprises of freight from bottling plant to distributor.
16Uncompensated costs (import costs, recovery for non-revision, rounding-off & delivery charges)
In the price buildup, oil marketing companies are charging the consumers on account of import costs, rounding-off & differential delivery charges. All these costs are not compensated to OMCs as per the PAHAL (DBTL) scheme.
18 GST GST rate as applicable on Domestic LPG is 5%
19 Distributor commission LPG distributor commission ` 49.25/Cylinder (including additional distributor commission) is as approved by MoP&NG.
22 & 23
Cash compensation to consumer under DBTL (including impact of uncompensated cost to OMCs)
Under DBTL Scheme, the difference between the price of domestic subsidized & non-subsidized LPG is being transferred to the bank account of consumers by OMCs. This also includes the uncompensated amount (as per S.No.16 above) which is borne by the OMCs.
Table 8.5 : Element wise explanation of price build up of domestic LPG

PPAC Ready Reckoner
57
w.e.f. 1st November 2017
Particulars `/Litre*
Refinery Transfer Price (RTP) on landed cost basis for BS IV petrol (price paid by the Oil Marketing Companies (OMCs) to refineries) 28.37
Price charged to dealers (excluding excise duty and VAT) 31.39
Add : Excise duty 19.48
Add : Dealer's commission 3.57
Add : VAT (including VAT on dealer's commission) applicable for Delhi @ 27% 14.70
RSP at Delhi (rounded) 69.14
w.e.f. 1st November 2017
Particulars `/Litre*
Refinery Transfer Price (RTP) on landed cost basis for BS IV diesel(price paid by the Oil Marketing Companies (OMCs) to refineries) 29.01
Price charged to dealers (excluding excise duty and VAT) 31.36
Add : Excise duty 15.33
Add : Dealer's commission 2.51
Add : VAT (including VAT on dealer's commission) applicable for Delhi @ 16.75% & Air ambience charges (pollution cess) ` 250/KL 8.53
RSP at Delhi (rounded) 57.73
Table 8.6 : Summarised buildup of Retail Selling Price (RSP) of petrol at Delhi
Table 8.7 : Summarised buildup of Retail Selling Price (RSP) of diesel at Delhi
*As per IOCL.
*As per IOCL.
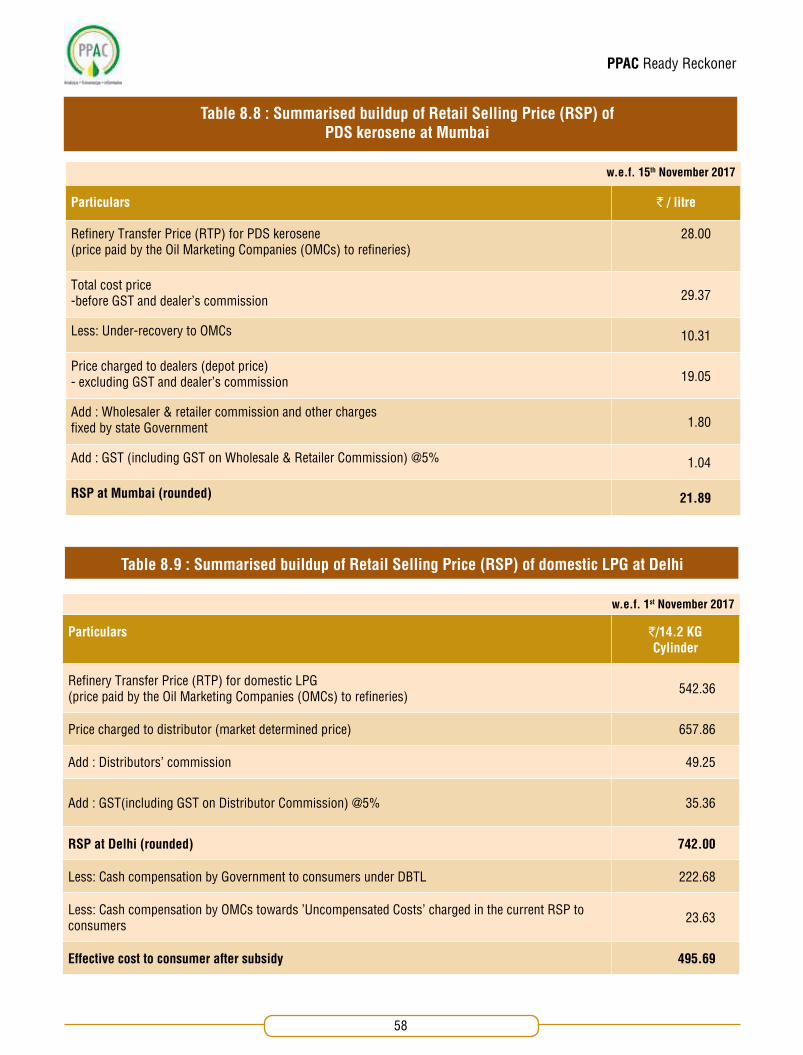
PPAC Ready Reckoner
58
w.e.f. 15th November 2017
Particulars ` / litre
Refinery Transfer Price (RTP) for PDS kerosene(price paid by the Oil Marketing Companies (OMCs) to refineries)
28.00
Total cost price-before GST and dealer's commission 29.37
Less: Under-recovery to OMCs 10.31
Price charged to dealers (depot price)- excluding GST and dealer's commission 19.05
Add : Wholesaler & retailer commission and other charges fixed by state Government 1.80
Add : GST (including GST on Wholesale & Retailer Commission) @5% 1.04
RSP at Mumbai (rounded) 21.89
w.e.f. 1st November 2017
Particulars `/14.2 KG Cylinder
Refinery Transfer Price (RTP) for domestic LPG(price paid by the Oil Marketing Companies (OMCs) to refineries) 542.36
Price charged to distributor (market determined price) 657.86
Add : Distributors' commission 49.25
Add : GST(including GST on Distributor Commission) @5% 35.36
RSP at Delhi (rounded) 742.00
Less: Cash compensation by Government to consumers under DBTL 222.68
Less: Cash compensation by OMCs towards 'Uncompensated Costs' charged in the current RSP to consumers 23.63
Effective cost to consumer after subsidy 495.69
Table 8.8 : Summarised buildup of Retail Selling Price (RSP) of PDS kerosene at Mumbai
Table 8.9 : Summarised buildup of Retail Selling Price (RSP) of domestic LPG at Delhi

PPAC Ready Reckoner
59
Particulars `/Litre Share in RSP
Price excluding taxes and dealers' commission 30.81 44.6%
Customs duty 0.58
Excise duty 19.48
Total central taxes 20.06 29.0%
Price charged to dealers - depot price 50.87
VAT (Including VAT on dealer's commission) 14.70
Total state taxes 14.70 21.3%
Total taxes 34.76 50.3%
Dealer's commission 3.57 5.2%
RSP per litre (rounded) 69.14 100.0%
Particulars `/Litre Share in RSP
Price excluding taxes and dealer's commission 30.77 53.3%
Customs duty 0.59
Excise duty 15.33
Total central taxes 15.92 27.6%
Price charged to dealers - depot price 46.69
VAT (Including VAT on dealer's commission) 8.53
Total state taxes 8.53 14.8%
Total taxes 24.45 42.4%
Dealer's commission 2.51 4.3%
RSP per litre (rounded) 57.73 100.0%
Particular Petrol Diesel
Basic duty 6.48 8.33
Additional excise duty (road cess) 6.00 6.00
Special additional excise duty 7.00 1.00
Total excise duty 19.48 15.33
Share of taxes in Retail Selling Price (RSP) of petroleum products
Table 8.10 : Share of taxes in RSP of petrol effective 1st November 2017 at Delhi
Table 8.11 : Share of taxes in RSP of diesel effective 1st November 2017 at Delhi
Table 8.12 : Break up of current excise duty on petrol & diesel (effective 4th October 2017)
(`/Litre)
Note : 1. The prices of petrol and diesel are as per IOCL at Delhi. 2. Customs duty on petrol and diesel as per RTP for 1st November 2017.
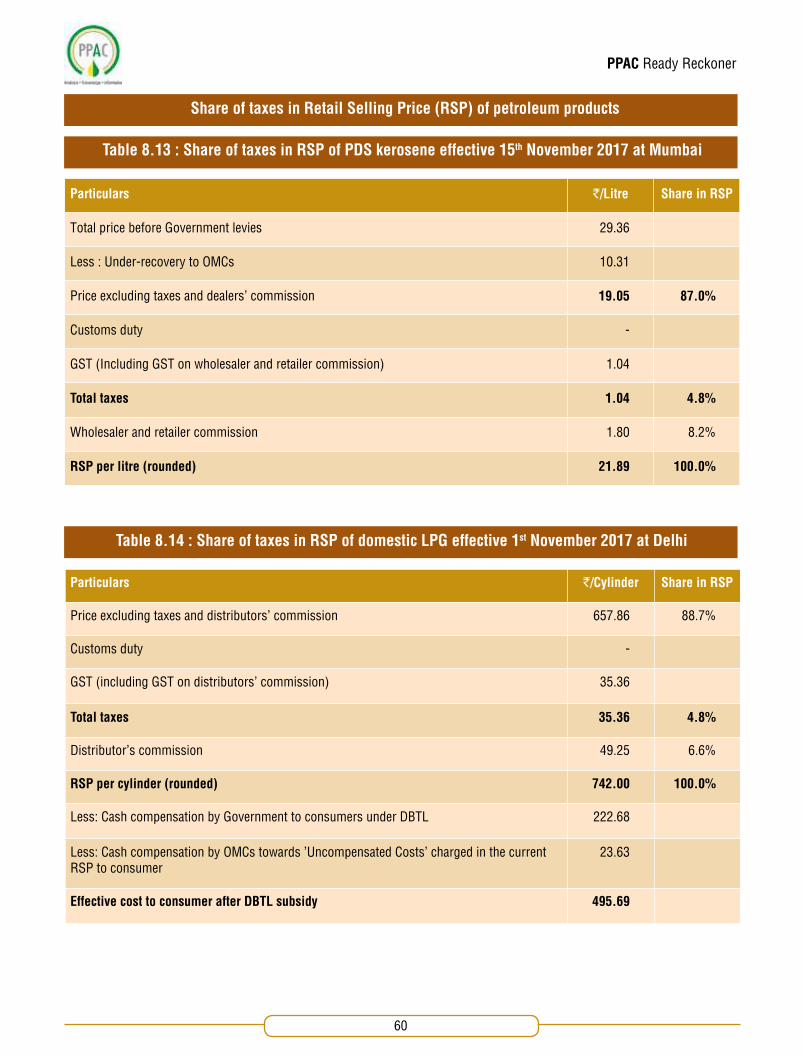
PPAC Ready Reckoner
60
Particulars `/Litre Share in RSP
Total price before Government levies 29.36
Less : Under-recovery to OMCs 10.31
Price excluding taxes and dealers' commission 19.05 87.0%
Customs duty -
GST (Including GST on wholesaler and retailer commission) 1.04
Total taxes 1.04 4.8%
Wholesaler and retailer commission 1.80 8.2%
RSP per litre (rounded) 21.89 100.0%
Particulars `/Cylinder Share in RSP
Price excluding taxes and distributors' commission 657.86 88.7%
Customs duty -
GST (including GST on distributors' commission) 35.36
Total taxes 35.36 4.8%
Distributor's commission 49.25 6.6%
RSP per cylinder (rounded) 742.00 100.0%
Less: Cash compensation by Government to consumers under DBTL 222.68
Less: Cash compensation by OMCs towards 'Uncompensated Costs' charged in the current RSP to consumer
23.63
Effective cost to consumer after DBTL subsidy 495.69
Share of taxes in Retail Selling Price (RSP) of petroleum products
Table 8.13 : Share of taxes in RSP of PDS kerosene effective 15th November 2017 at Mumbai
Table 8.14 : Share of taxes in RSP of domestic LPG effective 1st November 2017 at Delhi

PPAC Ready Reckoner
61
Product Weight in %
High Speed Diesel (HSD) 3.10
Petrol 1.60
Naphtha 0.87
Furnace Oil (FO) 0.67
LPG 0.64
Aviation Turbine Fuel (ATF) 0.32
Lube Oils 0.29
Bitumen 0.23
Kerosene 0.19
Petroleum Coke 0.05
Total 7.96
Product Increase in RSP Increase in inflation (WPI index)
Petrol ` 1/ litre 0.03%
Diesel ` 1/ litre 0.06%
PDS kerosene ` 1/ litre 0.01%
Domestic LPG ` 10/ cylinder 0.02%
Table 8.15 : Weightage of petroleum products in Wholesale Price Index (WPI)
Table 8.16 : Estimated impact of increase in Retail Selling Price (RSP) of major petroleum products on inflation (WPI index)
Source: Website of Office of the Economic Adviser, Ministry of Commerce & Industry
Note: Based on September 2017 WPI index (2011-12 Series).

PPAC Ready Reckoner
62
Important terms in pricing of petroleum products
1. Import Parity Price (IPP) – IPP represents the price that importers would pay in case of actual import of product at the
respective Indian ports. This includes the following elements:
i. FOB Price, ii. Ocean freight, iii. Insurance, iv. Customs duty, v. Port dues etc.
2. Export Parity Price (EPP) - EPP represents the price which oil companies would realize on export of petroleum products.
This includes the following elements:
i. FOB Price
ii. Advance licence benefit for duty free import of crude oil pursuant to export of refined products (currently nil)
3. Refinery Gate Price (RGP): This is the price paid by the Oil Marketing Companies to refineries for purchase of finished
petroleum products at refinery gate.
4. Retail Selling Price (RSP): This is the final price, inclusive of all duties and taxes, charged to the consumer.
Effective date Petrol Diesel
As on 1-Apr-04 707.00 425.00
21-Jun-05 778.00 467.00
01-Aug-05 848.00 509.00
01-Mar-07 894.00 529.00
16-May-07 1024.00 600.00
23-May-08 1052.00 631.00
27-Oct-09 1125.00 673.00
07-Sep-10 1218.00 757.00
01-Jul-11 1499.00 912.00
27-Oct-12 1794.00 1089.00
21-Dec-13 ` 1390.15/KL + 0.883% of product billable price 1186.00
23-Oct-14 ` 1499.37/KL + 0.887% of product billable price ` 1116.09/KL + 0.290% of product billable price
01-Aug-15 ` 1749.86/KL + 0.883% of product billable price ` 1301.70/KL + 0.286% of product billable price
16-Nov-15 ` 1750.08/KL + 0.883% of product billable price ` 1301.88/KL + 0.286% of product billable price
01-Jun-16 ` 1750.29/KL + 0.883% of product billable price ` 1302.06/KL + 0.286% of product billable price
05-Oct-16 ` 1868.14/KL + 0.875% of Product Billable Price ` 1389.35/KL + 0.280% of Product Billable Price
16-Nov-16 ` 2006.33/KL + 0.875% of Product Billable Price ` 1491.72/KL + 0.28% of Product Billable Price
01-Apr-17 ` 2020.38/KL + 0.859% of Product Billable Price ` 1502.13/KL + 0.267% of Product Billable Price
01-Jul-17 ` 2025.97/KL + 0.859% of Product Billable Price ` 1506.81/KL + 0.267% of Product Billable Price
01-Aug-17 ` 2674.74/KL + 0.859% of Product Billable Price ` 2031.38/KL + 0.257% of Product Billable Price
Dealer’s / distributor’s commission on petroleum productsTable 8.17 : Dealer’s commission on petrol & diesel
(Figures in ` /KL)
Note: In addition, effective 1st August 2017 slab based incentives is also given to eligible dealers through credit notes.
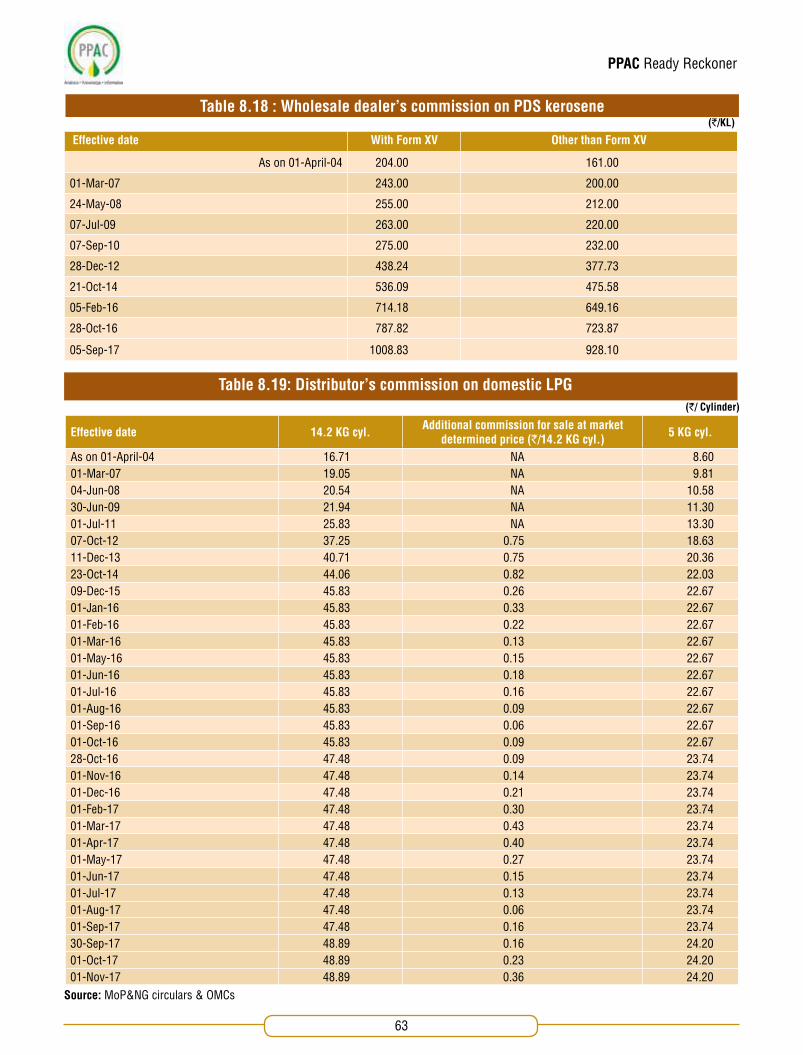
PPAC Ready Reckoner
63
Effective date With Form XV Other than Form XV
As on 01-April-04 204.00 161.00
01-Mar-07 243.00 200.00
24-May-08 255.00 212.00
07-Jul-09 263.00 220.00
07-Sep-10 275.00 232.00
28-Dec-12 438.24 377.73
21-Oct-14 536.09 475.58
05-Feb-16 714.18 649.16
28-Oct-16 787.82 723.87
05-Sep-17 1008.83 928.10
Table 8.18 : Wholesale dealer’s commission on PDS kerosene(`/KL)
Table 8.19: Distributor’s commission on domestic LPG
Effective date 14.2 KG cyl. Additional commission for sale at market determined price (`/14.2 KG cyl.) 5 KG cyl.
As on 01-April-04 16.71 NA 8.6001-Mar-07 19.05 NA 9.8104-Jun-08 20.54 NA 10.5830-Jun-09 21.94 NA 11.3001-Jul-11 25.83 NA 13.3007-Oct-12 37.25 0.75 18.6311-Dec-13 40.71 0.75 20.3623-Oct-14 44.06 0.82 22.0309-Dec-15 45.83 0.26 22.6701-Jan-16 45.83 0.33 22.6701-Feb-16 45.83 0.22 22.6701-Mar-16 45.83 0.13 22.6701-May-16 45.83 0.15 22.6701-Jun-16 45.83 0.18 22.6701-Jul-16 45.83 0.16 22.6701-Aug-16 45.83 0.09 22.6701-Sep-16 45.83 0.06 22.6701-Oct-16 45.83 0.09 22.6728-Oct-16 47.48 0.09 23.7401-Nov-16 47.48 0.14 23.7401-Dec-16 47.48 0.21 23.7401-Feb-17 47.48 0.30 23.7401-Mar-17 47.48 0.43 23.7401-Apr-17 47.48 0.40 23.7401-May-17 47.48 0.27 23.7401-Jun-17 47.48 0.15 23.7401-Jul-17 47.48 0.13 23.7401-Aug-17 47.48 0.06 23.7401-Sep-17 47.48 0.16 23.7430-Sep-17 48.89 0.16 24.2001-Oct-17 48.89 0.23 24.2001-Nov-17 48.89 0.36 24.20
(`/ Cylinder)
Source: MoP&NG circulars & OMCs
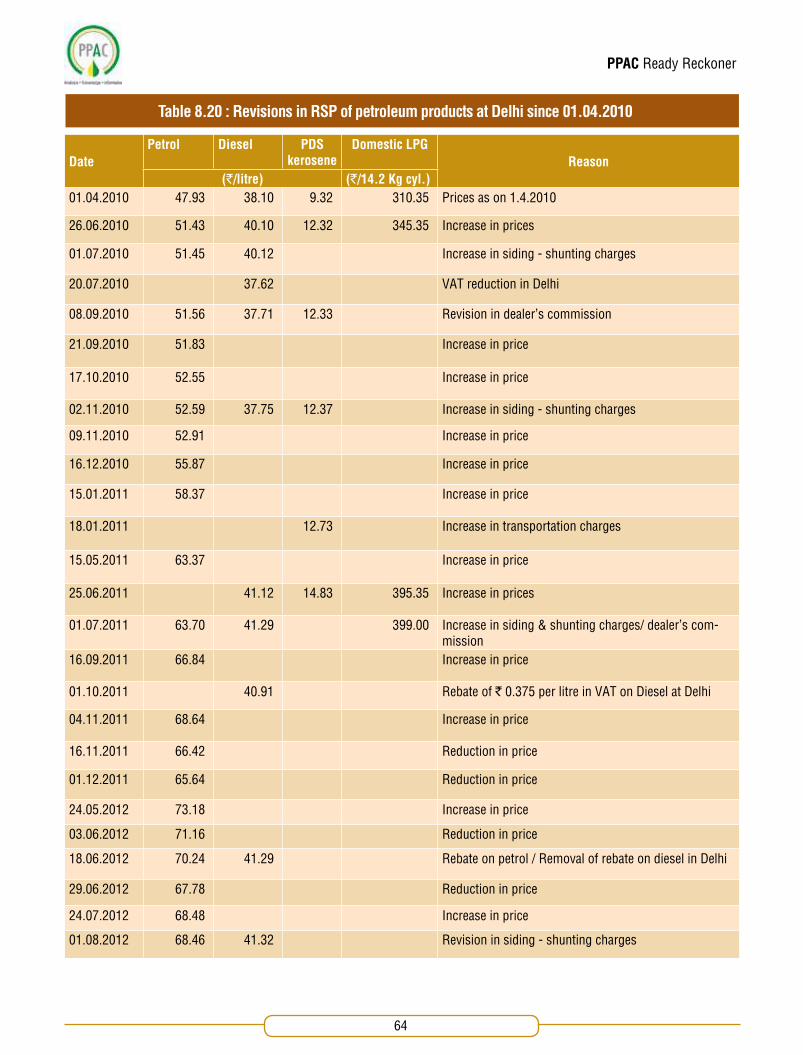
PPAC Ready Reckoner
64
DatePetrol Diesel PDS
keroseneDomestic LPG
Reason(`/litre) (`/14.2 Kg cyl.)
01.04.2010 47.93 38.10 9.32 310.35 Prices as on 1.4.2010
26.06.2010 51.43 40.10 12.32 345.35 Increase in prices
01.07.2010 51.45 40.12 Increase in siding - shunting charges
20.07.2010 37.62 VAT reduction in Delhi
08.09.2010 51.56 37.71 12.33 Revision in dealer's commission
21.09.2010 51.83 Increase in price
17.10.2010 52.55 Increase in price
02.11.2010 52.59 37.75 12.37 Increase in siding - shunting charges
09.11.2010 52.91 Increase in price
16.12.2010 55.87 Increase in price
15.01.2011 58.37 Increase in price
18.01.2011 12.73 Increase in transportation charges
15.05.2011 63.37 Increase in price
25.06.2011 41.12 14.83 395.35 Increase in prices
01.07.2011 63.70 41.29 399.00 Increase in siding & shunting charges/ dealer's com-mission
16.09.2011 66.84 Increase in price
01.10.2011 40.91 Rebate of ` 0.375 per litre in VAT on Diesel at Delhi
04.11.2011 68.64 Increase in price
16.11.2011 66.42 Reduction in price
01.12.2011 65.64 Reduction in price
24.05.2012 73.18 Increase in price
03.06.2012 71.16 Reduction in price
18.06.2012 70.24 41.29 Rebate on petrol / Removal of rebate on diesel in Delhi
29.06.2012 67.78 Reduction in price
24.07.2012 68.48 Increase in price
01.08.2012 68.46 41.32 Revision in siding - shunting charges
Table 8.20 : Revisions in RSP of petroleum products at Delhi since 01.04.2010

PPAC Ready Reckoner
65
Date
Petrol Diesel PDSkerosene
Domestic LPG
Reason(`/litre)
Subsidized Non-subsidized
(`/14.2 Kg cyl.)
14.09.2012 46.95 Increase in price
18.09.2012 756.50 Price notified for non-subsidized domestic LPG
01.10.2012 883.50 Increase in price
03.10.2012 14.79 Revision in siding - shunting charges
07.10.2012 410.50 895.50 Increase in domestic LPG distributor's commission
09.10.2012 67.90 Reduction in price
27.10.2012 68.19 47.15 Increase in dealer's commission
01.11.2012 922.50 Increase in price
02.11.2012 895.50 Reduction in price
16.11.2012 67.24 Reduction in price
16.01.2013 67.56 Removal of rebate in VAT at Delhi
18.01.2013 67.26 47.65 942.00 Increase (diesel & non-subsidized domestic LPG)/ reduction (petrol) in prices
28.01.2013 14.96 Increase in dealer's commission
16.02.2013 69.06 48.16 Increase in prices
01.03.2013 904.50 Reduction in price
02.03.2013 70.74 Increase in price
16.03.2013 68.34 Reduction in price
23.03.2013 48.67 Increase in price
01.04.2013 68.31 48.63 901.50 Revision in siding - shunting charges / reduction in price of non-subsidized domestic LPG
02.04.2013 67.29 Reduction in price
16.04.2013 66.09 48.67 Reduction in petrol price/ Increase in delivery charges of diesel
01.05.2013 63.09 847.00 Reduction in prices
11.05.2013 49.69 Increase in price
01.06.2013 63.99 50.25 802.00 Increase (petrol and diesel) / reduction (non-subsidized domestic LPG) in prices
16.06.2013 66.39 Increase in price
29.06.2013 68.58 Increase in price & delivery charges of petrol
01.07.2013 50.26 832.00 Increase in delivery charges of diesel/ increase in price of non-subsidized domestic LPG
02.07.2013 50.84 Increase in price
15.07.2013 70.44 Increase in price
01.08.2013 71.28 51.40 875.00 Increase in prices
01.09.2013 74.10 51.97 932.50 Increase in prices
14.09.2013 76.06 Increase in price
01.10.2013 72.40 52.54 1004.00 Increase (diesel & non-subsidized domestic LPG)/ reduction (petrol) in price
Table 8.20: Continued

PPAC Ready Reckoner
66
Table 8.20: Continued
Date
Petrol Diesel PDSkerosene
Domestic LPG
Reason(`/litre)
Subsidized Non-subsidized
(`/14.2 Kg cyl.)
01.11.2013 71.02 53.10 954.50 Increase (diesel)/ reduction (petrol & non-subsidized domestic LPG) in price
01.12.2013 53.67 1017.50 Increase in prices
11.12.2013 414.00 1021.00 Increase in distributor's commission on domestic LPG
21.12.2013 71.52 53.78 Increase in price of petrol & Increase in dealer's commission on petrol and diesel
04.01.2014 72.43 54.34 1241.00 Increase in prices
01.02.2014 54.91 1134.00 Increase (diesel)/ reduction (non-subsidized domestic LPG) in price
01.03.2014 73.16 55.48 1080.50 Increase (petrol & diesel)/ reduction (non-subsidized domestic LPG) in Price
01.04.2014 72.26 55.49 980.50 Reduction in prices (petrol & non-subsidized domestic LPG)/ increase in delivery charges of diesel
16.04.2014 71.41 Reduction in price
01.05.2014 928.50 Reduction in price
16.05.2014 56.71 Increase in price
01.06.2014 57.28 905.00 Increase (diesel)/ reduction (non-subsidized domestic LPG) in price
07.06.2014 71.51 Increase in price
25.06.2014 71.56 906.00 Increase in rail freight
01.07.2014 73.60 57.84 922.50 Increase in prices
01.08.2014 72.51 58.40 920.00 Increase (diesel)/ reduction (petrol & non-subsidized domestic LPG) in price
16.08.2014 70.33 Reduction in price
31.08.2014 68.51 58.97 Increase (diesel)/ reduction (petrol) in price
01.09.2014 901.00 Reduction in price
01.10.2014 67.86 880.00 Reduction in price
15.10.2014 66.65 Reduction in price
19.10.2014 55.60 Reduction in price
23.10.2014 417.00 883.50 Increase in domestic LPG distributor’s commission
01.11.2014 64.24 53.35 15.14* 865.00 Reduction in price/ price of PDS kerosene at Mumbai
01.12.2014 63.33 52.51 752.00 Reduction in prices
16.12.2014 61.33 50.51 Reduction in prices
01.01.2015 708.50 Reduction in price
17.01.2015 58.91 48.26 Reduction in prices
01.02.2015 605.00 Reduction in price
04.02.2015 56.49 46.01 Reduction in prices
16.02.2015 57.31 46.62 15.24 Increase in dealer's commission
01.03.2015 60.49 49.71 610.00 Increase in prices

PPAC Ready Reckoner
67
Date
Petrol Diesel PDSkerosene
Domestic LPG
Reason(`/litre)
RSP Effective cost after DBTL subsidy#
(`/14.2 Kg cyl.)
01.04.2015 60.00 48.50 621.00 417.82 Increase (non-subsidized domestic LPG)/ reduction (petrol and diesel) in prices
16.04.2015 59.20 47.20 Reduction in prices
1.05.2015 63.16 49.57 616.00 Increase (petrol and diesel) / reduction (domestic LPG) in prices
16.05.2015 66.29 52.28 Increase in prices
01.06.2015 626.50 Increase in price
16.06.2015 66.93 50.93 Increase (petrol) / reduction (diesel) in price
01.07.2015 66.62 50.22 608.50 Reduction in prices
16.07.2015 66.90 49.72 Reduction in price & increase in VAT rates at Delhi
01.08.2015 64.47 46.12 585.00 Reduction in prices
15.08.2015 63.20 44.95 Reduction in prices
01.09.2015 61.20 44.45 559.50 Reduction in prices
01.10.2015 44.95 517.50 Increase (diesel)/ reduction (domestic LPG) in price
16.10.2015 45.90 Increase in prices
01.11.2015 60.70 45.93 545.00 Decrease (petrol) / Increase (domestic LPG) in price / Increase in delivery charges of petrol & diesel
16.11.2015 61.06 46.80 Increase in prices
01.12.2015 60.48 46.55 606.50 Increase (domestic LPG)/ reduction (petrol and diesel) in price
09.12.2015 608.00 419.26 Increase in distributor's commission on domestic LPG
16.12.2015 59.98 46.09 Reduction in prices
01.01.2016 59.35 45.03 657.50 419.33 Increase (domestic LPG)/ reduction (petrol and diesel) in price / increase in additional distributor's commission on LPG
02.01.2016 59.35 45.03 Increase in excise duty on petrol and diesel without increase in RSPs
16.01.2016 59.03 44.18 Reduction in price along with increase in excise duty
19.01.2016 59.99 44.71 Increase in VAT rates at Delhi
31.01.2016 59.99 44.71 Increase in excise duty on petrol and diesel without increase in RSP
01.02.2016 59.95 44.68 575.00 419.22 Reduction in delivery charges of petrol and diesel/ reduction in price and additional distributor's commission of domestic LPG
18.02.2016 59.63 44.96 Reduction in price of petrol and increase in price of diesel
01.03.2016 56.61 46.43 513.50 419.13 Reduction in price of petrol/ increase in price of diesel/ reduction in ad-ditional distributor's commission of domestic LPG
04.03.2016 15.42 Increase in dealer's commission
17.03.2016 59.68 48.33 Increase in prices
01.04.2016 509.50 Reduction in price
05.04.2016 61.87 49.31 Increase in prices
16.04.2016 61.13 48.01 Reduction in prices
25.04.2016 15.36 Reduction in SSC on PDS kerosene in Mumbai
Table 8.20 : Continued
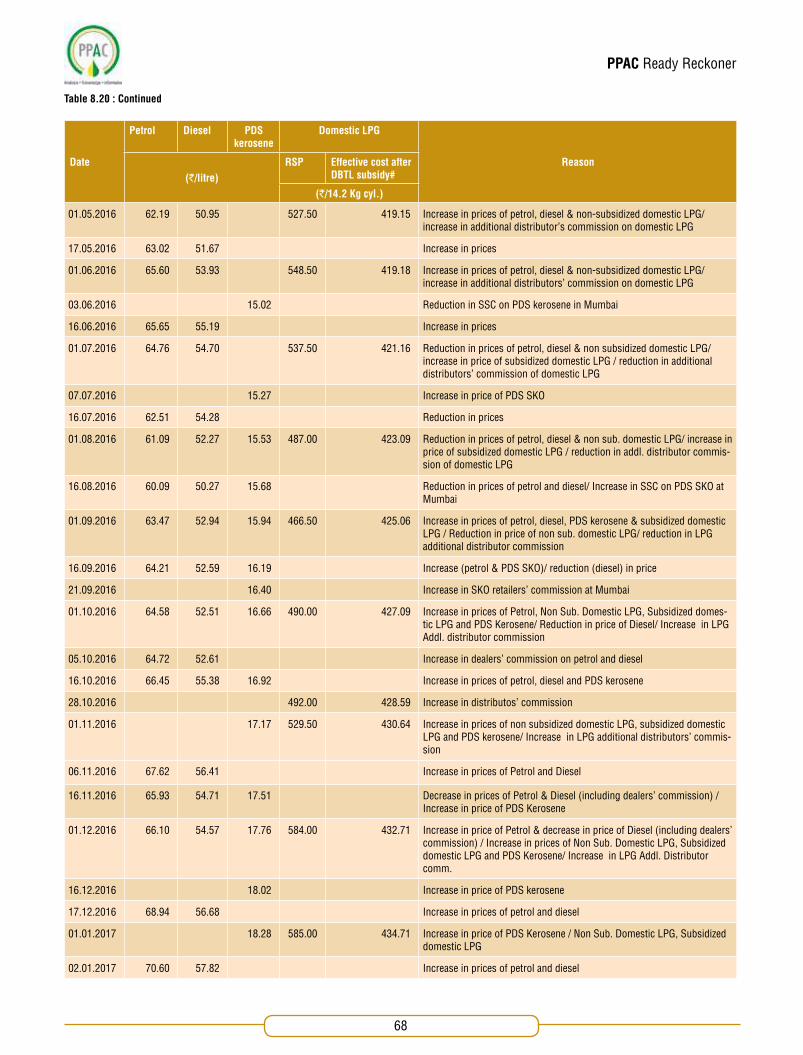
PPAC Ready Reckoner
68
Table 8.20 : Continued
Date
Petrol Diesel PDSkerosene
Domestic LPG
Reason(`/litre)
RSP Effective cost after DBTL subsidy#
(`/14.2 Kg cyl.)
01.05.2016 62.19 50.95 527.50 419.15 Increase in prices of petrol, diesel & non-subsidized domestic LPG/ increase in additional distributor's commission on domestic LPG
17.05.2016 63.02 51.67 Increase in prices
01.06.2016 65.60 53.93 548.50 419.18 Increase in prices of petrol, diesel & non-subsidized domestic LPG/ increase in additional distributors' commission on domestic LPG
03.06.2016 15.02 Reduction in SSC on PDS kerosene in Mumbai
16.06.2016 65.65 55.19 Increase in prices
01.07.2016 64.76 54.70 537.50 421.16 Reduction in prices of petrol, diesel & non subsidized domestic LPG/ increase in price of subsidized domestic LPG / reduction in additional distributors' commission of domestic LPG
07.07.2016 15.27 Increase in price of PDS SKO
16.07.2016 62.51 54.28 Reduction in prices
01.08.2016 61.09 52.27 15.53 487.00 423.09 Reduction in prices of petrol, diesel & non sub. domestic LPG/ increase in price of subsidized domestic LPG / reduction in addl. distributor commis-sion of domestic LPG
16.08.2016 60.09 50.27 15.68 Reduction in prices of petrol and diesel/ Increase in SSC on PDS SKO at Mumbai
01.09.2016 63.47 52.94 15.94 466.50 425.06 Increase in prices of petrol, diesel, PDS kerosene & subsidized domestic LPG / Reduction in price of non sub. domestic LPG/ reduction in LPG additional distributor commission
16.09.2016 64.21 52.59 16.19 Increase (petrol & PDS SKO)/ reduction (diesel) in price
21.09.2016 16.40 Increase in SKO retailers' commission at Mumbai
01.10.2016 64.58 52.51 16.66 490.00 427.09 Increase in prices of Petrol, Non Sub. Domestic LPG, Subsidized domes-tic LPG and PDS Kerosene/ Reduction in price of Diesel/ Increase in LPG Addl. distributor commission
05.10.2016 64.72 52.61 Increase in dealers' commission on petrol and diesel
16.10.2016 66.45 55.38 16.92 Increase in prices of petrol, diesel and PDS kerosene
28.10.2016 492.00 428.59 Increase in distributos' commission
01.11.2016 17.17 529.50 430.64 Increase in prices of non subsidized domestic LPG, subsidized domestic LPG and PDS kerosene/ Increase in LPG additional distributors' commis-sion
06.11.2016 67.62 56.41 Increase in prices of Petrol and Diesel
16.11.2016 65.93 54.71 17.51 Decrease in prices of Petrol & Diesel (including dealers’ commission) / Increase in price of PDS Kerosene
01.12.2016 66.10 54.57 17.76 584.00 432.71 Increase in price of Petrol & decrease in price of Diesel (including dealers’ commission) / Increase in prices of Non Sub. Domestic LPG, Subsidized domestic LPG and PDS Kerosene/ Increase in LPG Addl. Distributor comm.
16.12.2016 18.02 Increase in price of PDS kerosene
17.12.2016 68.94 56.68 Increase in prices of petrol and diesel
01.01.2017 18.28 585.00 434.71 Increase in price of PDS Kerosene / Non Sub. Domestic LPG, Subsidized domestic LPG
02.01.2017 70.60 57.82 Increase in prices of petrol and diesel

PPAC Ready Reckoner
69
Date
Petrol Diesel PDSkerosene
Domestic LPG
Reason(`/litre)
RSP Effective cost after DBTL subsidy#
(`/14.2 Kg cyl.)
16.01.2017 71.14 59.02 18.54 Increase in prices of petrol, diesel and PDS Kerosene
01.02.2017 18.77 651.50 434.80 Increase in price of PDS Kerosene / Non Sub. Domestic LPG, Subsidized domestic LPG
01.03.2017 737.50 434.93 Increase in price of Non Sub. Domestic LPG/ Additional Distributors com-mission on Subsidized domestic LPG
01.04.2017 66.29 55.61 723.00 440.90 Decrease in price of Petrol, Diesel & Non Sub. Domestic LPG / Increase in prices of Subsidized domestic LPG and / Decrease in LPG Addl. Distribu-tor comm.
07.04.2017 19.03 Increase in prices of PDS Kerosene
16.04.2017 68.07 56.83 19.29 Increase in price of Petrol, Diesel & PDS Kerosene
01.05.2017 68.09 57.35 19.65 631.00 442.77 Increase in price of Petrol, Diesel, PDS SKO & Sub. Domestic LPG / Decrease in prices of Non-Subsidized domestic LPG and Decrease in LPG Addl. Distributor comm.
16.05.2017 65.32 54.90 19.91 Decrease in price of Petrol and Diesel & Increase in prices of PDS SKO
01.06.2017 66.91 55.94 20.17 552.50 446.65 Increase in price of Petrol, Diesel, PDS SKO & Sub. Domestic LPG / Decrease in prices of Non-Subsidized domestic LPG and Decrease in LPG Addl. Distributor comm.
16.06.2017 65.48 54.49 20.43 Decrease in price of Petrol and Diesel & Increase in prices of PDS SKO
01.07.2017 63.09 53.33 21.09 564.00 477.46 Decrease in price of Petrol, Diesel & Increase in prices of PDS SKO & Sub. Domestic LPG / Non-Subsidized domestic LPG and Decrease in LPG Addl. Distributor comm.
11.07.2017 63.93 54.74 21.22 Increase in Price of Petrol and diesel and Revision in SSC on PDS SKO in Mumbai.
16.07.2017 64.11 54.93 21.48 Increase in prices of Petrol, Diesel & PDS SKO
01.08.2017 65.40 55.58 21.74 524.00 479.77 Increase in price of Petrol, Diesel, PDS SKO & Sub. Domestic LPG, Dealer Commission on Petrol & Diesel / Decrease in price of Non-Subsidized domestic LPG and LPG Addl. Distributor comm.
16.08.2017 68.14 57.36 22.00 Increase in price of Petrol, Diesel & PDS SKO
01.09.2017 69.26 57.13 22.27 597.50 487.18 Increase in price of Petrol, PDS SKO, Sub. Domestic LPG, Non-Subsi-dized domestic LPG and LPG Addl. Distributor comm. & Decrease in price of Diesel
16.09.2017 70.48 58.84 22.53 Increase in price of Petrol, Diesel & PDS SKO
01.10.2017 70.76 58.92 649.00 491.13 Increase in price of Petrol, diesel, Sub. Domestic LPG, Non-Subsidized domestic LPG and LPG Addl. Distributor comm.
01.11.2017 69.14 57.73 742.00 495.69 Decrease in price of Petrol & diesel and Increase in price of Sub. Domes-tic LPG, Non-Subsidized domestic LPG and LPG Addl. Distributor comm.
15.11.2017 69.68 58.32 21.89 Increase in Price of Petrol and diesel and Removal in SSC on PDS SKO in Mumbai
69.68 58.32 21.89* 742.00 495.69# RSP as on 15th November 2017
Note :1. Prices of petrol since 26.6.2010, non subsidized domestic LPG since 13.9.2012 and diesel since 19.10.2014 are as per IOCL.2. * Since there is ‘Nil’ allocation of PDS kerosene in Delhi currently, RSP of PDS kerosene from 1.11.2014 onwards is at Mumbai.3. # effective 1st January 2015, Modified DBTL scheme has been implemented in the entire country. The effective cost to consumer is after DBTL subsidy.4. Effective 16.06.2017 , the MS/HSD pricing is revised on daily basis , therefore the changes in MS/HSD pricing is shown only on the dates when SKO / LPG Pricing is changing.
Table 8.20 : Continued

PPAC Ready Reckoner
70
Table 8.21 : Selling price of diesel for bulk consumers in major cities(`/Litre)
Source : HPCL
Date Delhi Kolkata Mumbai Chennai
18-Jan-13 56.88 61.30 64.11 60.85
01-Feb-13 56.95 61.37 64.19 60.92
16-Feb-13 58.57 63.06 65.98 62.68
01-Mar-13 59.73 64.27 67.25 63.93
16-Mar-13 56.79 61.20 64.01 60.75
01-Apr-13 54.84 59.51 61.95 58.69
16-Apr-13 54.77 59.46 61.88 58.62
01-May-13 51.81 56.37 58.61 55.42
16-May-13 52.76 57.36 59.66 56.44
23-May-13 52.76 57.36 60.79 56.44
01-Jun-13 54.61 59.28 62.83 58.44
16-Jun-13 56.17 60.91 64.55 60.12
01-Jul-13 58.78 63.63 66.62 62.95
02-Jul-13 58.79 63.62 66.61 62.94
16-Jul-13 60.40 65.30 68.39 64.68
01-Aug-13 60.72 65.63 68.75 65.03
16-Aug-13 61.74 66.69 69.86 66.13
01-Sep-13 64.45 69.50 72.85 69.05
16-Sep-13 67.45 72.63 76.17 72.30
01-Oct-13 63.50 68.50 71.78 68.05
16-Oct-13 63.25 68.24 71.50 67.78
01-Nov-13 62.97 67.95 71.19 67.48
16-Nov-13 63.06 68.04 71.29 67.57
01-Dec-13 63.86 68.88 72.18 68.44
01-Jan-14 63.51 68.51 71.79 68.06
05-Jan-14 63.51 68.66 72.97 68.08
01-Feb-14 61.95 67.03 71.25 66.39
16-Feb-14 62.97 68.09 72.37 67.49
01-Mar-14 63.63 68.78 73.10 68.20
16-Mar-14 62.33 67.43 71.67 66.80
01-Apr-14 60.89 65.93 70.08 65.25
16-Apr-14 60.41 65.44 69.56 64.73
01-May-14 61.83 66.91 71.12 66.26
16-May-14 60.38 65.41 69.52 64.70
01-Jun-14 59.18 64.16 68.20 63.40
16-Jun-14 57.87 62.80 66.75 61.99
01-Jul-14 60.41 65.52 69.10 64.70
16-Jul-14 59.32 64.39 67.90 63.53
01-Aug-14 58.60 63.64 67.10 62.75
16-Aug-14 59.12 64.18 67.68 63.31
01-Sep-14 57.80 62.81 66.23 61.89
16-Sep-14 57.37 62.36 65.75 61.42
19-Oct-14 54.00 58.85 62.03 57.78
01-Nov-14 51.94 56.70 59.74 55.56
01-Dec-14 51.10 55.83 58.83 54.66
16-Dec-14 49.13 53.78 56.65 52.53
17-Jan-15 46.88 51.77 54.17 50.10
04-Feb-15 44.64 49.77 51.69 47.68
16-Feb-15 45.25 50.32 52.37 48.34
01-Mar-15 48.31 53.03 55.73 51.63
02-Apr-15 47.13 52.01 54.44 50.36
16-Apr-15 45.83 50.86 53.01 48.97
01-May-15 48.20 52.94 55.61 51.52
16-May-15 50.90 55.62 58.59 54.43
16-Jun-15 49.55 54.22 57.11 52.98
Date Delhi Kolkata Mumbai Chennai
01-Jul-15 48.84 53.52 56.32 52.21
16-Jul-15 48.29 51.53 53.84 49.78
01-Aug-15 44.50 48.26 49.80 45.82
15-Aug-15 43.33 47.26 48.56 44.61
01-Sep-15 42.83 46.84 48.03 44.09
01-Oct-15 43.33 47.26 50.56 44.61
16-Oct-15 44.27 48.07 51.57 45.59
01-Nov-15 44.30 48.10 51.60 45.62
16-Nov-15 45.17 48.85 52.52 46.53
01-Dec-15 44.92 48.65 52.26 46.29
16-Dec-15 44.46 48.26 51.77 45.82
01-Jan-16 43.41 47.35 50.64 44.72
16-Jan-16 42.56 46.63 49.74 43.83
19-Jan-16 43.07 46.63 49.74 43.83
01-Feb-16 43.04 46.60 49.71 43.80
18-Feb-16 43.32 46.83 50.00 44.09
01-Mar-16 44.78 48.07 51.54 45.59
17-Mar-16 46.68 49.25 53.53 47.54
05-Apr-16 47.65 50.08 54.56 48.55
16-Apr-16 46.36 48.98 51.97 47.21
01-May-16 49.29 51.46 55.05 50.23
07-May-16 48.77 51.46 55.05 50.23
17-May-16 50.02 52.54 55.25 51.54
01-Jun-16 52.28 54.60 57.65 53.88
16-Jun-16 53.53 55.86 58.98 55.19
01-Jul-16 53.04 54.66 58.44 55.36
16-Jul-16 52.62 54.95 58.03 54.23
01-Aug-16 50.62 53.06 55.90 52.15
16-Aug-16 48.63 51.35 54.07 50.08
01-Sep-16 51.29 53.63 56.90 52.85
16-Sep-16 50.94 53.33 56.53 52.48
01-Oct-16 50.86 53.27 56.44 52.40
16-Oct-16 53.62 55.96 59.38 55.27
06-Nov-16 54.65 56.99 60.47 56.34
16-Nov-16 52.84 55.18 58.54 54.45
01-Dec-16 52.70 55.04 58.39 54.31
17-Dec-16 54.80 57.15 60.63 56.50
02-Jan-17 55.94 58.28 61.83 57.68
16-Jan-17 57.13 59.48 63.10 58.92
01-Apr-17 53.73 56.08 59.49 57.01
16-Apr-17 54.95 57.30 60.79 58.32
01-May-17 55.47 57.82 61.33 58.87
16-May-17 53.02 55.45 58.70 56.22
01-Jun-17 54.06 56.49 59.80 57.33
16-Jun-17 52.59 55.01 58.24 55.75
01-Jul-17 51.46 54.04 57.01 54.51
16-Jul-17 53.08 56.10 56.87 56.32
01-Aug-17 53.41 56.43 57.22 56.67
16-Aug-17 54.60 57.62 58.49 57.95
01-Sep-17 53.95 56.97 57.80 57.25
16-Sep-17 55.88 58.91 59.85 59.32
01-Oct-17 57.11 60.14 61.15 60.63
04-Oct-17 54.78 57.80 58.67 58.13
16-Oct-17 54.96 57.99 58.80 58.34
01-Nov-17 55.23 58.24 59.07 58.62

PPAC Ready Reckoner
71
Country Petrol Diesel
RSP Ex-tax price Taxes % of taxes RSP Ex-tax price Taxes % of taxes
India 69.14 34.38 34.76 50% 57.73 33.28 24.45 42%
France 104.70 36.69 68.01 65% 93.19 35.69 57.49 62%
Germany 106.39 39.15 67.24 63% 89.35 38.99 50.35 56%
Italy 116.60 39.68 76.91 66% 105.08 38.76 66.32 63%
Spain 92.88 41.37 51.51 55% 83.28 40.68 42.60 51%
UK 101.55 34.85 66.70 66% 103.09 36.14 66.96 65%
Japan 76.69 38.20 38.49 50% 64.34 40.82 23.52 37%
Canada 62.09 41.48 20.61 33% 57.21 41.27 15.94 28%
USA 45.04 37.18 7.86 17% 47.43 38.41 9.02 19%
Country Petrol Diesel
RSP Ex-tax price Taxes % of taxes RSP Ex-tax price Taxes % of taxes
India 1.06 0.53 0.53 50% 0.89 0.51 0.38 42%
France 1.62 0.57 1.06 65% 1.45 0.55 0.89 62%
Germany 1.65 0.61 1.04 63% 1.39 0.61 0.78 56%
Italy 1.81 0.62 1.19 66% 1.63 0.60 1.03 63%
Spain 1.44 0.64 0.80 55% 1.29 0.63 0.66 51%
UK 1.58 0.54 1.04 66% 1.60 0.56 1.04 65%
Japan 1.19 0.59 0.60 50% 1.00 0.63 0.37 37%
Canada 0.96 0.64 0.32 33% 0.89 0.64 0.25 28%
USA 0.70 0.58 0.12 17% 0.74 0.60 0.14 19%
Retail Selling Price (RSP) & % of taxes in RSP of petrol and diesel in developed countries vis-a-vis India
Table 8.23 : Price and tax in Indian rupees (`) / litre
Table 8.24 : Price and tax in US dollars ($) / Litre
Note : 1. Prices of petrol and diesel in France, Germany, Italy, Spain, UK, Japan, Canada & USA as per the IEA report for September 2017 and average exchange rate of
September 2017 considered for conversion: ` 64.44/USD. (VAT excluded from prices for automotive diesel for France, Italy, Spain and UK as it is refunded to industry.)
2. Prices in India as of 1.11.2017 as per IOCL. Average exchange rate of October 2017 considered for conversion ` 65.08/$.
Indian rupees (`)/ litre/ cyl.Country Petrol Diesel Kerosene Domestic LPGIndia 69.14^ 57.73^ 21.89# 495.69*Pakistan 45.52 52.39 32.94 1099.34Bangladesh 67.83 51.27 51.27 627.21Sri Lanka 49.72 40.37 18.70 690.82Nepal 62.17 46.95 46.95 840.60
Table 8.22 : Retail Selling Price (RSP) of major products in India & neighbouring countries
*Effective cost after DBTL subsidy effective 1.11.2017.# at Mumbai effective 15.11.2017. ^ as per IOCL as on 1.11.2017Note: Prices for neighboring countries as on 1.11.2017. Source: Website of following companies: Pakistan- Pakistan State Oil (www.psopk.com); Bangladesh- Bangladesh Petroleum Corporation (www.bpc.gov.bd); Nepal- Nepal Oil Corporation (www.nepaloil.com.np); Sri Lanka- Petrol; Diesel & Kerosene- Ceylon Petroleum Corporation (www.ceypetco.gov.in); LPG- Litro Gas Lanka (www.litrogas.com); Exchange rate - www.oanda.com

PPAC Ready Reckoner
72
State/Union Territory CityPetrol Diesel Domestic LPG
(`/litre) (`/14.2 KG cylinder)States
Andhra Pradesh Vizag* 74.27 63.98 740.00
Arunachal Pradesh Itanagar 65.42 55.36 794.00
Assam Guwahati 71.04 60.17 779.50
Bihar Patna 73.49 61.38 815.50
Chhattisgarh Raipur 69.67 62.42 804.50
Goa Panjim 63.68 58.67 752.50
Gujarat Gandhinagar 68.37 61.79 763.50
Haryana Ambala 68.70 57.63 762.00
Himachal Pradesh Shimla 69.86 57.96 779.50
Jammu & Kashmir Srinagar 73.53 60.98 856.00
Jharkhand Ranchi 70.68 61.07 785.50
Karnataka Bengaluru 70.21 58.39 743.50
Kerala Thiruvananthapuram 72.91 62.76 736.50
Madhya Pradesh Bhopal 73.71 59.95 734.00
Maharashtra Mumbai 76.25 60.32 718.50
Manipur Imphal 67.35 55.99 862.00
Meghalaya Shillong 68.65 57.59 795.00
Mizoram Aizawl 65.32 55.34 862.00
Nagaland Kohima 67.69 56.26 750.50
Odisha Bhubaneswar 68.02 61.90 761.50
Punjab Jullunder 74.13 57.82 768.00
Rajasthan Jaipur 71.61 61.58 730.00
Sikkim Gangtok 72.10 59.55 886.00
Tamil Nadu Chennai 71.65 60.79 750.00
Telangana Hyderabad 73.20 62.72 789.00
Tripura Agartala 65.18 55.99 872.00
Uttarakhand Dehradun 72.02 59.64 755.00
Uttar Pradesh Lucknow 71.51 58.94 776.00
West Bengal Kolkata 71.90 60.39 759.50
Union territory
Andaman & Nicobar Islands Port Blair 59.76 54.36 798.00
Chandigarh Chandigarh 66.50 56.03 754.00
Daman & Diu Daman* 67.26 58.43 724.00
Dadra & Nagar Haveli Silvasa* 67.37 58.53 731.00
Delhi New Delhi 69.14 57.73 742.00
Puducherry Puducherry 68.09 59.68 745.00
Table 8.25 : Retail Selling Price (RSP) of petroleum products at State/UT capitals as on 01.11.2017
Highest Lowest
Source: IOCL (* as per HPCL)
Source: OMCsNote: The allocation of PDS kerosene in Delhi is nil presently.*Subject to confirmation by local authorities
Table 8.26 : Retail Selling Price (RSP) of PDS kerosene at major cities as on 15.11.2017
State City (`/litre)
Maharashtra Mumbai* 21.89
Tamil Nadu Chennai * 13.60
West Bengal Kolkata * 24.17

PPAC Ready Reckoner
73
* 8% for supply to schedule commuter airlines(SCA) from the regional connectivity scheme (RCS)airports.# Education cess of 2% and Secondary and Higher Education Cess of 1% is also applicable on Customs duty.
Particulars
Customs duty Central excise duty
Basiccustoms
duty
Additionalcustoms duty
(CVD)
Additionalcustoms duty
Basiccenvat duty
Specialadditionalexcise duty
Additionalexcise duty
Crude oil NIL + ` 50/MT as NCCD
Nil NA Nil+ Cess @ 20% +` 50/ MT as NCCD
NA NA
Petrol2.5% ` 6.48/ltr. +
` 7.00/ ltr SAD` 6.00/ltr. ` 6.48/ltr ` 7.00/ltr ` 6.00/ltr.
Petrol (branded) 2.5% ` 7.66/ltr. + ` 7.00/ ltr SAD
` 6.00/ltr. ` 7.66/ltr ` 7.00/ltr ` 6.00/ltr.
High speed diesel 2.5% ` 8.33/ltr+` 1.00/ ltr
` 6.00/ltr. ` 8.33/ltr ` 1.00/ltr ` 6.00/ltr.
High speed diesel (branded) 2.5% ` 10.69/ltr+` 1.00/ ltr
` 6.00/ltr. ` 10.69/Ltr ` 1.00/ltr ` 6.00/ltr.
Aviation Turbine Fuel (ATF) Nil 14%* Nil 14%* Nil Nil
Liquefied Natural Gas (LNG) 2.5% Nil Nil Nil Nil Nil
Natural gas [gaseous state] 5.0% Nil Nil Nil Nil Nil
Natural gas [compressed] 5.0% 14.0% Nil 14.0% Nil Nil
ParticularsCustoms duty
Basic IGST/ CVD
LPGDomestic Nil 5.00%
Non - Domestic 5.00% 18.00%
KerosenePDS Nil 5.00%
Non PDS 5.00% 18.00%
NaphthaNon- Fertilizer 5.00% 18.00%
Fertilizer Nil 18.00%
Butane / Propane Non - Domestic 2.50% 18.00%
Domestic Nil 5.00%
Bitumen & Asphalt 5.00% 18.00%
Furnace OilFertilizer Nil 18.00%
Non- Fertilizer 5.00% 18.00%
Light Diesel Oil 5.00% 18.00%
Low Sulphur Heavy Stock/ HPS & other Res.
Fertilizer 5.00% 18.00%
Non- Fertilizer 5.00% 18.00%
Lube oil/greases 5.00% 18.00%
Petroleum Coke 2.50% 18.00%
Petroleum Jelly 5.00% 18.00%
Transformer Oil 5.00% 18.00%
Waxes all types 5.00% 18.00%
Table 8.27 : Customs, excise duty and GST rates on petroleum products as on 01.11.2017
Custom Duty and GST Rates as on 1st November 2017 on GST Products
Customs Duty and Excise Duty as on 1st November 2017 on Non GST Products

PPAC Ready Reckoner
74
Sl. no. State/Union TerritoryPetrol Diesel PDS kerosene Domestic LPG
% of capital city rate before VAT
States
1 Andhra Pradesh 38.82 30.71 5.00 5.00
2 Arunachal Pradesh 20.00 12.50 5.00 5.00
3 Assam 32.66 23.66 5.00 5.00
4 Bihar 26.00 19.00 5.00 5.00
5 Chhattisgarh 28.88 27.11 5.00 5.00
6 Goa 17.00 19.00 5.00 5.00
7 Gujarat 24.80 24.80 5.00 5.00
8 Haryana 26.25 17.22 5.00 5.00
9 Himachal Pradesh 27.00 16.00 5.00 5.00
10 Jammu & Kashmir 29.53 18.00 5.00 5.00
11 Jharkhand 31.08 24.58 5.00 5.00
12 Karnataka 30.00 19.00 5.00 5.00
13 Kerala 34.06 26.88 5.00 5.00
14 Madhya Pradesh 35.82 22.00 5.00 5.00
15 MaharashtraMumbai, Thane & Navi Mumbai 43.71 26.17 5.00 5.00
(Rest of State) 42.61 23.15 5.00 5.00
16 Manipur 25.00 14.50 5.00 5.00
17 Meghalaya 22.44 13.77 5.00 5.00
18 Mizoram 20.00 12.00 5.00 5.00
19 Nagaland 24.68 14.18 5.00 5.00
20 Odisha 26.00 26.00 5.00 5.00
21 Punjab 36.04 17.29 5.00 5.00
22 Rajasthan 32.92 25.71 5.00 5.00
23 Sikkim 30.80 17.76 5.00 5.00
24 Tamil Nadu 34.00 25.00 5.00 5.00
25 Telangana 35.20 27.00 5.00 5.00
26 Tripura 20.00 13.50 5.00 5.00
27 Uttarakhand 32.91 19.60 5.00 5.00
28 Uttar Pradesh 32.46 19.85 5.00 5.00
29 West Bengal 26.85 18.44 5.00 5.00
Union territories
30 Andaman & Nicobar Islands 6.00 6.00 5.00 5.00
31 Chandigarh 22.16 11.65 5.00 5.00
32 Dadra & Nagar Haveli 20.00 15.00 5.00 5.00
33 Daman & Diu 20.00 15.00 5.00 5.00
34 Delhi 27.00 17.37 5.00 5.00
35 Lakshadweep NIL NIL 5.00 5.00
36 Puducherry 21.15 17.15 5.00 5.00
Table 8.28 : Effective rates of Sales tax/VAT/GST levied by various states/UTs as on 01.11.2017
(As per details provided by HPCL/IOCL) Note:1. For Petrol & Diesel, effective rate Includes VAT/Sales Tax, cess, entry tax, additional tax & surcharge recoverable in price.2. For Petrol & Diesel, VAT/ Sales Tax at applicable rates is also levied on Dealer’s commission in Arunachal Pradesh, Delhi, Gujarat, Haryana, Madhya Pradesh, Punjab, Chandigarh, Puducherry, Andaman & Nikobar,
and Meghalaya.. 3. For domestic LPG, GST at applicable rates is also levied on distributor’s commission by all states and UTs .
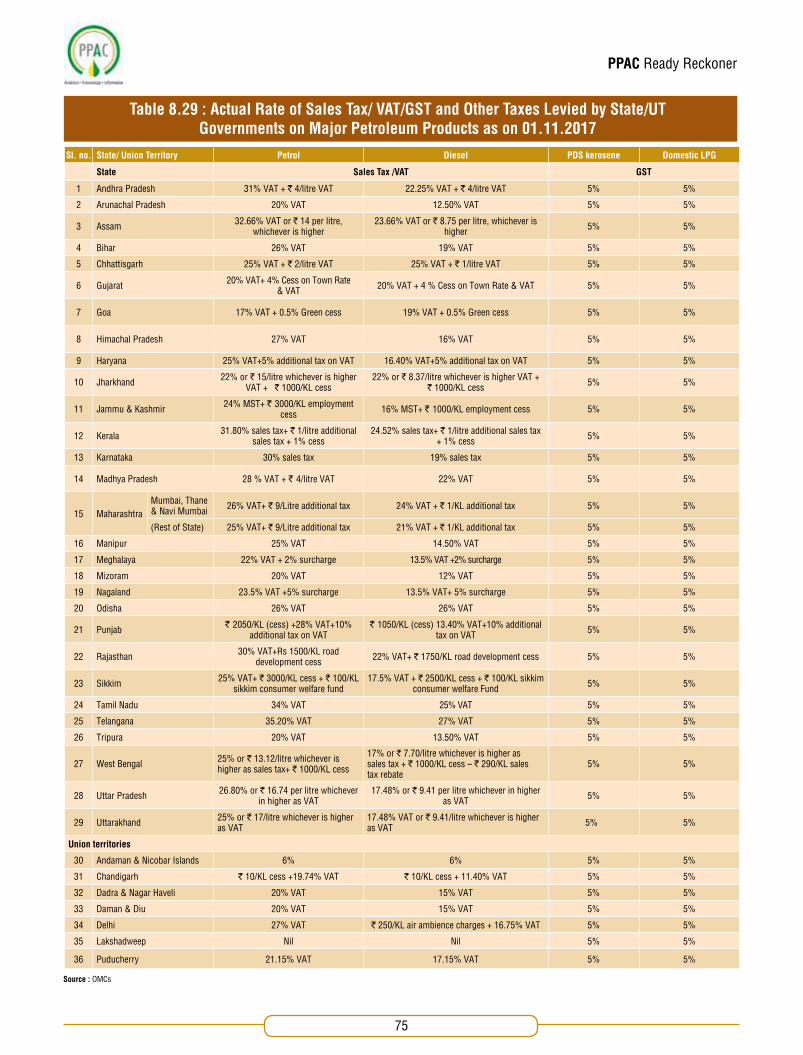
PPAC Ready Reckoner
75
Source : OMCs
Table 8.29 : Actual Rate of Sales Tax/ VAT/GST and Other Taxes Levied by State/UT Governments on Major Petroleum Products as on 01.11.2017
Sl. no. State/ Union Territory Petrol Diesel PDS kerosene Domestic LPG
State Sales Tax /VAT GST
1 Andhra Pradesh 31% VAT + ` 4/litre VAT 22.25% VAT + ` 4/litre VAT 5% 5%
2 Arunachal Pradesh 20% VAT 12.50% VAT 5% 5%
3 Assam 32.66% VAT or ` 14 per litre, whichever is higher
23.66% VAT or ` 8.75 per litre, whichever is higher 5% 5%
4 Bihar 26% VAT 19% VAT 5% 5%
5 Chhattisgarh 25% VAT + ` 2/litre VAT 25% VAT + ` 1/litre VAT 5% 5%
6 Gujarat 20% VAT+ 4% Cess on Town Rate & VAT 20% VAT + 4 % Cess on Town Rate & VAT 5% 5%
7 Goa 17% VAT + 0.5% Green cess 19% VAT + 0.5% Green cess 5% 5%
8 Himachal Pradesh 27% VAT 16% VAT 5% 5%
9 Haryana 25% VAT+5% additional tax on VAT 16.40% VAT+5% additional tax on VAT 5% 5%
10 Jharkhand 22% or ` 15/litre whichever is higher VAT + ` 1000/KL cess
22% or ` 8.37/litre whichever is higher VAT + ` 1000/KL cess 5% 5%
11 Jammu & Kashmir 24% MST+ ` 3000/KL employment cess 16% MST+ ` 1000/KL employment cess 5% 5%
12 Kerala 31.80% sales tax+ ` 1/litre additional sales tax + 1% cess
24.52% sales tax+ ` 1/litre additional sales tax + 1% cess 5% 5%
13 Karnataka 30% sales tax 19% sales tax 5% 5%
14 Madhya Pradesh 28 % VAT + ` 4/litre VAT 22% VAT 5% 5%
15 MaharashtraMumbai, Thane & Navi Mumbai 26% VAT+ ` 9/Litre additional tax 24% VAT + ` 1/KL additional tax 5% 5%
(Rest of State) 25% VAT+ ` 9/Litre additional tax 21% VAT + ` 1/KL additional tax 5% 5%
16 Manipur 25% VAT 14.50% VAT 5% 5%
17 Meghalaya 22% VAT + 2% surcharge 13.5% VAT +2% surcharge 5% 5%
18 Mizoram 20% VAT 12% VAT 5% 5%
19 Nagaland 23.5% VAT +5% surcharge 13.5% VAT+ 5% surcharge 5% 5%
20 Odisha 26% VAT 26% VAT 5% 5%
21 Punjab ` 2050/KL (cess) +28% VAT+10% additional tax on VAT
` 1050/KL (cess) 13.40% VAT+10% additional tax on VAT 5% 5%
22 Rajasthan 30% VAT+Rs 1500/KL road development cess 22% VAT+ ` 1750/KL road development cess 5% 5%
23 Sikkim 25% VAT+ ` 3000/KL cess + ` 100/KL sikkim consumer welfare fund
17.5% VAT + ` 2500/KL cess + ` 100/KL sikkim consumer welfare Fund 5% 5%
24 Tamil Nadu 34% VAT 25% VAT 5% 5%
25 Telangana 35.20% VAT 27% VAT 5% 5%
26 Tripura 20% VAT 13.50% VAT 5% 5%
27 West Bengal 25% or ` 13.12/litre whichever is higher as sales tax+ ` 1000/KL cess
17% or ` 7.70/litre whichever is higher as sales tax + ` 1000/KL cess – ` 290/KL sales tax rebate
5% 5%
28 Uttar Pradesh 26.80% or ` 16.74 per litre whichever in higher as VAT
17.48% or ` 9.41 per litre whichever in higher as VAT 5% 5%
29 Uttarakhand 25% or ` 17/litre whichever is higher as VAT
17.48% VAT or ` 9.41/litre whichever is higher as VAT 5% 5%
Union territories
30 Andaman & Nicobar Islands 6% 6% 5% 5%
31 Chandigarh ` 10/KL cess +19.74% VAT ` 10/KL cess + 11.40% VAT 5% 5%
32 Dadra & Nagar Haveli 20% VAT 15% VAT 5% 5%
33 Daman & Diu 20% VAT 15% VAT 5% 5%
34 Delhi 27% VAT ` 250/KL air ambience charges + 16.75% VAT 5% 5%
35 Lakshadweep Nil Nil 5% 5%
36 Puducherry 21.15% VAT 17.15% VAT 5% 5%

PPAC Ready Reckoner
76
PPAC Ready Reckoner
(` crore)
Particulars 2013-14 2014-15 2015-16 2016-17 H1, 2016-17 H1, 2017-18 (P)
1. Contribution to Central exchequer
A. Tax/ duties on crude oil & petroleum products
Cess on crude oil 16183 15934 15470 13285 5862 6221Royalty on crude oil / natural gas 4551 3858 4885 4649 2230 2194Customs duty 5042 4767 7446 9521 5670 6431Excise duty 77982 99184 178591 242691 106069 103846Service tax 2092 2181 2837 2956 1137 1228IGST 4378CGST 1601Others 241 295 307 399 195 57Sub total (A) 106090 126219 209536 273502 121164 125955
B. Dividend to Government/ income tax etc. Corporate/ income tax 23326 23727 24642 31593 14382 13043Dividend income to Central Government 9164 9197 10217 17501 2115 1617Dividend distribution tax 2951 3500 4590 6197 615 1336Profit petroleum on exploration of oil/ gas* 11369 9423 9457 5742 1907 2905Sub total (B) 46810 45847 48907 61032 19019 18902Total contribution to Central exchequer (A+B) 152900 172066 258443 334534 140183 144857
2. Contribution to State exchequerC. Tax/ duties on crude oil & petroleum products
Royalty on crude oil / natural gas 14493 14159 7932 11942 3899 4117Sales tax/ VAT 129045 137157 142848 166378 75828 87921SGST/UTGST 1783Octroi/ duties (incl. electricity duty) 4156 3838 2712 3524 1501 1186Entry tax / others 4748 5372 6622 7742 2723 6077Sub total (C) 152442 160526 160114 189586 83951 101084
D. Dividend to Government/ direct tax etc.
Dividend income to State Government 18 28 95 183 12 2Sub total (D) 18 28 95 183 12 2
Total contribution to State exchequer (C+D) 152460 160554 160209 189770 83962 101086Total contribution of petroleum sector to exchequer (1+2) 305360 332620 418652 524304 224145 245943
Table 8.30 : Contribution of petroleum sector to exchequer
* Profit petroleum on exploration of oil/ gas as provided by MOP&NG, (P) ProvisionalSource: Oil companies
^ Cash payout under the subsidy schemes is on payment basis
(` crore)Particulars 2013-14 2014-15 2015-16 2016-17 H1, 2016-17 H1, 2017-18Tax/ duties on petroleum products to Central exchequer (a) 106090 126219 209536 273502 121164 125955Payout by Government
Cash assistance by Government towards OMCs’ under recoveries 70772 27308 10245 7595 4123 2066Subsidy on PDS kerosene and domestic LPG^ 2580 0 0 3293 2272 0Freight subsidy on PDS kerosne and domestic LPG^ 21 23 0 0 0 0Gas subsidy for North East^ 625 661 660 745 470 169Total DBTL subsidy claims (including permanent advance and project management expenditure)
3912 3971 22011 12986 4557 7527
Total PMUY Claims(including PME & IEC) 0 0 0 2999 1054 1608Total DBTK Subsidy Claims 0 0 0 11 0 24
Total payout by Government (b) 77910 31963 32916 27629 12476 11394Net contribution to central exchequer (a-b) 28180 94256 176620 245873 108688 114561
Table 8.31 : Contribution of taxes and duties on petroleum products to Central exchequer vis-a-vis payout by Government

PPAC Ready Reckoner
77
(` Crore)
Sl. no.
State/Unionterritory/Others
Sales tax/VAT SGST/UTGST
2013-14 2014-15 2015-16 2016-17 H1, 2016-17 H1, 2017-18 (P) H1, 2017-18 (P)
States
1 Andhra Pradesh 12604 8777 7806 8908 4449 4915 46
2 Arunachal Pradesh 54 56 54 26 0 32 0
3 Assam 2160 2268 2163 2571 1182 1453 31
4 Bihar 2931 2885 3638 4501 1561 1748 28
5 Chhattisgarh 2397 2645 2617 3200 1366 1564 13
6 Goa 388 478 534 650 306 322 4
7 Gujarat 14610 15879 14701 15958 7614 7917 518
8 Haryana 4591 5112 5976 7000 3514 3808 25
9 Himachal Pradesh 204 234 263 317 160 182 7
10 Jammu & Kashmir 941 951 1004 1110 519 366 8
11 Jharkhand 1825 2076 2476 2967 976 1045 10
12 Karnataka 7800 8668 8652 11103 5264 5972 90
13 Kerala 5173 5378 6121 6899 2848 3110 44
14 Madhya Pradesh 6232 6832 7631 9160 3821 4420 39
15 Maharashtra 19141 19795 19417 23160 11052 13032 293
16 Manipur 102 116 114 117 56 79 1
17 Meghalaya 3 2 1 1 1 1 0
18 Mizoram 44 58 53 48 29 22 0
19 Nagaland 64 83 80 78 30 42 0
20 Odisha 2520 2865 3027 4283 1116 4098 18
21 Punjab 3853 4179 4907 5833 2851 2726 49
22 Rajasthan 7396 8373 9211 10591 5053 5783 28
23 Sikkim 66 74 98 105 58 41 0
24 Tamil Nadu 12297 12316 11004 12563 6072 7825 222
25 Telangana 0 4527 6391 7552 3698 4315 41
26 Tripura 160 180 197 168 69 90 1
27 Uttar Pradesh 11607 12579 14175 15850 7088 7911 117
28 Uttarakhand 1049 1157 1221 1414 662 647 8
29 West Bengal 5510 5563 5869 6427 2514 2511 89
Union territories
30 Andaman & Nicobar Islands 0 0 41 0 0 6 0
31 Chandigarh 74 84 75 54 25 29 0
32/33
Dadra and Nagar Haveli/ Daman & Diu 115 149 152 156 81 42 25
34 Delhi 3108 2798 3158 3589 1782 1859 15
35 Lakshadweep 0 0 0 0 0 0 0
36 Puducherry 29 22 18 22 10 12 5
Others
1 Offshore 5
TOTAL 129045 137157 142848 166378 75828 87921 1783
Table 8.32 : State wise collection of Sales tax/ VAT/GST by petroleum sector
Source: Oil companies

PPAC Ready Reckoner
78
(` Crore)
Companies 2013-14 2014-15 2015-16 2016-17 H1, 2016-17 H1, 2017-18
PSU upstream/midstream companies
ONGC 22095 17733 16004 17900 9207 9015
OIL 2981 2510 2330 1549 1075 1096
GAIL 4375 3039 2299 3503 2260 2335
Total 29451 23282 20633 22951 12542 12447
PSU downstream Oil Marketing Companies (OMCs)
IOCL 7019 5273 10399 19106 11391 8245
BPCL 4061 5085 7432 8039 3926 3102
HPCL 1734 2733 3863 6209 2800 2659
Total 12814 13091 21694 33355 18116 14006
PSU stand alone refineries
MRPL 601 (1712) 1148 3642 1134 712
CPCL (304) (39) 771 1030 568 349
NRL 371 718 1222 2101 868 838
Total 668 (1033) 3141 6773 2569 1899
PSU consultancy company
EIL 480 308 258 325 174 201
Total 480 308 258 325 174 201
Private sector companies
RIL 22493 23566 27630 31425 15252 16461
EOL 126 1522 2162 (1121) * *
Total 22619 25088 29792 30304 15252 16461
Table 8.33 : Profit After Tax (PAT) of oil companies
Source: Published results/ information provided by oil companies.* Not available

PPAC Ready Reckoner
79
2016-17
Particulars IOCL BPCL HPCL ONGC OIL GAIL MRPL CPCL NRL
(` Crore)
Net sales / income from operations 438692 241859 213489 77489 9188 48789 59415 40586 13947
Profit Before Interest and Tax (PBIT) 29767 11539 9556 26437 2543 5890 6049 1638 3170
Interest 3445 496 536 1222 397 479 519 273 22
Tax 7215 3003 2812 7316 598 1908 1888 335 1047
Profit After Tax (PAT) 19106 8039 6209 17900 1549 3503 3642 1030 2101
Net worth 99729 29668 20347 185538 22647 32349 10070 3314 5181
Borrowings (loan fund) 54820 23159 21250 0 8948 5062 6609 5498 505
Ratios
PAT as % of turnover (net sales) 4.36% 3.32% 2.91% 23.10% 16.86% 7.18% 6.13% 2.54% 15.06%
Debt (loan fund) to equity ratio 0.55 0.78 1.04 0.00 0.40 0.16 0.66 1.66 0.10
Earnings Per Share (EPS) 40.31 61.31 61.12 13.95 19.32 20.71 20.79 69.15 28.55
Table 8.34 : Financial details of oil companies
H1, 2016-17
Particulars IOCL BPCL HPCL ONGC OIL GAIL MRPL CPCL NRL
(` Crore)
Net sales / income from operations 204062 111834 99350 35957 4376 22851 25575 20488 6102
Profit Before Interest and Tax (PBIT) 17840 5804 4483 14021 1848 3359 1990 909 1335
Interest 1295 214 256 595 198 297 258 133 12
Tax 5155 1665 1428 4219 575 801 598 208 456
Profit After Tax (PAT) 11391 3926 2800 9207 1075 2260 1134 568 868
Net worth 99981 30748 20978 177987 27748 37460 7591 2873 4830
Borrowings (loan fund) 41885 16056 18070 0 9198 6159 7320 4807 664
Ratios
PAT as % of turnover (net sales) 5.58% 3.51% 2.82% 25.61% 24.57% 9.89% 4.43% 2.77% 14.22%
Debt (loan fund) to equity ratio 0.42 0.52 0.86 0.00 0.33 0.16 0.96 1.67 0.14
Earnings Per Share (EPS) 24.03 27.15 27.56 7.18 13.41 17.82 6.48 38.13 11.79

PPAC Ready Reckoner
80
H1, 2017-18
Particulars IOCL BPCL HPCL ONGC OIL GAIL MRPL CPCL NRL
(` Crore)
Net sales / income from operations 233506 130673 114044 37777 4744 23758 19353 20136 5884
Profit Before Interest and Tax (PBIT) 13770 4980 4276 13776 1757 3690 1234 704 1297
Interest 1491 414 299 604 206 194 213 141 8
Tax 4034 1464 1317 4157 455 1161 310 214 451
Profit After Tax (PAT) 8245 3102 2659 9015 1096 2335 712 349 838
Net worth 106461 32576 22905 194710 22305 34310 9515 3286 5255
Borrowings (loan fund) 38805 18191 14188 2081 9024 4282 5098 4768 460
Ratios
PAT as % of turnover (net sales) 3.53% 2.37% 2.33% 23.86% 23.10% 9.83% 3.68% 1.73% 14.24%
Debt (loan fund) to equity ratio 0.36 0.56 0.62 0.01 0.40 0.12 0.54 1.45 0.09
Earnings Per Share (EPS) 17.40 15.77 17.45 7.03 14.14 28.00 4.06 23.14 11.39
Source : Published results/ Information provided by oil companies
Table 8.35 : Total subsidy on petroleum products & natural gas
Particulars 2013-14 2014-15 2015-16 2016-17 H1,2016-17
H1,2017-18
Petrol 0 0 0 0 0 0
Diesel 62837 10935 0 0 0 0PDS kerosene 30574 24799 11496 7595 4123 2066
Domestic LPG 46458 36580 18 0 0 0Total under-recoveries (A) 139869 72314 11515 7595 4123 2066Total DBTL subsidy (claims) 3869 3971 16056 12133 3704 7502Permanent Advance (PA) / one time incentive* 0 0 5755 853 853 0Project Management Expenditure (PME)* 43 0 200 0 0 25Total DBTL related subsidies (B) 3912 3971 22011 12986 4557 7527PMUY (claims) 0 0 0 2999 1054 1553PME & IEC under PMUY* 0 0 0 0 0 55Total PMUY related subsidy (C) 0 0 0 2999 1054 1608DBTK subsidy (claims) (D) 0 0 0 11 0 24PDS Kerosene and Domestic LPG subsidy scheme, 2002* 2580 0 0 3293 2272^ 0
Freight subsidy (For Far-Flung Areas) Scheme, 2002* 21 23 0 0 0 0Natural gas subsidy for North East* 625 661 660 745 470 169Other subsidies (E) 3226 684 660 4038 2742 169Total subsidy/ under-recovery on petroleum products & natural gas (A+B+C+D+E)
147007 76969 34186 27629 12476 11394
*on payment basis. ^ The payment relates to the year 2014-15, however received in the year 2016-17.
(` Crore)
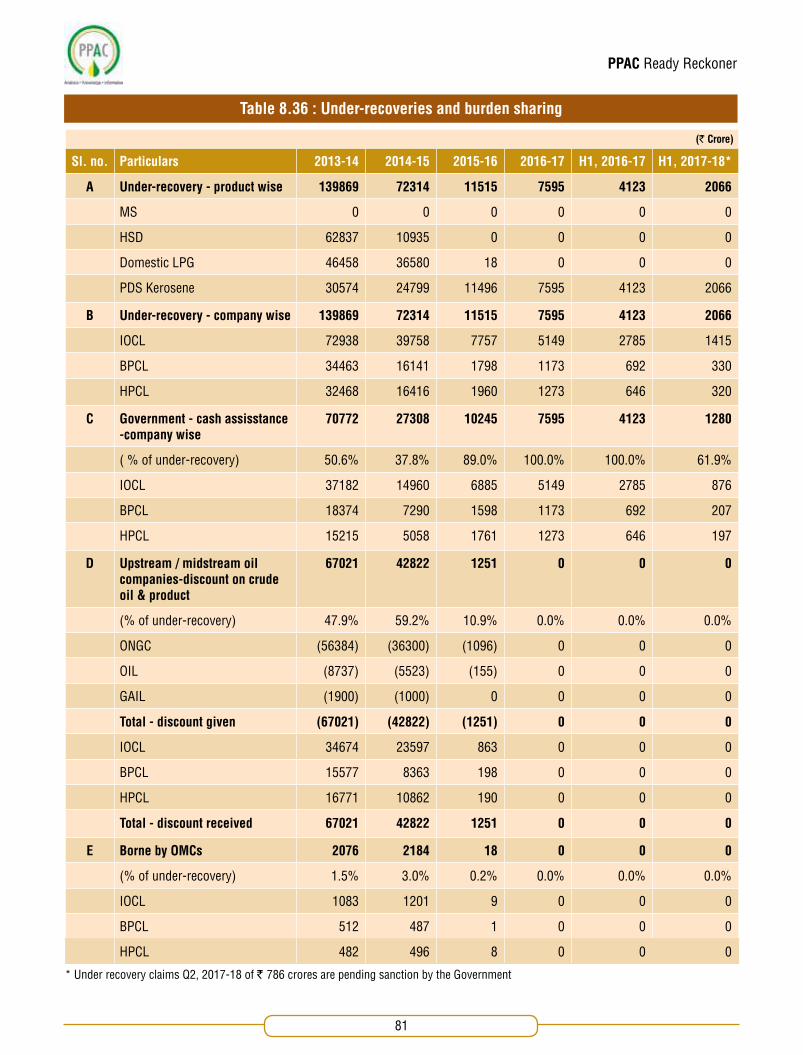
PPAC Ready Reckoner
81
Table 8.36 : Under-recoveries and burden sharing
(` Crore)
Sl. no. Particulars 2013-14 2014-15 2015-16 2016-17 H1, 2016-17 H1, 2017-18*
A Under-recovery - product wise 139869 72314 11515 7595 4123 2066
MS 0 0 0 0 0 0
HSD 62837 10935 0 0 0 0
Domestic LPG 46458 36580 18 0 0 0
PDS Kerosene 30574 24799 11496 7595 4123 2066
B Under-recovery - company wise 139869 72314 11515 7595 4123 2066
IOCL 72938 39758 7757 5149 2785 1415
BPCL 34463 16141 1798 1173 692 330
HPCL 32468 16416 1960 1273 646 320
C Government - cash assisstance -company wise
70772 27308 10245 7595 4123 1280
( % of under-recovery) 50.6% 37.8% 89.0% 100.0% 100.0% 61.9%
IOCL 37182 14960 6885 5149 2785 876
BPCL 18374 7290 1598 1173 692 207
HPCL 15215 5058 1761 1273 646 197
D Upstream / midstream oil companies-discount on crude oil & product
67021 42822 1251 0 0 0
(% of under-recovery) 47.9% 59.2% 10.9% 0.0% 0.0% 0.0%
ONGC (56384) (36300) (1096) 0 0 0
OIL (8737) (5523) (155) 0 0 0
GAIL (1900) (1000) 0 0 0 0
Total - discount given (67021) (42822) (1251) 0 0 0
IOCL 34674 23597 863 0 0 0
BPCL 15577 8363 198 0 0 0
HPCL 16771 10862 190 0 0 0
Total - discount received 67021 42822 1251 0 0 0
E Borne by OMCs 2076 2184 18 0 0 0
(% of under-recovery) 1.5% 3.0% 0.2% 0.0% 0.0% 0.0%
IOCL 1083 1201 9 0 0 0
BPCL 512 487 1 0 0 0
HPCL 482 496 8 0 0 0
* Under recovery claims Q2, 2017-18 of ` 786 crores are pending sanction by the Government

PPAC Ready Reckoner
82

PPAC Ready Reckoner
83
Table 9.1 : Average international Calorific Values of different fuels
Table 9.3 : Volume conversion
Table 9.4 : Contents of LPG & Natural Gas
Conversion factors
Table 9.2 : Weight to volume conversion
A. Oil products M Cals/tonne or K Cal/Kg
NGL 12135
Kerosene 10638
Motor Gasoline 11135
Fuel Oil 10440
B. Natural gas production (average) - India 8000-9480 K cal/SCM
C. India M Cals/tonne or K Cal/Kg
Charcoal 6900
Hard coal 5000
Firewood 4750
Lignite-Brown coal 2310
1 US Bbl. 159 Litres
1 US Gallon 3.78 Litres
1 Kilo Litre (KL) 6.29 Bbl.
1 US Bbl. 42 Gallons
1 MBD (million barrels per day) 50 MMTPA
Natural Gas Contains 60-95 % Methane
LPG Contains Propane (40%) & Butane (60%)
Product Weight(MT)
Volume(KL)
BBL To convert volume at 29.5° C to volume at 15°C multiply by
Petrol 1 1.4110 8.88 0.9830
Diesel 1 1.2100 7.61 0.9879
Kerosene 1 1.2850 8.08 0.9864
ATF 1 1.2880 8.10 0.9862
Light Diesel Oil 1 1.1720 7.37 0.9877
Furnace Oil 1 1.0710 6.74 0.9899
Crude Oil 1 1.1700 7.33
Source : Indian Petroleum & Natural Gas Statistics, MOP&NG Conversion factor : 1 K Cal = 4.19 K Joules
Source: Indian Petroleum & Natural Gas Statistics / Petrol and Diesel are as per BS-IV norms

PPAC Ready Reckoner
84
Source : GAIL (India) Ltd.
Table 9.5 : Natural gas conversions
Table 9.6 : Major end use of petroleum products
1 SCM (Standard Cubic Meter) = 1 cubic metre @ 1 atmosphere pressure and 15.56 oC
1 Cubic Metre = 35.31 Cubic feet
1 BCM(Billion Cubic Metre) / Year of gas (consumption or production)
= 2.74 MMSCMD 365 Days a Year
1 TCF (Trillion Cubic Feet) of Gas Reserve
= 3.88 MMSCMD 100% Recoverable for 20 years @ 365 days / Annum)
1 MMTPA of LNG = 3.60 MMSCMD Molecular Weight of 18 @ 365 days/Annum)
1 MT of LNG = 1314 SCM Molecular Weight of 18
Gross Calorific Value (GCV) = 10000 Kcal/ SCM
Net Calorific Value (NCV) = 90% of GCV
1 Million BTU (MMBTU) = 25.2 SCM @10000 Kcal/SCM; 1 MMBTU= 252,000 Kcal)
Specific Gravity of Gas = 0.62 Molecular Weight of Dry Air=28.964 gm/mole)
Density of Gas = 0.76 Kg/SCM Molecular Weight of Gas 18 gm/mol
Gas required for 1 MW of Power generation
= 4541 SCM per Day Station Heat Rate (SHR);~1720 Kcal/Kwh-NCV (50% Thermal Efficiency); Natural Gas GCV-@10000Kcal/SCM
Power Generation from 1 MMSCMD Gas
= 220 MWH Station Heat Rate (SHR);~1720 Kcal/Kwh-NCV (50% Thermal Efficiency); Natural Gas GCV-@10000Kcal/SCM
Product Major end use
LPG Domestic and auto fuel. Also for industrial application where technically essential.
Naphtha Feedstock/fuel for fertiliser units, feedstock for petrochemical sector and fuel for power plants.
MS Fuel for passenger cars, taxies, two & three wheelers.
ATF Fuel for aircrafts.
SKO Fuel for cooking & lighting.
HSD Fuel for transport sector (railways/road), agriculture (tractors, pumpsets, threshers, etc.) and captive power generation.
LDO Fuel for agricultural pumpsets, small industrial units, start up fuel for power generation.
FO/LSHS Secondary fuel for thermal power plants, fuel/feedstock for fertiliser plants, industrial units.
Bitumen Surfacing of roads.
Lubes Lubrication for automotive and industrial applications.
Other products (Benzene, Toluene, MTO, LABFS, CBFS, Paraffin wax etc.)
Feedstock for value added products.

PPAC Ready Reckoner
85
PPAC Ready Reckoner
Information about key officers of MoP&NG
Information about key officers of PPAC
Department Name (S/Shri) Designation Telephone No. Fax No.
Secretary Kapil Dev Tripathi Secretary 23383501 23070723
23383562
Manish Makhija PS to Secretary 23383501/23383562
Additional Secretary Additional Secretary 23381052 23386090
Narender S Negi PPS to Additional Secretary 23381052
Finance Rajiv Bansal Additional Secretary & FA 23381704 23074226
Ms Suman Mahi PPS to AS & FA 23381704
Sukh Ram Meena DDG (IFD) 23389459 23383585
Ms Perin Devi Dir (IFD) 23386965 23386965
Economic & Statistics Ms Urvashi Sadhwani Sr. Adviser 23385823 23383752
K S N Rao PPS to Sr. Adviser 23385823
Ms Indrani Kaushal Economic Advisor 23383753 23383752
B. Vijaya PS to EA 23383753
Exploration Amar Nath Jt. Secretary (E) 23381832 23070562
V.K. Suman PPS to JS (E) 23381832
Sanjay Kumar Jain Dir (Exploration - II) 23386526 23303100
Exploration-I & III Diwakar Nath Misra Jt. Secretary (Exploration-I & III) 23388764 23388764
Yogesh Virmani PS to JS (Exploration-I & III) 23388764
Refinery Sandeep Poundrik Joint Secretary (Refineries) & CVO 23386935 23382673
Anil Kumar PS to JS (R ) 23386935
Vijay Sharma Director (S & CC/Vig/FP) 23073069 23383100
Ajit Kumar DS (R) 23387936 23383100
Marketing and Administration Ashutosh Jindal Joint Secretary (M) 23382418 23384401
Sampooran Singh PPS to JS(M) 23382418
K M Mahesh Dir (LPG, D & MC & Parliament) 23387404 23383100
Administration Ms Anuradha S. Chagti Jt. Secretary (Admin) 23383678 23383100
K. Madhavi PS to JS (Exploration-I & III) 23383678
Gas Projects Ashish Chatterjee Joint Secretary (GP) 23073165 23398804
Ms Shikha Khurana PS to JS (GP) 23073165
Ms Kiran Vasudeva DS (GP) 23387467 23383100
International Cooperation Sunjay Sudhir Joint Secretary (IC) 23382583 23073475
Ms Savita Sen PPS to JS (IC) 23382583
Praphullachandra Sharma DS (I/C) 23383508 23383100
General Ms Sushma Rath Joint Secretary (General) 23386407 23383100
Madhu Kumar PA to JS (G) 23386407
Vijay Gopal Mangal DS (Gen) 23381029 23383100
Department Name (S/Shri) Designation Telephone No. Fax No.
Director General's office Ms. Atreyee Das Director General 24361616 / 24361081 24361253P R Nair PS to Director General 24361616 / 24361081
Finance Vikram Gulati Director (Finance) 24360356 24364227Ms. Satbir Hira PS to Director (F) 24360356
Demand & Economic Studies Rohit Dawar Addl. Director I/C (D & ES) 24306181 24361253Supply Ms. B M Sujatha Addl. Director I/C (S) 24360352 / 24306141 24361253Administration Sunil Kumar Addl. Director (HR & C) 24361717 / 24306111 24364225IT Ms. Maninder Kaur Narula Addl. Director (IT) 24306151 24361253Marketing Rajesh Kumar Gupta Addl. Director (Mktg.) 24360489 / 24306171 24361253Gas Jitender Kumar Sharma Jt. Director I/C (Gas) 24306143 24361253EPABX NOs. 24306191 / 24306192, Reception - 24361314