
PowerPoint Presentation · Words such as “expect,” “estimate,” “project,” “budget ......
39
Energy Corporation Investor Presentation June 2018
Transcript of PowerPoint Presentation · Words such as “expect,” “estimate,” “project,” “budget ......

Energy Corporation
Investor PresentationJune
2018
Cautionary statementsStatements in this presentation, other than statements of historical fact, are “forward-looking statements” within the meaning of Section 27A of the Securities Act of 1933 and Section 21E of the Securities Exchange Act of 1934. Words such as “expect,” “estimate,” “project,” “budget,” “forecast,” “target”, “anticipate,” “intend,” “plan,” “may, ” “will,” “could,” “should,” “poised”, “believes,” “predicts,” “potential,” “continue,” and similar expressions are intended to identify such forward-looking statements; however the absence of these words does not mean the statements are not forward-looking. Such forward looking statements include statements regarding 2018 production, lease operating expense, corporate G&A and capital expenditure guidance; expected production growth from 2017 to 2018; future oil and liquids percentage and NGL yields; future leverage ratios; future drilling plans and activity, including production that may result from our 2018 program; future financial, operating results and shareholder returns; future liquidity and availability of capital; 2018 capital expenditure detail, including estimated earnout payments; future infrastructure plans and options; future production, reserve growth and decline rates; the impact of well interference and the effectiveness of drilling and completion adjustments in response thereto; the anticipated benefits of our 2018 development strategy; expected timing and location of drilling and completion of pad wells and the timing of the production contribution thereof; our plans and expectations regarding our future development activities including drilling and completing wells and the spacing of such wells; the number of such potential projects, locations and productive intervals; our projection of free cash flow in 4Q18 and 2019; the prospectivity of our properties and acreage; estimated ultimate recoveries of oil and gas (EURs); performance of wells against type curves; and anticipated rates of return (IRRs), net asset values and PV-10 values of our projects and properties. Resolute will evaluate its capital expenditures in relation to its liquidity and cash flow and may adjust its activity and capital spending levels based on acquisitions, changes in commodity prices, the cost of goods and services, production results and other considerations. Forward-looking statements in this presentation include matters that involve known and unknown risks, uncertainties and other factors that may cause actual results, levels of activity, performance or achievements to differ materially from results expressed or implied by this presentation. Such risk factors include, among others: uncertainties regarding future actions that may be taken by Monarch Alternative Capital LP in furtherance of its intent to nominate director candidates for election at the Company’s 2018 annual meeting of stockholders; potential operational disruption caused by the actions of stockholder activists ; the Company’s ability to successfully implement its strategy to create long-term stockholder value; depressed commodity prices; the volatility of oil and gas prices including the price realized by Resolute; inaccuracy in reserve estimates and expected production rates; potential write downs of the carrying value and volumes of reserves as a result of low commodity prices; the discovery, estimation, development and replacement by Resolute of oil and gas reserves; our ability to fund and develop our estimated proved undeveloped reserves; the future cash flow, liquidity and financial position of Resolute; Resolute’s level of indebtedness and our ability to fulfill our obligations under the senior notes, our credit facility and any additional indebtedness that we may incur; potential borrowing base reductions under our revolving credit facility; constraints imposed on our business and operations by our revolving credit facility and senior notes which may limit our ability to execute our business strategy; the risk of a transaction that could trigger a change of control under our debt agreements; the success of the business and financial strategy, hedging strategies and development and production plans of Resolute; the amount, nature and timing of capital expenditures of Resolute, including future development costs; the availability of additional capital and financing, including the capital needed to pursue our drilling and development plans for our properties, on terms acceptable to us or at all; uncertainty surrounding timing of identifying drilling locations and necessary capital to drill such locations; the potential for downspacing, infill or multi-lateral drilling in the Permian Basin or obstacles thereto; the timing of issuance of permits and rights of way; the timing and amount of future production of oil and gas; availability of drilling, completion and production personnel, supplies and equipment; the completion and success of exploratory drilling on our properties; potential delays in the completion, commissioning and optimization schedule of Resolute’s facilities construction projects or any potential breakdown of such facilities; operating costs and other expenses of Resolute; the success of prospect development and property acquisition of Resolute; risks associated with unanticipated liabilities assumed, or title, environmental or other problems resulting from, our acquisitions; the ability to sell or otherwise monetize assets at values and on terms that are advantageous to us; Resolute’s dependence on third parties for installation of gas gathering and processing infrastructure, oil gathering facilities and water disposal facilities and potential delays and breakdowns relating thereto; risks relating to our joint interest partners’ and other counterparties’ inability to fulfill their contractual commitments; the concentration of our credit risk as the result of depending on one primary oil purchaser and one primary gas purchaser in the Delaware Basin; the concentration of our producing properties in a single geographic area; loss of senior management or key technical personnel; the impact of long-term incentive programs, including performance-based awards and stock appreciation rights; the success of Resolute in marketing oil and gas; competition in the oil and gas industry; the impact of weather and the occurrence of disasters, such as fires, floods and other events and natural disasters ; environmental liabilities; potential power supply limitations or delays; operational problems or uninsured or underinsured losses affecting Resolute’s operations or financial results; adverse changes in government regulation and taxation of the oil and gas industry, including the potential for increased regulation of underground injection, fracing operations and venting/flaring; potential regulation of waste water injection intended to address seismic activity; potential climate related change regulations; risks and uncertainties associated with horizontal drilling and completion techniques; the availability of water and our ability to ade quately treat and dispose of water during and after drilling and completing wells; our relationship with the local communities in which we operate; changes in derivatives regulation; risks associated with rising interest rates; the impact of any U.S. or global economic recession; losses possible from pending or future regulation; developments in oil-producing and gas-producing countries; risks of terrorist activities directed at oil and gas production; cyber security risks; and risks related to our common stock, potential declines in stock prices and potential future dilution to stockholders. Actual results may differ materially from those contained in the forward-looking statements in this presentation. Resolute undertakes no obligation and does not intend to update these forward-looking statements to reflect events or circumstances occurring after the date of this presentation. You are cautioned not to place undue reliance on these forward-looking statements, which speak only as of the date of this presentation. You are encouraged to review Item 1A. -Risk Factors and all other disclosures appearing in the Company’s Form 10-K and Form 10-K/A for the year ended December 31, 2017, subsequent quarterly reports on Form 10-Qand subsequent filings with the Securities and Exchange Commission (the "SEC") for further information on risks and uncertainties that could affect the Company’s businesses, financial condition and results of operations. All forward-looking statements are qualified in their entirety by this cautionary statement. Furthermore, the SEC prohibits oil and gas companies, in their filings with the SEC, from disclosing estimates of oil or gas resources other than “reserves,” as that te rm is defined by the SEC. In this presentation, Resolute includes estimates of quantities of oil and gas using certain terms, such as “resource,” “resource potential,” “EUR,” “oil in place,” or other descriptions of volumes of reserves, which terms include quantities of oil and gas that may not meet the SEC definitions of proved, probable and possible reserves, and which the SEC guidelines strictly prohibit Resolute from including in filings with the SEC. These estimates are by their nature more speculative than estimates of proved reserves and accordingly are subject to substantially greater risk of being recovered by Resolute. Finally, reserve estimates mentioned in this presentation were prepared internally using price and cost assumptions and methodologies that are different from what would be required if prepared in accordance with guidelines established by the SEC for the estimation of proved reserves, and such reserve estimates do not include probable and possible reserves. Such reserve estimates have not been audited by our independent reserves auditor. Production rates, including “early time” rates, 24‐hour peak IP rates, 30, 60, 90, 120 and 150 day peak IP rates, for both our wells and for those wells that are located near to our properties are limited data points in each well ’s productive history and represent three stream gross production. These rates are sometimes actual rates and sometimes extrapolated or normalized rates. As such, the rates for a particular well may change as additiona l data becomes available. Peak production rates are not necessarily indicative or predictive of future production rates, EUR or economic rates of return from such wells and should not be relied upon for such purpose. E qually, the way we calculate and report peak IP rates and the methodologies employed by others may not be consistent, and thus the values reported may not be directly and meaningfully comparable. Lateral lengths described are indicative only. Actual completed lateral lengths depend on various considerations such as leaseline offsets. Standard length laterals, sometimes referred to as 5,000 foot laterals, are laterals with completed length generally between 4,000 feet and 5,500 feet. Mid‐length laterals, sometimes referred to as 7,500 foot laterals, are laterals with completed length generally between 6,000 feet and 8,000 feet. Long laterals, sometimes referred to as 10,000 foot laterals, are laterals with completed length generally longer than 8,000 feet. Non-GAAP financial measures: Resolute’s presentations may include certain non-GAAP financial measures. When applicable, a reconciliation of these measures to the most directly comparable GAAP measure is presented.
Page
2
Company overview
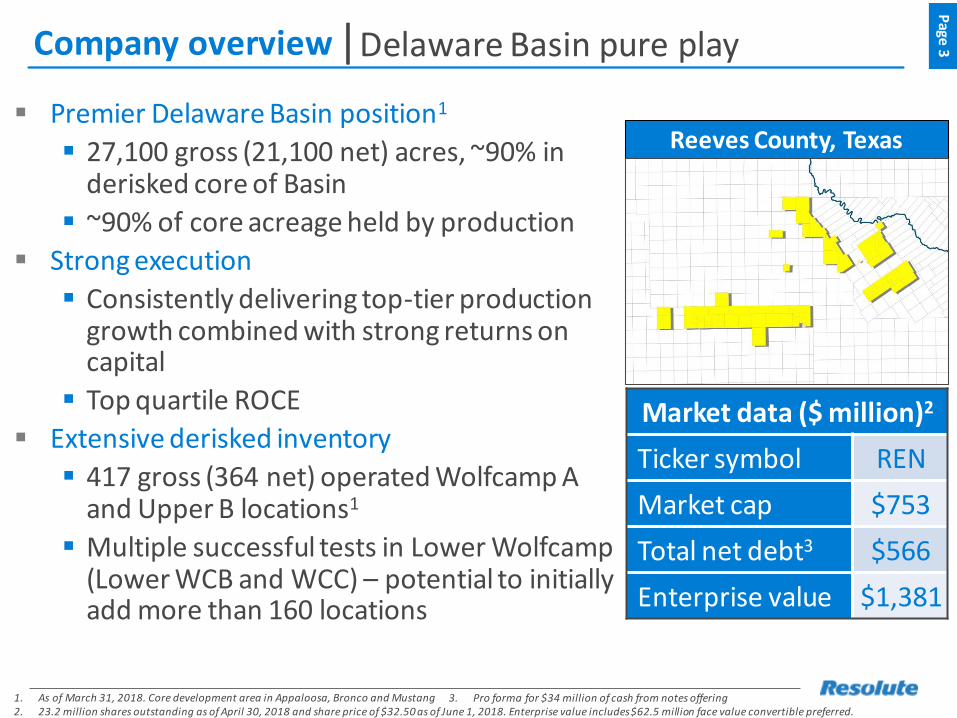
▪ Premier Delaware Basin position1
▪ 27,100 gross (21,100 net) acres, ~90% in derisked core of Basin
▪ ~90% of core acreage held by production
▪ Strong execution
▪ Consistently delivering top-tier production growth combined with strong returns on capital
▪ Top quartile ROCE
▪ Extensive derisked inventory
▪ 417 gross (364 net) operated Wolfcamp A and Upper B locations1
▪ Multiple successful tests in Lower Wolfcamp(Lower WCB and WCC) – potential to initially add more than 160 locations
Page
3|Delaware Basin pure play
1. As of March 31, 2018. Core development area in Appaloosa, Bronco and Mustang2. 23.2 million shares outstanding as of April 30, 2018 and share price of $32.50 as of June 1, 2018. Enterprise value includes $62.5 million face value convertible preferred.
Market data ($ million)2
Ticker symbol REN
Market cap $753
Total net debt3 $566
Enterprise value $1,381
Reeves County, Texas
3. Pro forma for $34 million of cash from notes offering
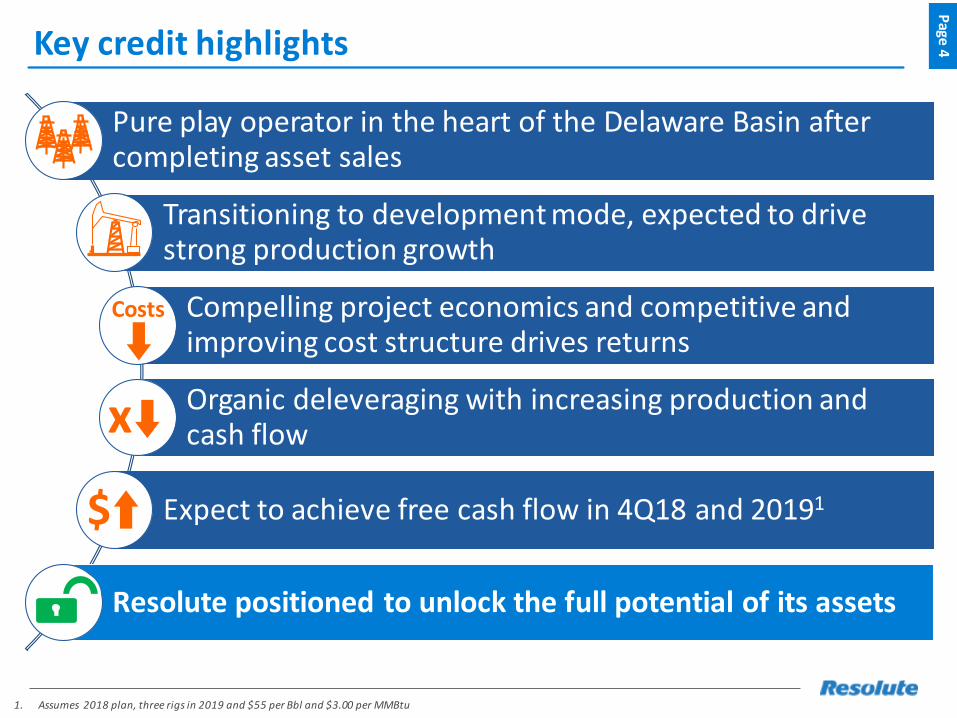
Key credit highlights
Pure play operator in the heart of the Delaware Basin after completing asset sales
Transitioning to development mode, expected to drive strong production growth
Compelling project economics and competitive and improving cost structure drives returns
Organic deleveraging with increasing production and cash flow
Expect to achieve free cash flow in 4Q18 and 20191
Resolute positioned to unlock the full potential of its assets
Page
4
1. Assumes 2018 plan, three rigs in 2019 and $55 per Bbl and $3.00 per MMBtu
Costs
$
x
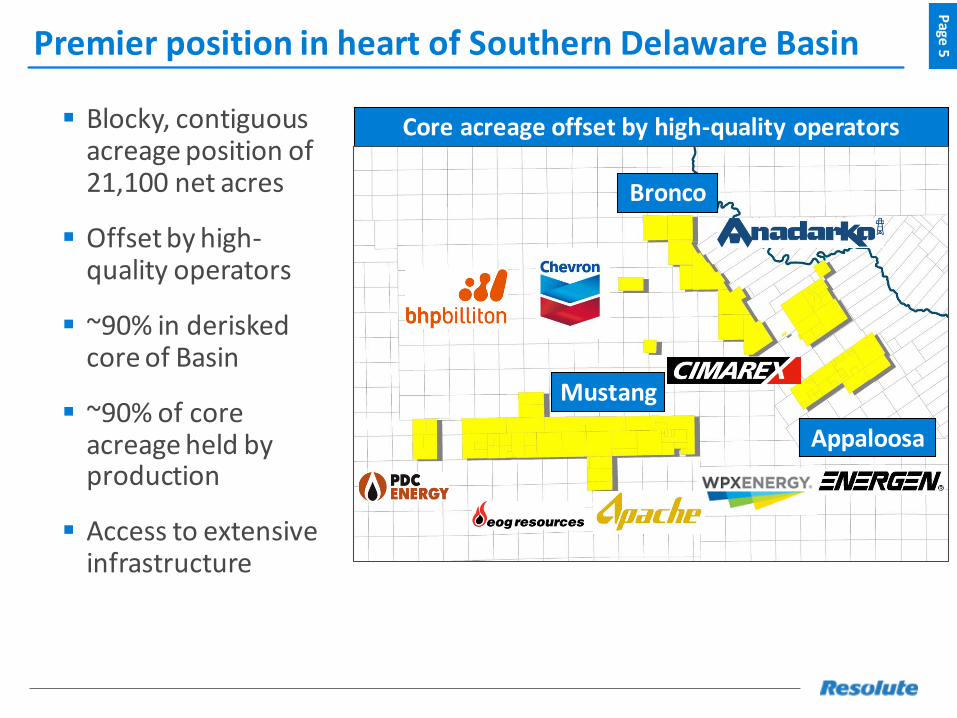
Premier position in heart of Southern Delaware Basin
▪ Blocky, contiguous acreage position of 21,100 net acres
▪ Offset by high-quality operators
▪ ~90% in deriskedcore of Basin
▪ ~90% of core acreage held by production
▪ Access to extensive infrastructure
Page
5
Core acreage offset by high-quality operators
Mustang
Appaloosa
Bronco
2018 development driving strong financial performanceP
age 6
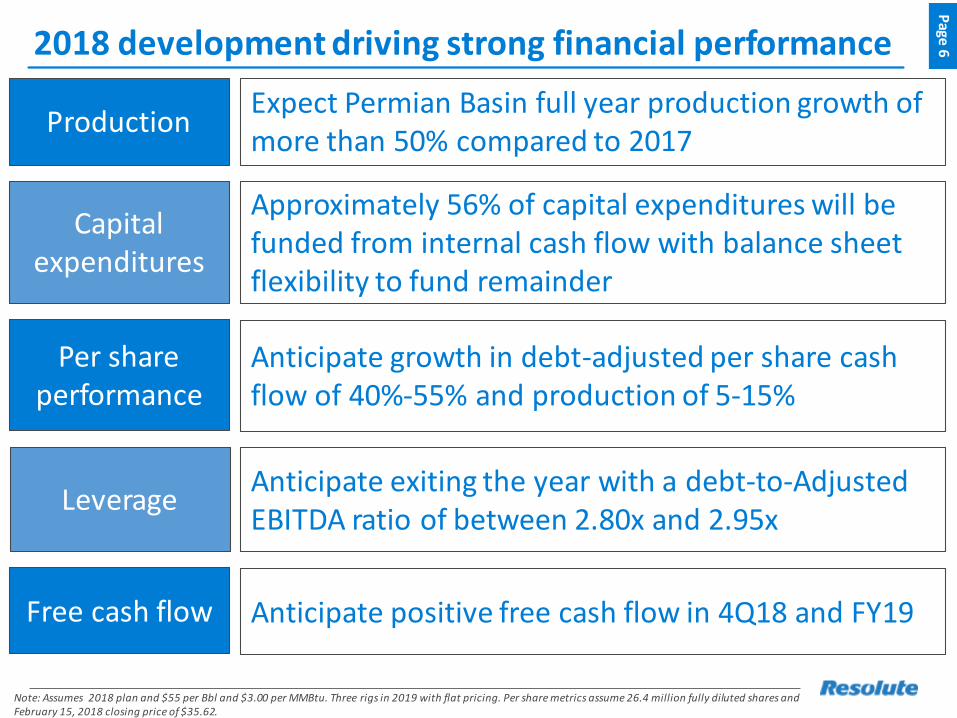
Note: Assumes 2018 plan and $55 per Bbl and $3.00 per MMBtu. Three rigs in 2019 with flat pricing. Per share metrics assume 26.4 million fully diluted shares and February 15, 2018 closing price of $35.62.
ProductionExpect Permian Basin full year production growth ofmore than 50% compared to 2017
Approximately 56% of capital expenditures will be funded from internal cash flow with balance sheet flexibility to fund remainder
Anticipate exiting the year with a debt-to-Adjusted EBITDA ratio of between 2.80x and 2.95x
Anticipate positive free cash flow in 4Q18 and FY19
Capital expenditures
Leverage
Free cash flow
Anticipate growth in debt-adjusted per share cash flow of 40%-55% and production of 5-15%
Per share performance
Consistent production growth, improving cost structureP
age 7
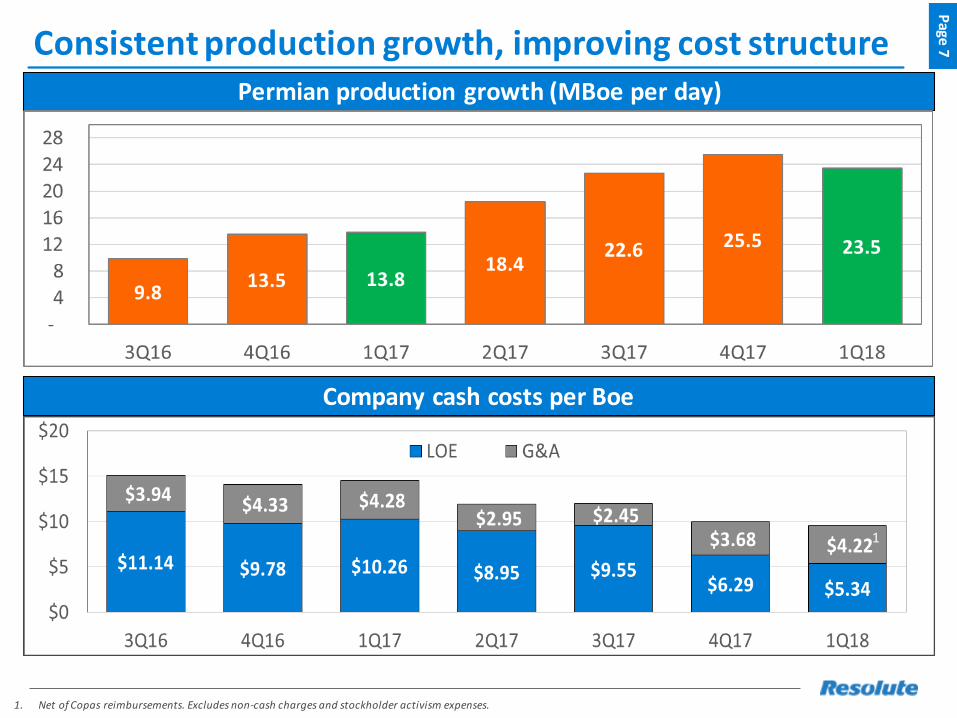
1. Net of Copas reimbursements. Excludes non-cash charges and stockholder activism expenses.
Permian production growth (MBoe per day)
~60% reduction in costs
Company cash costs per Boe
1
Significant growth in production through 2018
Low High Average 2018% liquids
% oil
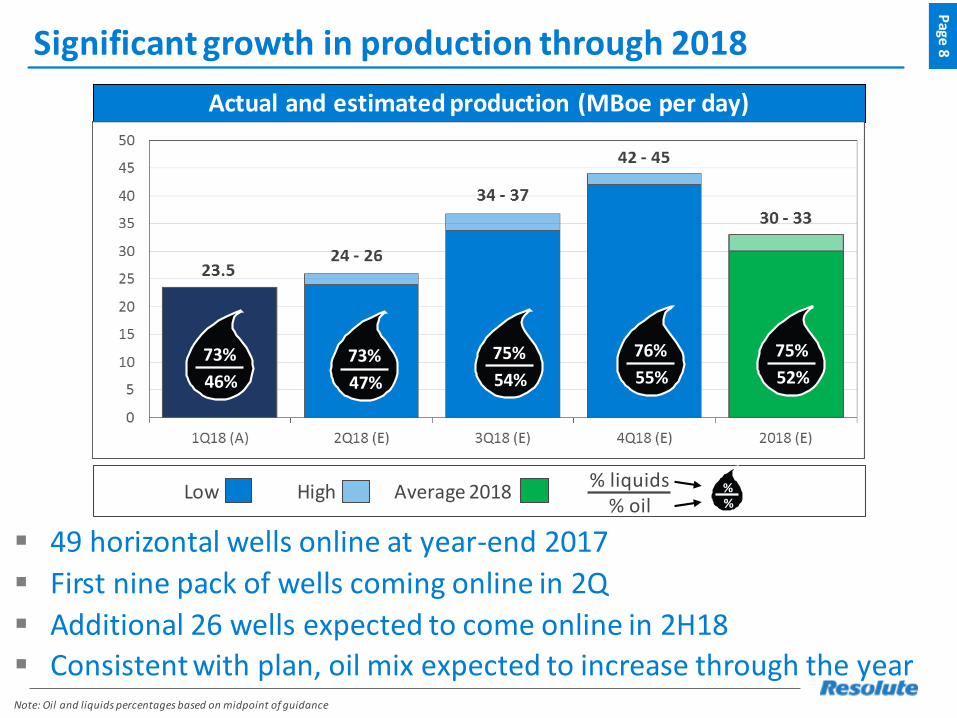
▪ 49 horizontal wells online at year-end 2017
▪ First nine pack of wells coming online in 2Q
▪ Additional 26 wells expected to come online in 2H18
▪ Consistent with plan, oil mix expected to increase through the year
Page
8
Note: Oil and liquids percentages based on midpoint of guidance
Actual and estimated production (MBoe per day)
73%
46%
73%
47%
75%
54%
76%
55%
75%
52%
%%
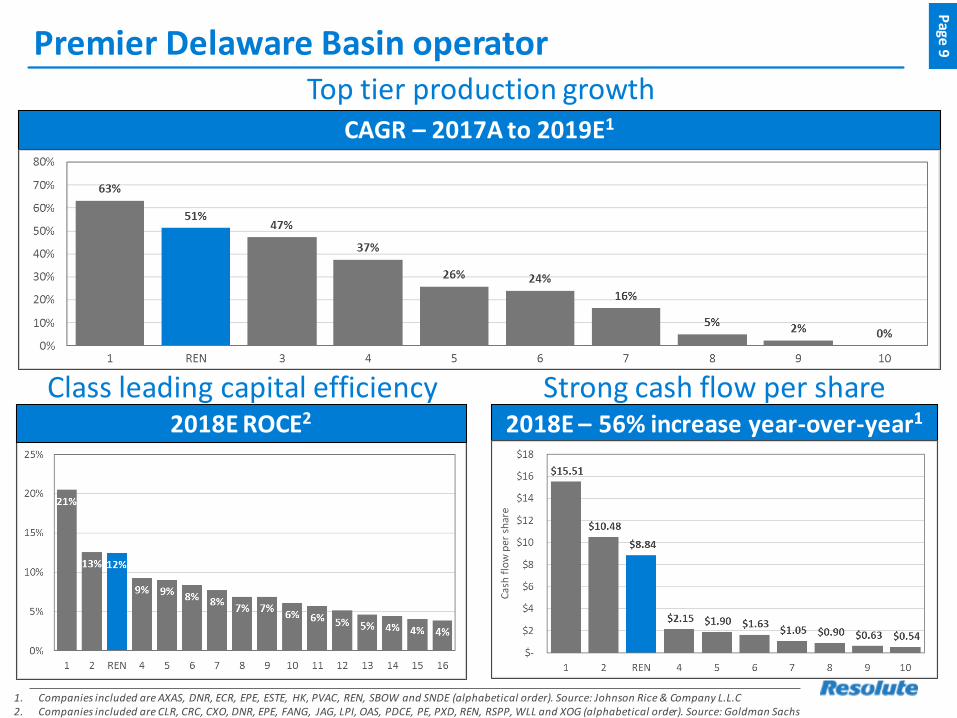
Premier Delaware Basin operatorTop tier production growth
Page
9
1. Companies included are AXAS, DNR, ECR, EPE, ESTE, HK, PVAC, REN, SBOW and SNDE (alphabetical order). Source: Johnson Rice & Company L.L.C 2. Companies included are CLR, CRC, CXO, DNR, EPE, FANG, JAG, LPI, OAS, PDCE, PE, PXD, REN, RSPP, WLL and XOG (alphabetical order). Source: Goldman Sachs
2018E ROCE2
Class leading capital efficiency Strong cash flow per share
CAGR – 2017A to 2019E1
2018E – 56% increase year-over-year1
Pro forma undrawn at
March 31, 2018
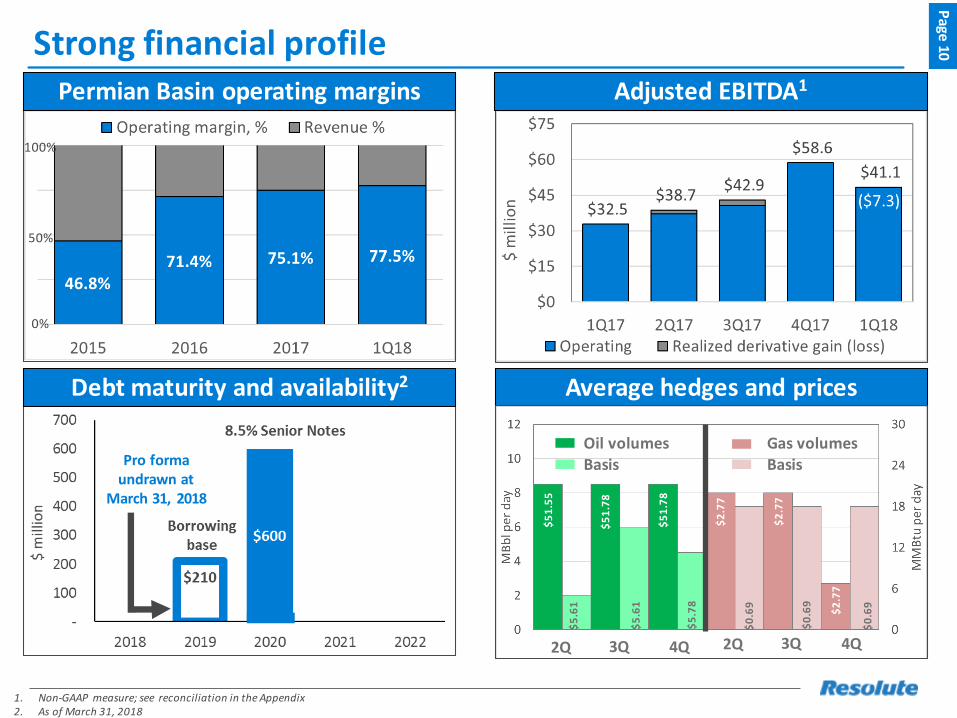
Strong financial profileP
age 10
1. Non-GAAP measure; see reconciliation in the Appendix2. As of March 31, 2018
Debt maturity and availability2
Permian Basin operating margins Adjusted EBITDA1
100%
0%
50%
Average hedges and prices
$5
1.5
5
$5
1.7
8
$5
1.7
8
$2
.77
$2
.77
$2
.77
$0
.69
$0
.69
$0
.69
$5
.61
$5
.61
$5
.78
2Q 3Q 4Q 2Q 3Q 4Q
Oil volumesBasis
Gas volumesBasis
Recent Developments and 2018 Operating Plan
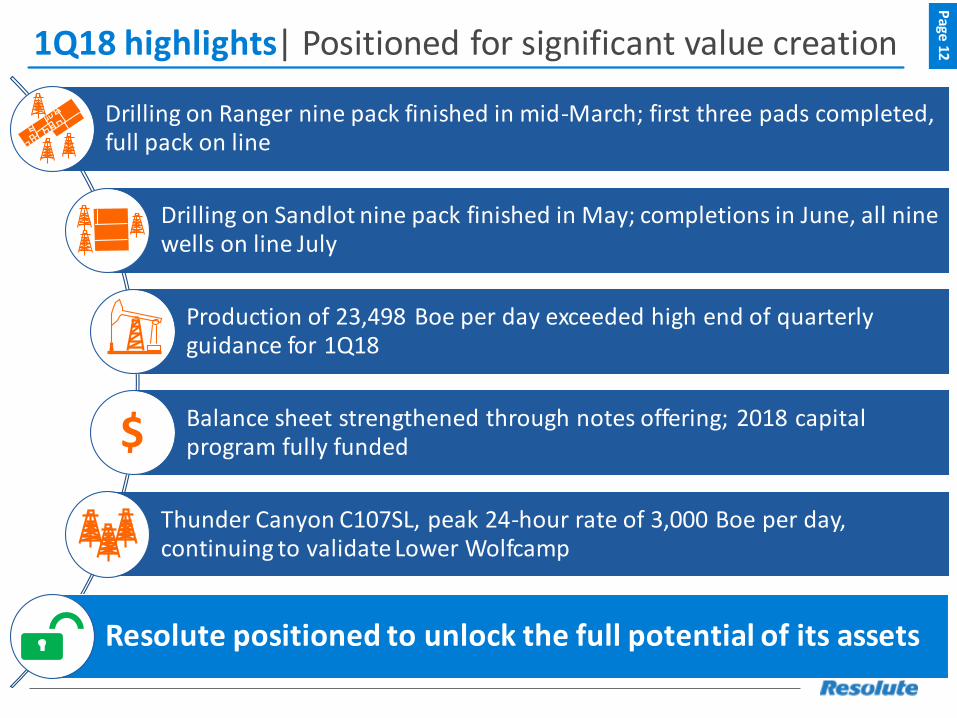
Drilling on Ranger nine pack finished in mid-March; first three pads completed, full pack on line
Drilling on Sandlot nine pack finished in May; completions in June, all nine wells on line July
Production of 23,498 Boe per day exceeded high end of quarterly guidance for 1Q18
Balance sheet strengthened through notes offering; 2018 capital program fully funded
Thunder Canyon C107SL, peak 24-hour rate of 3,000 Boe per day, continuing to validate Lower Wolfcamp
Resolute positioned to unlock the full potential of its assets
1Q18 highlightsP
age 12| Positioned for significant value creation
$
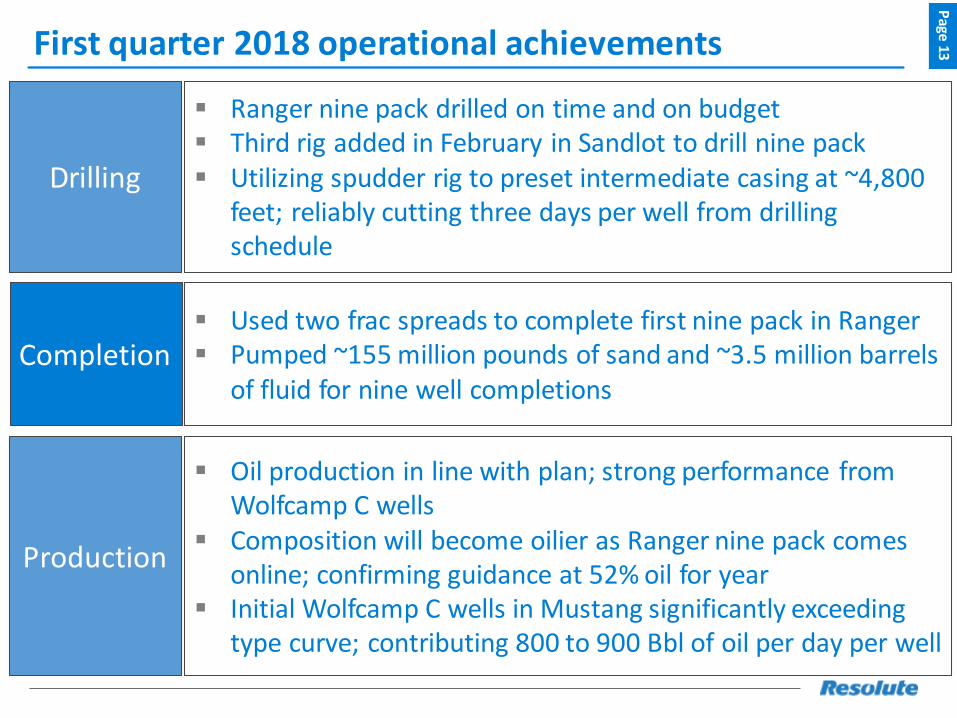
First quarter 2018 operational achievementsP
age 13
Drilling
▪ Ranger nine pack drilled on time and on budget▪ Third rig added in February in Sandlot to drill nine pack▪ Utilizing spudder rig to preset intermediate casing at ~4,800
feet; reliably cutting three days per well from drilling schedule
Completion▪ Used two frac spreads to complete first nine pack in Ranger▪ Pumped ~155 million pounds of sand and ~3.5 million barrels
of fluid for nine well completions
Production
▪ Oil production in line with plan; strong performance from Wolfcamp C wells
▪ Composition will become oilier as Ranger nine pack comes online; confirming guidance at 52% oil for year
▪ Initial Wolfcamp C wells in Mustang significantly exceeding type curve; contributing 800 to 900 Bbl of oil per day per well
San
dlo
t
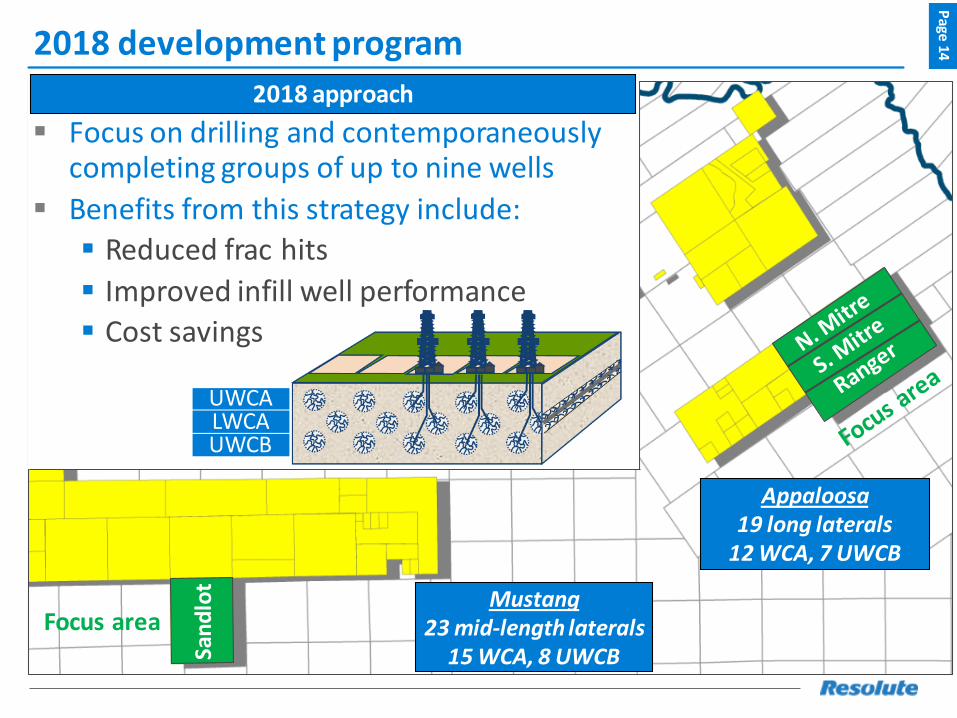
2018 development programP
age 14
2018 approach
UWCALWCAUWCB
▪ Focus on drilling and contemporaneously completing groups of up to nine wells
▪ Benefits from this strategy include:
▪ Reduced frac hits
▪ Improved infill well performance
▪ Cost savings
Appaloosa19 long laterals
12 WCA, 7 UWCB
Mustang23 mid-length laterals
15 WCA, 8 UWCB
Focus area
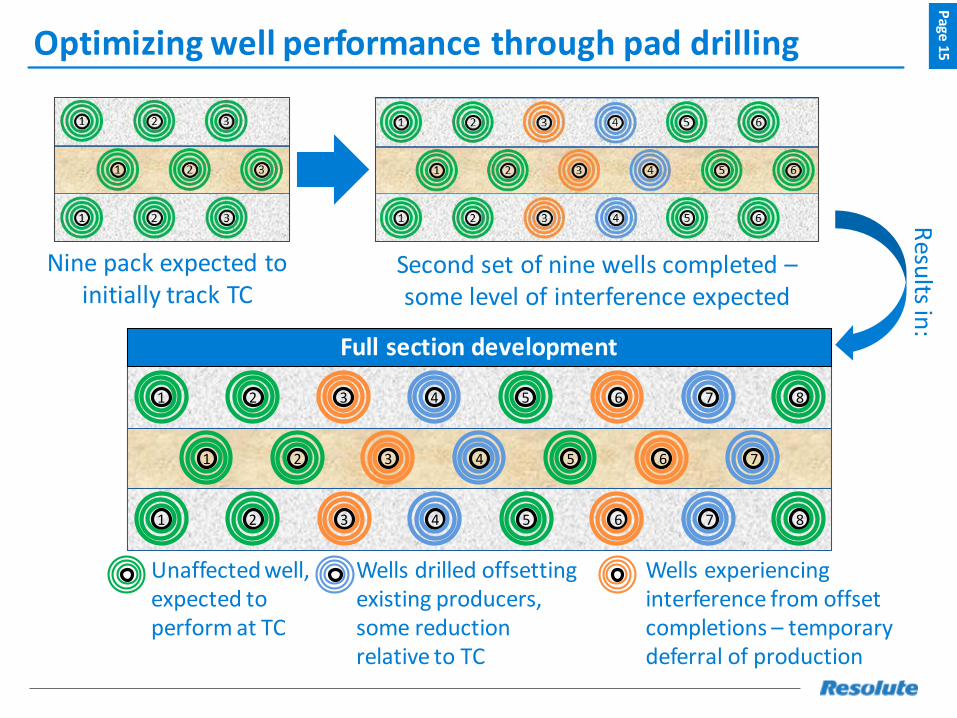
Optimizing well performance through pad drillingP
age 15
Nine pack expected to initially track TC
Second set of nine wells completed –some level of interference expected
Resu
lts in:
Unaffected well, expected to perform at TC
Wells drilled offsetting existing producers, some reduction relative to TC
Wells experiencing interference from offset completions – temporary deferral of production
63 42 5 71
75 6 81 2 3 4
1 5 82 63 4 7
Full section development
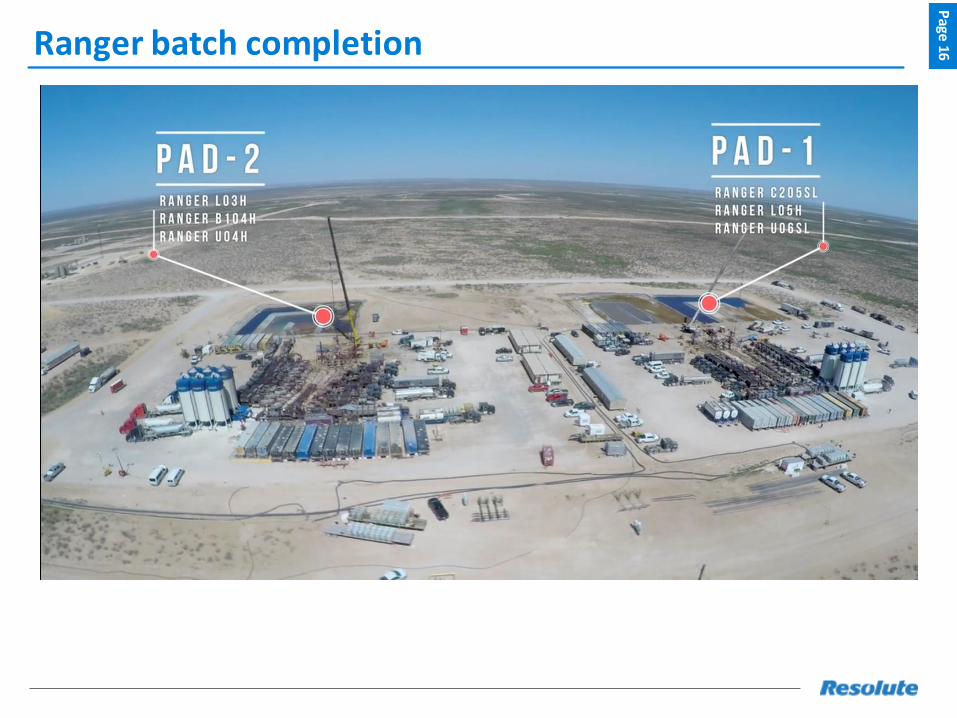
Ranger batch completionP
age 16
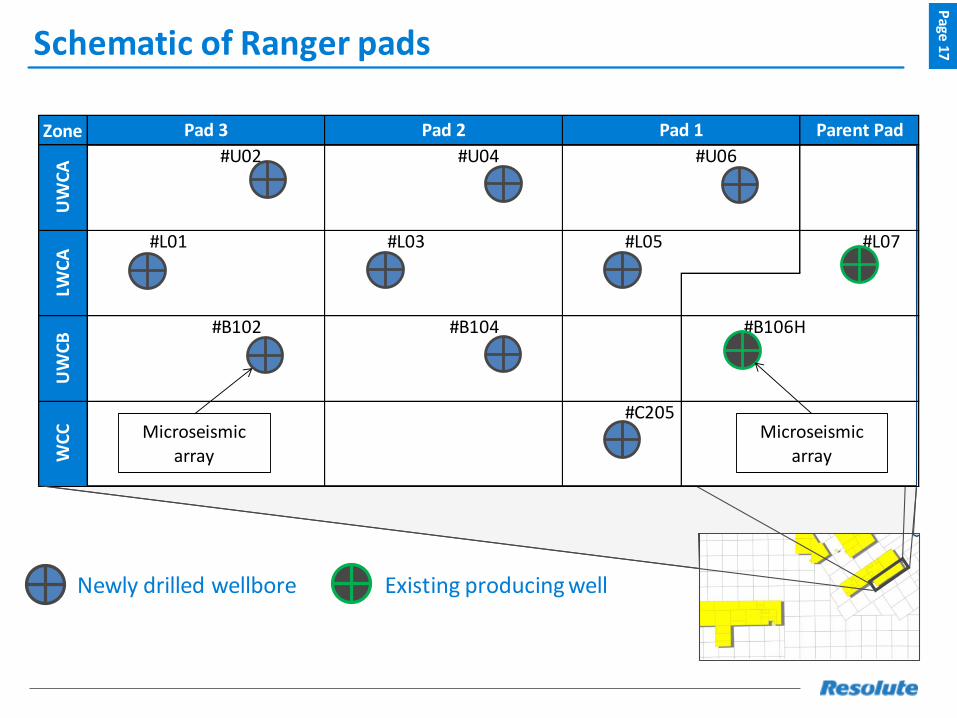
Zone
#U02 #U04 #U06
#L01 #L03 #L05 #L07
#B102 #B104 #B106H
#C205
Parent Pad
UW
CA
LWC
AU
WC
BW
CC
Pad 3 Pad 2 Pad 1
Microseismic array
Microseismic array
Schematic of Ranger padsP
age 17
Newly drilled wellbore Existing producing well
JunJan Feb Mar Apr May
Pad 1
Pad 2
Pad 3
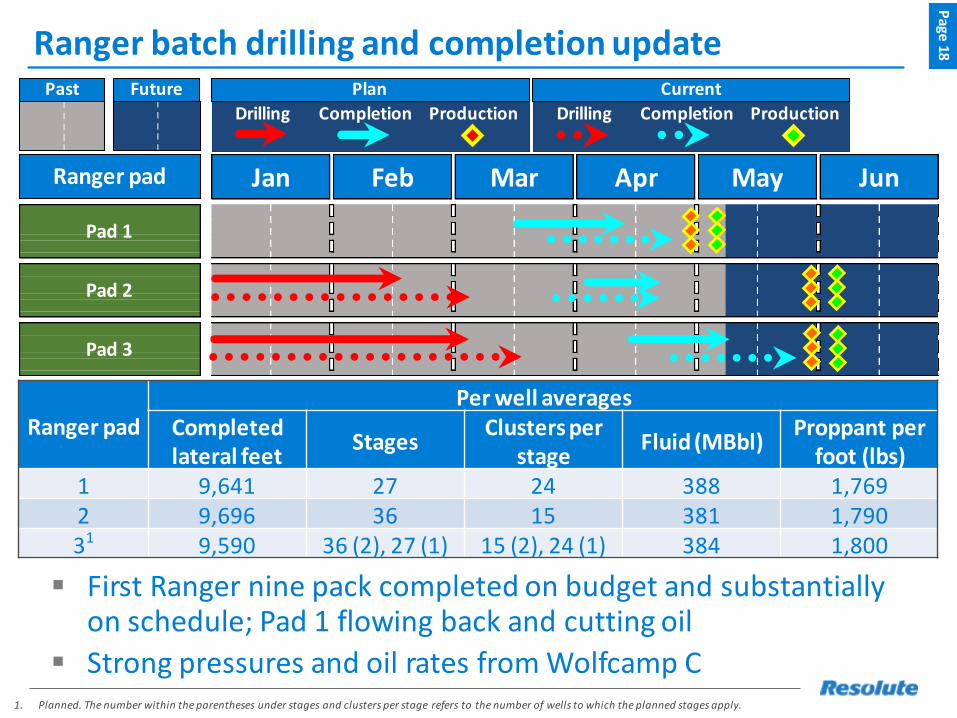
Ranger batch drilling and completion update
▪ First Ranger nine pack completed on budget and substantially on schedule; Pad 1 flowing back and cutting oil
▪ Strong pressures and oil rates from Wolfcamp C
Page
18
1. Planned. The number within the parentheses under stages and clusters per stage refers to the number of wells to which the planned stages apply.
Ranger padPer well averages
Completedlateral feet
StagesClusters per
stageFluid (MBbl)
Proppant per foot (lbs)
1 9,641 27 24 388 1,7692 9,696 36 15 381 1,79031 9,590 36 (2), 27 (1) 15 (2), 24 (1) 384 1,800
ProductionDrilling Completion
Plan
Production
Current
CompletionDrilling
Ranger pad
Past Future
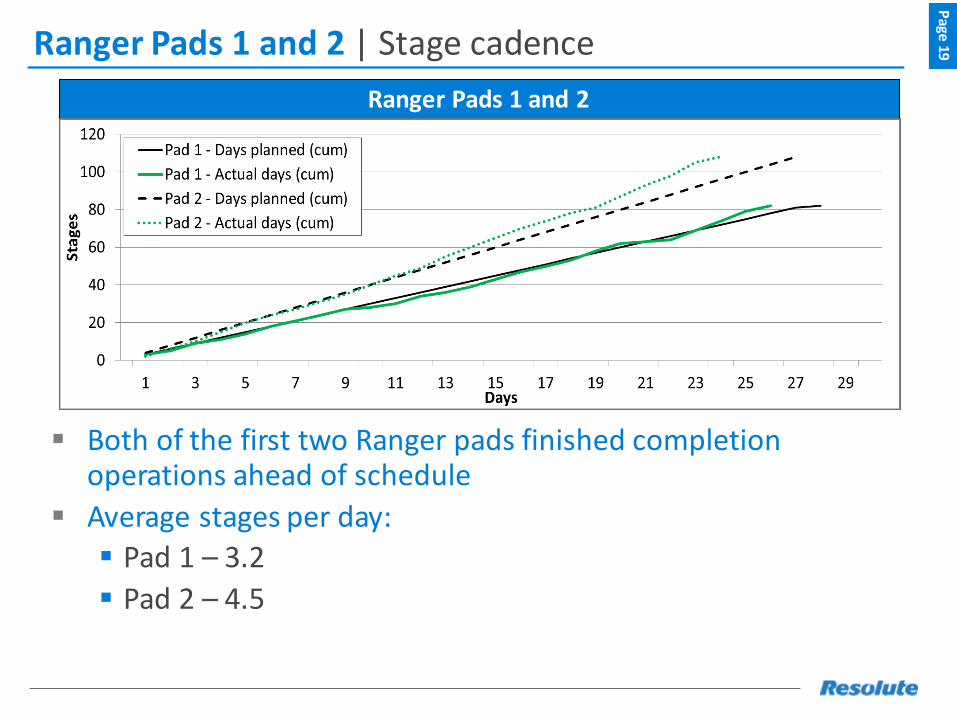
Ranger Pads 1 and 2
▪ Both of the first two Ranger pads finished completion operations ahead of schedule
▪ Average stages per day:
▪ Pad 1 – 3.2
▪ Pad 2 – 4.5
Page
19| Stage cadence
Ranger Pads 1 and 2
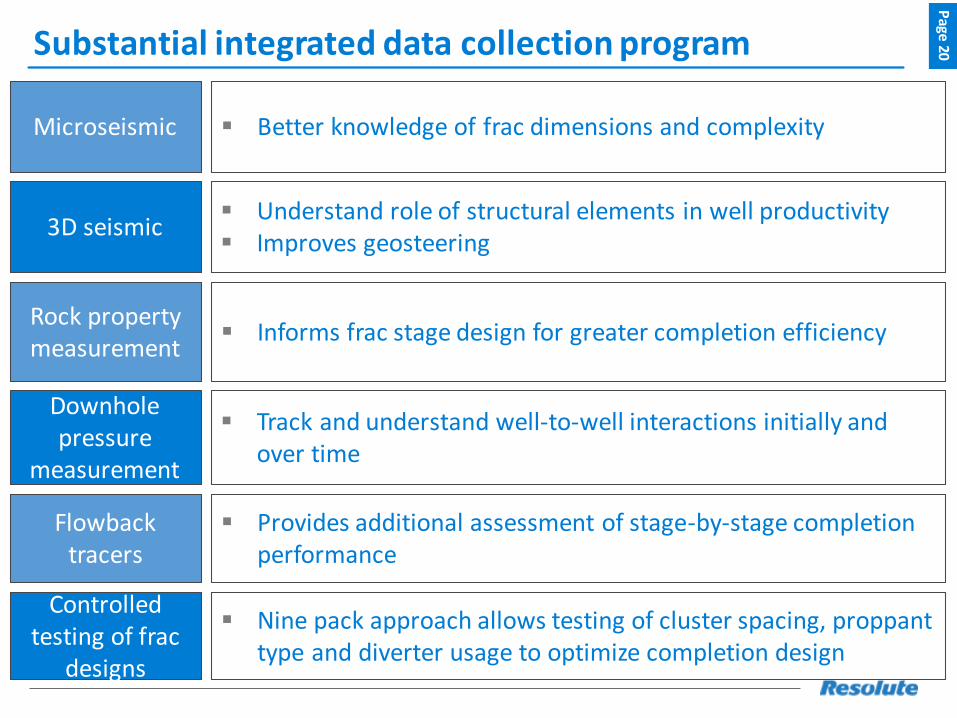
Substantial integrated data collection programP
age 20
Microseismic ▪ Better knowledge of frac dimensions and complexity
3D seismic▪ Understand role of structural elements in well productivity▪ Improves geosteering
Rock property measurement
▪ Informs frac stage design for greater completion efficiency
Downhole pressure
measurement
▪ Track and understand well-to-well interactions initially and over time
Flowback tracers
▪ Provides additional assessment of stage-by-stage completion performance
Controlled testing of frac
designs
▪ Nine pack approach allows testing of cluster spacing, proppant type and diverter usage to optimize completion design
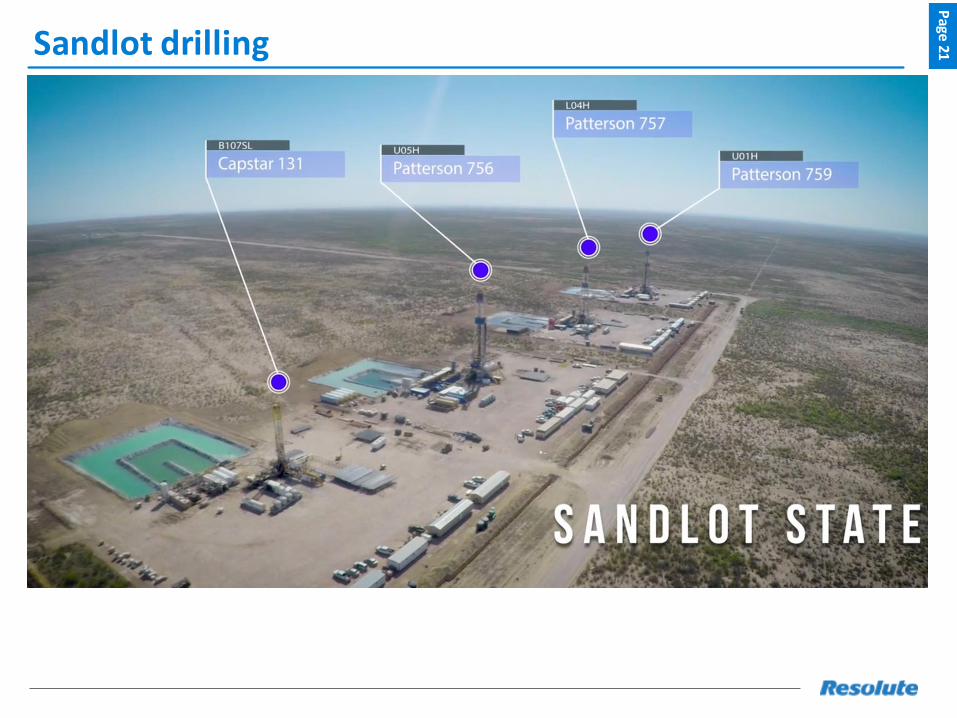
Sandlot drillingP
age 21
Sandlot pad drilling update
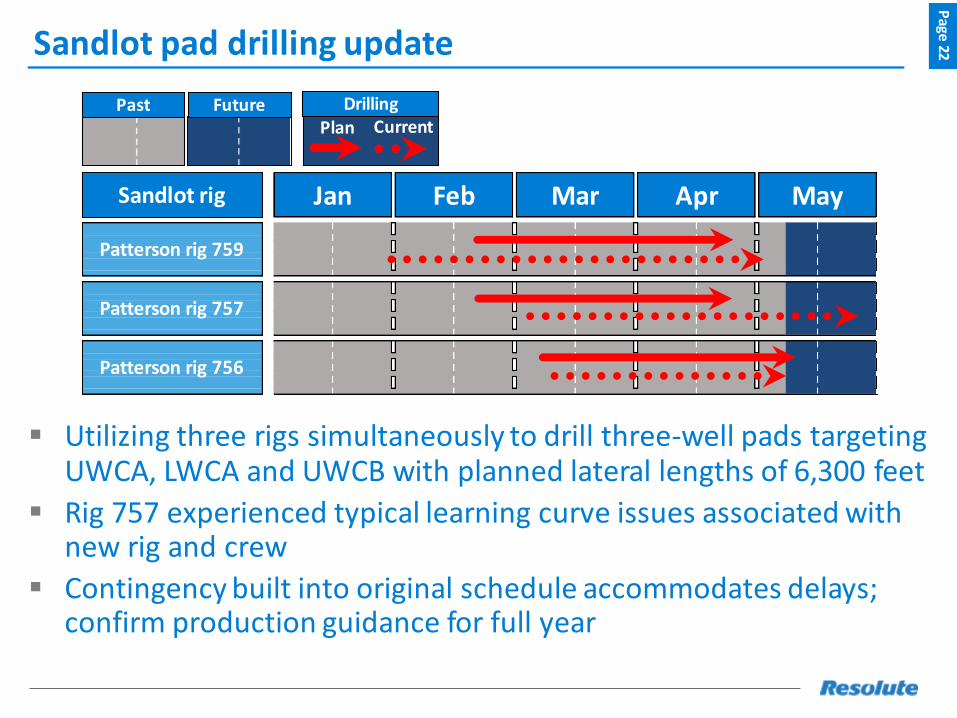
▪ Utilizing three rigs simultaneously to drill three-well pads targeting UWCA, LWCA and UWCB with planned lateral lengths of 6,300 feet
▪ Rig 757 experienced typical learning curve issues associated with new rig and crew
▪ Contingency built into original schedule accommodates delays; confirm production guidance for full year
Page
22
DrillingPlan Current
Patterson rig 756
Patterson rig 759
Patterson rig 757
Jan Feb Mar Apr MaySandlot rig
Past Future
Positive results in Lower WolfcampP
age 23
1. Zone abbreviation legend: LWCB – Lower Wolfcamp B; UWCC – Upper Wolfcamp C
S. Elephant B307SL
S. Elephant C207SL
Ranger C205SL
Uinta C101H
N. Elephant B301SL
Producing WOC
Thunder Canyon C107SL
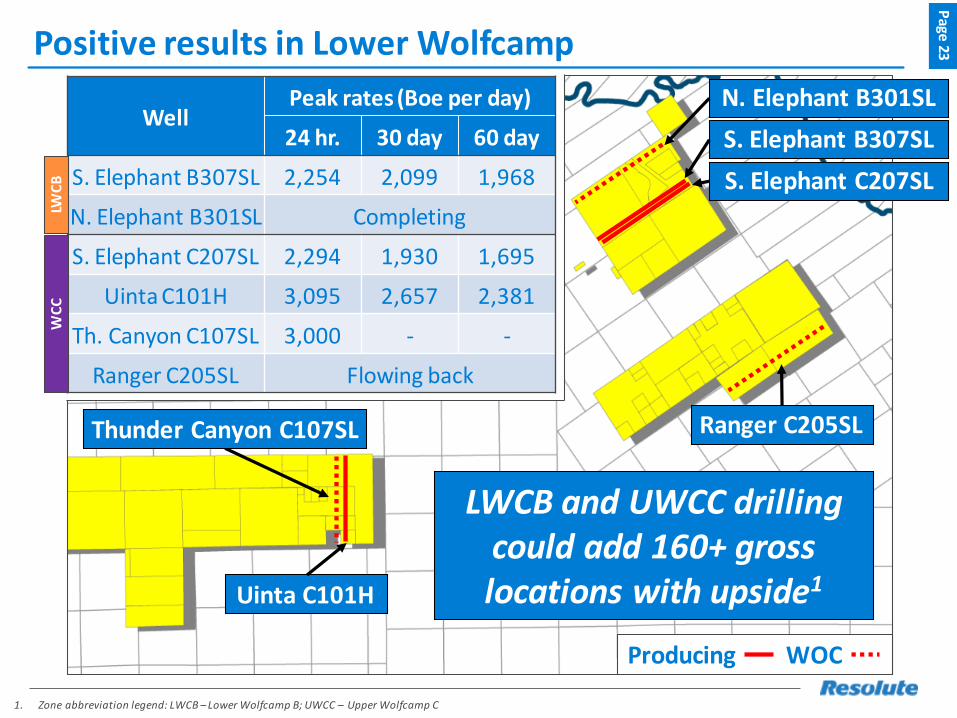
LWCB and UWCC drillingcould add 160+ gross locations with upside1
WellPeak rates (Boe per day)
24 hr. 30 day 60 day
S. Elephant B307SL 2,254 2,099 1,968
N. Elephant B301SL Completing
S. Elephant C207SL 2,294 1,930 1,695
Uinta C101H 3,095 2,657 2,381
Th. Canyon C107SL 3,000 - -
Ranger C205SL Flowing back
LWC
BW
CC
Positive results in Lower WolfcampP
age 24
1 mile
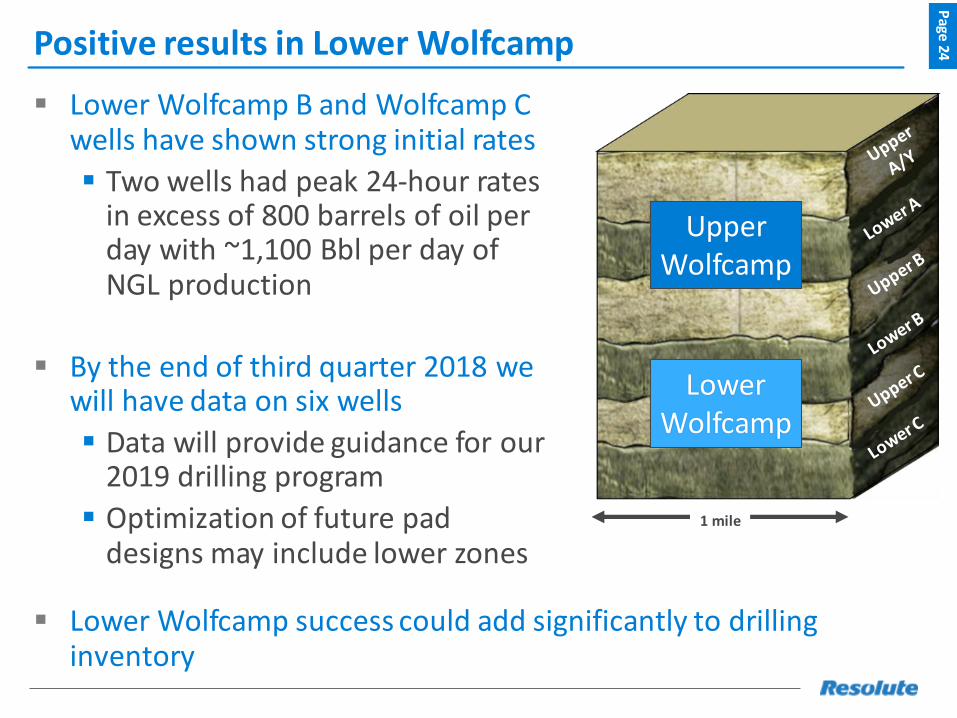
UpperWolfcamp
LowerWolfcamp
▪ Lower Wolfcamp B and Wolfcamp C wells have shown strong initial rates
▪ Two wells had peak 24-hour rates in excess of 800 barrels of oil per day with ~1,100 Bbl per day of NGL production
▪ By the end of third quarter 2018 we will have data on six wells
▪ Data will provide guidance for our 2019 drilling program
▪ Optimization of future pad designs may include lower zones
▪ Lower Wolfcamp success could add significantly to drilling inventory
Ten year development inventory with extensive upsideP
age 25
1. Zone abbreviation legend: LWCB – Lower Wolfcamp B; UWCC – Upper Wolfcamp C
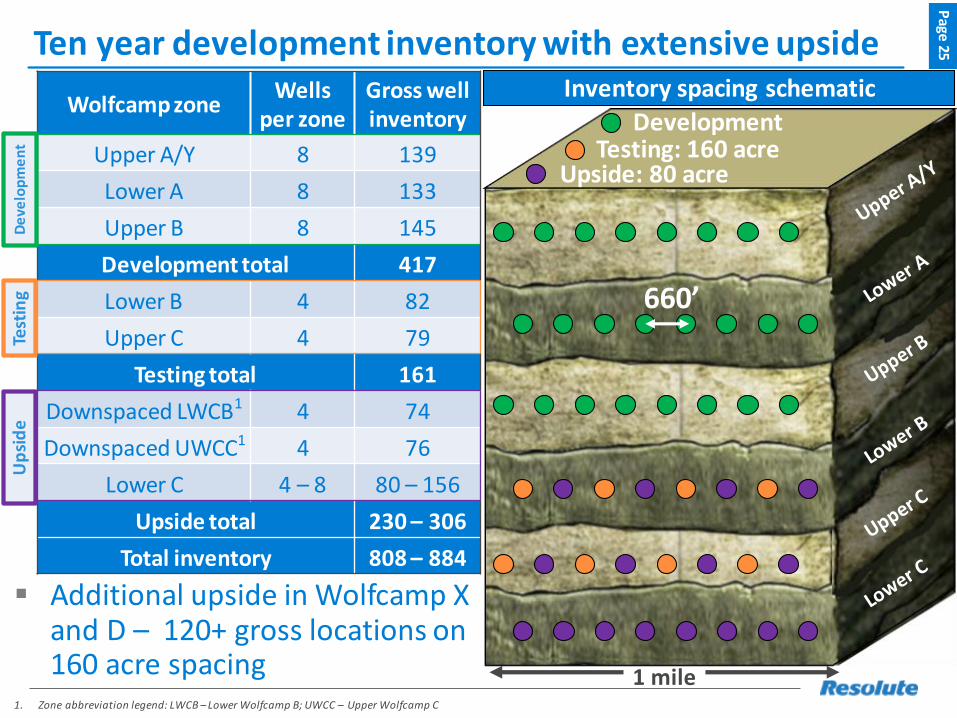
Wolfcamp zoneWells
per zoneGross well inventory
Upper A/Y 8 139
Lower A 8 133
Upper B 8 145
Development total 417
Lower B 4 82
Upper C 4 79
Testing total 161
Downspaced LWCB1 4 74
Downspaced UWCC1 4 76
Lower C 4 – 8 80 – 156
Upside total 230– 306
Total inventory 808– 884
1 mile
Up
sid
e
Development
Upside: 80 acreTesting: 160 acre
Inventory spacing schematic
660’
▪ Additional upside in Wolfcamp X and D – 120+ gross locations on 160 acre spacing
Test
ing
De
velo
pm
en
t
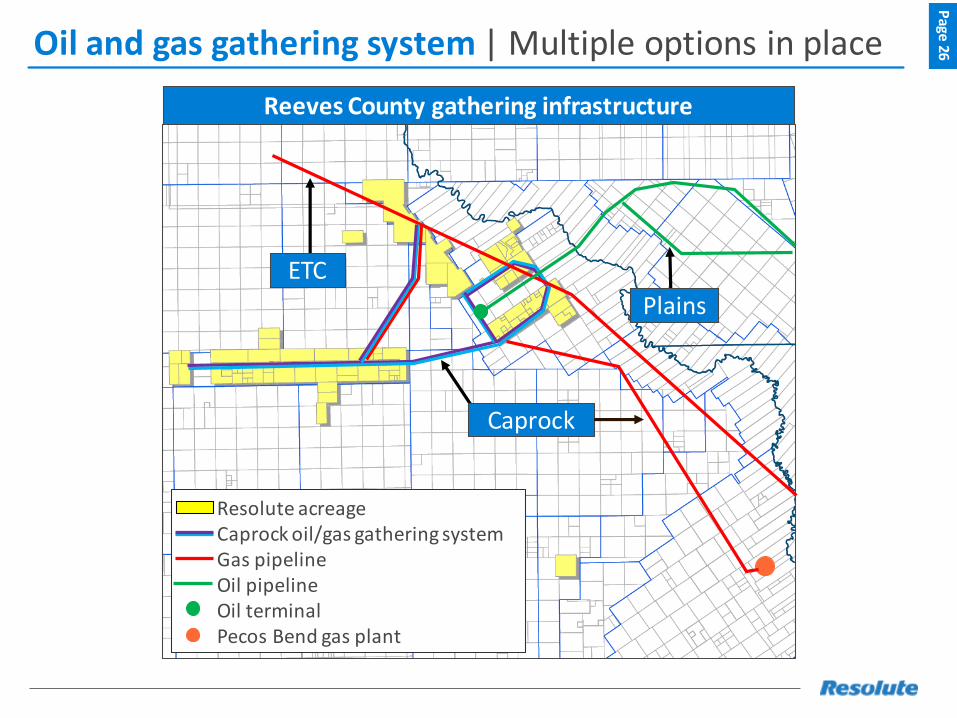
Oil and gas gathering systemP
age 26| Multiple options in place
ETC
Plains
Caprock
Resolute acreageCaprock oil/gas gathering systemGas pipeline Oil pipelineOil terminalPecos Bend gas plant
Reeves County gathering infrastructure
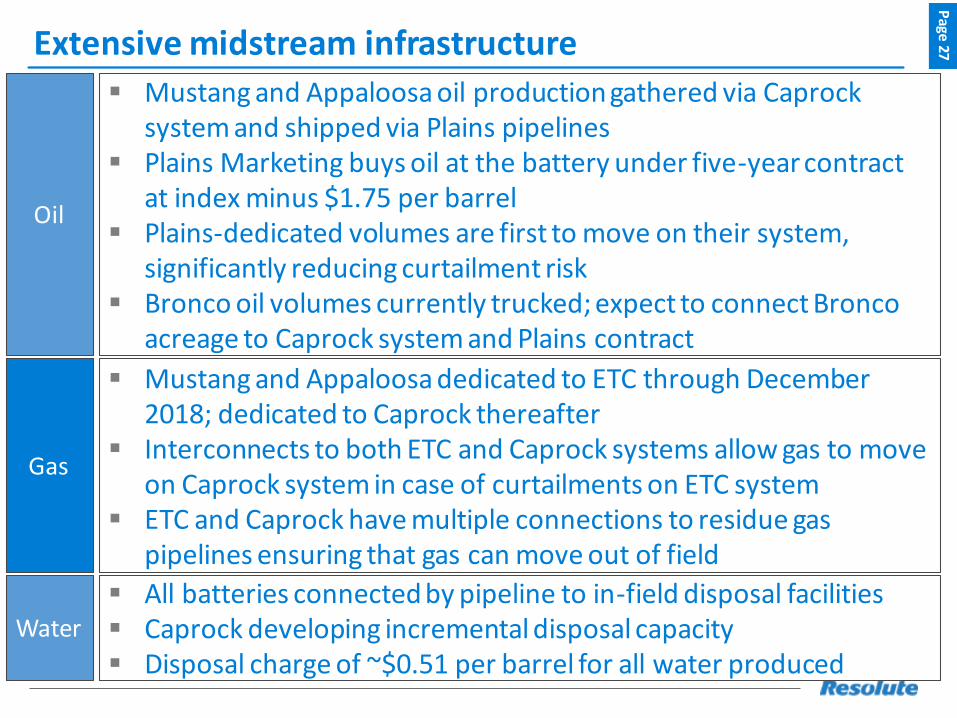
Extensive midstream infrastructureP
age 27
Oil
▪ Mustang and Appaloosa oil production gathered via Caprock system and shipped via Plains pipelines
▪ Plains Marketing buys oil at the battery under five-year contract at index minus $1.75 per barrel
▪ Plains-dedicated volumes are first to move on their system, significantly reducing curtailment risk
▪ Bronco oil volumes currently trucked; expect to connect Bronco acreage to Caprock system and Plains contract
Gas
▪ Mustang and Appaloosa dedicated to ETC through December 2018; dedicated to Caprock thereafter
▪ Interconnects to both ETC and Caprock systems allow gas to move on Caprock system in case of curtailments on ETC system
▪ ETC and Caprock have multiple connections to residue gas pipelines ensuring that gas can move out of field
Water
▪ All batteries connected by pipeline to in-field disposal facilities▪ Caprock developing incremental disposal capacity ▪ Disposal charge of ~$0.51 per barrel for all water produced
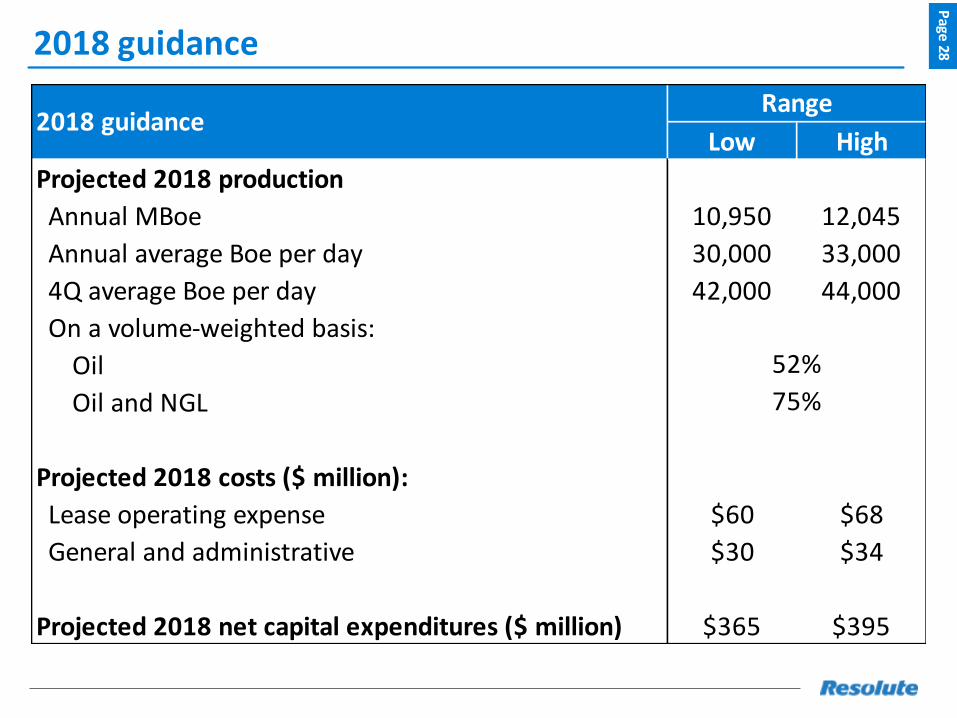
Low High
Projected 2018 production
Annual MBoe 10,950 12,045
Annual average Boe per day 30,000 33,000
4Q average Boe per day 42,000 44,000
On a volume-weighted basis:
Oil
Oil and NGL
Projected 2018 costs ($ million):
Lease operating expense $60 $68
General and administrative $30 $34
Projected 2018 net capital expenditures ($ million) $365 $395
2018 guidanceRange
75%
52%
2018 guidanceP
age 28
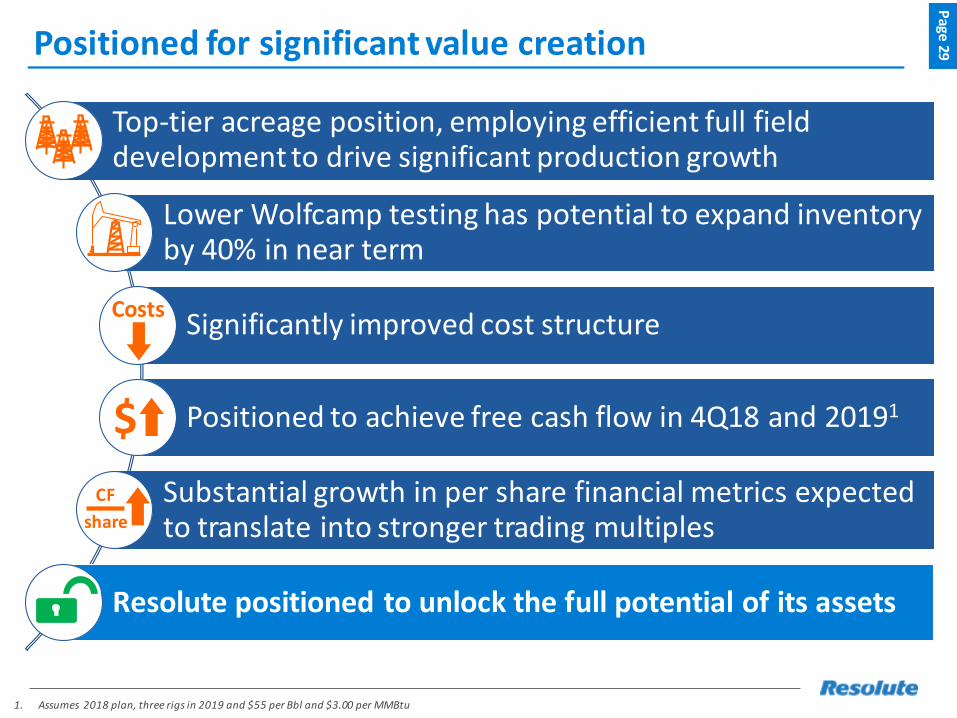
Positioned for significant value creation
Top-tier acreage position, employing efficient full field development to drive significant production growth
Lower Wolfcamp testing has potential to expand inventory by 40% in near term
Significantly improved cost structure
Positioned to achieve free cash flow in 4Q18 and 20191
Substantial growth in per share financial metrics expected to translate into stronger trading multiples
Resolute positioned to unlock the full potential of its assets
Page
29
1. Assumes 2018 plan, three rigs in 2019 and $55 per Bbl and $3.00 per MMBtu
$
CF
share
Costs
Appendix
DecAug Sep Oct Nov
N. Elephant WCB
Jun JulJan Feb Mar Apr May
Uinta C101H
Appaloosa triple
Appaloosa triple
Appaloosa triple
Mustang triple
Mustang triple
Mustang triple
Appaloosa triple
Appaloosa triple
Appaloosa double
Thunder Canyon
C208H
Mustang triple
Mustang triple
Mustang triple
Appaloosa triple
Appaloosa double
Mustang triple
Mustang double
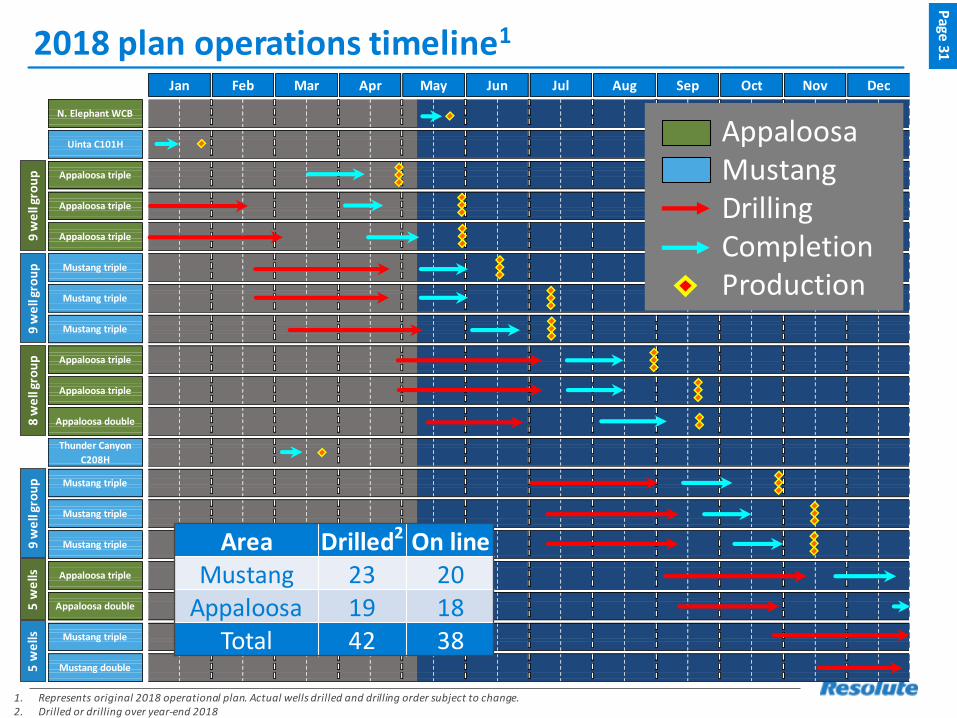
2018 plan operations timeline1P
age 31
1. Represents original 2018 operational plan. Actual wells drilled and drilling order subject to change.2. Drilled or drilling over year-end 2018
AppaloosaMustangDrillingCompletionProduction
8 w
ell
gro
up
9 w
ell
gro
up
9 w
ell
gro
up
9 w
ell
gro
up
5 w
ells
5 w
ells
Area Drilled2 On lineMustang 23 20
Appaloosa 19 18Total 42 38
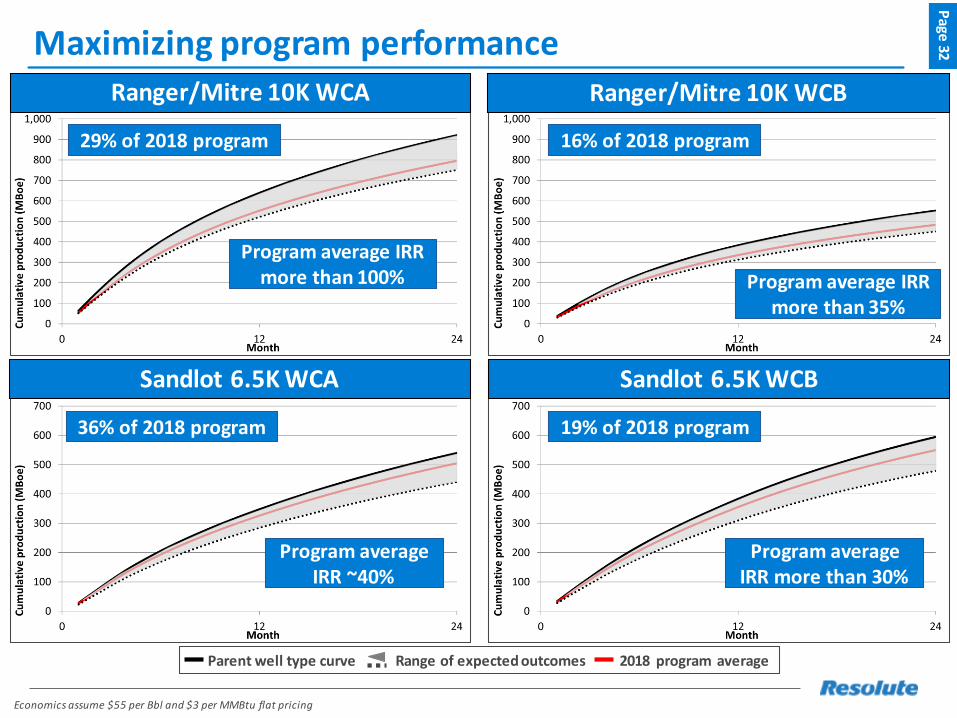
Maximizing program performanceP
age 32
Economics assume $55 per Bbl and $3 per MMBtu flat pricing
Ranger/Mitre 10K WCA
Program average IRR more than 100%
Ranger/Mitre 10K WCB
Program average IRR more than 35%
Parent well type curve 2018 program averageRange of expected outcomes
Sandlot 6.5K WCA
Program average IRR ~40%
Sandlot 6.5K WCB
Program average IRR more than 30%
29% of 2018 program 16% of 2018 program
36% of 2018 program 19% of 2018 program
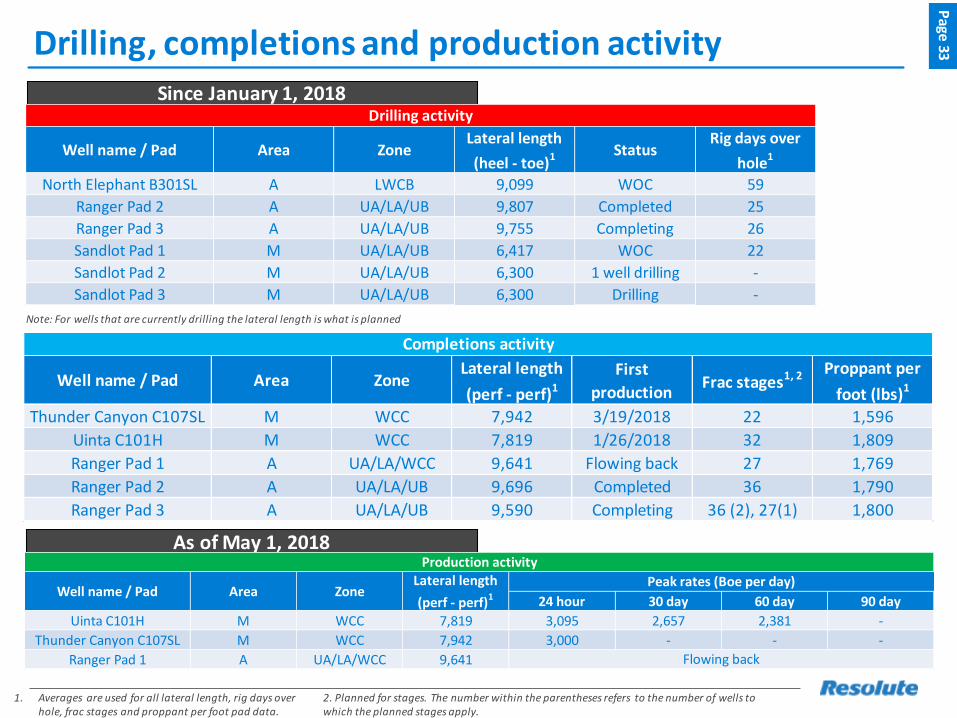
Drilling, completions and production activityP
age 33
1. Averages are used for all lateral length, rig days over hole, frac stages and proppant per foot pad data.
As of May 1, 2018
Since January 1, 2018
Note: For wells that are currently drilling the lateral length is what is planned
2. Planned for stages. The number within the parentheses refers to the number of wells to which the planned stages apply.
Well name / Pad Area ZoneLateral length
(perf - perf)1
First
productionFrac stages1, 2 Proppant per
foot (lbs)1
Thunder Canyon C107SL M WCC 7,942 3/19/2018 22 1,596
Uinta C101H M WCC 7,819 1/26/2018 32 1,809
Ranger Pad 1 A UA/LA/WCC 9,641 Flowing back 27 1,769
Ranger Pad 2 A UA/LA/UB 9,696 Completed 36 1,790
Ranger Pad 3 A UA/LA/UB 9,590 Completing 36 (2), 27(1) 1,800
Completions activity
Well name / Pad Area ZoneLateral length
(heel - toe)1 StatusRig days over
hole1
North Elephant B301SL A LWCB 9,099 WOC 59
Ranger Pad 2 A UA/LA/UB 9,807 Completed 25
Ranger Pad 3 A UA/LA/UB 9,755 Completing 26
Sandlot Pad 1 M UA/LA/UB 6,417 WOC 22
Sandlot Pad 2 M UA/LA/UB 6,300 1 well drilling -
Sandlot Pad 3 M UA/LA/UB 6,300 Drilling -
Drilling activity
24 hour 30 day 60 day 90 day
Uinta C101H M WCC 7,819 3,095 2,657 2,381 -
Thunder Canyon C107SL M WCC 7,942 3,000 - - -
Ranger Pad 1 A UA/LA/WCC 9,641
Well name / Pad
Production activity
Area ZoneLateral length
(perf - perf)1
Peak rates (Boe per day)
Flowing back
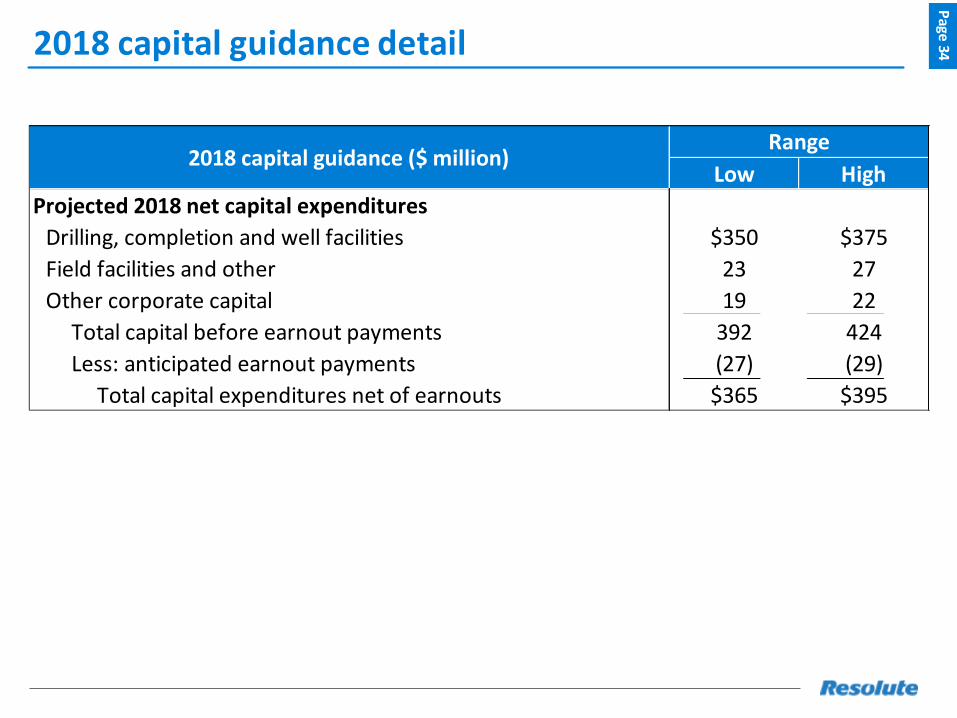
2018 capital guidance detailP
age 34
Low High
Projected 2018 net capital expenditures
Drilling, completion and well facilities $350 $375
Field facilities and other 23 27
Other corporate capital 19 22
Total capital before earnout payments 392 424
Less: anticipated earnout payments (27) (29)
Total capital expenditures net of earnouts $365 $395
2018 capital guidance ($ million)Range
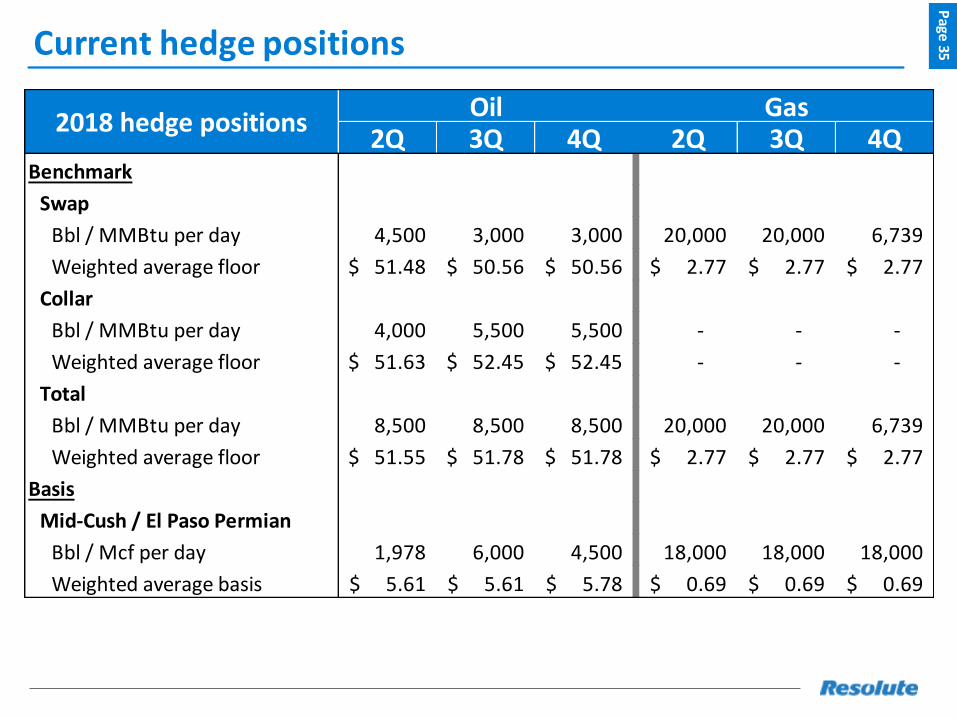
Current hedge positionsP
age 35
2Q 3Q 4Q 2Q 3Q 4QBenchmark
Swap
Bbl / MMBtu per day 4,500 3,000 3,000 20,000 20,000 6,739
Weighted average floor 51.48$ 50.56$ 50.56$ 2.77$ 2.77$ 2.77$
Collar
Bbl / MMBtu per day 4,000 5,500 5,500 - - -
Weighted average floor 51.63$ 52.45$ 52.45$ - - -
Total
Bbl / MMBtu per day 8,500 8,500 8,500 20,000 20,000 6,739
Weighted average floor 51.55$ 51.78$ 51.78$ 2.77$ 2.77$ 2.77$
Basis
Mid-Cush / El Paso Permian
Bbl / Mcf per day 1,978 6,000 4,500 18,000 18,000 18,000
Weighted average basis 5.61$ 5.61$ 5.78$ 0.69$ 0.69$ 0.69$
2018 hedge positionsOil Gas
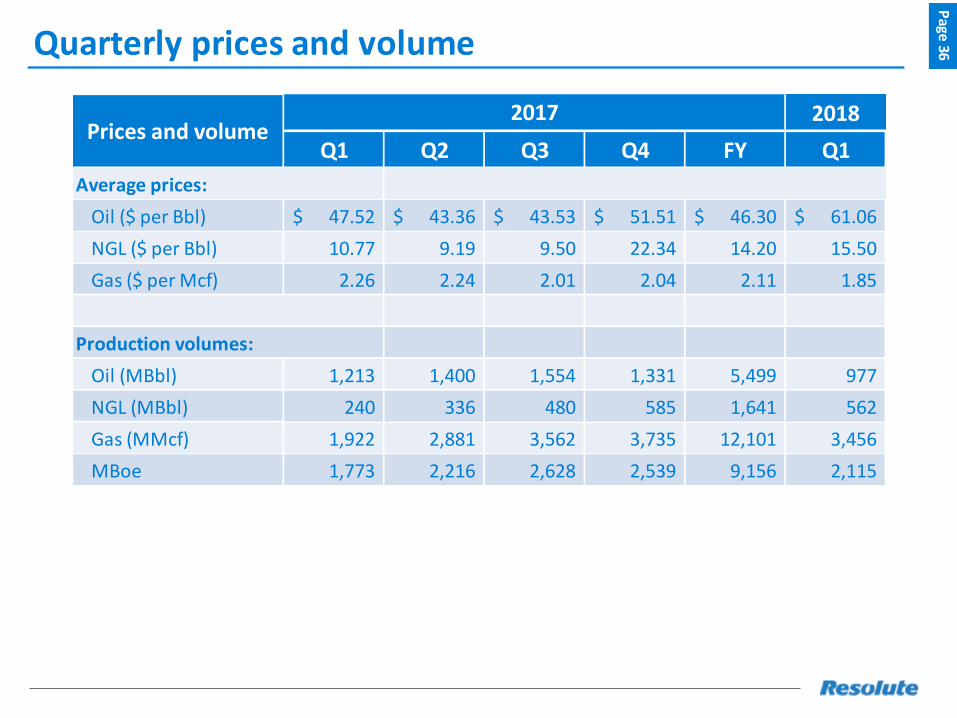
Quarterly prices and volumeP
age 36
2018
Q1 Q2 Q3 Q4 FY Q1
Average prices:
Oil ($ per Bbl) 47.52$ 43.36$ 43.53$ 51.51$ 46.30$ 61.06$
NGL ($ per Bbl) 10.77 9.19 9.50 22.34 14.20 15.50
Gas ($ per Mcf) 2.26 2.24 2.01 2.04 2.11 1.85
Production volumes:
Oil (MBbl) 1,213 1,400 1,554 1,331 5,499 977
NGL (MBbl) 240 336 480 585 1,641 562
Gas (MMcf) 1,922 2,881 3,562 3,735 12,101 3,456
MBoe 1,773 2,216 2,628 2,539 9,156 2,115
2017Prices and volume
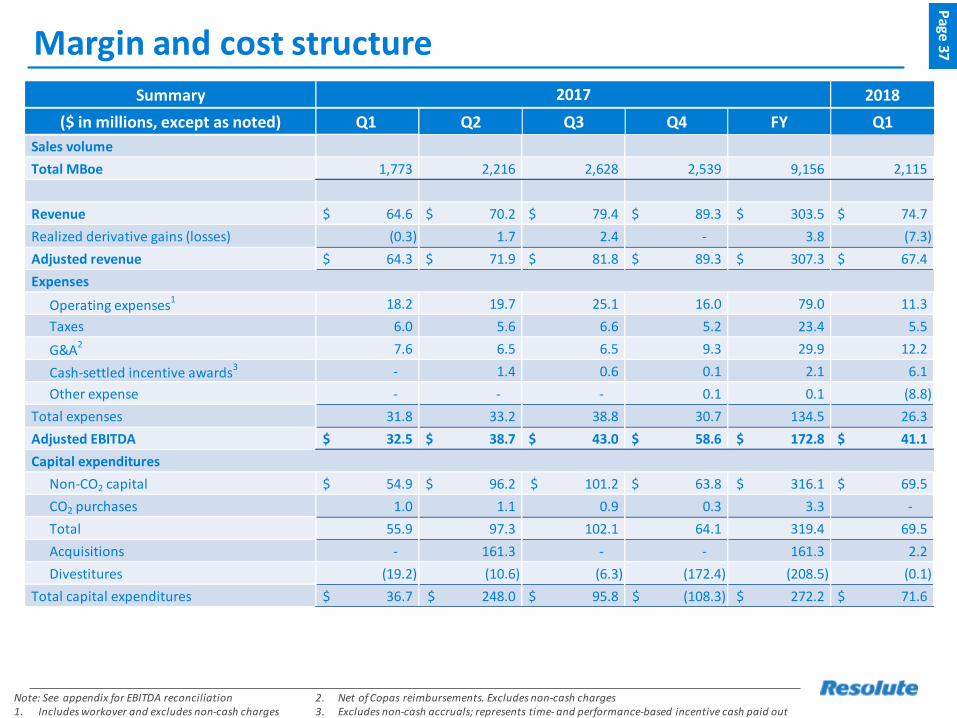
Margin and cost structureP
age 37
Note: See appendix for EBITDA reconciliation 1. Includes workover and excludes non-cash charges
2. Net of Copas reimbursements. Excludes non-cash charges 3. Excludes non-cash accruals; represents time- and performance-based incentive cash paid out
Summary 2018
($ in millions, except as noted) Q1 Q2 Q3 Q4 FY Q1
Sales volume
Total MBoe 1,773 2,216 2,628 2,539 9,156 2,115
Revenue 64.6$ 70.2$ 79.4$ 89.3$ 303.5$ 74.7$
Realized derivative gains (losses) (0.3) 1.7 2.4 - 3.8 (7.3)
Adjusted revenue 64.3$ 71.9$ 81.8$ 89.3$ 307.3$ 67.4$
Expenses
Operating expenses1 18.2 19.7 25.1 16.0 79.0 11.3
Taxes 6.0 5.6 6.6 5.2 23.4 5.5
G&A2 7.6 6.5 6.5 9.3 29.9 12.2
Cash-settled incentive awards3 - 1.4 0.6 0.1 2.1 6.1
Other expense - - - 0.1 0.1 (8.8)
Total expenses 31.8 33.2 38.8 30.7 134.5 26.3
Adjusted EBITDA 32.5$ 38.7$ 43.0$ 58.6$ 172.8$ 41.1$
Capital expenditures
Non-CO2 capital 54.9$ 96.2$ 101.2$ 63.8$ 316.1$ 69.5$
CO2 purchases 1.0 1.1 0.9 0.3 3.3 -
Total 55.9 97.3 102.1 64.1 319.4 69.5
Acquisitions - 161.3 - - 161.3 2.2
Divestitures (19.2) (10.6) (6.3) (172.4) (208.5) (0.1)
Total capital expenditures 36.7$ 248.0$ 95.8$ (108.3)$ 272.2$ 71.6$
2017
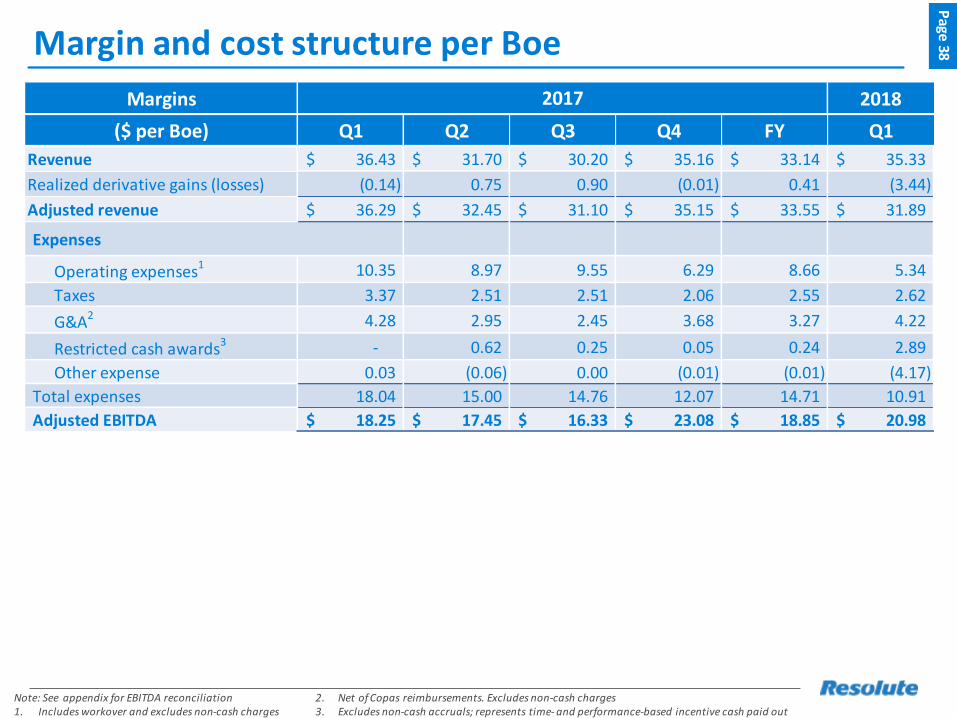
Margin and cost structure per BoeP
age 38
Note: See appendix for EBITDA reconciliation 1. Includes workover and excludes non-cash charges
2. Net of Copas reimbursements. Excludes non-cash charges 3. Excludes non-cash accruals; represents time- and performance-based incentive cash paid out
Margins 2018
($ per Boe) Q1 Q2 Q3 Q4 FY Q1
Revenue 36.43$ 31.70$ 30.20$ 35.16$ 33.14$ 35.33$
Realized derivative gains (losses) (0.14) 0.75 0.90 (0.01) 0.41 (3.44)
Adjusted revenue 36.29$ 32.45$ 31.10$ 35.15$ 33.55$ 31.89$
Expenses
Operating expenses1 10.35 8.97 9.55 6.29 8.66 5.34
Taxes 3.37 2.51 2.51 2.06 2.55 2.62
G&A2 4.28 2.95 2.45 3.68 3.27 4.22
Restricted cash awards3 - 0.62 0.25 0.05 0.24 2.89
Other expense 0.03 (0.06) 0.00 (0.01) (0.01) (4.17)
Total expenses 18.04 15.00 14.76 12.07 14.71 10.91
Adjusted EBITDA 18.25$ 17.45$ 16.33$ 23.08$ 18.85$ 20.98$
2017
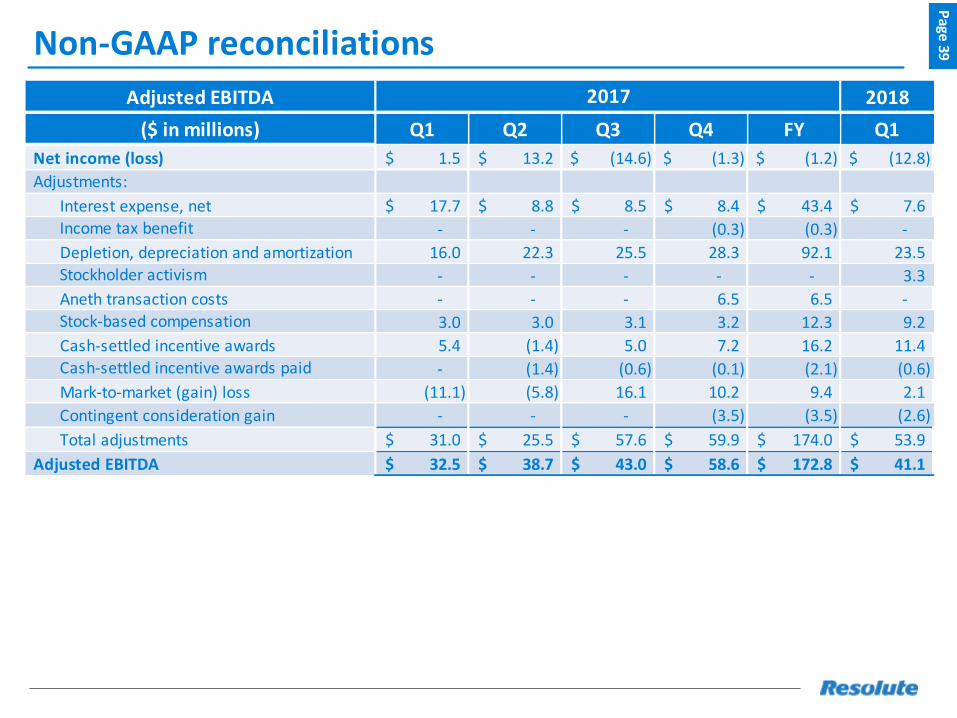
Non-GAAP reconciliationsP
age 39
Adjusted EBITDA 2018
($ in millions) Q1 Q2 Q3 Q4 FY Q1
Net income (loss) 1.5$ 13.2$ (14.6)$ (1.3)$ (1.2)$ (12.8)$
Interest expense, net 17.7$ 8.8$ 8.5$ 8.4$ 43.4$ 7.6$
- - - (0.3) (0.3) -
Depletion, depreciation and amortization 16.0 22.3 25.5 28.3 92.1 23.5
- - - - - 3.3
Aneth transaction costs - - - 6.5 6.5 -
3.0 3.0 3.1 3.2 12.3 9.2
Cash-settled incentive awards 5.4 (1.4) 5.0 7.2 16.2 11.4
- (1.4) (0.6) (0.1) (2.1) (0.6)
Mark-to-market (gain) loss (11.1) (5.8) 16.1 10.2 9.4 2.1
- - - (3.5) (3.5) (2.6)
Total adjustments 31.0$ 25.5$ 57.6$ 59.9$ 174.0$ 53.9$
32.5$ 38.7$ 43.0$ 58.6$ 172.8$ 41.1$ Adjusted EBITDA
Contingent consideration gain
Cash-settled incentive awards paid
Stock-based compensation
Stockholder activism
Income tax benefit
2017
Adjustments:


![I'lFIITHBIR UNIVERSITYexampapers.nust.na/greenstone3/sites/localsite/collect... · 2020-04-08 · 4.1.1 Using theresults from output above, calculate the regression estimate. [3]](https://static.fdocuments.us/doc/165x107/5f34c61c11c3d434fa1d4dc1/ilfiithbir-2020-04-08-411-using-theresults-from-output-above-calculate-the.jpg)


