PowerPoint Presentation · This presentation (the "Presentation") contains "forward-looking...
30
MARCH 2018 TSXV: OM
Transcript of PowerPoint Presentation · This presentation (the "Presentation") contains "forward-looking...

MARCH 2018
TSXV: OM

This presentation (the "Presentation") contains "forward-looking information" and "forward-looking statements" (collectively, "forward-looking statements") within the meaning of applicable securities legislation. All
statements, other than statements of historical fact, are forward-looking statements and are based on expectations, estimates and projections as at the date of this Presentation. Any statement that involves discussions
with respect to predictions, expectations, beliefs, plans, projections, objectives, assumptions, future events or performance (often but not always using phrases such as "expects", or "does not expect", "is expected",
"anticipates" or "does not anticipate", "plans", "budget", "scheduled", "forecasts", "estimates", "believes" or "intends" or variations of such words and phrases or stating that certain actions, events or results "may" or
"could", "would", "might" or "will" be taken to occur or be achieved) are not statements of historical fact and may be forward-looking statements.
In this Presentation, forward-looking statements relate, among other things, to the market capitalization of Osisko Metals Incorporated ("Osisko Metals"); the strong balance sheet of Osisko Metals; the potential of the
Bathurst Mining Camp and related projects and Quebec GenEx projects, if any; the proposed exploration activities at both of the project sites; the timing and ability, if at all, of Osisko Metals to follow-up on the previous
historical drill results within the Bathurst Mining Camp and the Quebec GenEx projects; the ability of Osisko Metals to create shareholder value; the major shareholders and research coverage of Osisko Metals going
forward; in the Bathurst Mining Camp, the development of the multi-deposit strategy using a central concentrator, including the use of the existing power grid, access to the existing water supplies, access to existing rail
and road networks; district-scaled exploration opportunities; comparisons of global resources to enterprise valuation; the timing and success of exploration, development and metallurgical testing activities; the timing,
extent and success of mining operations (if any), project development and related permitting; the results of exploration programs; the results of economic analyses (if any); the ability to expand mineral resources beyond
current historical mineral resource estimates; opportunities for growth of mineral projects; estimates of zinc prices; the ability to adapt to changes in zinc prices; estimates of costs, estimates of planned exploration and
development expenditures and estimates of mine development and construction. All forward-looking information entails various risks and uncertainties that are based on current expectations and actual results may differ
materially from those contained in such information.
These uncertainties and risks include, but are not limited to, risks relating to the ability of exploration activities (including drill results) to accurately predict mineralization; errors in management's geological modelling; the
ability of Osisko Metals to complete further exploration activities, including drilling; property interests in the Bathurst Mining Camp; the ability of Osisko Metals to obtain required approvals and complete transactions on
terms announced; the results of exploration activities; risks relating to mining activities; fluctuations in spot and forward prices of zinc and other base metals; fluctuations in currency markets (such as the Canadian dollar
to United States dollar exchange rate); change in international, national and local government, legislation, taxation, controls, regulations and political or economic developments; risks and hazards associated with the
business of mineral exploration, development and mining (including environmental hazards, industrial accidents, unusual or unexpected formations pressures, cave-ins and flooding); inability to obtain adequate
insurance to cover risks and hazards; the presence of laws and regulations that may impose restrictions on mining; employee relations; relationships with and claims by local communities and indigenous populations;
availability of increasing costs associated with mining inputs and labour; the speculative nature of mineral exploration and development (including the risks of obtaining necessary licenses, permits and approvals from
government authorities); and title to properties. Risks and uncertainties about Osisko Metals' business are more fully discussed in the disclosure materials filed with the securities regulatory authorities in Canada, which
are available on SEDAR under the issuer profile of Osisko Metals at www.sedar.com. Readers are urged to read these materials and should not place undue reliance on any forward‐looking statement and information
contained in this Presentation. Except as required by law, Osisko Metals assume no obligation to update the forward‐looking statements of beliefs, opinions, projections, or other factors, should they change, except as
required by law.
The information herein is not for distribution and does not constitute an offer to sell or the solicitation of any offer to buy any securities in the United States of America or to or for the benefit of any US Person as such
term is defined under the United States Securities Act of 1933, as amended.
MINERAL RESOURCES
This Presentation contains information regarding mineral resources estimated at the projects of the companies referenced herein. Mineral resources are not mineral reserves and do not have demonstrated economic
viability. The estimate of mineral resources may be materially affected by environmental, permitting, legal, title, socio-political, marketing or other relevant issues. In particular, the quantity and grade of reported inferred
mineral resources in the estimates referenced in this Presentation are uncertain in nature and there is insufficient exploration to define these inferred mineral resources as an indicated or measured mineral resource in
all cases. It is uncertain in all cases whether further exploration will result in upgrading the inferred mineral resources to an indicated or measured mineral resource category.
This investor presentation contains disclosure of historical estimates which were obtained from both the New Brunswick Government Mineral Deposits database and the Ministère de l'Énergie et des Ressources
Naturelles du Québec (MERN & SIGEOM) databases. Readers are cautioned that Osisko Metals has not completed the work required to independently analyze and verify the results of previous operators nor has a
qualified person done sufficient work to classify the historical estimates as current mineral resources or mineral reserves. Osisko Metals is not treating the historical estimates as current mineral resources, and it believes
these historical estimates provide an indication of the potential of the properties and are reported because they are deemed relevant to the description of the properties.
QUALIFIED PERSON
The scientific and technical information contained in this Presentation has been reviewed and approved by Jeff Hussey, P.Geo. and President & CEO of Osisko Metals, a "qualified person" within the meaning of National
Instrument 43-101 – Standards for Disclosure of Mineral Projects.
Forward-LookingStatements& CautionaryNotes
Regarding TechnicalInformation
2

• Control of Canada’s two premier zinc camps:
o Pine Point Camp, Northwest Territories (development-stage).
o The Bathurst Mining Camp, New Brunswick (advanced-stage exploration).
• Aggressive project development strategy
o Combined 100,000 metre drill program at both camps.
o One of the largest drill campaigns within the base metals space at this moment.
• Management and BOD know-how and past success rate:
o Ability to rapidly advance projects thanks to the synergy with the Osisko Group of
companies; sharing experience, technical ability and access to capital.
• Well Capitalized; No debt
o $35 Million in treasury.
o Well funded over the next two years to advance the aggressive drill programs at both
the BMC and Pine Point camps.
Who is Osisko Metals?
3
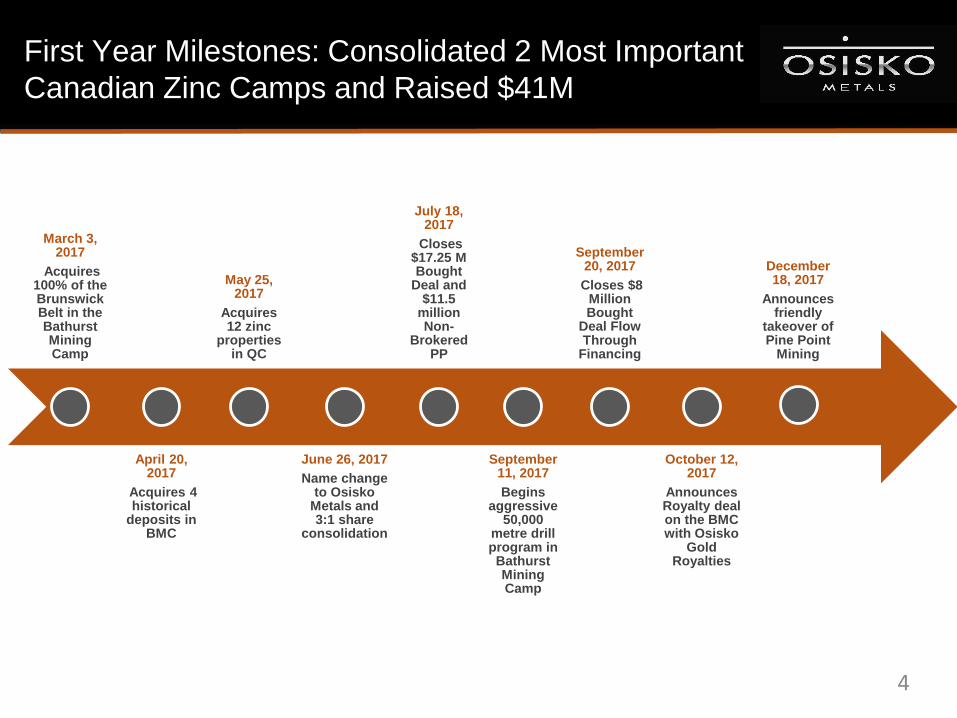
March 3, 2017
Acquires 100% of the Brunswick Belt in the Bathurst Mining Camp
April 20, 2017
Acquires 4 historical
deposits in BMC
May 25, 2017
Acquires 12 zinc
properties in QC
June 26, 2017
Name change to Osisko
Metals and 3:1 share
consolidation
July 18, 2017
Closes $17.25 M Bought
Deal and $11.5
million Non-
Brokered PP
September 11, 2017
Begins aggressive
50,000 metre drill program in Bathurst Mining Camp
September 20, 2017
Closes $8 Million Bought
Deal Flow Through
Financing
October 12, 2017
Announces Royalty deal on the BMC with Osisko
Gold Royalties
December 18, 2017
Announces friendly
takeover of Pine Point
Mining
First Year Milestones: Consolidated 2 Most Important
Canadian Zinc Camps and Raised $41M
4

$0
$2
$4
$6
$8
$10
2004 2005 2006 2007 2008 2009 2010 2011 2012 2013 2014 2015 2016 2017
In C
$ B
illio
ns
OVER THE YEARS, OSISKO AND ITS ASSOCIATES HAVE GENERATED OVER $9 BILLION OF VALUE
EXPERIENCED MANAGEMENT
TEAM
STRONG TECHNICAL
TEAM
HISTORY OF VALUECREATION
CREATION OF ACCELERATOR COMPANIES
SALE OF CANADIAN MALARTIC MINE AND SPIN-OUT OF OSISKO GOLD ROYALTIES
ACQUISITION OF VIRGINIA BY OSISKO GOLD ROYALTIES
1ST SALE OF VIRGINIA
SUCCESFUL DEVELOPMENT, CONSTRUCTION AND FINANCING OF THE CANADIAN MALARTIC GOLD MINE
ACQUISITION OF ORION MINE FINANCE ROYALTY PORTFOLIO BY OSISKO GOLD ROYALTIES
Osisko Group’s Track record of creating shareholder value
5

6
As at February 26, 2018
Closing price . . . . . . . . . . . . . . $0.72
52 week low/high . . . . . ..$0.27-$1.74
Market Cap . . . . . . . . . .. . . .$81.9M
Approximate cash position . . $35M
Analyst Coverage
Macquarie Capital Markets – Matt Murphy
Strong Shareholder Support
Important Shareholders
Osisko Gold Royalties and Osisko Mining. . . . . .
Renvest Mercantile Bancorp . . . . . . . . . . . . . . . .
M&G Investment Management . . . . . . . . . . . . .
JP Morgan Asset Management (UK). . . . . . . . . . .
Blackrock Investment Management (UK) . . . . . . .
Zebra Holdings and Investments S.a.r.l. . . . . . . . .
Caisse de depot et placement du Quebec . . . . . .
Management & Insiders . . . . . . . . . . . . . . . . . .
Total . . . . . . . . . . . . . . . . . . . . . . . . . . . . . . . . . .
Shares Outstanding
113,721,073
Options
4,850,000
Warrants
27,532,716
Fully Diluted
146,103,789
11.5%
6.2%
5.8%
4.8%
4.4%
3.9%
1.7%
8.2%
46.5%
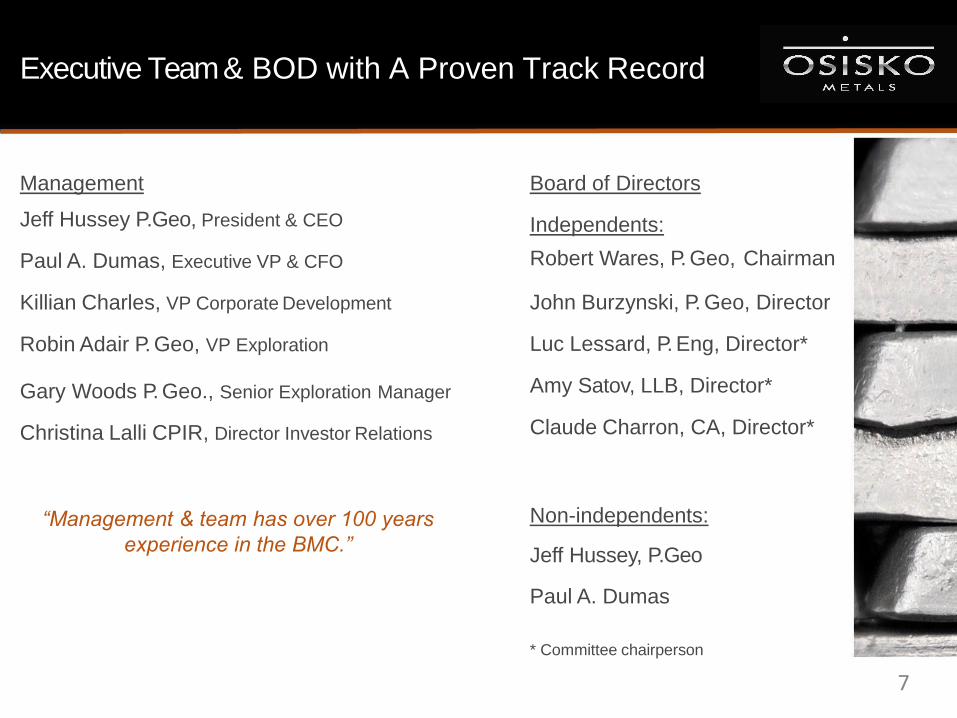
Executive Team & BOD with A Proven Track Record
Management
Jeff Hussey P.Geo, President & CEO
Paul A. Dumas, Executive VP & CFO
Killian Charles, VP Corporate Development
Robin Adair P. Geo, VP Exploration
Gary Woods P. Geo., Senior Exploration Manager
Christina Lalli CPIR, Director Investor Relations
Board of Directors
Independents:
Robert Wares, P. Geo, Chairman
John Burzynski, P. Geo, Director
Luc Lessard, P. Eng, Director*
Amy Satov, LLB, Director*
Claude Charron, CA, Director*
Non-independents:
Jeff Hussey, P.Geo
Paul A. Dumas
* Committee chairperson
7
“Management & team has over 100 years
experience in the BMC.”

Zinc Price vs Refined Zinc Inventory (2010-current)
Source: Macquarie, February 27, 2018.
Supply Crunch Already Impacting Global Zinc Inventories
• Refined zinc metal inventory at multi-decade low.
• Zinc price has doubled since 2016 and is expected to remain elevated. 8
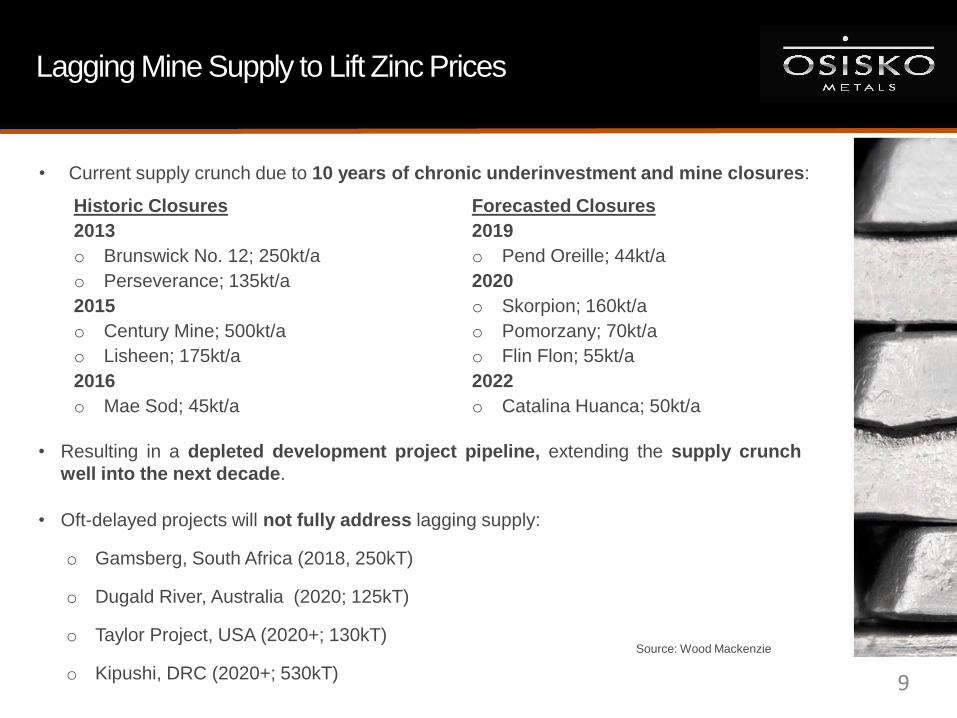
Lagging Mine Supply to Lift Zinc Prices
• Resulting in a depleted development project pipeline, extending the supply crunch
well into the next decade.
• Oft-delayed projects will not fully address lagging supply:
o Gamsberg, South Africa (2018, 250kT)
o Dugald River, Australia (2020; 125kT)
o Taylor Project, USA (2020+; 130kT)
o Kipushi, DRC (2020+; 530kT)
Historic Closures
2013
o Brunswick No. 12; 250kt/a
o Perseverance; 135kt/a
2015
o Century Mine; 500kt/a
o Lisheen; 175kt/a
2016
o Mae Sod; 45kt/a
Forecasted Closures
2019
o Pend Oreille; 44kt/a
2020
o Skorpion; 160kt/a
o Pomorzany; 70kt/a
o Flin Flon; 55kt/a
2022
o Catalina Huanca; 50kt/a
Source: Wood Mackenzie
• Current supply crunch due to 10 years of chronic underinvestment and mine closures:
9

10
Construction, Infrastructure and New Applications
Driving the Demand for Zinc
• Global infrastructure projects and urbanization of populations continue to drive the need for zinc in
China & India.
• New applications such as zinc-based battery systems for grid-scale energy storage may continue to
put pressure on supply.

11
The Pine Point Camp

Highly Beneficial to Osisko Metals’ Shareholders
• The Pine Point Camp was Canada’s most profitable zinc producer between 1964-1988,
operated by Cominco.
• Past production of 64 million tonnes grading 7.0% zinc and 3.1% lead from 50 open-pit
deposits; shut down due to low commodity prices and corporate refocus.
• 46 undeveloped historical deposits across the property that were not included in 2017 PEA;
offers strong potential to increase tonnage and grade in future economic studies.
• Excellent metallurgy producing a premier blending product of high quality zinc and lead
concentrates with very low impurities.
• Potential to rapidly permit and advance engineering studies for project financing.
• Offers Osisko Metals important re-evaluation potential as a diversified explorer and developer in
the base metals space.
12

Historical Resources offer OM Significant Re-rating
Potential
Zn
(%)
Pb
(%)
Indicated – Prismatic 7.3 7.3% 3.6%
Indicated – Prismatic Open Pit 8.4 4.5% 2.8%
Indicated – Tabular Open Pit 13.9 4.2% 1.3%
Indicated – Underground 3.8 7.6% 2.9%
Inferred – Prismatic Open Pit 5.4 3.2% 1.1%
Inferred – Tabular Open Pit 23.0 2.8% 0.8%
Inferred – Underground 9.0 4.1% 1.2%
Grand Total Historical Resource 70.8 4.2% 1.6%
Grade
Resource TypeTonnes
(M)
6.5 Billion Pounds of Zinc
2.5 Billion Pounds of Lead
1. Some of these resources are historical estimates and should not be relied upon. These estimates may not be National Instrument 43-101 (“NI 43-101”)
compliant. Qualified person has not done sufficient work to classify the historical estimates as current mineral resources as defined by NI43-101. 13

14
2017 JDS Preliminary Economic Assessment
• Mine plan: 10 open pit deposits
• Conventional processing
methods: crushing, dense media
separation, grinding and
conventional flotation
• Clean concentrates: impurities
are below penalty levels
• Strip ratio: 4:1 waste to ore
• Recoveries: 88% Zn, 85% Pb*
• Concentrate Grades:
Zn Conc = 59%, Pb Conc = 65%
* Lower in deposit N-204
Pre-Production (C$M) $154
Sustaining Capex (C$M) $117
Mine Output (tpd) 4,000 – 6,800
Mill Throughput (tpd) 1,800
M&I / Grade (MT / %)25.8 / 2.9% Zn, 1.1%
Pb
Inferred / Grade (MT / %)3.7 / 2.9% Zn, 0.8%
Pb
Mine Life (Years) 13
After-Tax NPV8% / IRR (C$M) / (%) $211 / 35%
Zn – Pb Price (US$/lb) $1.10 – $1.00
Exchange Rate (CAD:USD) 0.75
Multiple opportunities for upside from 2017 JDS PEA; higher recoveries, higher
grade historical deposits & exploration upside.

15
Focus on Operational Flexibility at Cluster
Deposits 1
• Near the electrical sub-station and former
concentrator.
• Typically near surface, dry and higher
grade than resource in PEA.
• Potential to streamline permitting timeline.
• Historical drilling was typically shallow.
• Potential for airborne gravity gradiometry
along the trends and at depth.

16
Aggressive 50,000 metre drill program underway
• Large scale confirmation
drilling campaign planned
throughout 2018 to
support advanced
economic studies.
• Confirmation drilling will
prioritize large higher
grade deposits.
• Strong potential to
increase tonnage and
grade in future studies.
Tonnage Lead Zinc Pb+Zn Tonnage Lead Zinc Pb+Zn
t % % % t % % %
L-30 248,400 1.10 6.10 7.20
L-36 1,598,840 1.50 4.10 5.60 1,222,400 1.50 2.40 3.90
L-35 221,550 5.20 6.90 12.10
K-35 666,280 1.30 3.90 5.20 1,935,800 0.50 2.90 3.40
K-32 207,450 2.90 5.20 8.10 759,900 0.50 2.00 2.50
M-40 376,680 1.40 5.50 6.90 1,384,500 1.10 5.40 6.50
K-48 492,300 1.20 2.40 3.60
K-51 154,500 1.10 4.40 5.50
K-66 564,600 0.80 3.70 4.50
M-48 256,360 2.10 4.10 6.20
N-99 814,600 1.20 3.90 5.10
R-67 372,150 3.00 9.70 12.70
V-46 522,000 3.01 5.51 8.52
V-90 478,700 0.70 2.80 3.50
X-58 690,600 0.90 3.70 4.60
X-59 337,800 2.10 5.40 7.50
X-61 475,060 2.80 5.10 7.90
X-64 152,500 3.60 6.90 10.50
X-71 303,050 7.10 11.20 18.30
W-19 141,000 0.44 5.90 6.34
Z-60 367,760 0.80 4.90 5.70
Total 5,815,180 2.29 5.43 7.72 8,929,600 0.97 3.50 4.47
Indicated Inferred
Deposit
Some of these resources are historical estimates and should not be relied upon. These estimates may not be National Instrument 43-101 (“NI 43-101”) compliant. Qualified person has not done sufficient work to classify the historical estimates as current mineral resources as defined by NI 43-101.

17
Excellent High Grade Concentrates
High quality lead and zinc concentrates:
• Zinc (58-60%) & lead (65+%)
• Low iron, silica and manganese
• Below detectable limit for:
o Mercury
o Arsenic
o Antimony
• Magnesium & Cadmium comparable to
world class concentrates
Pine Point concentrate was a premiere
blending product due to negligible deleterious
elemental content.
Pb Conc Zn Conc Pb Conc Zn Conc
Lead % 71.3 0.81 63.4 0.78
Zinc % 1.81 60 3.42 61.4
Copper % 0.013 0.038 0.019 0.014
Iron % 2.24 1.42 3.42 2.09
Arsenic % <0.001 <0.001 <0.001 <0.001
Tin % <0.002 0.006 <0.002 <0.002
Bismuth g/t <20 <20 <20 <20
Cadmium g/t 39 930 59 1,000
Cobalt g/t <10 <10 <8 <8
Indium g/t <200 <200 <200 <200
Aluminium g/t 530 5,700 470 5,500
Calcium g/t 6,600 5,500 5,300 7,500
Magnesium g/t 2,700 2,600 840 4,100
Manganese g/t <20 45 <20 22
Silica g/t 970 1,700 1,500 2,800
Titanium g/t 38 28 18 120
Gallium g/t 2.1 22 <4 16
Germanium g/t <4 130 <4 53
Selenium g/t <10 <10 <25 <25
Carbon % 2.23 0.43 0.47 0.41
Sulphur % 17.3 30.7 26.2 30.7
Chlorine g/t 88 554 <100 <1,000
Fluorine g/t <0.01 <0.01 <0.01 <0.01
Mercury g/t <0.3 <0.3 <0.3 <0.3
Antimony g/t <10 <10 <20 <40
Gold g/t 0.06 0.03 0.03 <0.02
Silver g/t <0.5 <0.5 <0.5 <0.5
Element
Test 22-23
Assays
Data from LCT no. 5
Assays
18
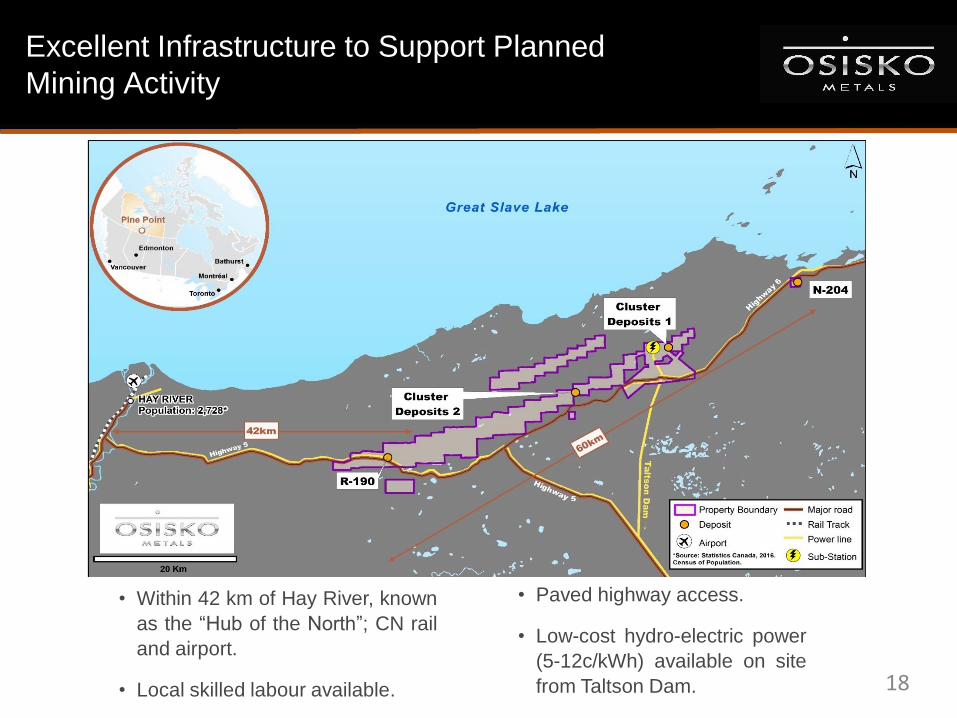
Excellent Infrastructure to Support Planned
Mining Activity
• Paved highway access.
• Low-cost hydro-electric power
(5-12c/kWh) available on site
from Taltson Dam.
• Within 42 km of Hay River, known
as the “Hub of the North”; CN rail
and airport.
• Local skilled labour available.
19
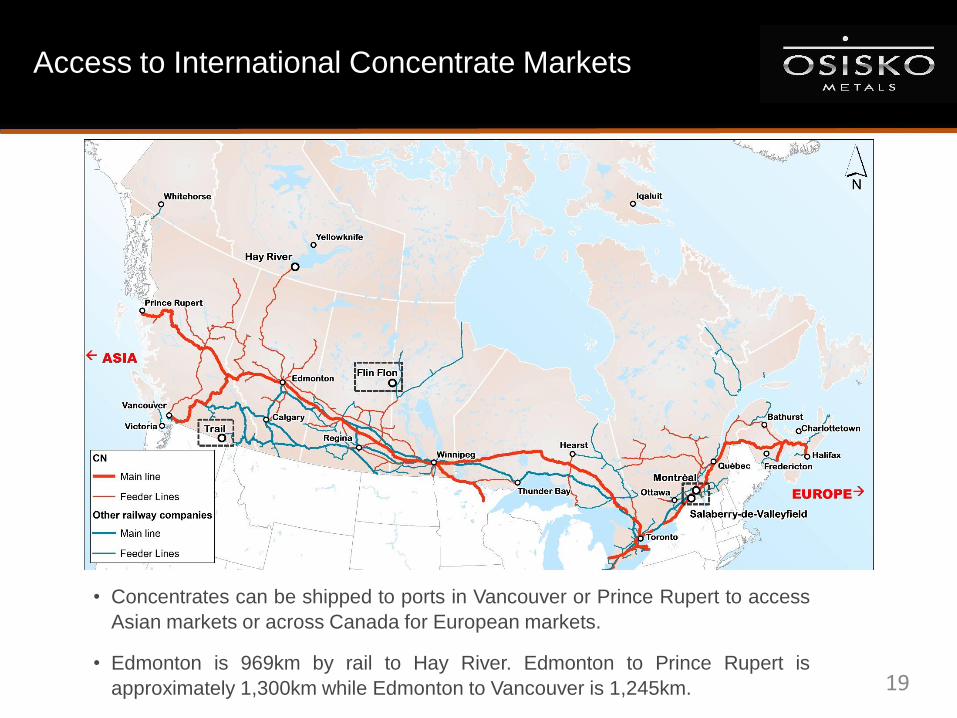
Access to International Concentrate Markets
• Concentrates can be shipped to ports in Vancouver or Prince Rupert to access
Asian markets or across Canada for European markets.
• Edmonton is 969km by rail to Hay River. Edmonton to Prince Rupert is
approximately 1,300km while Edmonton to Vancouver is 1,245km.

20
The Bathurst Mining Camp

Bathurst Mining Camp; Canada’s largest zinc camp
• Consolidated over 63,000 hectares in the 3rd largest VMS camp in the world.
• Claims acquired cover majority of the Brunswick Belt, which hosted both the former Brunswick
No.12 and No.6 mines (>136.6Mt @ 8.74% Zn, 3.44% Pb, 0.37% Cu, 102.2 g/t Ag; 1964-2013).
• Aggressive $10M budget, 50,000 metre drill program underway to upgrade and expand
historical resources and explore untested targets.
• An airborne gravity survey will also be completed in order to identify other areas of potential
on the property,
• Particular focus on the historical Key Anacon deposit that hosts a non-compliant resource
containing 1.87Mt grading 6.93% Zn, 2.63% Pb, 0.16% Cu and 84g/t Ag.
21

22Source of historical resources is the New Brunswick Government Mineral Deposits database. A QP has not done sufficient work to classify the historical estimates as current mineral resources. Osisko Metals is not treating the historical estimates as current mineral resources. Please refer to page 2 for important information in respect of this historical estimate.
Phase 1, 50,000 metre drill programFocused on upgrading historical deposits

23
Key Anacon Historical Deposit
• Hosted within the favorable Brunswick Horizon
with strong alteration and folding typically
associated to major deposits in the BMC.
• Contains 1.87Mt grading 6.93% Zn, 2.63% Pb,
0.16% Cu and 84g/t Ag.
• Considerable exploration potential along strike
and below 400 metres depth.
• Minimum of 12,000 metres of drilling planned in
2018 for the Main Zone and the East Zone.
Key Anacon East
• Located 1.5km along strike to the northeast.
• Previous operators reported 19.9 metres grading
7.68% Zn, 3.58% Pb, 0.33% Cu and 78 Ag/t.
• Drilling at Key Anacon East was never
incorporated into historical Key Anacon
resource estimate.
Source of historical resources is the New Brunswick Government Mineral Deposits database. A QP has not done sufficient work to classify the historical estimates as current mineral resources. Osisko Metals is not treating the historical estimates as current mineral resources. Please refer to page 2 for important information in respect of this historical estimate.
Aggressive Exploration Program at Key Anacon and
Key Anacon East

24
Open Along Strike and Dip
25
c
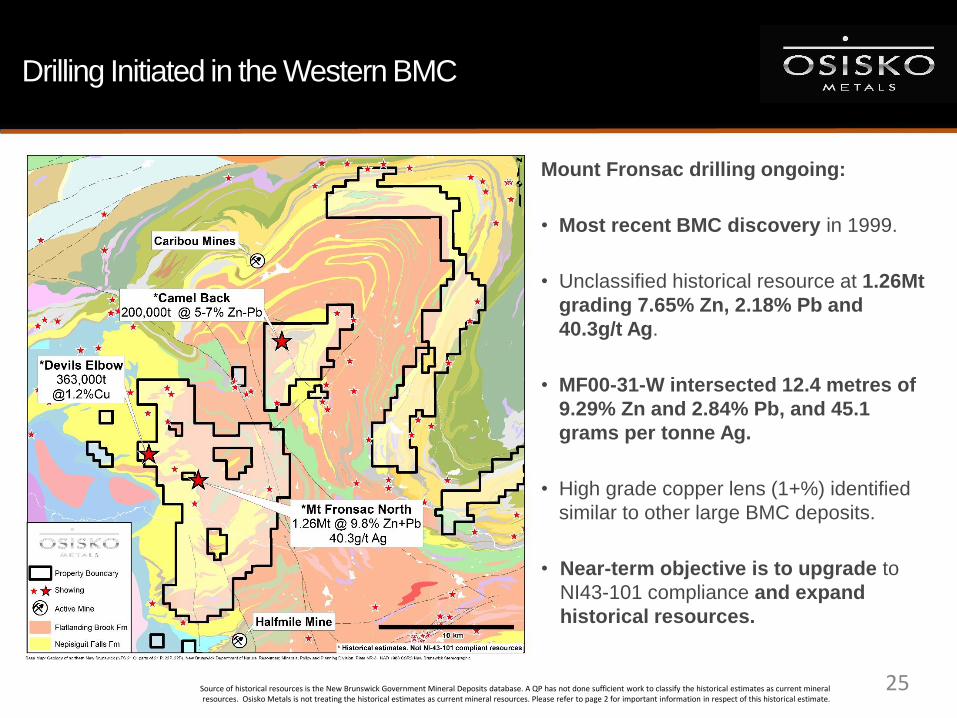
Mount Fronsac drilling ongoing:
• Most recent BMC discovery in 1999.
• Unclassified historical resource at 1.26Mt
grading 7.65% Zn, 2.18% Pb and
40.3g/t Ag.
• MF00-31-W intersected 12.4 metres of
9.29% Zn and 2.84% Pb, and 45.1
grams per tonne Ag.
• High grade copper lens (1+%) identified
similar to other large BMC deposits.
• Near-term objective is to upgrade to
NI43-101 compliance and expand
historical resources.
Drilling Initiated in the Western BMC
Source of historical resources is the New Brunswick Government Mineral Deposits database. A QP has not done sufficient work to classify the historical estimates as current mineral resources. Osisko Metals is not treating the historical estimates as current mineral resources. Please refer to page 2 for important information in respect of this historical estimate.

26
c
Drilling to Target Resource Expansion Along Strike
Mineralized zones in
historical resource
Large untested areas2km

27
BMC Has All Necessary Infrastructure
c
• Electricity, roads and rail.
• Deep Water port facility at
Belledune
• Glencore’s lead/silver
smelter.
• Montreal:
Canadian Copper Refinery
and Canadian Electrolytic
Zinc.

Grass Roots Exploration in Québec
Source of historical resources is the Ministère de l'Énergie et des Ressources Naturelles du Quebec (MERN & SIGEOM) databases. A QP has not
done sufficient work to classify the historical estimates as current mineral resources. Osisko Metals is not treating the historical estimates as current
mineral resources. Please refer to page 2 for important information in respect of this historical estimate.
c
• Total land package: 42,800 hectares
• Model-driven acquisitions covering 12 targets comprising four
classic zinc environments (VMS, MVT, SEDEX & SKARN).
• Plan to selectively advance projects based on exploration
results.
Highlights include:
Schefferville (SEDEX)
• Largest surficial zinc lake sediment anomaly area in
Eastern Canada (60 x 10 km)
Montauban (BROKEN HILL)
• 9 showings with grabs up to 17.1% Zn
Normétal Sud (SEDEX/VMS)
• 6 showings with grabs up to 10.2% Zn
28

• Constant news flow from combined 100,000 metre drill program at both camps.
• Increasing drill rig count in the BMC camp:
o Continuing to generate targets and upgrade and expand historical deposits;
o Increasing focus on the Key Anacon Deposit.
• Drills turning at Pine Point Camp:
o Drilling to rapidly confirm, upgrade and expand the portfolio of over 40 historical deposits;
o Working toward a new PEA.
• Focusing on Schefferville, Normétal and Montauban, Quebec GenEx projects.
• Backed by highly technical teams from the Osisko Group.
• Ability to aggressively move BMC & Pine Point camps forward.
• Well capitalized over the next two years to fund both camps’ drill programs.
Why invest in Osisko Metals?
29

Contacts
1100, av. des Canadiens-de-Montréal
Suite 300
Montreal, Qc, H3B 2S2
Tel: 514-940-0670 Fax: 514-861-1333
Investors and General Inquiries:
30