PowerPoint Presentation · More on this analysis can be viewed in the poster presentation at the...
26
LTC ICAR Webinar Nebraska Infection Control Assessment and Promotion Program Data Analysis November 2017 2 4 9 5 Miles Traveled to Date 0
-
Upload
hoangnguyet -
Category
Documents
-
view
219 -
download
4
Transcript of PowerPoint Presentation · More on this analysis can be viewed in the poster presentation at the...

LTC ICAR WebinarNebraska Infection Control Assessment
and Promotion ProgramData Analysis
November 2017
2 4 9 5Miles Traveled to Date
0

Overview• Nebraska ICAP- Team Overview
• Data Cycle
• Mitigation Strategies

in a nutshell• Over 100 facility visits
• Just about 25,000 miles traveled
• Visited facilities in 52 of Nebraska’s 93 counties
ICAP

Our Program Structure• Peer to Peer Feedback
Model with subject matter experts providing evidence-based recommendations tailored to the individual and statewide need of the facilities.
• Based on State Health Department and Academia partnership.
• Would not have been possible without the active support and involvement of the State HAI team alongside Nebraska ICAP team

NE-ICAP Data Cycle
Gather
Organize
Analyze
Utilize (Act)

NE-ICAP Data Gathering
• CDC Infection Control Assessment Tool
• Facility Rounds
• Focused Observations
• Environmental Cleaning
• Assisted blood glucose monitoring
• Hand Hygiene
• Indwelling Urinary Catheter Care

Retrieving ICAR Assessment Data

What do all those columns mean?

Objectives of Data Organization
• Better data visualization
• Compiling data from various sources
• Alignment to help with Analyses
• Making it easier to create sub-groups as needed for various analyses

Example of Organization

Data Analysis
• Team Activity
• Helps to identify trends
• Assists in prioritizing mitigation strategies

• Understand all the variables, how they are collected, what outcomes are of interests etc.
Know the data
• Start with simple analysis (for example calculating individual gap frequencies) and identify patterns
Initiate Simple Analysis
• Think about what factors may have contributed to particular gaps or patterns and develop a hypothesis
Hypothesize relationships
NE-ICAP Steps for Data Analysis
Analyze relationships
• Run statistical analysis to test the hypothesis and look for significant associations

Studying Overall Gap Frequencies and Performance of Individual Facilities
Used these columns to calculate gap frequencies
Used these rows to find out overall performance of
individual LTCF

Factors That We Considered May Be Associated With The Facility Performance or Presence of Gaps
We hypothesized that facilities with more best practice recommendations in place will more likely to have hospital affiliation, a trained IP, higher median bed
size and more weekly IP hours dedicated to IC activities as compared to those facilities with less best practice recommendations in place

Factors Associated with LTCF with < or > 80% of the 26 BPR in Place Related to infection control infrastructure, Surveillance and Safety
More on this data analysis can be found on the poster at this link: https://icap.nebraskamed.com/wp-content/uploads/sites/2/2017/11/Fitzgerald-IDWeek-IP-gaps-in-LTC-9.25.17.pdf

Impact of trained IP on those BPR that were not in place in at least 20% LTCF

Hand Hygiene Compliance in LTCF
More on this analysis can be viewed in the poster presentation at the following link: https://icap.nebraskamed.com/wp-content/uploads/sites/2/2017/11/HH-LTCF-Tyner-1322-IDWeek-2017.pdf
Utilizing the Data to Drive Mitigation
• Nebraska ICAP provides evidence based recommendations for gap mitigation to all facilities that we visit (prioritized to their needs) via individual letters in addition to the on-site coaching.
• Data Analyses allows us to prioritize statewide or large scale mitigation.
• Examples include development of :
• LTCF Infection Control Certificate Training Program with gap incorporation
• Practice Briefs• Policy/ Protocol Templates• Websites for widespread dissemination of information

IP Training Course
https://www.clarksoncollege.edu//index.cfm/academics/professional-development/courses/primary-infection-prevention-courses/
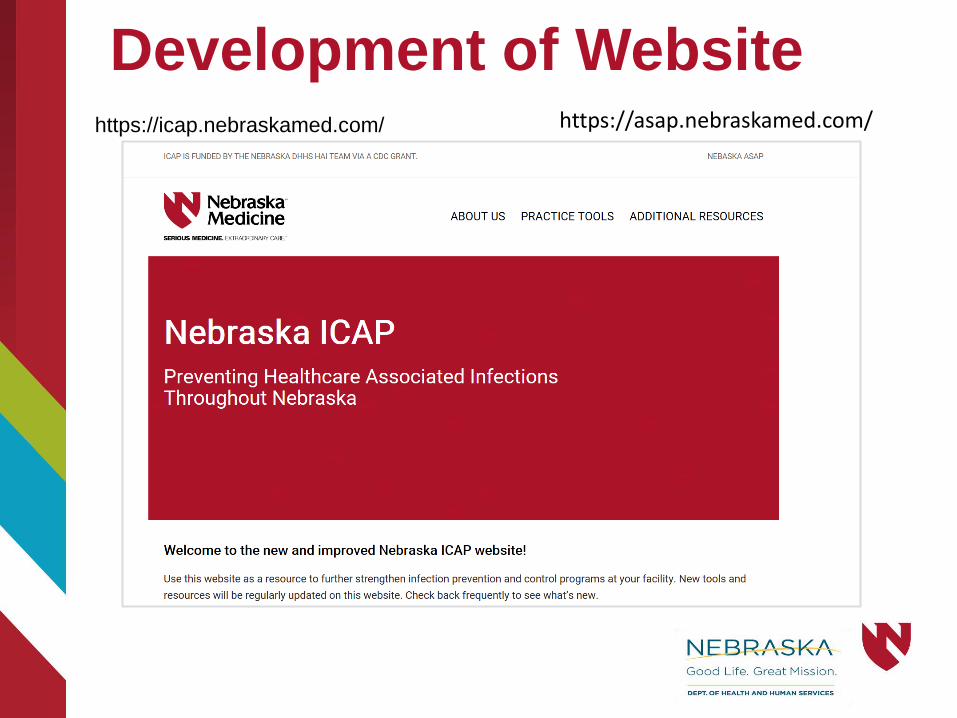
Development of Websitehttps://icap.nebraskamed.com/ https://asap.nebraskamed.com/

Example of a Practice Brief
https://icap.nebraskamed.com/wp-content/uploads/sites/2/2017/09/Practice-Briefs-TB-Prevention-and-Control-Plan-7.25.17.pdf

Policy Template
https://icap.nebraskamed.com/wp-content/uploads/sites/2/2017/11/Safe-Injection-Policy-Template-revised.pdf

•Start thinking very early about what is the best way to record the mitigation delivery process, its uptake and its impact in order to be ready to measure change
Plan Early
•Think about all the variables that will need to be recorded to know the baseline and to measure change.
•Also identify variables that need to be studied for associations or that can be confounders and record them too
Describe Variables
•Design a database to record all those variables in a manner that can facilitate the process of analysis.
•Consider involving a data analyst or statistician to facilitate this process
Develop Database
Gather Data
The Cycle Goes On: NE-ICAP Steps To Measure Change
•Keep recording the data in the database during the intervention process
•Follow the Data Cycle all over again

Example of Measuring Impact of Mitigation Strategies

Check out the data!
https://icap.nebraskamed.com/about-us/publications-and-presentations/