PowerPoint Presentation Guidelines
11
PowerPoint Presentation Guidelines In the following 11 slides we present guidelines and suggestions for the use of fonts and colors when preparing PowerPoint Presentations for Colloquia and Webcasts. In order for your presentation to fit on most, if not all screens, text and images should be placed within 95% of the PowerPoint slide size. The “action safe” area is seen in the next slide. 1
-
Upload
joelle-gillespie -
Category
Documents
-
view
46 -
download
3
description
PowerPoint Presentation Guidelines. In the following 11 slides we present guidelines and suggestions for the use of fonts and colors when preparing PowerPoint Presentations for Colloquia and Webcasts. In order for your presentation to fit on most, if - PowerPoint PPT Presentation
Transcript of PowerPoint Presentation Guidelines

PowerPoint Presentation Guidelines
In the following 11 slides we present guidelinesand suggestions for the use of fonts and colorswhen preparing PowerPoint Presentations forColloquia and Webcasts.
In order for your presentation to fit on most, ifnot all screens, text and images should beplaced within 95% of the PowerPoint slide size.The “action safe” area is seen in the next slide.
1


This is a good title size.Verdana 40 point.
This is a good subtitle or bullet point size.
Verdana 36 point.
This is about as small as you want to go for content. Verdana 24 point.
This font size is not recommended for content. Verdana 12 point.
3
FONTS: The larger, the better. Remember, you want your points tobe readable even at the back of the venue. Limit your points to oneor two sentences - the audience has come to see your presentation,not read a novel!
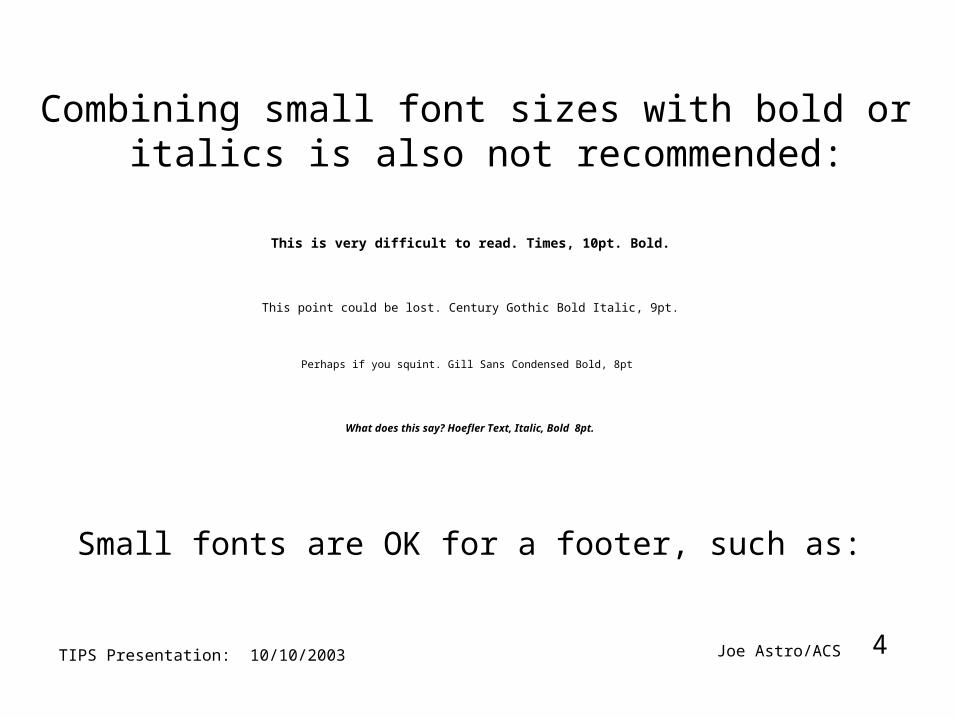
This is very difficult to read. Times, 10pt. Bold.
Combining small font sizes with bold or italics is also not recommended:
This point could be lost. Century Gothic Bold Italic, 9pt.
Perhaps if you squint. Gill Sans Condensed Bold, 8pt
What does this say? Hoefler Text, Italic, Bold 8pt.
4
Small fonts are OK for a footer, such as:
TIPS Presentation: 10/10/2003 Joe Astro/ACS

This is a good mix of colors. Readable!
Fonts and Background Colors Remember: Readability! Readability! Readability!
This is a bad mix of colors. Low contrast.Unreadable!
This is a good mix of colors. Readable!
This is a bad mix of colors. Avoid brightcolors on white.Unreadable!
5
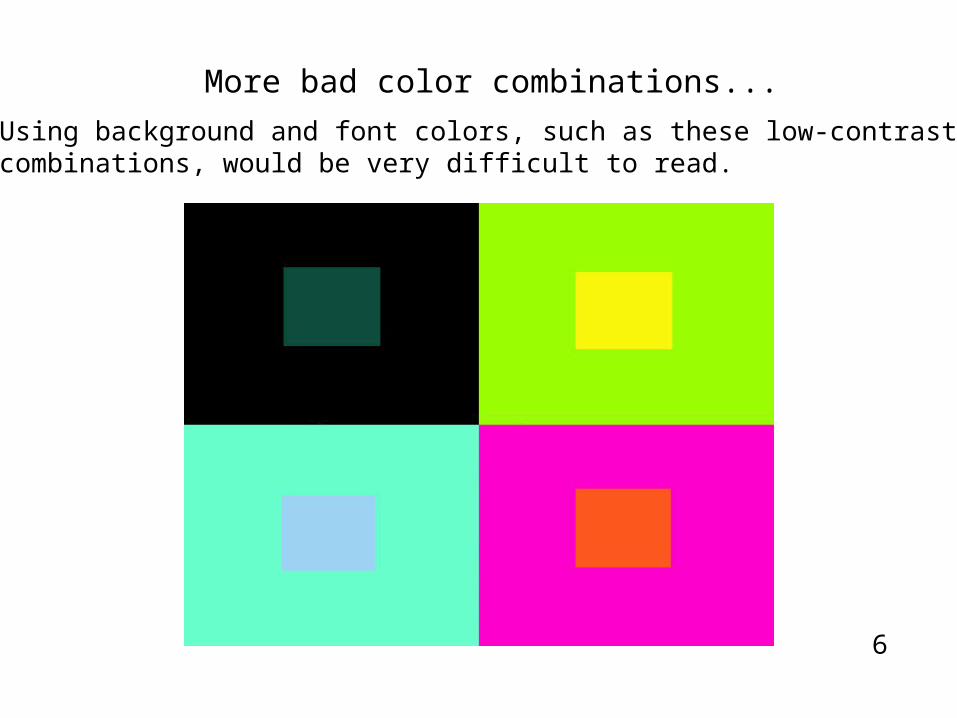
More bad color combinations...
6
Using background and font colors, such as these low-contrastcombinations, would be very difficult to read.
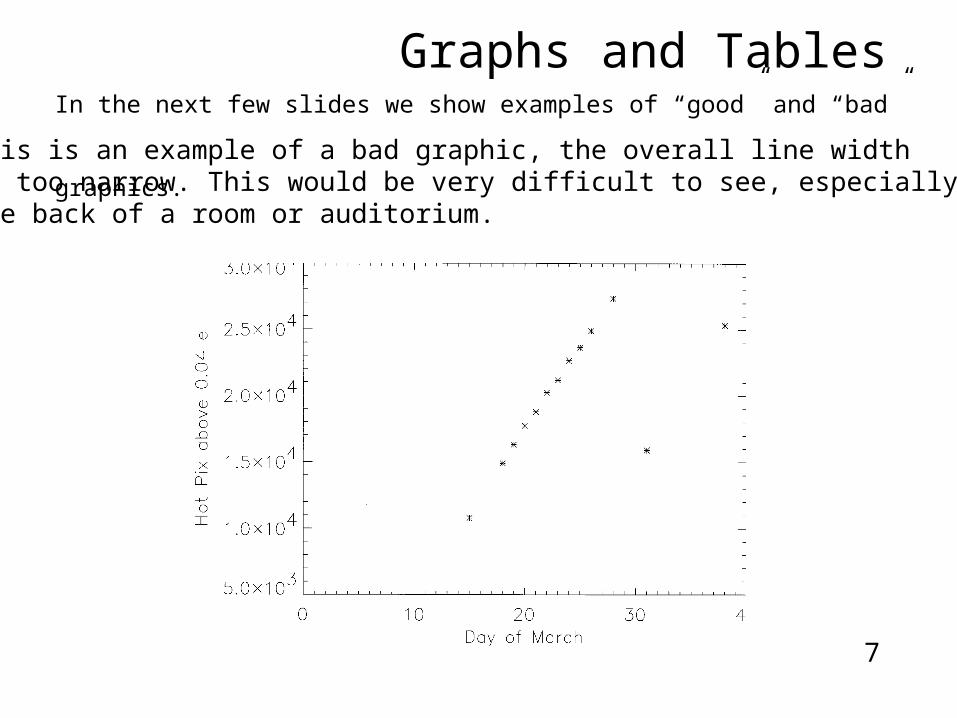
Graphs and Tables
In the next few slides we show examples of “good” and “bad” graphics. This is an example of a bad graphic, the overall line widthis too narrow. This would be very difficult to see, especially inthe back of a room or auditorium.
7
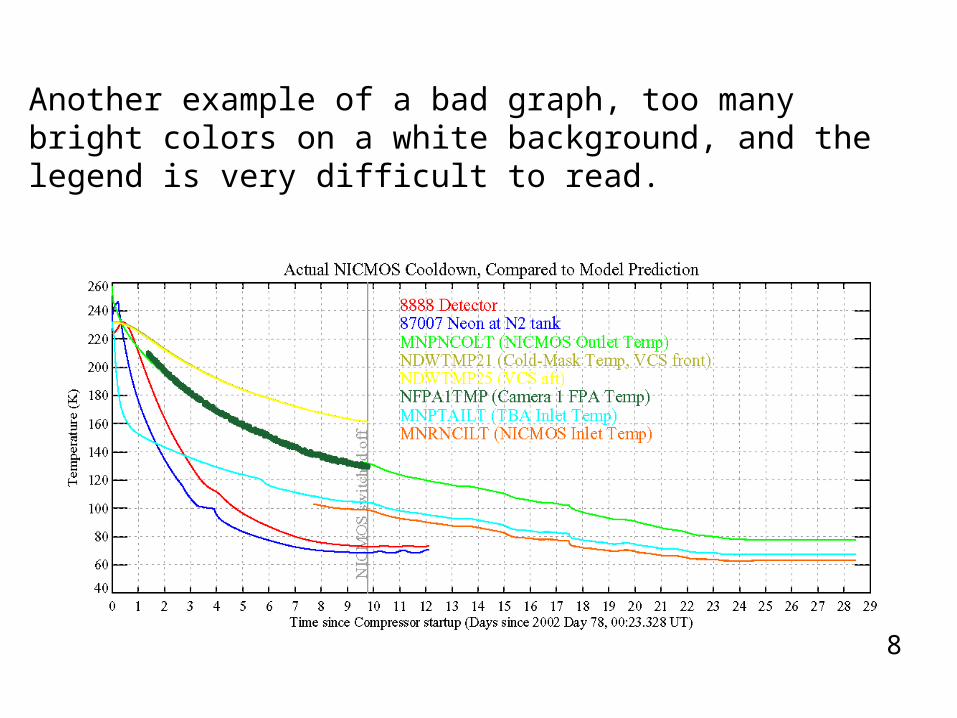
Another example of a bad graph, too manybright colors on a white background, and thelegend is very difficult to read.
8
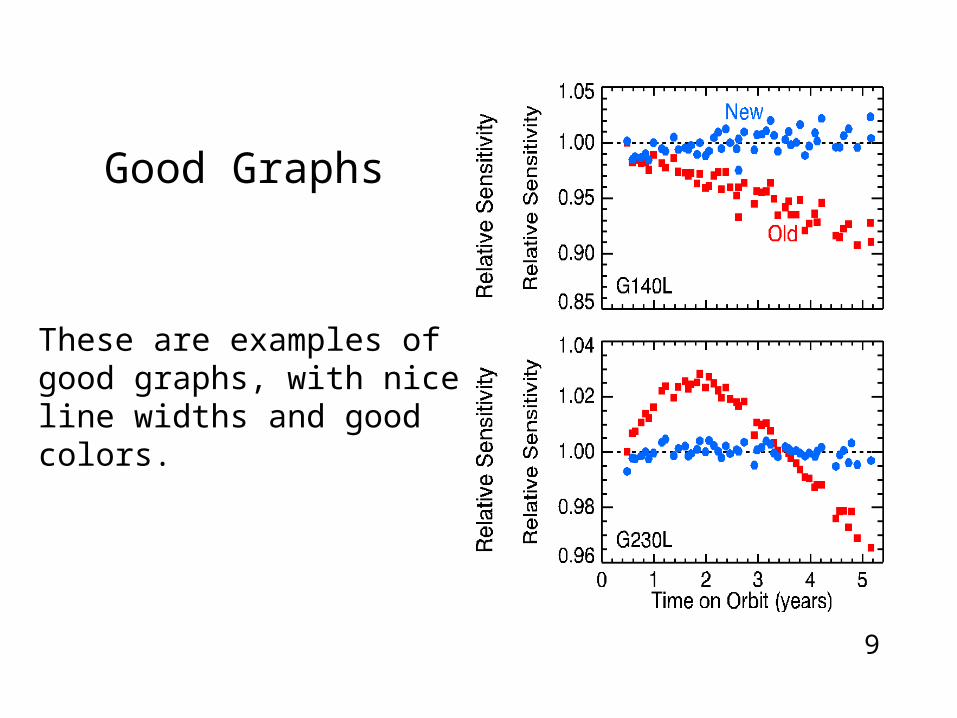
These are examples ofgood graphs, with niceline widths and goodcolors.
9
Good Graphs
A bad table, too much information inin unreadable format.
10

EROs begin, flats, thermal background1315/10 Sat
Final focus update, GO science enabled1375/16 Fri
DQE test visit 4; Stop darks1265/06 Mon
Final temperature set point (TBD)1295/08 Thu
5/04 Sat
5/03 Fri
5/02 Thu
4/30 Tue
4/29 Mon
4/26 Fri
4/23 Tue
4/22 Mon
4/19 Fri
DQE test visit 3; Control temp +0.5 K (TBD)124
Filter wheel test complete; Focus sweep, FOM test123
DQE test visit 2; Control temp –1.0 K 122
DQE test visit 1; Control temp +0.5 K 120
Begin darks every 3rd orbit119
Increase control temperature to allow for +2 K variations 116
Return to Ne control, Filter wheel test begins113
Change to mounting cup control112
NICMOS restarted, Ne-loop control continues109
This is a good, readable table. Tables, especiallylarge ones, should be placed on a separate slide.
11