PowerPoint Presentation · Continue building database in MineSight to assist in improving Mine Plan...
33
July 2018 GOLD PRODUCTION IN SHANDONG, CHINA
Transcript of PowerPoint Presentation · Continue building database in MineSight to assist in improving Mine Plan...

July 2018
GOLD PRODUCTION IN SHANDONG, CHINA

Songjiagou Project - Location
2
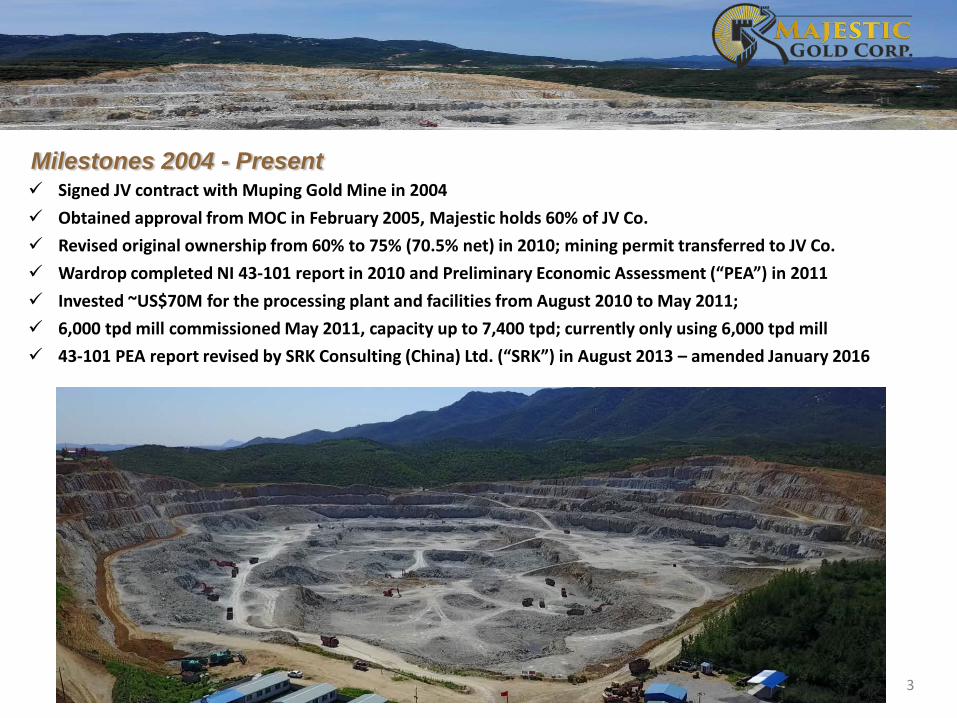
Milestones 2004 - Present Signed JV contract with Muping Gold Mine in 2004 Obtained approval from MOC in February 2005, Majestic holds 60% of JV Co. Revised original ownership from 60% to 75% (70.5% net) in 2010; mining permit transferred to JV Co. Wardrop completed NI 43-101 report in 2010 and Preliminary Economic Assessment (“PEA”) in 2011 Invested ~US$70M for the processing plant and facilities from August 2010 to May 2011; 6,000 tpd mill commissioned May 2011, capacity up to 7,400 tpd; currently only using 6,000 tpd mill 43-101 PEA report revised by SRK Consulting (China) Ltd. (“SRK”) in August 2013 – amended January 2016
3

Milestones 2004 - Present Unanimous vote in January 2015 to relocate two villages proximal to pit expansion area; construction of housing
complex for villagers complete by late 2018/early 2019 Gov’t approval of Mining License expansion from 0.342 km² to 0.594 km² in August 2015 LOI in 2014 with Brigade #3 on Jincheng; LOI in 2015 with Baiheng on two U/G projects in Muping-Rushan area Renegotiated mining & milling contract with mining contractor in 2014 and again in 2017 Granted a 0.414 km² under U/G Mining License at Songjiagou North in February 2016; underground
development in this area began later that year; production scheduled for early 2019 Mine-site technical team bolstered by addition of former staff from SRK in Q4 2015, focused on grade control
program, pit optimization, and production of short term mining plans since late 2016
4

Project Resource and Economics• SRK updated resource calculation in January 2013
• Based on a database of 20,836 samples from:
46 surface trenches
77 surface drill holes
104 underground samples (channel samples and drill holes)
NI 43-101 Compliant Resource Estimate within Optimized Open Pit (January 2013)
Category Tonnes Grade Au (g/t) Ounces Au
Open Pit (cut-off 0.30 g/t Au)
Indicated 26,600,000 1.40 1,197,427
Inferred 23,400,000 1.45 1,090,996
Underground (cut-off 0.80 g/t Au)
Inferred 5,600,000 2.56 460,964
The resource estimate is categorized as Indicated and Inferred as defined by the CIM guidelines for resource reporting. Mineral resources do not demonstrate economicviability, and there is no certainty that these mineral resources will be converted into mineable reserves once economic considerations are applied. The Indicated andInferred mineral resource estimate has been prepared in compliance with the standards of NI 43 – 101 by Anshun Xu, Ph.D., F AussIMM.
5

6
Preliminary Economic Assessment• Completed by SRK in August 2013, amended in January 2016• Multiple based on current market capitalization of approximately US$71.4M• Base Case NPV’s based on SRK’s 2013 In-Pit Indicated Resource only, within the original Mining License, containing
747,519 ozs Au @ 1.36 g/t Au After-tax project NPV of US$335M at a 10% discount, based on gold price of US$1,355/oz Sensitivity analysis for 20% reduction in the base-case average gold price, to US$1,084/oz, results in an after-tax
NPV of US$232M• Costs to date at Songjiagou estimated at US$70.95M Exploration, Engineering, and Permitting: US$1.1MMining and Mill Facilities: US$29.6M Tailings Facility/Water System: US$13.02M Land Lease, Purchase, Permits, and Licenses: US$19.34M Village Relocation Program: US$7.89M
*The Company’s production decision was not based on a feasibility study of mineral reserves demonstrating economic and technical viability. TheCompany’s production decision was based on the open pit optimization resource model set out in the Preliminary Economic Assessment (“PEA”),which takes into account the relatively low mining costs negotiated by the Company. The PEA is preliminary in nature, and includes inferred mineralresources that are considered too speculative geologically to have the economic considerations applied to them that would enable them to becategorized as mineral reserves, and there is no certainty that the preliminary economic assessment will be realized. Mineral resources that are notmineral reserves do not have demonstrated economic viability.

7
Preliminary Economic Assessment
Indicated(M tonnes)
Inferred(M tonnes)
Underground(M tonnes)
GoldTotal
(tonnes)
GoldOzs
(million)
Net NPV, (million)
US$@10%
At $1,084/oz
Total resources 37.24 33.93 14.34 85.51 2.75
Case 1 Indicated only 23.25 23.25 335.00 232.00
Case 2 All resources 25.18 18.63 43.81 No village relocation 547.00
Case 3 All resources 35.48 32.10 67.58 Village relocation 742.00
*The Company’s production decision was not based on a feasibility study of mineral reserves demonstrating economic and technical viability.The Company’s production decision was based on the open pit optimization resource model set out in the Preliminary Economic Assessment(“PEA”), which takes into account the relatively low mining costs negotiated by the Company. The PEA is preliminary in nature, and includesinferred mineral resources that are considered too speculative geologically to have the economic considerations applied to them that wouldenable them to be categorized as mineral reserves, and there is no certainty that the preliminary economic assessment will be realized.Mineral resources that are not mineral reserves do not have demonstrated economic viability.
* From SRK PEA technical report Page 14 in January 2016

8
Seven Year Operational Data• Year End 2012 2013 2014 2015 2016 2017 2018Q1 2018Q2• Tonnes mined 2,202,831 1,873,913 1,673,484 1,714,722 1,662,583 1,509,566 441,608 375,129• Tonnes milled 1,950,987 1,872,396 1,578,797 1,628,609 1,619,876 1,578,261 381,911 410,703• Head grade (Au g/t) 0.30 0.37 0.43 0.42 0.49 0.55 0.61 0.64• Mill recovery 83% 87% 89% 88% 90% 93% 95% 96%• Gold produced (ozs) 18,925 19,611 19,488 19,630 22,975 25,363 7,050 8,297• Gold realized, net (ozs) 17,630 18,390 17,986 18,320 21,644 24,206 6,497 7,487• All-in sustaining cost ($/oz sold) N/A $1,609 $1,409 $1,411 $1,174 $850 $756 $719

9
Geology of Project Area• Songjiagou is a mesothermal deposit hosted in a conglomerate in the Laiyang Group Linsishian formation• Mineralization occurs in veins, disseminations, and in stockworks and is visually indistinguishable from wall rocks• Modeling at Songjiagou indicates that higher grade blocks of mineralization occur deeper than current pit depth• Exploration potential exists at depth as well as laterally, within current license boundaries
from SRK Report, August 2013

10
Topographic Map of Songjiagou and surrounding area

11
Block Models • Block modeling used for mine level planning updated using data from blast hole samples
+ 69 metre level and +63 metre level grade distribution

12+57 metre level grade distribution

13
Songjiagou North Underground• Separate 0.411 sq km Mining License immediately north of Songjiagou open pit• Exploration outlined 5 mineralized vein structures on trend with main Songjiagou mine geology• Non-NI 43-101 resource of 120,000 ozs of gold at an average grade of 2.4 g/t in a report by Brigade No.3 in 2013*• Access via a 2,075 m ramp, collared at +80 m elevation down to -160 m elevation. Six levels to be developed off
ramp. Currently, ramp advanced to 1,100 m, with development on levels at elevations +49m, +9m, and -40m• Production scheduled for late 2018/early 2019, at a rate of 300 tonnes per day.
The Company advises that those mineral resource estimates are not supported by a compliant NI 43-101 technical report, contrary to NI 43-101; andfurther advises that the estimates should not be relied on until they have been verified and supported by a compliant technical report.

14
Summary• Large NI 43-101 gold in-pit gold resource with room for expansion
• In production with approvals in place to increase size of open pit within larger Mining License • Plans for 2018-2019:Continue building database in MineSight to assist in improving Mine PlanComplete the village relocation programContinue plans to optimize pit expansion when the two villages have been relocatedContinue underground development at North Zone; scheduled to produce late 2018 to early 2019Continue efforts to secure government permits for long-term site for waste rock disposal SRK Consulting hired to update 43-101 report, including resource update; Songjiagou North to be
included in report.Reclamation work initiated at higher levels of open pit.
• Future Plans:Determine feasibility of increasing mill throughputComplete evaluation of Brigade #3’s neighboring Jincheng Gold Property Similar geological environment as found on Songjiagou Property
Complete evaluation of Baiheng’s two properties, Shuangshantun and XiayucunBoth properties host deep medium-high grade vein hosted gold mineralization Shuangshantun has at least four mineralized veins that are the focus of development; Vein M7
averages deep drill intersections of 31.8 g/t gold over 1.8 m thickness

15
Songjiagou-style Gold Deposits Among World’s Largest• Mesothermal deposits such as Songjiagou are known for their large size and depth extent
• These type deposits represent a major source of world gold production
• Western Australia’s Super Pit (Barrick 50%/Newmont 50% ) ranks among the largest mesothermal deposits in theworld, producing at a rate of 850,000 oz per year
• Two of the largest gold producing regions in Canada (Red Lake and Hemlo) host mesothermal gold deposits thataccount for approximately 50 million ounces of gold production to date
• Considerable exploration potential remains at Songjiagou both laterally and at depth within existing propertyboundaries
• The current development plan includes the mining of higher grade resources at depth within the existing open pitdesign

16
Mine Improvements, New Production Sources to Enhance Long Term Viability of Songjiagou• Commercial production decision for Songjiagou based on a Preliminary Economic Assessment (“PEA”)
• The mine’s performance has largely met PEA expectations with respect to operating rates and gold recovery estimates for the process plant
• Songjiagou has generally operated at a near breakeven basis; cost cutting initiatives implemented in YE 2017 reduced all-in sustaining costs to US$850/oz for the year
Revised mining and milling contracts and improved mill recoveries have also accounted in significant cost reductions
• New production sources are being evaluated that will position Majestic to capitalize on the underutilized milling capacity that is presently available at Songjiagou

17
Gold’s Fundamentals Point to Much Higher Prices• Fundamentals of physical supply and demand remain positive• Global mine output has plateaued with discoveries of new gold deposits at 25-year low• The time required to bring new ore bodies into production continues to lengthen and now stands at nearly 20
years• Physical demand continues to show steady secular growth, primarily in Asia. Consumption by Turkey, India, China,
and Russia alone has exceeded global mine supply since 2013• A new Shariah compliant gold standard approved in December 2016 will expand the variety and use of gold-based
products in Islamic Finance• Gold was recently incorporated as a settlement currency to facilitate trade between oil-producing nations and the
world’s largest hydrocarbon importer• Uncertainty concerning economic policies of the Trump administration, the future of the Euro Zone following the
UK BREXIT, and the rise of right wing political parties in France and Italy point to increased safe haven demand forgold

18
Chinese Demand Seen as Key Driver of Gold Prices
• In 2016, China produced an estimated 490 tonnes of gold - nearly 200 tonnes more than its nearest rival, Australia.• In 2013, China became the world's largest gold market officially consuming 1,132 tonnes. All of Chinese gold output
is said to be consumed internally.• Chinese consumption is currently holding around the 1,000 tonne per year level.• China’s central bank has been buying gold as part of its plan to make the yuan a more international and tradeable
currency. In fact, actual consumption is rumored to be substantially higher than officially reported.• China's production-to-reserves ratios for gold is estimated at 23.5% so the country is depleting its reserves faster
than it can replace them.• Overseas deals by mainland Chinese gold companies in 2015 quadrupled from the year before to US$483 million,
according to data compiled by Bloomberg.• Zijin Mining Group Co., Zhaojin Mining Industry Co. and Shandong Gold Group Co. have led a wave of domestic
consolidation that’s amounted to US$5 billion of takeovers in the past five years.• Shanghai Futures Exchange launched China’s crude oil futures in RMB Yuan on March 26, 2018. Oil producers and
traders well sell crude oil to China and trade RMB Yuan; in accordance with exchange rules, it can convert RMB Yuaninto gold.
19
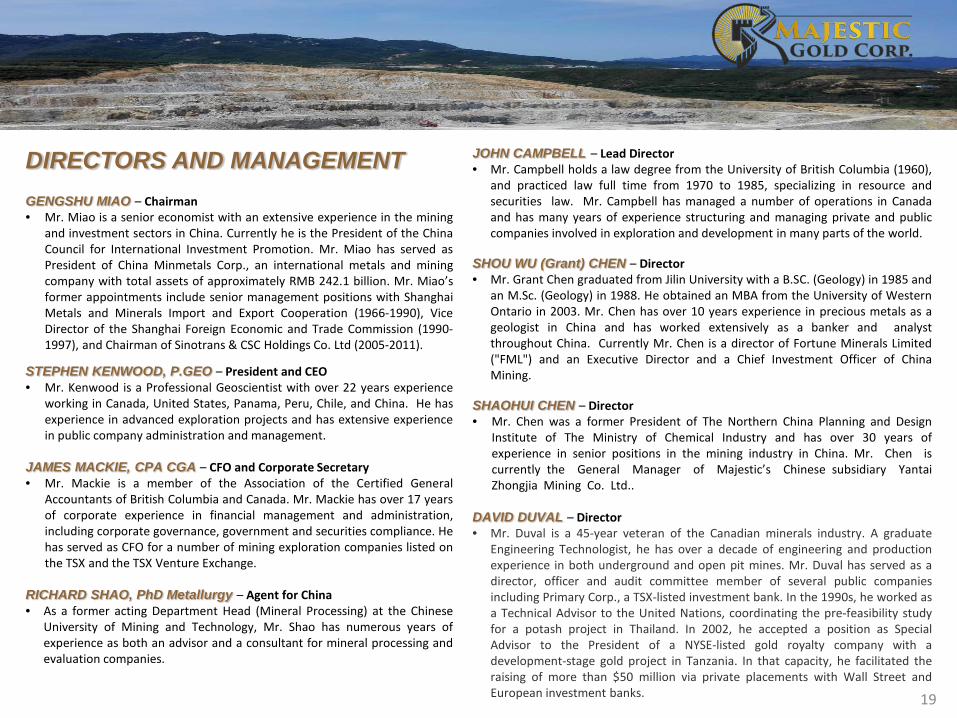
DIRECTORS AND MANAGEMENTGENGSHU MIAO – Chairman• Mr. Miao is a senior economist with an extensive experience in the mining
and investment sectors in China. Currently he is the President of the ChinaCouncil for International Investment Promotion. Mr. Miao has served asPresident of China Minmetals Corp., an international metals and miningcompany with total assets of approximately RMB 242.1 billion. Mr. Miao’sformer appointments include senior management positions with ShanghaiMetals and Minerals Import and Export Cooperation (1966-1990), ViceDirector of the Shanghai Foreign Economic and Trade Commission (1990-1997), and Chairman of Sinotrans & CSC Holdings Co. Ltd (2005-2011).
STEPHEN KENWOOD, P.GEO – President and CEO• Mr. Kenwood is a Professional Geoscientist with over 22 years experience
working in Canada, United States, Panama, Peru, Chile, and China. He hasexperience in advanced exploration projects and has extensive experiencein public company administration and management.
JAMES MACKIE, CPA CGA – CFO and Corporate Secretary• Mr. Mackie is a member of the Association of the Certified General
Accountants of British Columbia and Canada. Mr. Mackie has over 17 yearsof corporate experience in financial management and administration,including corporate governance, government and securities compliance. Hehas served as CFO for a number of mining exploration companies listed onthe TSX and the TSX Venture Exchange.
RICHARD SHAO, PhD Metallurgy – Agent for China • As a former acting Department Head (Mineral Processing) at the Chinese
University of Mining and Technology, Mr. Shao has numerous years ofexperience as both an advisor and a consultant for mineral processing andevaluation companies.
JOHN CAMPBELL – Lead Director• Mr. Campbell holds a law degree from the University of British Columbia (1960),
and practiced law full time from 1970 to 1985, specializing in resource andsecurities law. Mr. Campbell has managed a number of operations in Canadaand has many years of experience structuring and managing private and publiccompanies involved in exploration and development in many parts of the world.
SHOU WU (Grant) CHEN – Director• Mr. Grant Chen graduated from Jilin University with a B.SC. (Geology) in 1985 and
an M.Sc. (Geology) in 1988. He obtained an MBA from the University of WesternOntario in 2003. Mr. Chen has over 10 years experience in precious metals as ageologist in China and has worked extensively as a banker and analystthroughout China. Currently Mr. Chen is a director of Fortune Minerals Limited("FML") and an Executive Director and a Chief Investment Officer of ChinaMining.
SHAOHUI CHEN – Director• Mr. Chen was a former President of The Northern China Planning and Design
Institute of The Ministry of Chemical Industry and has over 30 years ofexperience in senior positions in the mining industry in China. Mr. Chen iscurrently the General Manager of Majestic’s Chinese subsidiary YantaiZhongjia Mining Co. Ltd..
DAVID DUVAL – Director• Mr. Duval is a 45-year veteran of the Canadian minerals industry. A graduate
Engineering Technologist, he has over a decade of engineering and productionexperience in both underground and open pit mines. Mr. Duval has served as adirector, officer and audit committee member of several public companiesincluding Primary Corp., a TSX-listed investment bank. In the 1990s, he worked asa Technical Advisor to the United Nations, coordinating the pre-feasibility studyfor a potash project in Thailand. In 2002, he accepted a position as SpecialAdvisor to the President of a NYSE-listed gold royalty company with adevelopment-stage gold project in Tanzania. In that capacity, he facilitated theraising of more than $50 million via private placements with Wall Street andEuropean investment banks.
20
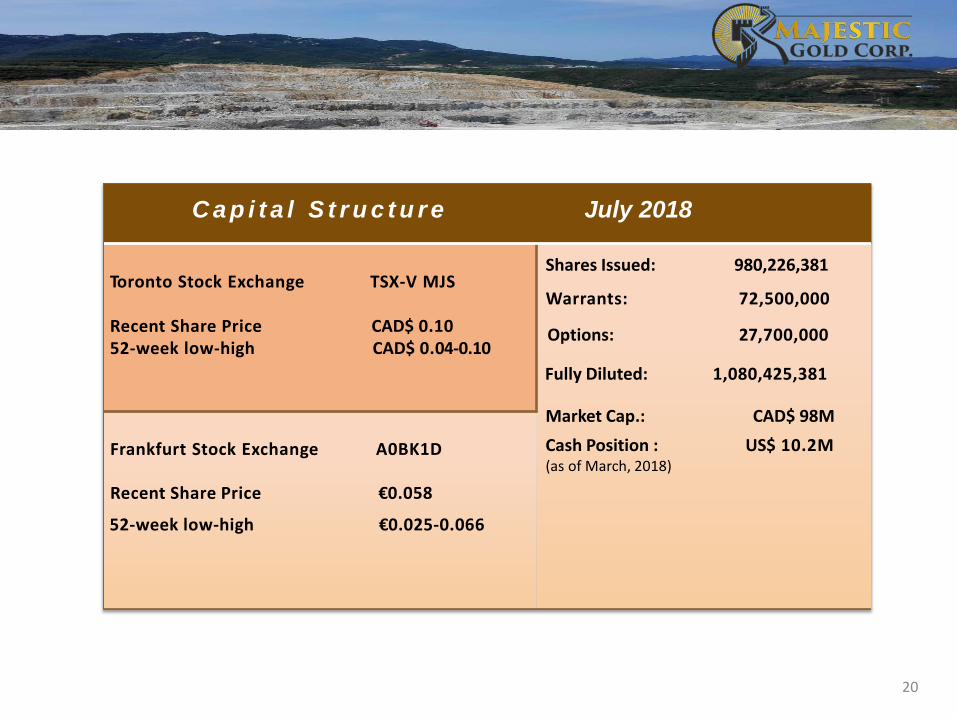
C a p i t a l S t r u c t u r e July 2018
Toronto Stock Exchange TSX-V MJS
Recent Share Price CAD$ 0.1052-week low-high CAD$ 0.04-0.10
Shares Issued: 980,226,381
Warrants: 72,500,000
Options: 27,700,000
Fully Diluted: 1,080,425,381
Market Cap.: CAD$ 98MCash Position : US$ 10.2M(as of March, 2018)
Frankfurt Stock Exchange A0BK1D
Recent Share Price €0.058
52-week low-high €0.025-0.066
21
H e a d O f f i c e :
Majestic Gold Corp.306 – 1688 152nd StreetSurrey, British ColumbiaCanada V4A 4N2
Telephone +1 (604) 560-9060Fax +1 (604) 560-9062Website www.majesticgold.comE-mail [email protected]

22
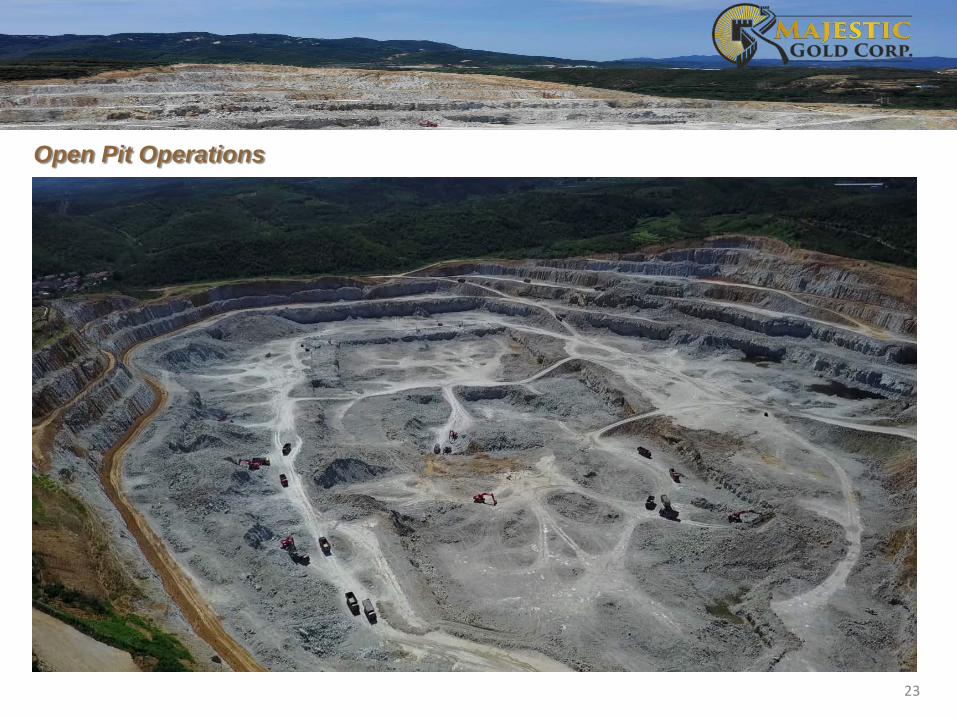
Open Pit Operations – currently down to +57 m ASL
23
Open Pit Operations

24
Open Pit Operations

25
Process Plant - 6,000 tpd
26
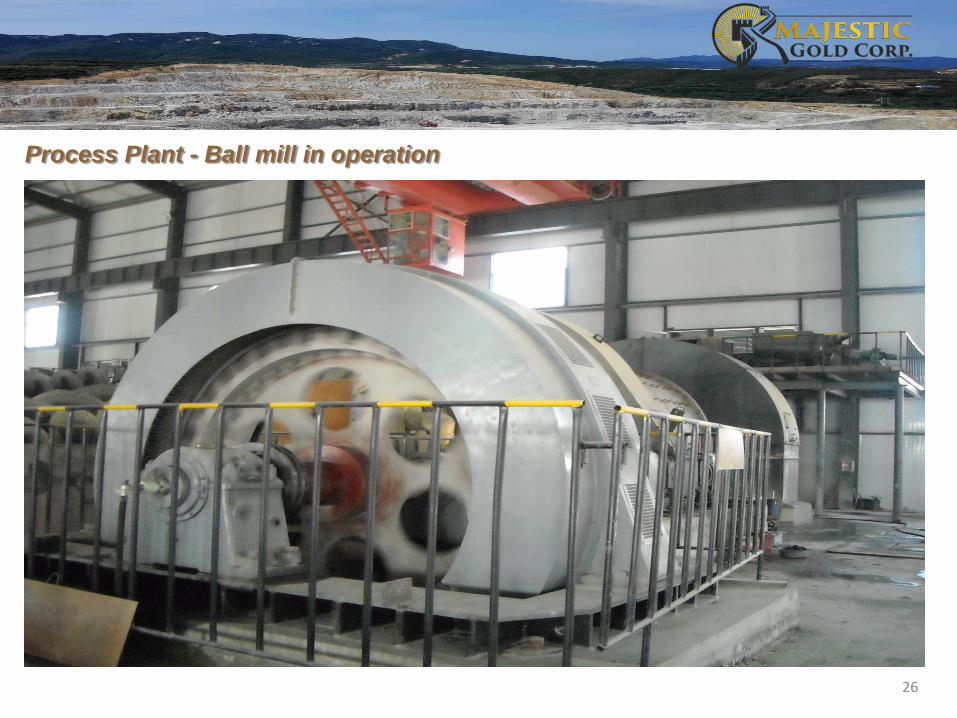
Process Plant - Ball mill in operation

27
Process Plant - Classifier

28
Process Plant - Flotation cells

29
Tailing Pond - water recycling reservoir below tailings dam (zero discharge)

30
Retaining Wall and Trees Planted on +81m elevation

31
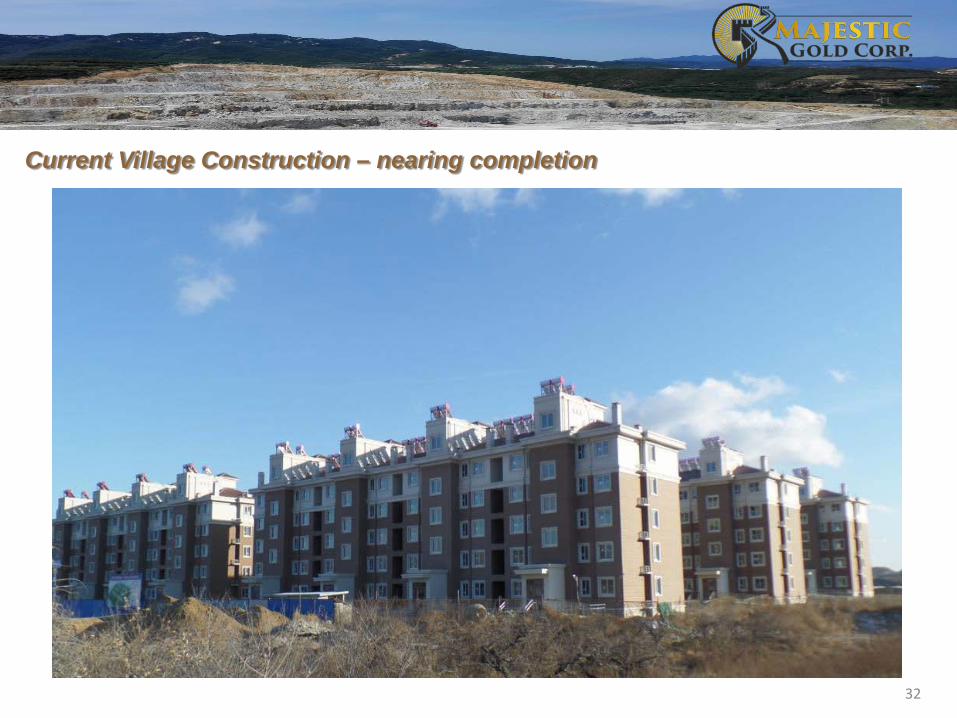
Village Relocation - construction of housing for about 280 families – scheduled completion late 2018
32
Current Village Construction – nearing completion

Cautionary Statement and Disclaimer
33
The information on this presentation includes certain “Forward-Looking Statements” within the meaning of securities exchange regulation. Forward-lookingstatements are made to provide information about management’s current expectations and plans. Forward-looking statements are generally identifiable by, but arenot limited to, the use of the words “may”, “will”, “should”, “continue”, “expect”, “anticipate”, “estimate”, “believe”, “targeting”, “intend”, “plan”, “guidance”, “outlook”,“potential”, “strategy” or “project” Forward-looking statements are necessarily based upon a number of estimates and assumptions that, while consideredreasonable by management, are inherently subject to significant business, economic and competitive uncertainties and contingencies. All statements regardingpotential mineralization and resources, exploration results, and future plans and objectives of Majestic Gold Corp. (the “Company”) are Forward-Looking Statementsthat involve various risks and uncertainties. There can be no assurance that such statements will prove to be accurate and actual results and future events coulddiffer materially from those anticipated in such statements. Although the Company has attempted to identify important factors that could cause actual results to differmaterially, there may be other factors that cause results not to be as anticipated, estimated or intended. Accordingly, readers should not place undue reliance onstatements containing forward looking information. Important factors that could cause actual results to differ materially from the Company’s expectations aredisclosed in Company documents filed from time to time with the securities regulatory authorities on sedar.com. Except as required under applicable securitieslegislation, the Company does not intend, and does not assume any obligation, to update this forward-looking information. The TSX Venture Exchange has notreviewed the information on this presentation and does not accept responsibility for the adequacy or accuracy of it.
Material in this presentation may still contain technical or other inaccuracies, omissions, or typological errors, for which Majestic assumes no responsibility. TheCompany does not warrant to make any representations regarding the use, validity, accuracy, completeness or reliability of any claims, statements or information onthis presentation. Under no circumstances, including but not limited to, negligence, shall Majestic be liable for any direct, indirect, special, incidental, consequential,or not advised for the possibility of damage, arising from the use, or inability to use, the material in this presentation.
NI 43-101 Disclosure: Stephen Kenwood, P.Geo., is a Qualified Person under NI 43-101, and has reviewed and approved the technical information herein. Thispresentation refers to a preliminary economic assessment (“PEA”) entitled “Independent Technical Report of Songjiagou Gold Project, Shandong Province, thePeople’s Republic of China”, prepared by SRK Consulting (China) Ltd. dated July 31, 2013 and amended on January 19, 2016. The Songjiagou resource estimatewas carried out using industry-standard procedures and a geological interpretation of the deposit that, to the extent possible, reflected observations of gradedistributions. Modeling of the deposit is uncertain; therefore, the geological model may overstate the distribution of high-grade gold values. If future miningdemonstrates that this is in fact the case, then the model may overstate anticipated gold grades. Because the probability of this outcome is unknown, the level ofuncertainty must also be unknown. The PEA includes indicated and inferred mineral resources. Inferred resources are considered too speculative geologically tohave the economic considerations applied to them that would enable them to be categorized as mineral reserves. Mineral resources that are not mineral reserves donot demonstrate economic viability. There is no certainty that the results of the PEA will ever be realized.
Production Disclaimer: The Company’s production decision was not based on a feasibility study of mineral reserves demonstrating economic and technical viability.The Company’s production decision was made based on the open pit optimization resource model set out in the PEA which takes into account the relatively lowmining costs negotiated by the Company. The pit optimization generated in the PEA used a cut-off grade of 0.30 grams per tonne Au. The strategic planning usesLerchs Grossman pit shells, resulting in SRK identifying the “potential minable” resources within the proposed preliminary production schedule.
The optimization was based on a gold price of US$1,355 per ounce and exchange rates of $1.000 (U.S.) to 6.2834 RMB and $1.000 (CAD) to 6.2789 RMB.