PowerPoint Presentation · This presentation contains forward-looking statements and information...
33
June 2014
Transcript of PowerPoint Presentation · This presentation contains forward-looking statements and information...

June 2014

Cautionary Information
This presentation contains forward-looking statements and information that are based on management’s current expectations. Such statements may include projections, Outlook and estimates regarding (i) leasing demand and demand for our wireless infrastructure, including small cells and distributed antenna systems (“DAS”), (ii) our growth, growth prospects and opportunities, including drivers of demand, (iii) shareholder returns, (iv) adoption of smartphones and cloud-based applications and consumption of mobile video, (v) U.S. mobile data demand, traffic, usage and growth,(vi) carrier capital expenditures and network investments, (vii) capital expenditures, (viii) U.S. wireless market, including the potential benefits, opportunities and returns therefrom, (ix) customer service, (x) capital allocation and capital structure, (xi) our investments, including investments in the land under our wireless infrastructure, (xii) our cost structure, including ground lease expense, (xiii) network density, (xiv) adjusted funds from operations (“AFFO”), including on a per share basis, (xv) margins, including site rental gross margin and incremental margin, (xvi) revenues, including site rental revenues, and (xvii) cash flows. The term “including”, and any variation thereof, means “including, without limitation.” Such forward-looking statements are subject to certain risks, uncertainties and assumptions, including prevailing market conditions and other factors. Should one or more of these risks or uncertainties materialize, or should any underlying assumptions prove incorrect, actual results may vary materially from those expected. More information about potential risk factors which could affect our results is included in our filings with the Securities and Exchange Commission. The Company assumes no obligation to update publicly any forward-looking statements, whether as a result of new information, future events or otherwise. This presentation may include certain non-GAAP financial measures, including AFFO. Tables reconciling such non-GAAP financial measures are set forth in the appendix hereto and the Supplemental Information Package posted in the Investors section of Crown Castle’s website at http://investor.crowncastle.com.
2

Company Overview

Real Estate Provider to the Wireless Industry
4

Largest U.S. Provider of Wireless Infrastructure
5
Well-positioned for continued stability and growth with key presence in top 100 and top 50 U.S. Basic Trading Areas (BTAs) Top 100 BTAs
represent approximately 74% of U.S. population
71% of towers in top 100 BTAs
56% of towers in top 50 BTAs
Crown Castle currently owns approximately 12,000 small cell nodes and rights to use 6,200 miles of fiber

Company History
Note: Chart area represents approximate quantity of assets at fiscal year end
0
10
20
30
40
50
1998 1999 2000 2001 2002 2003 2004 2005 2006 2007 2008 2009 2010 2011 2012 2013
Towers (in thousands)
6
AT&T Transaction
T-Mobile Transaction
and WCP Acquisitions
Global Signal Acquisition
Mountain Union
Acquisition
Disposition of UK Business
Initial Public Offering
Acquired BellSouth ,
Bell Atlantic and GTE towers
Acquired Powertel towers

Growth through Execution and Disciplined Capital Allocation
7
$2.09 $2.43
$2.77
$3.67
$4.04 to
$4.08
2010 2011 2012 2013 2014 AFFOOutlook
(1) Outlook issued on April 23, 2014
Maximize Long-Term Total Shareholder Returns
(1)
Manage our capital structure and optimize our cost of capital
Effectively allocate capital by making accretive investments
Continue to extend and secure the land underneath our towers
Leverage existing assets to drive organic growth
Maintain and improve upon industry-leading customer service to maximize opportunity
AFFO per Share

$217 $484
$843
$1,372 $1,585
$1,779 $2,057
$377
$697
$1,286
$1,854
$2,124
$2,504
$2,988
2001 2002 2003 2004 2005 2006 2007 2008 2009 2010 2011 2012 2013 2014E
Site Rental Gross Margin Site Rental Revenue
Proven Track Record of Stability and Growth
8
(1) Midpoint of guidance issued April 23, 2014
($ in millions)
NextG, WCP and T-Mobile Transactions
AT&T Transaction
(1)
2001 – 2006 CAGR Site Rental Revenue: 13%
Site Rental Gross Margin: 17% Incremental Margin: 84%
Global Signal Merger
2007 – 2011 CAGR Site Rental Revenue: 10%
Site Rental Gross Margin: 13% Incremental Margin: 93%

Significant Opportunity to Create Shareholder Returns by Leasing Up Less Mature Towers
(1) Yield is calculated as LQA site rental gross margin divided by invested capital. (2) Represents approximate yield at time of acquisition.
15%
7%
Greater than10 years
Less than10 years
$94
$55 2.8
2.0
Greater than10 years
Less than10 years
Yield (1) Last Quarter Annualized (“LQA”) Site Rental Revenue and Tenancy per Tower
% of Towers by Years of Operation by Crown
Greater than 10 years
28% Less than 10 years
72%
~4% - 5% Initial Yield (2)
9
($ in thousands)

12% 17%
72%
Leased< 10 Years
LeasedBetween
10 - 20 Years
Owned orLeased > 20
Years
Top 50 BTA 56% Top 100
BTA 15%
Other 29%
Attractive, U.S. Focused Portfolio
10
U.S. Site Count by BTA
Crown owns or controls the land underneath sites generating 72% of site rental gross margin for greater than 20 years Approximately one-third of site
rental gross margin generated on sites where Crown owns the land
Remaining two-thirds have an approximate lease term of 30 years
Note: Components may not sum due to rounding (1) Based on LQA Q1 2014 reported site rental gross margin
Domestic vs. International Site Mix
96%
4%
Domestic
International
Crown’s U.S. site footprint is approximately 40,000 sites
56% and 71% of U.S. sites located in the top 50 and 100 markets, respectively, where leasing is expected to be the highest
The recent T-Mobile and AT&T transactions reflect Crown’s continued belief that the U.S. market represents a compelling risk-adjusted environment for capital investments
Ground Profile by Margin(1)

Compelling U.S. Market Provides Greatest Risk-Adjusted Returns
11
$29.6 $32.4
$34.3 $32.7
2012 2013 2014E 2015E
$11.12
$33.36
$50.08
Emerging Markets Developed Markets U.S.
207 338
2,700
2012 2013 2018E
Q4 2013 Monthly ARPU(1) Forecasted U.S. Mobile Data Usage(2)
(petabyte per month)
Projected U.S. Wireless Carrier Capital Expenditures ($ in billions) (3)
↑ 52% CAGR
Each of the Big 4 wireless carriers has communicated multi-year network deployment plans
Potential new entrants (e.g. Dish and FirstNet) and currently un-deployed spectrum create further growth opportunities
(1) Source: Wall Street research; weightings based on average wireless service revenues per country (2) Source: Cisco VNI, 2014 (3) Source: Wall Street Research; includes AT&T, Sprint, T-Mobile, Leap, U.S. Cellular, and Verizon

Attractive Business Fundamentals
Stable and Long-Term Contracted Revenues Long-Term Control of Assets(2)
Attractive Tower Footprint Significant Network Demand Driven by Data Usage
…weighted average remaining current term, typically with annual escalators ~ 7
Years …of site rental gross margins generated on sites that reside on owned land(3) or have 10+ year ground leases ~88%
…largest shared wireless infrastructure provider in the U.S., with attractive portfolio footprint ~40k
towers
<10 yr Leases ~12%
>10 yr Leases or Owned
~88%
…expected growth in U.S. mobile data traffic from 2013 to 2018 ~ 8x
$3
$22
LQA Q1 2014Site Rental Revenues
RemainingContracted Payments
Site Rental Revenue ($bn)
7x
338
2,700
2013 2018E
Forecasted U.S. Mobile Data Usage(4)
(PB per month)
8x
(1)
12
(1) Excludes renewals at the customers’ option (2) Based on LQA Q1 2014 site rental gross margin (3) Includes perpetual and long-term easements (4) Cisco VNI 2014
96% 4%
International (Australia) Domestic

Business Model
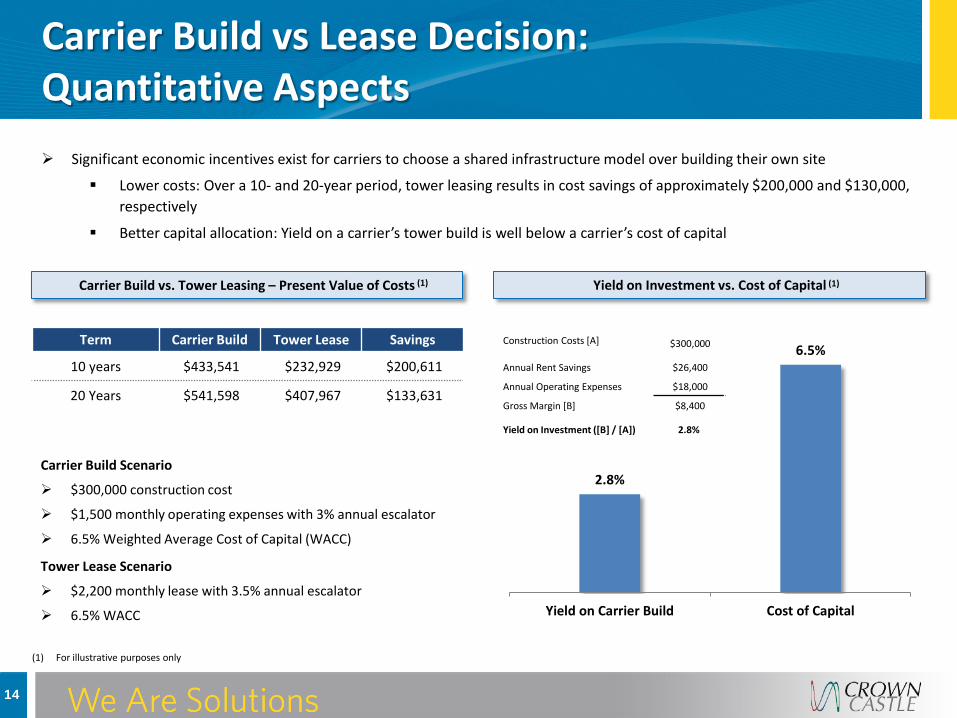
Carrier Build vs Lease Decision: Quantitative Aspects
Significant economic incentives exist for carriers to choose a shared infrastructure model over building their own site
Lower costs: Over a 10- and 20-year period, tower leasing results in cost savings of approximately $200,000 and $130,000, respectively
Better capital allocation: Yield on a carrier’s tower build is well below a carrier’s cost of capital
Carrier Build Scenario
$300,000 construction cost
$1,500 monthly operating expenses with 3% annual escalator
6.5% Weighted Average Cost of Capital (WACC)
Tower Lease Scenario
$2,200 monthly lease with 3.5% annual escalator
6.5% WACC
(1) For illustrative purposes only
Term Carrier Build Tower Lease Savings
10 years $433,541 $232,929 $200,611
20 Years $541,598 $407,967 $133,631
Carrier Build vs. Tower Leasing – Present Value of Costs Yield on Investment vs. Cost of Capital
2.8%
6.5%
Yield on Carrier Build Cost of Capital
Construction Costs [A] $300,000
Annual Rent Savings $26,400
Annual Operating Expenses $18,000
Gross Margin [B] $8,400
Yield on Investment ([B] / [A]) 2.8%
(1) (1)
14

Carrier Build vs Lease Decision: Qualitative Aspects
Factors Impacting Build vs. Lease Decision
COST
CONTROL SPEED TO MARKET
EXECUTION
Build Lease Comments
Cost Tower leasing results in lower cost to carriers and allows carriers to better allocate capital
Speed to Market
Independent tower operators have extensive tower portfolios and operational expertise necessary to help carriers quickly deploy their networks
Execution Tower leasing allows carriers to focus on their core business
Control Building a tower allows a carrier to retain control of critical infrastructure
15

Illustrative Tower Economics(1)
High Incremental Margins Associated with Lease-Up
(1) For illustrative purposes only
$8,400 (32%)
$33,800 (64%)
$59,200 (75%)
$26,400
$52,800
$79,200
One Tenant Two Tenants Three Tenants
Site Rental Gross Margin Site Rental Revenue
96% Incremental
Margin
96% Incremental
Margin
16

Recurring Long-Term Revenue Stream
Multiple tenants lease space on the tower and portions of the ground for their wireless communications equipment
Typical lease terms are non-cancellable with an initial term of 5 to 15 years with multiple 5 to 10 year renewal periods and annual lease escalators of approximately 3.5%
Leased vertical space on the tower
Weight placed on tower from equipment and coax lines
Square footage leased on the ground
Generally portfolio-based pricing based on previously negotiated agreements, not on a site-by-site basis
Source of Revenues
Factors Affecting Tenant Rent Pricing
$2,773 $2,858 $2,945 $3,019
2015E 2016E 2017E 2018E
Projected Site Rental Revenues, as Adjusted from Existing Customer Contracts (1)
High Degree of Visibility into Future Revenues
(1) Based on existing contracts as of March 31, 2014. All contracts, except for Sprint contracts associated with the iDen network and contracts where termination notices have been received, are assumed to renew for a new term at current term end date. CPI-linked customer contracts are assumed to escalate at 3% per annum. Assumes a US dollar to Australian dollar exchange rate of 0.89 US dollar to 1.0 Australian dollar.
17

High Quality Long-Term Revenue Stream
18
29%
23% 22%
14%
4% 9%
Tenants by Site Rental Revenue(1)
(1) Based on Q1 2014 site rental revenue, annualized (2) Based on latest publically available company data (3) Based on latest publically available company data; pro forma for the acquisition of Oi’s
tower portfolio in Brazil (4) Excludes renewals at the customers’ option (5) Weighted by revenue
Total: $3 billion
Remaining Contracted Cash Rent Receipts from Customer Leases
Approximately 87% of Crown’s site rental revenue is generated from the Big 4 wireless carriers
Crown estimates that remaining contracted cash rent receipts from customer leases total approximately $22 billion(4)
Crown’s leases have a weighted average remaining term of approximately 7 years(5), excluding renewals at the customers’ option
$3
$22
LQA SiteRental Revenues
RemainingContracted Receipts(1) (4)
AT&T
Sprint T-Mobile
Verizon
Australia Other
($ in billions)
7x
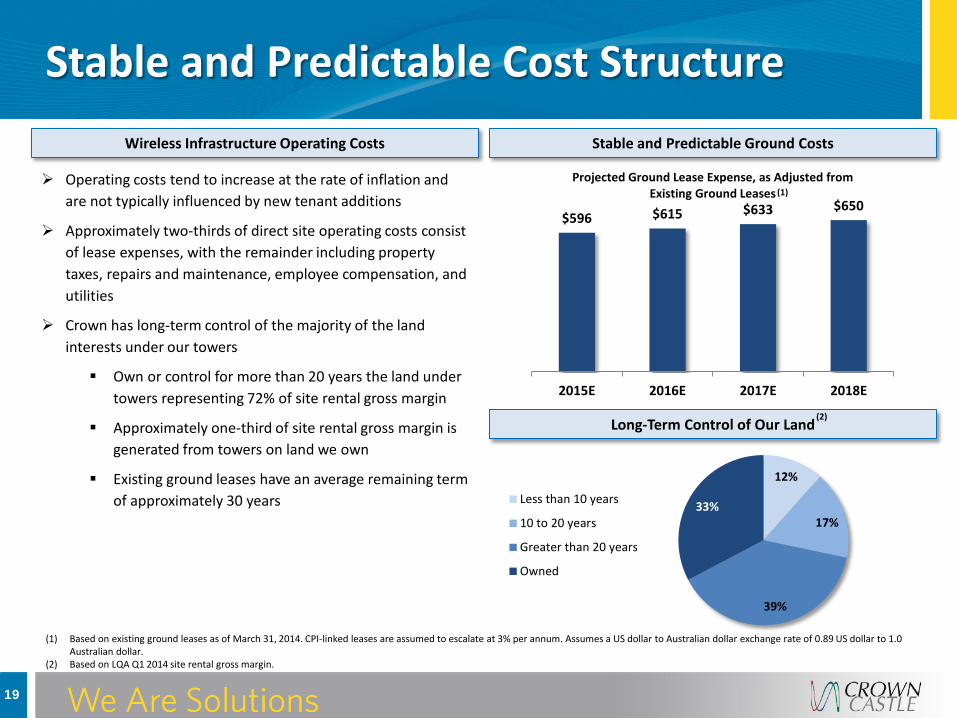
Stable and Predictable Cost Structure
19
$596 $615 $633 $650
2015E 2016E 2017E 2018E
Projected Ground Lease Expense, as Adjusted from Existing Ground Leases (1)
(1) Based on existing ground leases as of March 31, 2014. CPI-linked leases are assumed to escalate at 3% per annum. Assumes a US dollar to Australian dollar exchange rate of 0.89 US dollar to 1.0 Australian dollar.
(2) Based on LQA Q1 2014 site rental gross margin.
Operating costs tend to increase at the rate of inflation and are not typically influenced by new tenant additions
Approximately two-thirds of direct site operating costs consist of lease expenses, with the remainder including property taxes, repairs and maintenance, employee compensation, and utilities
Crown has long-term control of the majority of the land interests under our towers
Own or control for more than 20 years the land under towers representing 72% of site rental gross margin
Approximately one-third of site rental gross margin is generated from towers on land we own
Existing ground leases have an average remaining term of approximately 30 years
Wireless Infrastructure Operating Costs Stable and Predictable Ground Costs
Long-Term Control of Our Land
12%
17%
39%
33% Less than 10 years
10 to 20 years
Greater than 20 years
Owned
(2)

1.9% 1.8% 1.4% 1.3%
1.7% 1.9%
2008 2009 2010 2011 2012 2013
Low Ongoing Capital Intensity
20
Sustaining Capex as a % of Site Rental Revenues Crown’s wireless infrastructure portfolio requires minimal sustaining capital expenditures, including maintenance and other non-discretionary capital expenditures
Sustaining capital expenditures typically equate to less than 2% of site rental revenues
$222 $120 $95 $128
$270
$436
$201
$25 $109
$196
$134
$85 $27
$28 $24
$23
$37
$48
2008 2009 2010 2011 2012 2013
Revenue Generating Capex LandPurchases
SustainingCapex
Discretionary
($ in millions)
2008 2009 2010 2011 2012 2013 # of towers at
period end 22,489 22,365 23,845 23,783 31,545 41,322

Comparison to Other REITs(1)
21
(1) Wall Street research
Key Characteristics Tower Industry More Traditional Real Estate Comments
Typical lease term 5-10 years 5-10 years
Tower leases typically include multiple renewal periods at the tenant's option of 5-10 years each
Annual rent escalations 3-5% or CPI-based 1-3% or CPI-based-
Maintenance capex as % of base rent ~2% 5-15%-
Current occupancy 50-60% 90-95%
Towers are typically constructed to support three to five tenants; capacity can be increased with minimal incremental costs
Tenant concentration High LowConcentration is with the well capitalized Big 4 carriers
Industry concentration High Low-
Land ownership Low High
Crown owns or controls for greater than 20 years the land under sites representing 72% of our site rental gross margin; average remaining term of ~30 years on land leases
AFFO per share growth Teens High single digit-
AFFO multiple 15-20x 15-22x-

Industry Overview

2012 2013 2014E 2015E 2016E 2017E
Consumer video (64% CAGR) Consumer Web (46% CAGR)
Business video (60% CAGR) Business Web (48% CAGR)
Consumer file sharing (55% CAGR) Business file sharing (49% CAGR)
Secular Growth in Mobile Data Drives Demand
23
United States Mobile Data Traffic
57% CAGR (2012-2017E)
Adoption of smart connected devices that, on average, generate significantly more traffic than non-smart devices
On average, smartphones generated 48x more mobile data traffic than basic feature phones in 2013
As of March 2014, approximately 69% of U.S. mobile subscribers owned smartphones
Adoption of mobile cloud-based applications
Mobile cloud traffic is expected to increase 12x between 2013 and 2018
Consumption of mobile video applications
Mobile video traffic is expected to grow at a CAGR of 69% between 2013 and 2018, the fastest expected growth rate of any mobile application category.
Increasing mobile network speeds, which leads to increased usage
Mobile network connection speeds in North America are expected to grow at a CAGR of 21% between 2013 and 2018
Key Factors Driving Data Growth (1)
(1)
(2)
(1) Cisco VNI Mobile, 2014 (2) comScore
(1)
(1)
(1)
(petabyte per month)

$0
$5
$10
$15
$20
$25
$30
$35
$40
'95 '96 '97 '98 '99 '00 '01 '02 '03 '04 '05 '06 '07 '08 '09 '10 '11 '12 '13 '14 '15
Demand Trends Drive Significant Ongoing Network Investment
24
U.S. Carrier Wireless Capex (billions)
1G/2G = voice & text
3G = mobile web 1.0 (Email)
4G = mobile apps & video
(1)
(1) CTIA and Wall Street research

Addressing the Rapid Growth in Data
25
0
500
1,000
1,500
2,000
2,500
3,000
2013 2018E
in P
etab
ytes
(1)
Column1
(1) Cisco VNI 2014
8x Increase
More cell sites (i.e. cell splitting), including macro and small cell architectures
Carriers can increase the density of their networks, and therefore the capacity, by adding new cell sites
Verizon and AT&T are increasingly focused on adding capacity/density to their 4G networks, while Sprint and T-Mobile are primarily focused on coverage build-out
More spectrum
Potential for the amount of deployed spectrum to double over the next several years
Technology gains, including increased spectral efficiency, associated with migration to next-generation networks (i.e. 3G to 4G)
4G download speeds can be up to 10x faster than 3G
Three Primary “Tools” for Carriers to Manage Data Growth U.S. Monthly Mobile Demand

Increasing Density of Networks
Cell Tower
Coverage weakens further away from the cell tower due to more subscribers served and spectrum limitations
Initial Buildout - Coverage
Initial networks built for voice were primarily focused on coverage
Increased Adoption - Congestion Continued Investment - Capacity
Increased number of subscriber and adoption of smartphone leads to congested networks
To meet increasing data demand and rising penetration of data-driven devices, carriers have invested in increased infrastructure
Cell splitting, or reducing the service radius served by a cell tower, allows a carrier to focus on a smaller customer population and improve quality
26

Asset Overview

28
Wireless Tower Basics Key Components of a Tower
1. Antenna Array and Platform
Tenants deploy antennas which transmits the signal between the tower and the mobile device
2. Microwave Antenna “Dish”
A specific type of antenna used for point-to-point communications, including wireless backhaul
3. Coaxial Cabling
Transmission lines that transport the signal between the antennas and the base station
4. Shelter
Structures at the base of the tower used by tenants to house their wireless communications equipment
5. Ground Space
A secure area around the base of the tower where tenants deploy their shelters and backup generators

Sample Ownership of Tower Infrastructure
29
Typical Ownership Split
Crown Castle Assets
The steel tower structure that typically has capacity for at least four tenants
The ground space, which Crown either owns or operates pursuant to a long-term lease
Customer Assets
Antenna equipment
Coaxial cabling
Shelters at the base of the tower, including all of the equipment housed in the shelters

How Do Wireless Networks Work?
30
1. Wireless networks automatically route traffic to a mobile user using a cell site with the strongest signal. The signal then travels between the handset and the tower-mounted antennas.
2. Transceivers, typically referred to as “radios” send and receive signals at a specific frequency to the mobile device
3. The base station processes the signals and send them to switching elements which then route the traffic both within and to other networks (mobile, IP or wireline)
4. Backhaul (wireline/fiber or wireless) is used to transport traffic to and from the tower to the switching elements

Non-GAAP Reconciliations

Non-GAAP Reconciliations
32
(1) Inclusive of the noncontrolling interest related to real estate related depreciation, amortization, and accretion and asset write-downs. (2) Adjusts the income tax provision to reflect our estimate of the cash taxes had we been a REIT, which predominately related to foreign taxes paid. As a result, income tax expense (benefit) is
lower by the amount of the adjustment.
Adjusted Funds From Operations for the years ended December 31, 2010, 2011, 2012, and 2013 are computed as follows:
For the Years Ended December 31,(in millions, except per share data) 2010 2011 2012 2013
Net income (loss) (311.3)$ 171.5$ 200.9$ 93.9$ Real estate related depreciation, amortization and accretion 522.5 531.9 601.4 761.1 Asset write-down charges 13.7 22.3 15.5 14.9 Adjustment for noncontrolling interest(1) 0.3 (0.4) (12.3) (3.8) Dividends on preferred stock (19.9) (19.5) (2.5) —
Funds from Operations 205.4$ 705.7$ 803.0$ 866.0$
Funds from Operations (from above) 205.4$ 705.7$ 803.0$ 866.0$ Straight-line revenue (161.7) (200.0) (251.3) (218.6) Straight-line expense 38.8 39.0 54.1 81.0 Stock-based compensation expense 40.0 36.0 47.4 41.8 Non-cash portion of tax provision(2) (29.0) 5.0 (106.7) 191.7 Non-real estate related depreciation, amortization and accretion 18.3 21.1 21.2 13.1 Amortization of non-cash interest expense 85.5 102.9 109.3 99.2 Other (income) expense 0.6 5.6 5.4 3.9 Gains (Losses) on retirement of long-term obligations 138.4 — 132.0 37.1 Net gain (loss) on interest rate swaps 286.4 — — —Acquisition and integration costs 2.1 3.3 18.3 26.0 Adjustment for noncontrolling interest(1) (0.3) 0.4 12.3 3.8 Capital improvement Capex (14.8) (14.0) (21.6) (19.3) Corporate Capex (9.5) (9.4) (15.5) (28.4)
Adjusted Funds From Operations 599.7$ 695.7$ 807.8$ 1,097.3$ Weighted-average common shares outstanding – diluted 286.8 285.9 291.3 299.3 Adjusted Funds From Operations per Share 2.09$ 2.43$ 2.77$ 3.67$

Non-GAAP Reconciliations (continued)
33
(1) Inclusive of the noncontrolling interest related to real estate related depreciation, amortization, and accretion and asset write-downs. (2) Adjusts the income tax provision to reflect our estimate of the cash taxes had we been a REIT, which predominately related to foreign taxes paid. As a result, income tax expense (benefit) is
lower by the amount of the adjustment.
Adjusted Funds From Operations for the year ending December 31, 2014 is forecasted as follo
Full Year 2014(in millions, except share and per share amounts) OutlookNet income (loss) $298 to $382
Real estate related depreciation, amortization and accretion $970 to $985Asset write-down charges $6 to $16Adjustment for noncontrolling interest(1) $(7) to $1Dividends on preferred stock $(44) to $(44)
Funds from Operations $1,276 to $1,291
Funds from Operations (from above) $1,276 to $1,291Straight-line revenue $(196) to $(181)Straight-line expense $94 to $109Stock-based compensation expense $55 to $60Non-cash portion of tax provision(2) $(10) to $5Non-real estate related depreciation, amortization and accretion $21 to $26Amortization of non-cash interest expense $75 to $86Other (income) expense $3 to $5Gains (Losses) on retirement of long-term obligations $46 to $46Acquisition and integration costs $13 to $23Adjustment for noncontrolling interest(1) $7 to $(1)Capital improvement Capex $(35) to $(33)Corporate Capex $(41) to $(39)
Adjusted Funds From Operations $1,346 to $1,361Weighted-average common shares outstanding – diluted 333.3 Adjusted Funds From Operations per Share $4.04 to $4.08