PowerPoint Presentation - American Academy of Sleep · PPT file · Web...
59
Exploring the Economic Benefits of OSA Diagnosis and Treatment Commissioned by the American Academy of Sleep Medicine Published August 2016
Transcript of PowerPoint Presentation - American Academy of Sleep · PPT file · Web...

Exploring the Economic Benefits of OSA Diagnosis and Treatment
Commissioned by the American Academy of Sleep Medicine Published August 2016

Epidemiology
Source: Primary research with experts, U.S. Census (2014), Peppard "Increased Prevalence of Sleep-disordered Breathing in Adults." American Journal of Epidemiology (2013)
© American Academy of Sleep Medicine 2016

Barriers to Diagnosis & Treatment
Source: Primary and secondary research
© American Academy of Sleep Medicine 2016

Costs Associated with OSA in United States in 2015
Undiagnosed/Untreated, 23.5 M People, $149.6B
Diagnosed/ Treated5.9 M People, $12.4B
Source: 1Primary research with experts, secondary clinical research, U.S. Census (2014), Peppard "Increased Prevalence of Sleep-disordered Breathing in Adults." American Journal of Epidemiology (2013), Frost & Sullivan Patient Survey
$162.0 BAnnual per patient diagnosis and treatment costs are 67% less than leaving
patients undiagnosed.
© American Academy of Sleep Medicine 2016

Cost Burden of OSA in the Undiagnosed vs. Diagnosis
& Treatment Costs
Source: 1Primary research with experts, secondary clinical research, U.S. Census (2014), Peppard "Increased Prevalence of Sleep- disordered Breathing in Adults." American Journal of Epidemiology (2013), Frost & Sullivan Patient Survey,
Undiagnosed Diagnosed
# People with OSA 23,500,000 5,900,000
Cost of Undiagnosed OSA ($US Bil)
Cost of Diagnosed OSA ($US Bil)
Comorbidities & Mental Health $30.0 Diagnosis, Testing and Follow Up
$0.8
Motor Vehicle Accidents $26.2 Non-surgical Treatment $6.2
Workplace Accidents $6.5 Surgical Treatment $5.4
Lost Productivity $86.9
Total Costs ($US Bil) $149.6 $12.4
Cost per Person $6,336 $2,105
© American Academy of Sleep Medicine 2016

Diagnosing and Treating All 29.4M Americans with OSA Could Save $100.1
BillionToday
Where 80% of OSA Patients Are UndiagnosedFuture
Where No OSA Patients Are Undiagnosed
Healthcare Costs
Non-Healthcare Costs
Healthcare Costs
Non-Healthcare Costs
Undiagnosed Diagnosed
Healthcare Costs
Non-Healthcare Costs
Healthcare Costs
Non-Healthcare Costs
Undiagnosed Diagnosed
$30.0B$12.4B
$119.6B
$61.9B
$0 $0 $0 $0
Total: $162.0BCost per Person: $5,511
Total: $61.9BCost per Person: $2,105
© American Academy of Sleep Medicine 2016

Sources of Cost for Undiagnosed OSA
Comorbidities & Mental
Health
HypertensionHeart Disease
DiabetesAsthma/Breathing Disorders
InsomniaDepression/Anxiety/Mental Health
$5.4 B
$6.4 B$2.6 B
$2.1 B$7.1 B
$6.7 B
$30.0 BIncludes cost of
healthcare services, medication, and
quality of life.
Motor Vehicle
Accidents
Commercial
Non-Commercial
$19.1 B
$7.1 B
$3.5 B
$199M
$15.6 B
$26.2 B
Includes medical costs, emergency services,
property damage, lost productivity, and monetized
quality adjusted life years (QALYs) incurred by
company, insurer, victims, government and others.
FatalNon-Fatal
Fatal
Non-Fatal
$6.9 B
Includes fatal and non-fatal accidents. Includes medical costs and lost productivity.Workplace Accidents $6.5 B
Lost Productivity $86.9 B Productivity
Absenteeism
$83.1 B
$3.8 B
© American Academy of Sleep Medicine 2016

Three Sources of Cost for Diagnosed/Treated OSA
In-Lab PSG
Diagnosed OSA$12.4 B
Diagnosis
Non-Surgical Treatment
$817.9 M
$6.2 B
Surgical Treatment
$5.4 B
Home Sleep Testing
UPPP
Maxillomandibular/ Genioglossus /Hyoid AdvancementTemperature-controlled RF Tongue Base Reduction
Nasal Reconstruction/ Polyp Removal
Pillar ProcedureSclerotherapyTracheotomy for OSA
Bariatric Surgery
Tonsillectomy/ AdenoidectomyHypoglossal Nerve Stimulation
$4.1 B
$129 M
$333.3 M$48 M
$215 M$4.5 M
$5.5 M$1.1 M$4.9 M
$593.8 M
CPAP TitrationClinic Visits
$212.3 M
$16.7 M
$102.7 M
$486.2 M
PAP/ BiPAP MachinePAP ConsumablesOral Appliances
$3.1 B
$3.0 B
$136.8 M
© American Academy of Sleep Medicine 2016

Comorbidities & Mental HealthEconomic
Cost1: $30 B
Source: 1Primary research with experts, secondary clinical research, U.S. Census (2014), Peppard "Increased Prevalence of Sleep-disordered Breathing in Adults." American Journal of Epidemiology (2013), Frost & Sullivan Patient Survey
• Diabetes, stroke, heart disease, and hypertension have direct costs associated with medical expenses, hospital inpatient visits, medication use and mortality rates.
• Mental health can be more subjective including cognitive function, quality of life, mood, depression, energy levels, substance abuse and interpersonal relationships.
© American Academy of Sleep Medicine 2016

Motor Vehicle Accidents
Source: 1Primary research with experts, secondary clinical research, U.S. Census (2014), Peppard "Increased Prevalence of Sleep-disordered Breathing in Adults." American Journal of Epidemiology (2013), 2Tefft, Brian C. "Prevalence of Motor Vehicle Crashes Involving Drowsy Drivers, United States, 2009-2013." AAA Foundation for Traffic Safety. 3Berger, MD. “A Corporate Driven Sleep Apnea Detection and Treatment Program: Results and Challenges." (2006), Frost & Sullivan Patient Survey
• According to AAA2, drowsy driving causes nearly 29% or 328,000 crashes each yearo 109,000 injuries & 6,400
fatalities• Commercial drivers treated on CPAP had a 73% reduction in preventable driving accidents. Annual cost savings for trucking company3:o 1,000 employees: $47.8Mo 11,000 employees: $8.1B
Economic Cost1: $26.2 B
© American Academy of Sleep Medicine 2016

Workplace Accidents
Source: 1Primary research with experts, secondary clinical research, U.S. Census (2014), Peppard "Increased Prevalence of Sleep-disordered Breathing in Adults." American Journal of Epidemiology (2013), Frost & Sullivan Patient Survey2 Barnes “"Changing to Daylight Saving Time Cuts Into Sleep and Increases Workplace Injuries.“ (2009)
• There was an increase in accident rates on days following Daylight Saving Time, “Sleepy Monday”, when just 40 minutes of sleep was lost2
o 5.7% spike in workplace injuryo 67.6% increase in days of work
lost due to sustained injuries• Treatment cost savings include reduced lost wages and absenteeism, lower associated medical expenses and better quality of life
Economic Cost1: $6.5B
© American Academy of Sleep Medicine 2016

Lost Productivity
Source: 1Primary research with experts, secondary clinical research, U.S. Census (2014), Peppard "Increased Prevalence of Sleep-disordered Breathing in Adults." American Journal of Epidemiology (2013), Frost & Sullivan Patient Survey
• Reduced sleep can result in: Absenteeism, underperformance, behavioral problems, “cyberloafing”, poor decision making, decreased productivity, and the degree of likelihood that an individual will help a fellow colleague.• Treatment cost savings can result in not only economic productivity, but also improved workplace behavior
Economic Cost1:
$86.9 B
© American Academy of Sleep Medicine 2016

Benefits of Treatment: The “Triple Aim”
Beyond economics and cost savings, imagine what the U.S. would be like if all 29.4 million people with OSA received treatment…
Providers• Aligns with population health incentives
• Improved outcomes increases profit in a value-based healthcare system • Lowers healthcare utilization and reduces admissions
Patients• Improves health and
life expectancy• Increases productivity
• Increases quality of life
• Improves relationships
Payors/ Employers• Reduces costs long-
term• Increases productivity
• Lowers accident rates and liability
costs
© American Academy of Sleep Medicine 2016

What Does the Patient Experience Tell Us that
OSA Treatment Can Deliver?
Results of a Recent Survey of 506 Americans
Treating their OSA
© American Academy of Sleep Medicine 2016
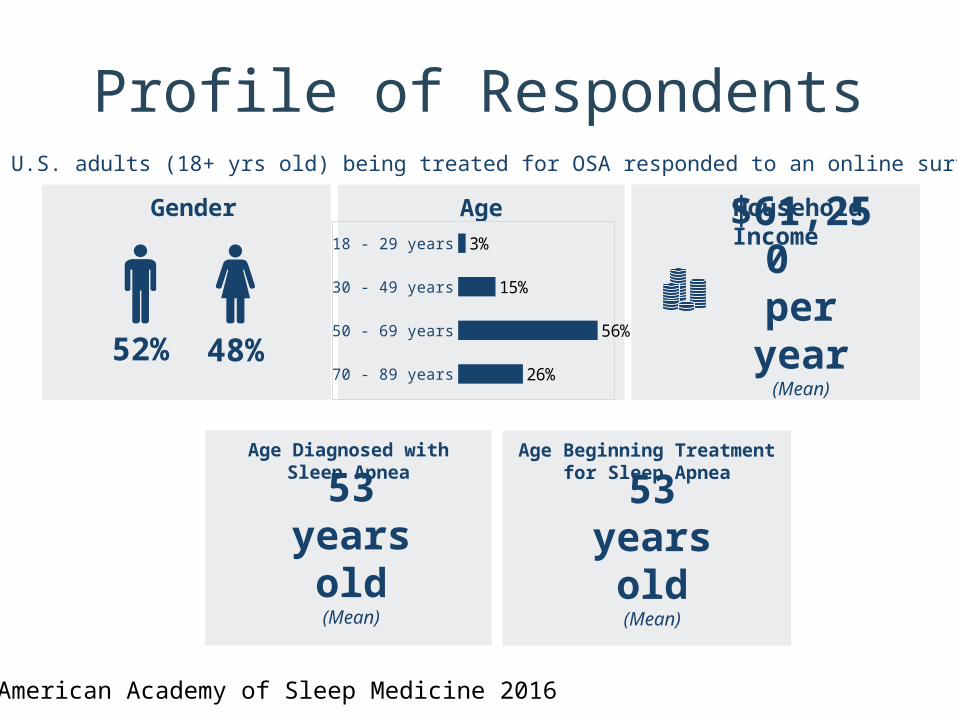
Profile of Respondents Gender
Age Beginning Treatment for Sleep Apnea
Age Diagnosed with Sleep Apnea
Age Household Income
$61,250 per year
(Mean)52% 48%
53years old
(Mean)
53years old
(Mean)
18 - 29 years
30 - 49 years
50 - 69 years
70 - 89 years
3%
15%
56%
26%
506 U.S. adults (18+ yrs old) being treated for OSA responded to an online survey
© American Academy of Sleep Medicine 2016

Profile of Respondents Geographic Location Occupational Status
Base: n=506Q2. What is the state you currently live in?
31%
4%
12%
50%
2%
Employed Homemaker Disabled/ Unable to work
Retired Unemployed
West Midwest South North East
24%27%
33%
16%
© American Academy of Sleep Medicine 2016

Diagnosis and TreatmentWhat type of healthcare provider initially warned you about the
risk of sleep apnea? (n=506)
n=61
28%15%
30%
6% 4%
12%
Sleep Specialist Pulmonologist GP/ Internist CardiologistEndocrinologist Neurologist Ear Nose Throat (ENT) OtherI raised the issue
What caused you to raise the issue of your risk of sleep apnea with your healthcare provider? (n=61)
Excessive Drowsiness
Poor Quality of Life
Work Performance
Friend/ relative has sleep apnea
Snoring/ Disturbing bed partner
Encouragement from bed partner
Automotive Accident
Learned about sleep apnea in reading/ watching programs
56%
34%
16%
26%
70%34%
2%
20%
(Percentages under 3% not shown for transparency).
“I raised the issue”
© American Academy of Sleep Medicine 2016

Diagnosis and TreatmentWhat type of doctor diagnosed you with
sleep apnea? (n=506)Time between initial warning about sleep apnea risk and diagnosis following a sleep study (n=506)
14%
39%17%
10%
20%
0 Months 1 Month 2 Months 3 Months4 or more months
64%
21%10%
3%
Sleep Specialist Pulmonologist GP/ InternistCardiologist Endocrinologist NeurologistEar Nose Throat (ENT) Other
(Percentages under 3% not shown for transparency).
© American Academy of Sleep Medicine 2016

OSA Severity AssessmentBefore and after sleep apnea treatment
Base: n=506Q6a/c. When you were initially diagnosed/ Now that you are being treated, how does your physician describe your sleep apnea?Q6b/d.When you were initially diagnosed with sleep apnea but before treatment, on average how many hours of sleep did you get in a 24 hour period? How many do you get now that you are being treated?
When diagnosed 16% 43% 41%Mild (AHI: 5-14) Moderate (AHI: 15-29) Severe (AHI: 30+)
Average Hours of sleep (per 24 hrs)Physician Assessment Upon Diagnosis
5.5 Hrs (mean)
During treatment 62% 30% 8%Mild (AHI: 5-14) Moderate (AHI: 15-29) Severe (AHI: 30+)
Physician Assessment During Treatment
7.2 Hrs (mean)
Average Hours of sleep (per 24 hrs)
© American Academy of Sleep Medicine 2016

OSA Treatment What treatment did you begin upon diagnosis of
sleep apnea?(n=506)What treatment(s) are you using today? (n=506)
In an average night, for how many hours of sleep do you wear your CPAP/Oral Appliance. For how many years have you been using the following treatments?
92%
6% 3% 3% 6% 7%2%
CPAP (or PAP/AutoPAP/BiPAP) Oral Appliances Surgery (within the year) Surgery for weight loss (within the year) Non-Surgical Weight Loss
Change for sleep positioning Other None
85%
6%2% 3%
9% 10%2% 2%
Oral Appliance
Oral Appliance
3.7 years (Mean)
5.6 Hours(Mean)
CPAP
CPAP
7.4 years (Mean)
6.3 Hours(Mean)
© American Academy of Sleep Medicine 2016

Impact of OSA Treatment onSleep Quality
© American Academy of Sleep Medicine 2016

Quality of Sleep - OverallBefore and after sleep apnea treatment
On a scale of 1 meaning ‘very bad’ to 5 meaning ‘Very good’, how would you rate the quality of your sleep before and after treatment for sleep apnea? (Percentages under 3% not shown for transparency).
Overall (n=506)
5 - Very good 4 3 2 1 -Very bad
Before After
41%
36%
4%
16%
19%
4%
44%
32%
After
Before
7%
35%
22%
21%
42%
5%
27%
5% 34%New User (under 5 years) (n=188)
After
Before
18%
15%
43%
3%
37%
39%42%Mid-Term User (5 -10 years) (n=191)
After
Before
14%
10%
50%
4%
35%
54%31%Long-Term User (Over 10 years) (n=127)
76% reported the quality of their sleep as ‘good’/ ‘very good’ after treatment (vs. 7% before treatment). While all user groups indicate improvement, long-term users have the most positive impact after treatment (85%).
© American Academy of Sleep Medicine 2016

Quality of Sleep Across ComorbiditiesBefore and after sleep apnea treatment
Depression/ Mental Health (n=186)
Before After
46%
34%
13%
25%
45%
26% Diabetes (n=122)
Insomnia (n=146) Asthma/ Breathing Problems (n=129) Heart Disease (n=66)
1 -Very bad 2 3 4 5 - Very good
High Blood Pressure (n=302)
Before After
42%
33%
20%
25%
42%
30%
Before After
40%
36%
16%
17%
5%
45%
34%
Before After
50%
32%
9%
21%
9%
47%
26%
Before After
44%
33%
5%
13%
22%
7%
45%
28%
Before After
54%
30%
6%
8%
28%
5%22%
43%
A high proportion of respondents with comorbidities declare their sleep quality as ‘good’/ ‘very good’ after treatment. The biggest difference is among High Blood Pressure patients (79% vs 8% before treatment.) and the smallest among
Insomnia patients (65% vs. 8% before treatment.)
© American Academy of Sleep Medicine 2016

Quality of Sleep – No ComorbiditiesBefore and after sleep apnea treatment – By years of treatment
Base: n=71On a scale of 1 meaning ‘very bad’ to 5 meaning ‘Very good’, how would you rate the quality of your sleep before and after treatment for sleep apnea?
No existing medical condition (n=71)
Before After
39%
34%
20%
10%
6%
44%
45%
Respondents with no existing comorbidities are most satisfied with the quality of their sleep after treatment (89% - ‘good/‘very good’ after treatment vs. 7% before) with long term users driving the satisfaction at 94%.
After
Before
4%
39%
13%
26%
48%
4%
35%
9% 21%New User (under 5 years) (n=23)
After
Before
10%
19%
45%45%
6% 39%35%Mid-Term User (5 – 10 years) (n=31)
After
Before
6%
12%
41%53%
65%24%Long-Term User (Over 10 years) (n=17)
5 - Very good 4 3 2 1 -Very bad
© American Academy of Sleep Medicine 2016

Quality of Life and Productivity Benefits
vs.Willingness to Invest in
Treatment
© American Academy of Sleep Medicine 2016

Improving Sleep Quality Improves Quality of Life
© American Academy of Sleep Medicine 2016

Base: n=354
Hours fully awake, productive and contributing at your job:
Before Treatment
After Treatment
Days absent from work due to illness, disability, medical visits or feeling too
tired to work?Before Treatment
After Treatment
6.9 Hrs (Mean)
8.1 Hrs (Mean)
6.3 Days (Mean)
4.5 Days (Mean)
+1.2 Hrs of Productivity
40% fewer absences
Productivity and AbsenteeismBefore and after sleep apnea treatment
© American Academy of Sleep Medicine 2016
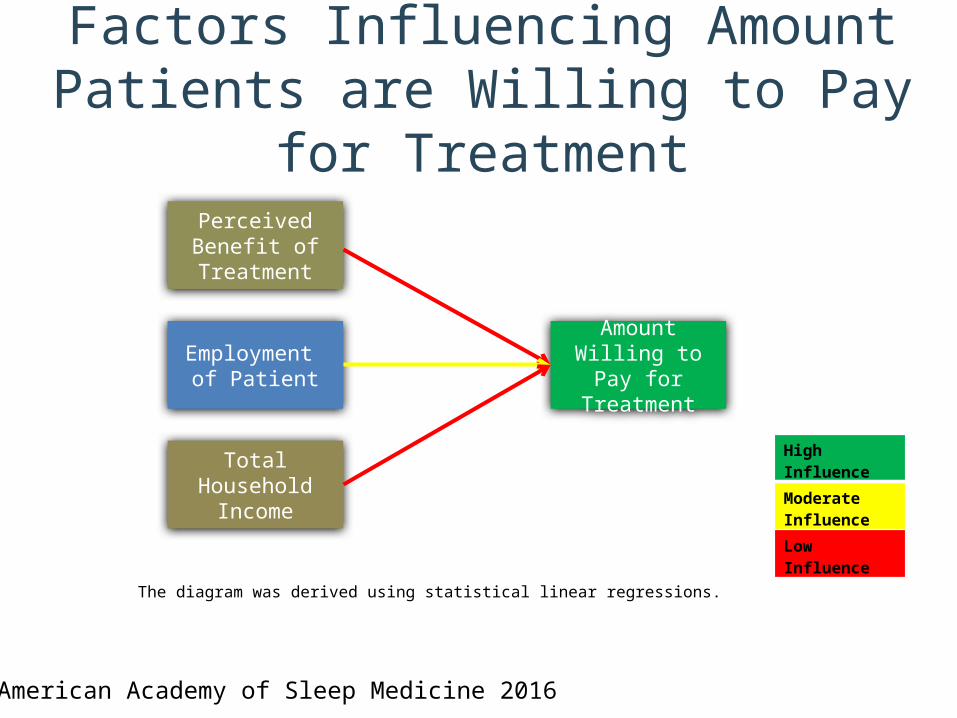
Factors Influencing Amount Patients are Willing to Pay for
TreatmentPerceived Benefit
of Treatment
Total Household Income
Employment of Patient
Amount Willing to Pay for Treatment
The diagram was derived using statistical linear regressions.
High Influence
Moderate Influence
Low Influence
© American Academy of Sleep Medicine 2016

Q15. What is the maximum amount you would be willing to pay out of your own pocket each month to treat your sleep apnea?
$0 $5 $10 $15 $20 $25 $30 $40 $50 $75 $100 $150 $200 $300 $500+0%
10%
20%
30%
40%
50%
60%
70%
80%
90%
100%
4% 17% 25% 53%
Extremely bad investment Somewhat bad investment No opinion Somewhat good investment Extremely good investment
Mean: $51 per month or $612 per year
37% are not willing to pay
When you consider how much money you have spent treating your sleep apnea, do you feel like that investment was worth the benefits you received?
Base: (n=506)
Base excludes those who responded “Don’t know” (13% of sample)
Investment and Benefit
© American Academy of Sleep Medicine 2016

Impact of Treatment on Patients with Comorbidities
© American Academy of Sleep Medicine 2016

Existing Medical Conditions Medical Condition % of respondents
Hypertension (n=288)
Diabetes (n=111)
Asthma and Other Breathing Problems (COPD, Emphysema, etc.) (n=122)
Insomnia (n=134)
Depression, Anxiety or Other Mental Health Problems (n=176)
Heart Disease (n=54)
None of the above (n=70)
60%
24%
25%
29%
37%
13%
14%
© American Academy of Sleep Medicine 2016

Sleep Quality in Patients with Hypertension
Before and after sleep apnea treatment
Base: n=302On a scale of 1 meaning ‘very bad’ to 5 meaning ‘Very good’, how would you rate the quality of your sleep before and after treatment for sleep apnea?
Sleep Quality (n=302)
Before After
40%
36%
4%
16%
17%
5%
45%
34%
After
Before
3%
32%
8%
34%
22%
22%
40%
7%
27%
5%New User (under 5 years) (n=114)
After
Before
13%
14%
46%
4%
39%
40%42%Mid-Term User (5 – 10 years) (n=109)
After
Before
14%
9%
49%
5%
35%
3% 53%30%Long-Term User (Over 10 years) (n=79)
5 - Very good 4 3 2 1 -Very bad
© American Academy of Sleep Medicine 2016

Hypertension SeverityBefore and after sleep apnea treatment
Hospital visits for HypertensionHypertension seriousness before and after treatment of OSA
Base: n=288 (Percentages under 3% are not shown for transparency).
Before Today
6% 4%
10%
40%
14%
32%
36%
12%
43%1 - Not Serious
2
3
4
5 - Life Threaten-ing
81%
6%5%
7%
Zero Once Twice Three times Four or more times
88%
4% 4%
Before Since Treatment
Mean: 1.5 Times Mean: 0.8 Times
© American Academy of Sleep Medicine 2016

Blood Pressure Improvement and Medication Usage
Before and after sleep apnea treatment
Change in Blood Pressure Medication following 1 year of OSA treatment
Change in Blood Pressure following OSA treatment
Slightly Decreased (1%-
49% lower dose)
Significantly Decreased (50%+
lower dose)
Significantly Increased (50%+
higher dose)
Significantly improved
Slightly improved
19%
22%1%
8%
9%
Began medication after treatment started
Have never taken medication
No Change
Stopped taking medication after change
4%
3%
65%
3%Do not remember11%
48% No Change
Base: n=288
© American Academy of Sleep Medicine 2016

Sleep Quality in Patients with Heart DiseaseBefore and after sleep apnea treatment – By years of treatment
Base: n=66On a scale of 1 meaning ‘very bad’ to 5 meaning ‘Very good’, how would you rate the quality of your sleep before and after treatment for sleep apnea?
Sleep Quality (n=66)
Before After
50%
32%
9%
21%
9%
47%
26%
After
Before
5%
45%
9%
27%
27%
9%
50%
18%
9%
New User (under 5 years) (n=22)
After
Before
4%
52%
20%
8%
52%24%
40%Mid-Term User (5 – 10 years) (n=25)
After
Before
16%
11%
37%
11%
47%
53%26%Long-Term User (over 10 years) (n=19)
5 - Very good 4 3 2 1 -Very bad
© American Academy of Sleep Medicine 2016

Heart Disease SeverityBefore and after sleep apnea treatment
Heart Disease seriousness before and after OSA treatment
Before Today
30%
6%
26%
11%
22%
26%
15%
43%
7%15%
1 - Not Serious
2
3
4
5 - Life Threaten-ing
Base: n=54 (Percentages under 3% are not shown for transparency).
Heart disease related hospital visits
30%
17%24%
9%
20%
Zero Once Twice Three times Four or more times
46%
11%
20%
7%
13%
Before Since Treatment
Mean: 2.4 Times Mean: 2.2 Times
© American Academy of Sleep Medicine 2016

Heart Disease Improvement and Medication Usage
Before and after sleep apnea treatment
Base: n=54
Change in Heart Disease Following OSA Treatment
Change in Heart Disease Medication Usage After 1 year of OSA Treatment
Decreased (1%-49% lower
dose)
Decreased (50%+ lower
dose)
Increased (50%+ higher
dose)
Increased (1%-49% higher
dose)
4%
6%
6%
9%
Slightly worsened
Significantly worsened
Significantly improved
Slightly improved
30%
26%
4%
2%
No Change37%
Began medication after treatment started
Have never taken medication
No Change
Stopped taking medication after change
4%
17%
54%
2%Do not remember 2%
© American Academy of Sleep Medicine 2016

Quality of Sleep in Patients with DiabetesBefore and after sleep apnea treatment – By years of treatment
Base: n=122On a scale of 1 meaning ‘very bad’ to 5 meaning ‘Very good’, how would you rate the quality of your sleep before and after treatment for sleep apnea?
Sleep Quality (n=122)
Before After
42%
33%
20%
25%
42%
30%After
Before
7%
39%
32%
27%
37%
5%
24%
27%New User (under 5 years) (n=41)
After
Before
24%
20%
42%34%
44%36%Mid-Term User (5 – 10 years) (n=50)
After
Before
3%
19%
16%
13%
48%
6%
32%
3% 58%Long-Term User (over 10 years) (n=31)
5 - Very good 4 3 2 1 -Very bad
© American Academy of Sleep Medicine 2016

Diabetes SeverityBefore and after sleep apnea treatment
Diabetes seriousness before and after OSA treatment
Before Today
4%
17%11%
38%
28%
24%
35%
17%26%
1 - Not Serious
2
3
4
5 - Life Threaten-ing
Base: n=111 (Percentages under 3% are not shown for transparency).
Diabetes related hospital visits before and 1 year after OSA treatment
69%
9%
9%4%
9%
Zero Once Twice Three times Four or more times
81%
6%4%
6%
Before Since Treatment
Mean: 2.8 Times Mean: 1.5 Times
© American Academy of Sleep Medicine 2016

Diabetes Improvement and Medication UsageBefore and after sleep apnea treatment
Base: n=111
Change in hemoglobin A1C test score following OSA treatment
Slightly worsened
Significantly worsened
Significantly improved
Slightly improved
8%
23%
3%
0%
Change in diabetes medication usage 1 year after OSA treatment
Decreased (1%-49% lower dose)
Decreased (50%+ lower dose)
Increased (50%+ higher dose)
Increased (1%-49% higher dose)
8%
13%
5%
3%No Change42%
Began medication after treatment started
Have never taken medication
No Change
Stopped taking medication after change
5%
5%
60%
3%Do not remember
23%
© American Academy of Sleep Medicine 2016

Quality of Sleep in Patients with Asthma/Breathing Problems
Before and after sleep apnea treatment – By years of treatment
Sleep Qualilty (n=129)
Before After
44%
33%
5%
13%
22%
7%
45%
28%
Base: n=129On a scale of 1 meaning ‘very bad’ to 5 meaning ‘Very good’, how would you rate the quality of your sleep before and after treatment for sleep apnea?
After
Before
7%
32%
18%
20%
48%
9%
25%
5% 34%New User (under 5 years) (n=44)
After
Before
22%
12%
37%
6%
39%
41%41%Mid-Term User (5 – 10 years) (n=49)
After
Before
6%
25%
25%
6%
53%
6%
17%
3% 61%Long-Term User (over 10 years) (n=36)
5 - Very good 4 3 2 1 -Very bad
© American Academy of Sleep Medicine 2016

Asthma/Breathing Problems SeverityBefore and after sleep apnea treatment
Asthma or other Breathing Problems seriousness before and after OSA
treatment
Before Today
10% 5%
22%
11%
40%
37%
20%
26%
7%20%
1 - Not Serious
2
3
4
5 - Life Threaten-ing
Base: n=122 (Percentages under 3% are not shown for transparency).
Asthma or Other Breathing Problems related hospital visits before and 1 year after OSA treatment
57%
11%
11%
3%
19%
Zero Once Twice Three times Four or more times
57%
9%
12%
9%
13%
Before Since Treatment
Mean: 2.2 Times Mean: 1.9 Times
© American Academy of Sleep Medicine 2016

Change in medication usage for asthma or other breathing problems after 1 year of OSA treatment
Base: n=122
Change in breathing function following OSA treatment
Decreased (1%-49% lower dose)
Decreased (50%+ lower dose)
Increased (50%+ higher dose)
Increased (1%-49% higher dose)
2%
6%
7%
9%
Slightly worsened
Significantly worsened
Significantly improved
Slightly improved
24%
30%
4%
2%
No Change38%
Asthma/Breathing Problems Improvement and Medication Usage
Before and after sleep apnea treatment
Began medication after treatment started
Have never taken medication
No Change
Stopped taking medication after change
9%
6%
58%
3%Do not remember 2%
© American Academy of Sleep Medicine 2016

Quality of Sleep in Patients with InsomniaBefore and after sleep apnea treatment – By Years of Treatment
Base: n=146On a scale of 1 meaning ‘very bad’ to 5 meaning ‘Very good’, how would you rate the quality of your sleep before and after treatment for sleep apnea?
Sleep Quality (n=146)
Before After
54%
30%
6%
8%
28%
5%
22%
43%
After
Before
11%
31%
22%
12%
45%22%
6% 51%New User (under 5 years)(n=65)
After
Before
38%
4%
36%
4%
23%
55%34%Mid-Term User (5 – 10 years) (n=47)
After
Before
3%
24%
26%
6%
50%
6%
21%
6% 59%Long-Term User (over 10 years) (n=34)
5 - Very good 4 3 2 1 -Very bad
© American Academy of Sleep Medicine 2016

Insomnia seriousness before and after OSA treatment
Before Today
13%
34%
7%
37%
24%
13%
31%
3%
34% 1 - Not Serious
2
3
4
5 - Life Threaten-ing
Base: n=134 (Percentages under 3% are not shown for transparency).
Healthcare provider visits before and after OSA treatment
30%
13%
18%
10%
28%
Zero Once Twice Three times Four or more times
46%
12%
15%
8%
19%
Before Since Treatment
Mean: 4.3 Times Mean: 3.3 Times
Insomnia SeverityBefore and after sleep apnea treatment
© American Academy of Sleep Medicine 2016

Change in insomnia medication usage 1 year following OSA treatment
Insomnia Improvement and Medication UsageBefore and after sleep apnea treatment
Base: n=134
Change in insomnia symptoms and frequency following OSA treatment
Decreased (1%-49% lower dose)
Decreased (50%+ lower dose)
Increased (50%+ higher dose)
Increased (1%-49% higher dose)
0%
7%
6%
6%
Slightly worsened
Significantly worsened
Significantly improved
Slightly improved
45%
28%
1%
0%
No Change22%
Began medication after treatment started
Have never taken medication
No Change
Stopped taking medication after change
3%
38%
29%
11%Do not remember 5%
© American Academy of Sleep Medicine 2016

Quality of Sleep in Patients with Depression/Mental Health Problems
Before and after sleep apnea treatment – By years of treatment
Sleep Quality (n=186)
Base: n=186On a scale of 1 meaning ‘very bad’ to 5 meaning ‘Very good’, how would you rate the quality of your sleep before and after treatment for sleep apnea?
Before After
46%
34%
4%
13%
25%
4%
45%
26%
After
Before
6%
32%
26%
19%
37%
4%
29%
4% 41%New User (under 5 years) (n=78)
After
Before
29%
7%
47%
3%
22%
50%39%Mid-Term User (5- 10 years) (n=58)
After
Before
18%
10%
56%
6%
24%
50%32%Long-Term User (over 10 years) (n=50)
5 - Very good 4 3 2 1 -Very bad
© American Academy of Sleep Medicine 2016

Depression, Anxiety or Other Mental Health Problems Severity
Before and after sleep apnea treatment
Depression, Anxiety or Other Mental Health problems seriousness before and
after OSA treatment
Before Today
8%
30%
14%
33%
23%
20%
31%
10%
30% 1 - Not Serious
2
3
4
5 - Life Threaten-ing
Base: n=176 (Percentages under 3% are not shown for transparency).
Depression, Anxiety/Mental Health problems healthcare providers visits before and 1 year after OSA treatment
15%
6%
7%
10%62%
Zero Once Twice Three times Four or more times
23%
7%
12%
5%
53%
Before Since Treatment
Mean: 18.2 Times Mean: 14.8 Times
© American Academy of Sleep Medicine 2016

Base: n=176
Days without feelings of depression, anxiety/ mental health problems before and after treatment of OSA
Change in Depression, Anxiety/ Mental Health problems medication usage after 1 year of OSA
treatment
Decreased (1%-49% lower dose)
Decreased (50%+ lower dose)
Increased (50%+ higher dose)
Increased (1%-49% higher dose)
6%
10%
9%
7%
Slightly worsened
Significantly worsened
Significantly improved
Slightly improved
23%
26%
1%
2%
No Change38%
Depression, Anxiety or Other Mental Health Problems Improvement and Medication Usage
Before and after sleep apnea treatment
Began medication after treatment started
Have never taken medication
No Change
Stopped taking medication after change
2%
6%
58%
4%Do not remember10%
© American Academy of Sleep Medicine 2016

Mental Health AttributesBefore and after sleep apnea treatment
Quality of Life Relationship with Bed Partner
Before After
12%22%
13%
28%
Before After
9%
37%17%
39%
Degree of PatienceQuality of Mood
4 - Good 5 - Very good
Base: n=506On a scale of 1 meaning ‘very bad’ to 5 meaning ‘Very good’, how would you rate <attribute> before your treatment for sleep apnea and today? (Percentages under 3% not shown for transparency).
Before After
19%36%
12%
37%
Before After
18%34%
12%
37%
Top 2 Box (‘Good’ and Very ‘Good’)
© American Academy of Sleep Medicine 2016

Substance Abuse and Weight Before and after sleep apnea treatment
Sleeping PillsSleeping Pills
Alcoholic Drinks Alcoholic Drinks
Cigarettes Cigarettes
Vs
30%
10%
12%16%
9%
7%
16%
No Change Gained 1-10 poundsGained 11-20 pounds Gained 20 pounds or moreLost 1-10 pounds Lost 11-20 poundsLost 20 pounds or more
2.9
22.3
1.4
2
8.5
1.1
Then (Per week)
Now(Per week)
Mean Score
Mean Score
Mean Score
Mean Score
Mean Score
Mean Score
Q68. Weight Gain/ Loss (since beginning of treatment)
Q62-Q67. Before treatment how many cigarettes/ alcoholic drinks/ sleeping pills did you smoke/ drink/ take on average per week? And how many since treatment?
Lost
Gained
© American Academy of Sleep Medicine 2016

Summary of Findings
© American Academy of Sleep Medicine 2016

OSA Treatment Economic Analysis• Annual per patient diagnosis and
treatment costs are 67% less than leaving patients undiagnosed
• Diagnosing and treating all 29.4M Americans with OSA could save $100.1 billion
• Biggest opportunity cost involves lost workplace productivity
© American Academy of Sleep Medicine 2016

Diagnosis and Treatment of OSA – The Patient Perspective
Physician specialists most common provider warning about OSA risk
Only 30-40% began discussions about OSA with PCP 70% received OSA diagnosis <2 months after initial risk
identification PAP therapy most common
treatment Over time, PAP use may drop
in favor of weight loss and sleep positioning
However, weight loss not emphasized
© American Academy of Sleep Medicine 2016

OSA Treatment Benefits – The Patient Perspective
Respondents gained an additional 1.7 hours of sleep after treatment
11x increase reporting sleep as “good” or “very good” following treatment with a long-term persistence effect beyond initial adoption
The percentage of respondents stating their quality of life was “good/very good” tripled (26% vs. 76%) following treatment
Satisfaction with bed partner relationship, mood and patience doubled
Use of alcohol, cigarettes, and sleeping aids substantially declined post-treatment
Productive work time grew 17% after treatment Work absences declined 40% after treatment
© American Academy of Sleep Medicine 2016

Treating OSA Saves Patients MoneyHome• Decrease in direct medical costs and co-pays:o 3% of OSA patients with hypertension able to stop and another 17% decrease medicationo Diabetics with treated OSA report nearly half (2.8 vs. 1.5) the annual hospital visits
• Reducing use of depressives and stimulants to manage symptoms:o 31% fewer alcoholic drinks = $187.20 savings per year ($4 per drink)o 62% fewer cigarettes = $197.70 savings per year ($0.28 per cigarette)o 21% fewer sleeping pills = $31.20 savings per year ($2 per pill)
• Reducing cost of auto accidents and higher insurance premiums
Source: 2015 Frost & Sullian survey of 506 treated OSA patients in United States. Bureau of Labor Statistics.
Workplace• 1.8 days fewer workplace absences per year = $363.46 new earnings per year for hourly workers• 1.2 hours of increased productivity per day = Equivalent to $4,274.25 more value per employee and contributing to promotions, bonuses, and greater job stability for patients
© American Academy of Sleep Medicine 2016

Out-of-Pocket Patient Spending on OSA• 78% said OSA treatment a good investment relative to what they spent out-of-pocket
• Respondents willing to spend a an average of $612 per year on OSA treatment
• ~1/3 unwilling to spend ANYTHING for OSA treatment despite benefits
© American Academy of Sleep Medicine 2016

OSA Treatment Has a Major Impact on Comorbidities
After one year, patients surveyed state OSA treatment delivers…
Hypertension •41% report blood pressure improvement•17% report decrease in medication usage
Diabetes •31% report improved HbA1c •14x increase in “good quality” sleep
Asthma & Breathing Conditions
•54% report improved respiratory function•70% increase in patients reporting symptoms as mild•8x increase in “good quality” sleep
© American Academy of Sleep Medicine 2016

OSA Treatment Has a Major Impact on Comorbidities
ZZZ
After one year, patients surveyed state OSA treatment delivers…
Insomnia •7x increase in good quality sleep• Decline from 54% to 1% reporting “very bad” quality sleep
Depression, Anxiety and Mental Health
•12x increase in “good quality” sleep•4x reduction in reported life threatening mental health condition•49% report improved mental health
Heart Disease•56% report reduced heart disease risk•5x decrease in self-reported life-threatening heart disease • Decline from 50% to 3% reporting “very bad” quality sleep• Increase from 0% to 26% reporting “very good” quality sleep
© American Academy of Sleep Medicine 2016