PowerPoint Presentation -...
12
November, 2016 Credit Suisse Technology, Media & Telecom Conference Terrence Curtin President
Transcript of PowerPoint Presentation -...

November, 2016
Credit Suisse Technology, Media & Telecom Conference
Terrence Curtin
President
Forward-Looking Statementsand Non-GAAP Measures
2
Forward-Looking StatementsThis presentation contains certain “forward-looking statements” within the meaning of the U.S. Private Securities Litigation Reform Act of
1995. These statements are based on management’s current expectations and are subject to risks, uncertainty and changes in
circumstances, which may cause actual results, performance, financial condition or achievements to differ materially from anticipated results,
performance, financial condition or achievements. All statements contained herein that are not clearly historical in nature are forward-looking
and the words “anticipate,” “believe,” “expect,” “estimate,” “plan,” and similar expressions are generally intended to identify forward-looking
statements. We have no intention and are under no obligation to update or alter (and expressly disclaim any such intention or obligation to do
so) our forward-looking statements whether as a result of new information, future events or otherwise, except to the extent required by law.
The forward-looking statements in this presentation include statements addressing our future financial condition and operating results.
Examples of factors that could cause actual results to differ materially from those described in the forward-looking statements include,
among others, business, economic, competitive and regulatory risks, such as conditions affecting demand for products, particularly in the
automotive and data and devices industries; competition and pricing pressure; fluctuations in foreign currency exchange rates and
commodity prices; natural disasters and political, economic and military instability in countries in which we operate; developments in the
credit markets; future goodwill impairment; compliance with current and future environmental and other laws and regulations; and the
possible effects on us of changes in tax laws, tax treaties and other legislation. More detailed information about these and other factors is set
forth in TE Connectivity Ltd.’s Annual Report on Form 10-K for the fiscal year ended Sept. 30, 2016 as well as in our Quarterly Reports on
Form 10-Q, Current Reports on Form 8-K and other reports filed by us with the U.S. Securities and Exchange Commission.
Non-GAAP MeasuresWhere we have used non-GAAP financial measures, reconciliations to the most comparable GAAP measure are provided, along with a
disclosure on the usefulness of the non-GAAP measure, in this presentation.
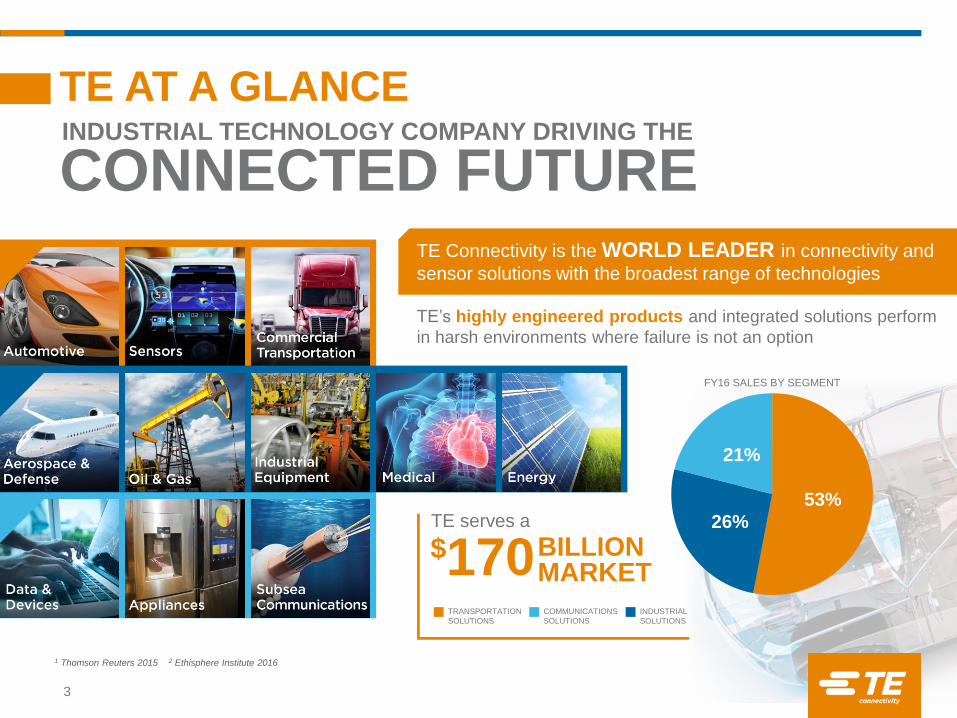
INDUSTRIAL TECHNOLOGY COMPANY DRIVING THE
CONNECTED FUTURE
TE AT A GLANCE
TE Connectivity is the WORLD LEADER in connectivity and
sensor solutions with the broadest range of technologies
TE’s highly engineered products and integrated solutions perform
in harsh environments where failure is not an option
TE serves a
BILLIONMARKET
$170TRANSPORTATION
SOLUTIONS
INDUSTRIAL
SOLUTIONS
COMMUNICATIONS
SOLUTIONS
53%
26%
21%
FY16 SALES BY SEGMENT
3
1 Thomson Reuters 2015 2 Ethisphere Institute 2016
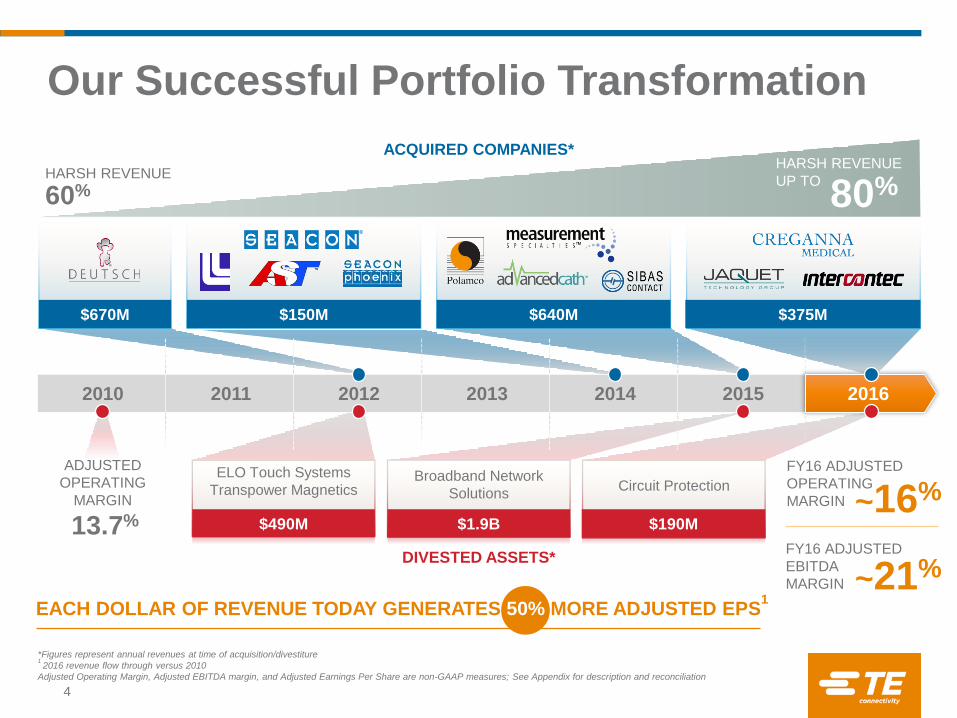
*Figures represent annual revenues at time of acquisition/divestiture1 2016 revenue flow through versus 2010
Adjusted Operating Margin, Adjusted EBITDA margin, and Adjusted Earnings Per Share are non-GAAP measures; See Appendix for description and reconciliation
Our Successful Portfolio Transformation
EACH DOLLAR OF REVENUE TODAY GENERATES 50% MORE ADJUSTED EPS1
2010 2011 2012 2013 2014 2015 2016
FY16 ADJUSTED
OPERATING
MARGIN
ADJUSTED
OPERATING
MARGIN
13.7%
$375M$640M$150M$670M
FY16 ADJUSTED
EBITDA
MARGIN
4
HARSH REVENUE
UP TO
80%
ACQUIRED COMPANIES*
HARSH REVENUE
60%
DIVESTED ASSETS*
ELO Touch Systems
Transpower MagneticsBroadband Network
SolutionsCircuit Protection
$190M$1.9B$490M~16%
~21%
Electronic Content Growth is a Secular Trend Across Our Businesses
$6.5B
$2.5B
$3.2B
TRANSPORTATIONSOLUTIONS
FISCAL 2016 SALES SECULAR GROWTH DRIVERS
ADAS/
Safety
Emissions &
Infotainment
Sensor
Expansion
INDUSTRIALSOLUTIONS
Smart
Factory
New Aircraft
DesignsMedical Components
Integration
COMMUNICATIONSSOLUTIONS
IoT Growth of
Cloud
Smart
Appliances
Source: Gartner
5
4-6%
AUTO CONTENT
GROWTH
PER YEAR
2X INCREASE IN CONTENT
IN SMART FACTORIES
7%MINIMALLY INVASIVE
MEDICAL MARKET GROWING
ANNUALLY
6.4BCONNECTED THINGS TODAY
GROWING TO
CONNECTED
THINGS IN 2020
20.8B
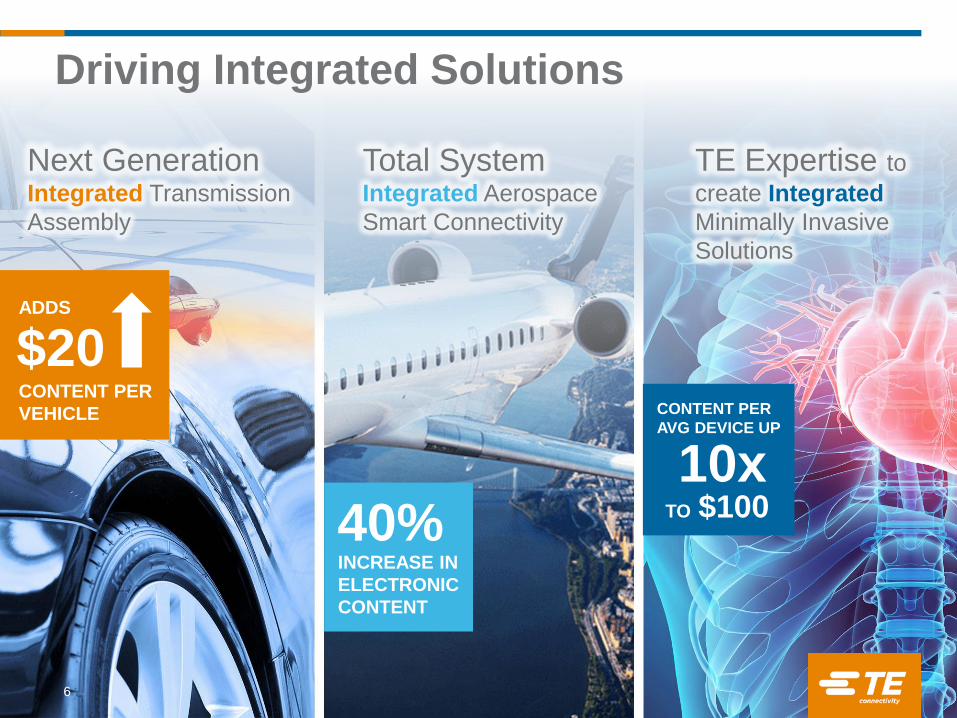
Driving Integrated Solutions
6
$20ADDS
CONTENT PER
VEHICLE
6
Next Generation Integrated Transmission
Assembly
40%INCREASE IN
ELECTRONIC
CONTENT
Total System Integrated Aerospace
Smart Connectivity
TE Expertise to
create Integrated
Minimally Invasive
Solutions
10x
CONTENT PER
AVG DEVICE UP
TO $100
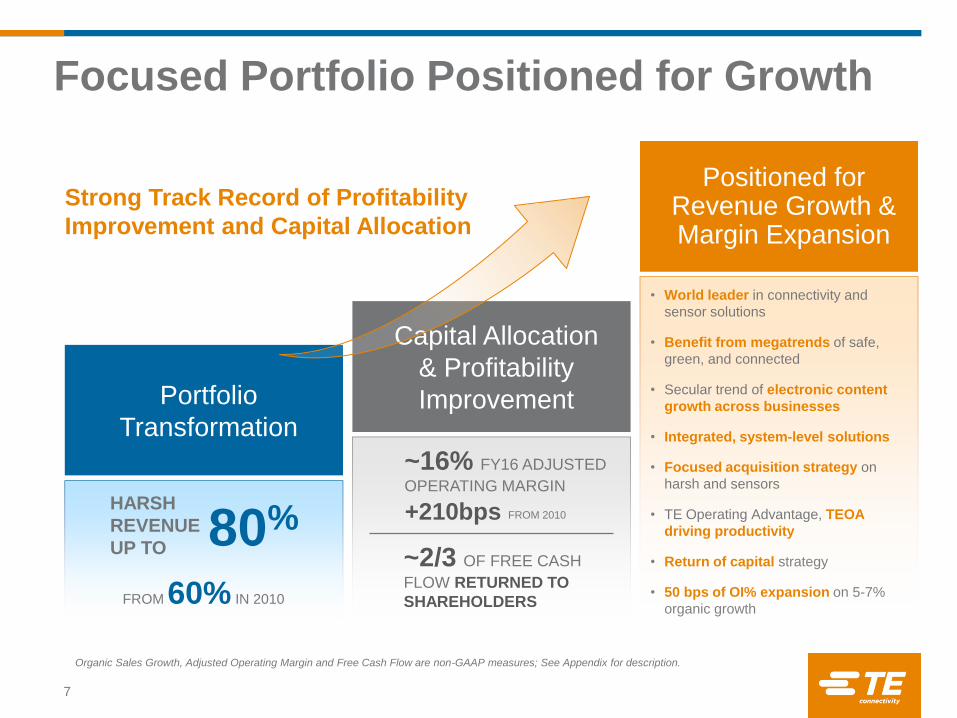
• World leader in connectivity and
sensor solutions
• Benefit from megatrends of safe,
green, and connected
• Secular trend of electronic content
growth across businesses
• Integrated, system-level solutions
• Focused acquisition strategy on
harsh and sensors
• TE Operating Advantage, TEOA
driving productivity
• Return of capital strategy
• 50 bps of OI% expansion on 5-7%
organic growth
Organic Sales Growth, Adjusted Operating Margin and Free Cash Flow are non-GAAP measures; See Appendix for description.
Positioned for Revenue Growth & Margin Expansion
Strong Track Record of Profitability
Improvement and Capital Allocation
Capital Allocation
& Profitability
ImprovementPortfolio
Transformation
80%HARSH
REVENUE
UP TO
FROM 60% IN 2010
~16% FY16 ADJUSTED
OPERATING MARGIN
+210bps FROM 2010
~2/3 OF FREE CASH
FLOW RETURNED TO
SHAREHOLDERS
Focused Portfolio Positioned for Growth
7

Non-GAAP Measures
8
“Organic Net Sales Growth,” “Adjusted Operating Income,” “Adjusted Operating Margin,” “Adjusted Other Income, Net,” “Adjusted Income Tax Expense,” “Adjusted
Effective Tax Rate,” ”Adjusted Income from Continuing Operations,” “Adjusted Earnings Per Share,” “Adjusted EBITDA,” “Adjusted EBITDA Margin,” and “Free Cash
Flow” are non-GAAP measures and should not be considered replacements for results in accordance with accounting principles generally accepted in the U.S.
(“GAAP”). These non-GAAP measures may not be comparable to similarly-titled measures reported by other companies. The primary limitation of these measures is
that they exclude the financial impact of items that would otherwise either increase or decrease our reported results. This l imitation is best addressed by using these
non-GAAP measures in combination with the most directly comparable GAAP measures in order to better understand the amounts, character and impact of any
increase or decrease in reported amounts. The following provides additional information regarding these non-GAAP measures:
Organic Net Sales Growth – is a useful measure of our underlying results and trends in the business. It is also a significant component in our incentive compensation
plans. The difference between reported net sales growth (the most comparable GAAP measure) and Organic Net Sales Growth consists of the impact from foreign
currency exchange rates and acquisitions and divestitures, if any. Organic Net Sales Growth is a useful measure of our performance because it excludes items that: i)
are not completely under management’s control, such as the impact of changes in foreign currency exchange rates; or ii) do no t reflect the underlying growth of the
company, such as acquisition and divestiture activity.
Adjusted Operating Income – represents operating income (the most comparable GAAP measure) before special items including charges or income related to
restructuring and other charges, acquisition related charges, impairment charges, and other income or charges, if any. We uti lize Adjusted Operating Income to assess
segment level core operating performance and to provide insight to management in evaluating segment operating plan execution and underlying market conditions. It
also is a significant component in our incentive compensation plans. Adjusted Operating Income is useful to investors because it provides insight into our underlying
operating results, trends, and the comparability of these results between periods.
Adjusted Operating Margin – represents operating margin (the most comparable GAAP measure) before special items including charges or income related to
restructuring and other charges, acquisition related charges, impairment charges, and other income or charges, if any. We present Adjusted Operating Margin before
special items to give investors a perspective on the underlying business results. This measure should be considered in conjunction with operating margin calculated
using our GAAP results in order to understand the amounts, character and impact of adjustments to operating margin.
Adjusted Other Income, Net – represents other income, net (the most comparable GAAP measure) before special items including tax sharing income related to certain
proposed adjustments to prior period tax returns and other tax items, if any. We present Adjusted Other Income, Net as we believe that it is appropriate for investors to
consider results excluding these items in addition to results in accordance with GAAP.
Adjusted Income Tax Expense – represents income tax expense (the most comparable GAAP measure) after adjusting for the tax effect of special items including
charges related to restructuring and other charges, acquisition related charges, impairment charges, other income or charges, and certain significant special tax items,
if any. We present Adjusted Income Tax Expense to provide investors further information regarding the tax effects of adjustments used in determining the non-GAAP
financial measure Adjusted Income from Continuing Operations (as defined below).
Adjusted Effective Tax Rate – represents effective income tax rate (the most comparable GAAP measure) after adjusting for the tax effect of special items including
charges related to restructuring and other charges, acquisition related charges, impairment charges, other income or charges, and certain significant special tax items,
if any. We present Adjusted Effective Tax Rate to provide investors further information regarding the tax rate effects of adjustments used in determining the non-GAAP
financial measure Adjusted Income from Continuing Operations (as defined below).
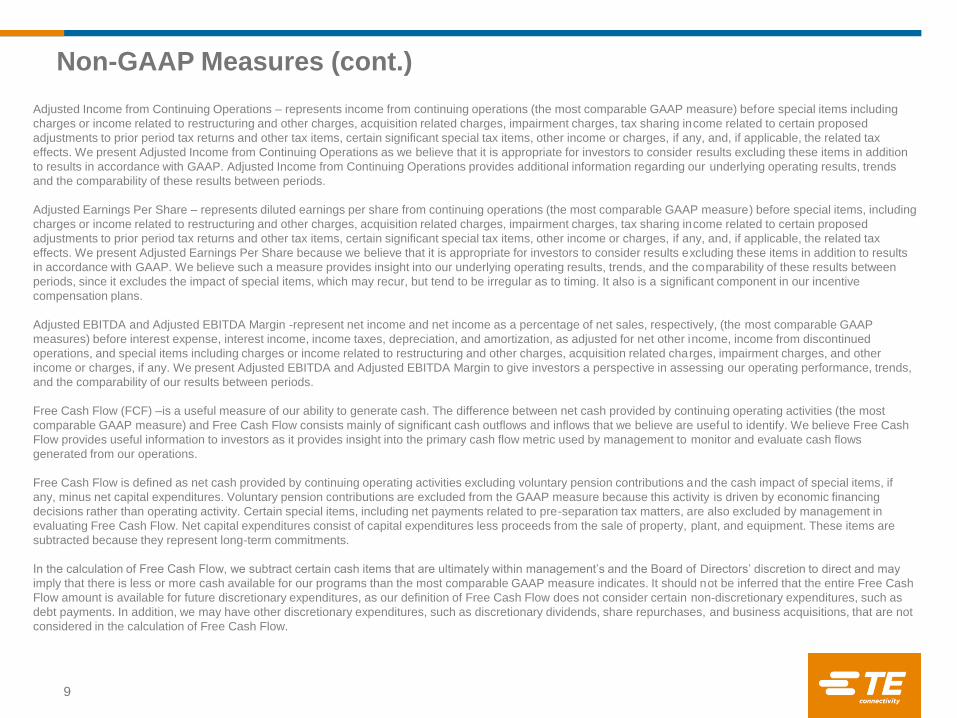
Non-GAAP Measures (cont.)
9
Adjusted Income from Continuing Operations – represents income from continuing operations (the most comparable GAAP measure) before special items including
charges or income related to restructuring and other charges, acquisition related charges, impairment charges, tax sharing income related to certain proposed
adjustments to prior period tax returns and other tax items, certain significant special tax items, other income or charges, if any, and, if applicable, the related tax
effects. We present Adjusted Income from Continuing Operations as we believe that it is appropriate for investors to consider results excluding these items in addition
to results in accordance with GAAP. Adjusted Income from Continuing Operations provides additional information regarding our underlying operating results, trends
and the comparability of these results between periods.
Adjusted Earnings Per Share – represents diluted earnings per share from continuing operations (the most comparable GAAP measure) before special items, including
charges or income related to restructuring and other charges, acquisition related charges, impairment charges, tax sharing income related to certain proposed
adjustments to prior period tax returns and other tax items, certain significant special tax items, other income or charges, if any, and, if applicable, the related tax
effects. We present Adjusted Earnings Per Share because we believe that it is appropriate for investors to consider results excluding these items in addition to results
in accordance with GAAP. We believe such a measure provides insight into our underlying operating results, trends, and the comparability of these results between
periods, since it excludes the impact of special items, which may recur, but tend to be irregular as to timing. It also is a significant component in our incentive
compensation plans.
Adjusted EBITDA and Adjusted EBITDA Margin -represent net income and net income as a percentage of net sales, respectively, (the most comparable GAAP
measures) before interest expense, interest income, income taxes, depreciation, and amortization, as adjusted for net other income, income from discontinued
operations, and special items including charges or income related to restructuring and other charges, acquisition related charges, impairment charges, and other
income or charges, if any. We present Adjusted EBITDA and Adjusted EBITDA Margin to give investors a perspective in assessing our operating performance, trends,
and the comparability of our results between periods.
Free Cash Flow (FCF) –is a useful measure of our ability to generate cash. The difference between net cash provided by continuing operating activities (the most
comparable GAAP measure) and Free Cash Flow consists mainly of significant cash outflows and inflows that we believe are useful to identify. We believe Free Cash
Flow provides useful information to investors as it provides insight into the primary cash flow metric used by management to monitor and evaluate cash flows
generated from our operations.
Free Cash Flow is defined as net cash provided by continuing operating activities excluding voluntary pension contributions and the cash impact of special items, if
any, minus net capital expenditures. Voluntary pension contributions are excluded from the GAAP measure because this activity is driven by economic financing
decisions rather than operating activity. Certain special items, including net payments related to pre-separation tax matters, are also excluded by management in
evaluating Free Cash Flow. Net capital expenditures consist of capital expenditures less proceeds from the sale of property, plant, and equipment. These items are
subtracted because they represent long-term commitments.
In the calculation of Free Cash Flow, we subtract certain cash items that are ultimately within management’s and the Board of Directors’ discretion to direct and may
imply that there is less or more cash available for our programs than the most comparable GAAP measure indicates. It should not be inferred that the entire Free Cash
Flow amount is available for future discretionary expenditures, as our definition of Free Cash Flow does not consider certain non-discretionary expenditures, such as
debt payments. In addition, we may have other discretionary expenditures, such as discretionary dividends, share repurchases, and business acquisitions, that are not
considered in the calculation of Free Cash Flow.
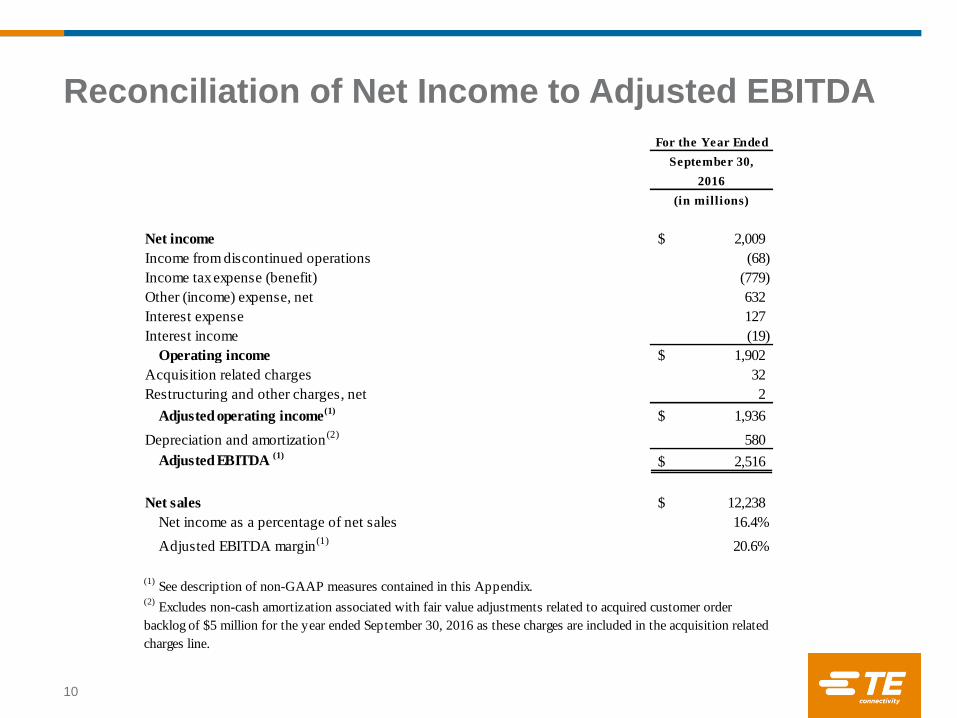
Reconciliation of Net Income to Adjusted EBITDA
10
For the Year Ended
September 30,
2016
(in millions)
Net income 2,009$
Income from discontinued operations (68)
Income tax expense (benefit) (779)
Other (income) expense, net 632
Interest expense 127
Interest income (19)
Operating income 1,902$
Acquisition related charges 32
Restructuring and other charges, net 2
Adjusted operating income(1)
1,936$
Depreciation and amortization(2)
580
Adjusted EBITDA (1)
2,516$
Net sales 12,238$
Net income as a percentage of net sales 16.4%
Adjusted EBITDA margin(1)
20.6%
(1) See description of non-GAAP measures contained in this Appendix.
(2) Excludes non-cash amortization associated with fair value adjustments related to acquired customer order
backlog of $5 million for the year ended September 30, 2016 as these charges are included in the acquisition related
charges line.
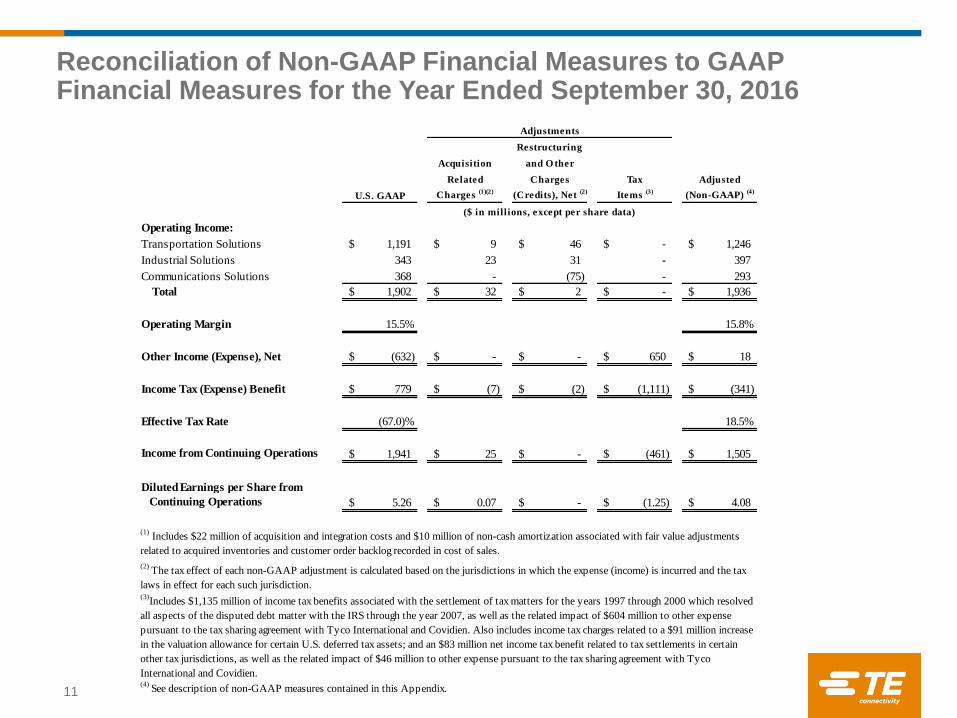
Reconciliation of Non-GAAP Financial Measures to GAAP Financial Measures for the Year Ended September 30, 2016
11
Restructuring
Acquisition and O ther
Related Charges Tax Adjusted
U.S. GAAP Charges (1)(2)
(Credits), Net (2)
Items (3)
(Non-GAAP) (4)
Operating Income:
Transportation Solutions 1,191$ 9$ 46$ -$ 1,246$
Industrial Solutions 343 23 31 - 397
Communications Solutions 368 - (75) - 293
Total 1,902$ 32$ 2$ -$ 1,936$
Operating Margin 15.5% 15.8%
Other Income (Expense), Net (632)$ -$ -$ 650$ 18$
Income Tax (Expense) Benefit 779$ (7)$ (2)$ (1,111)$ (341)$
Effective Tax Rate (67.0)% 18.5%
Income from Continuing Operations 1,941$ 25$ -$ (461)$ 1,505$
Diluted Earnings per Share from
Continuing Operations 5.26$ 0.07$ -$ (1.25)$ 4.08$
($ in millions, except per share data)
(1) Includes $22 million of acquisition and integration costs and $10 million of non-cash amortization associated with fair value adjustments
related to acquired inventories and customer order backlog recorded in cost of sales.
(2) The tax effect of each non-GAAP adjustment is calculated based on the jurisdictions in which the expense (income) is incurred and the tax
laws in effect for each such jurisdiction.(3)
Includes $1,135 million of income tax benefits associated with the settlement of tax matters for the years 1997 through 2000 which resolved
all aspects of the disputed debt matter with the IRS through the year 2007, as well as the related impact of $604 million to other expense
pursuant to the tax sharing agreement with Tyco International and Covidien. Also includes income tax charges related to a $91 million increase
in the valuation allowance for certain U.S. deferred tax assets; and an $83 million net income tax benefit related to tax settlements in certain
other tax jurisdictions, as well as the related impact of $46 million to other expense pursuant to the tax sharing agreement with Tyco
International and Covidien.(4)
See description of non-GAAP measures contained in this Appendix.
Adjustments
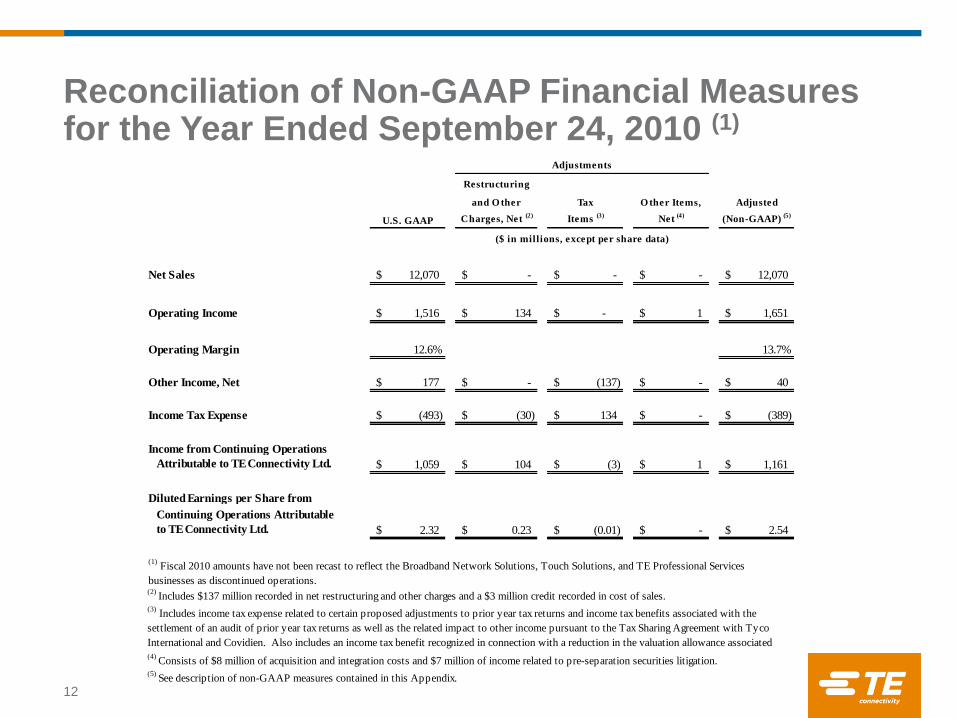
Reconciliation of Non-GAAP Financial Measures for the Year Ended September 24, 2010 (1)
Restructuring
and O ther Tax O ther Items, Adjusted
U.S. GAAP Charges, Net (2)
Items (3)
Net (4)
(Non-GAAP) (5)
Net Sales 12,070$ -$ -$ -$ 12,070$
Operating Income 1,516$ 134$ -$ 1$ 1,651$
Operating Margin 12.6% 13.7%
Other Income, Net 177$ -$ (137)$ -$ 40$
Income Tax Expense (493)$ (30)$ 134$ -$ (389)$
Income from Continuing Operations
Attributable to TE Connectivity Ltd. 1,059$ 104$ (3)$ 1$ 1,161$
Diluted Earnings per Share from
Continuing Operations Attributable
to TE Connectivity Ltd. 2.32$ 0.23$ (0.01)$ -$ 2.54$
(4) Consists of $8 million of acquisition and integration costs and $7 million of income related to pre-separation securities litigation.
(5) See description of non-GAAP measures contained in this Appendix.
(1) Fiscal 2010 amounts have not been recast to reflect the Broadband Network Solutions, Touch Solutions, and TE Professional Services
businesses as discontinued operations.
($ in millions, except per share data)
(2) Includes $137 million recorded in net restructuring and other charges and a $3 million credit recorded in cost of sales.
(3) Includes income tax expense related to certain proposed adjustments to prior year tax returns and income tax benefits associated with the
settlement of an audit of prior year tax returns as well as the related impact to other income pursuant to the Tax Sharing Agreement with Tyco
International and Covidien. Also includes an income tax benefit recognized in connection with a reduction in the valuation allowance associated
with certain tax loss carryforwards.
Adjustments
12
![FY18 June Bernstein.pptx [Read-Only]s1.q4cdn.com/769663331/files/doc_presentations/2018/05/... · 2018-05-31 · Flow consists mainly of significant cash outflows and inflows that](https://static.fdocuments.us/doc/165x107/5e8b755e0a9a73246d6e3708/fy18-june-read-onlys1q4cdncom769663331filesdocpresentations201805.jpg)