Car Top Inspection Stations With Emergency Light, Car Top Inspection Stations, Pendant Stations

1
© V
impelC
om
Ltd
2013 3Q 2013
Presentation Amsterdam, November 6, 2013
Jo Lunder - CEO
Henk van Dalen – CFO
2
© V
impelC
om
Ltd
2013
Disclaimer
This presentation contains “forward-looking statements”, as the phrase is defined in Section 27A of the Securities Act of 1933 and Section 21E of the Securities Exchange Act of 1934. These statements relate to the Company's anticipated performance, expected capital expenditures, network developments in Russia, Italy’s future operating cash flow position, the grant of a 3G license to Orascom Telecom Algeria (OTA), the timing and amount of future payments of dividends by the Company and its ability to realize its strategic initiatives in the various countries of operation. The forward-looking statements included in this presentation are based on management’s best assessment of the Company’s strategic and financial position and of future market conditions and trends. These discussions involve risks and uncertainties. The actual outcome may differ materially from these statements as a result of continued volatility in the economies in our markets, unforeseen developments from competition, governmental regulation of the telecommunications industries, general political uncertainties in our markets and/or litigation with third parties. There can be no assurance that such risks and uncertainties will not have a material adverse effect on the Company. Certain factors that could cause actual results to differ materially from those discussed in any forward-looking statements include the risk factors described in the Company’s Annual Report on Form 20-F for the year ended December 31, 2012 filed with the U.S. Securities and Exchange Commission (the “SEC”) and other public filings made by the Company with the SEC, which risk factors are incorporated herein by reference. The Company disclaims any obligation to update developments of these risk factors or to announce publicly any revision to any of the forward-looking statements contained in this presentation, or to make corrections to reflect future events or developments.

3
© V
impelC
om
Ltd
2013
Stable Underlying 3Q13 Results Impacted by Regulatory Measures and Market Slowdown
Comparisons with 3Q12 * Customer base 2012 has been adjusted for sale of Vietnam and Cambodia and adjustments in Algeria and Ukraine ** Net Income attributable to VimpelCom shareholders
Revenues (USD billion)
5.7 (-1% organic)
EBITDA (USD billion)
2.5 (-2% organic)
EBITDA margin (%)
43.5 (-0.5 p.p.)
Net income**
(USD million)
255 (-53%)
Total mobile subscriber Base* (million)
219 (+5%)
Net cash from operating activities (USD billion)
1.7 (-16%)
• Stable organic revenue YoY excl. MTR cuts in Italy
• Stable organic EBITDA YoY excl. MTR cuts and one-off charges
• EBITDA margin of 43.5%
• Strong mobile data revenue growth
• Solid cash flow of USD 1.7 billion
• Russian operational developments on track
• Continued market outperformance in Italy
Highlights:

4
© V
impelC
om
Ltd
2013
Key Developments
• VimpelCom switched its ADS listing to NASDAQ and was added to NASDAQ-100® Index
• Interim 2013 dividend of USD 791 million or USD 0.45 per share declared
• Awarded 3G license in Bangladesh
• Awarded provisional 3G license in Algeria, exceptional approval to import 3G equipment
• Andrew Davies to start as Group CFO on November 7, 2013
• Mikhail Slobodin started as Head of Business Unit Russia
Analyst & Investor Conference on January 28 and 29, 2014

5
© V
impelC
om
Ltd
2013 Business Units Performance

6
© V
impelC
om
Ltd
2013
Russia 3Q13: Operational Developments on Track with Continued Strong Mobile Data Revenue
Revenues (RUB billion)
61.8 61.6 58.1 61.3 62.4
12.6 12.1 12.0
12.6 13.0
3Q12 4Q12 1Q13 2Q13 3Q13
+1% YoY
32.2 30.4 29.3
31.5 32.1
43.2% 41.3% 41.8% 42.7% 42.6%
3Q12 4Q12 1Q13 2Q13 3Q13
Flat YoY
50.7 56.0
18% 19%
FY12 3Q13 LTM
CAPEX* (RUB billion)
Highlights:
• Mobile service revenues increased 3% YoY
• Mobile data revenue grew 30% YoY, with 35% YoY improvement in data revenues from small screens
• Stable EBITDA as savings from operational excellence program were invested in data network and expansion of owned mono-brand stores
• Mobile subscriber base increased 3% YoY to 58.1 million; mobile broadband subscribers up 20% to 3.0 million
• CAPEX FY13 expected to be up to 22% of revenues
74.5
EBITDA and EBITDA Margin (RUB billion)
73.6 70.1
* CAPEX excluding licenses
73.8
CAPEX CAPEX / Revenue EBITDA EBITDA Margin Mobile Fixed-line
75.4
7
© V
impelC
om
Ltd
2013
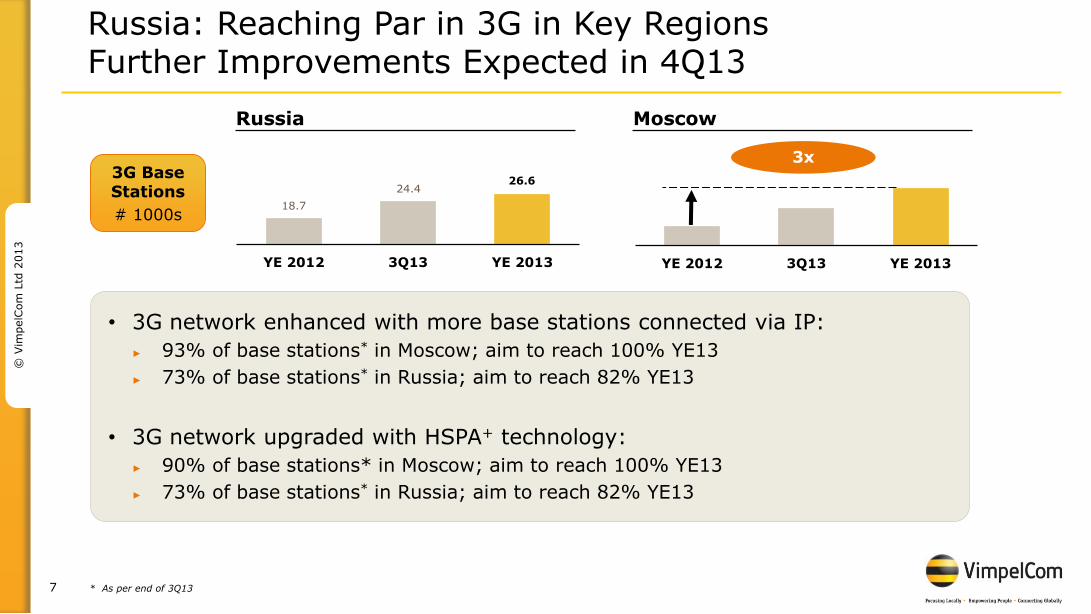
YE 2012 3Q13 YE 2013
3G Base Stations
# 1000s
YE 2012 3Q13 YE 2013
18.7
24.4 26.6
3x
Russia Moscow
Russia: Reaching Par in 3G in Key Regions Further Improvements Expected in 4Q13
• 3G network enhanced with more base stations connected via IP:
► 93% of base stations* in Moscow; aim to reach 100% YE13
► 73% of base stations* in Russia; aim to reach 82% YE13
• 3G network upgraded with HSPA+ technology:
► 90% of base stations* in Moscow; aim to reach 100% YE13
► 73% of base stations* in Russia; aim to reach 82% YE13
* As per end of 3Q13

8
© V
impelC
om
Ltd
2013
• LTE commercially launched in 2 regions
• LTE to be commercially launched in Moscow and 3 other regions in 4Q13
• LTE to be launched in 12 cities with population of more than 1 million in 1H14,
including St. Petersburg, Ekaterinburg, Novosibirsk, N. Novgorod etc.
• Launch of LTE in more regions in 2H14 if supported by market demand
• Ready to adjust LTE network roll out based on market demand
• Sale of iPhone 5s/5c started in October
Russia: Accelerated Plan of LTE Network Roll Out Expect to Cover Half of Population by YE15
LTE Network Roll Out Plan
9
© V
impelC
om
Ltd
2013
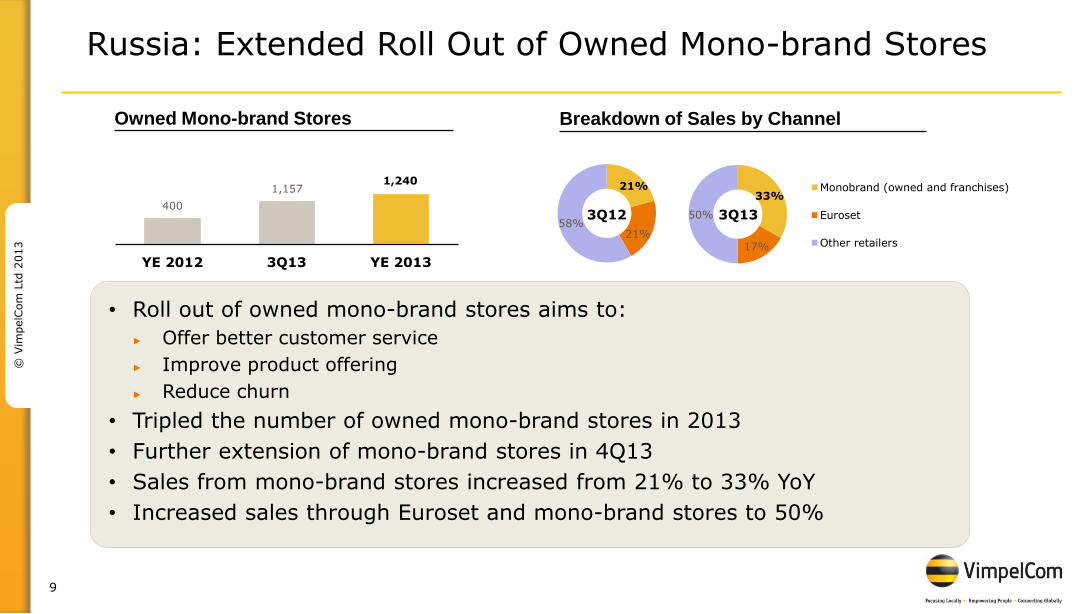
Russia: Extended Roll Out of Owned Mono-brand Stores
• Roll out of owned mono-brand stores aims to:
► Offer better customer service
► Improve product offering
► Reduce churn
• Tripled the number of owned mono-brand stores in 2013
• Further extension of mono-brand stores in 4Q13
• Sales from mono-brand stores increased from 21% to 33% YoY
• Increased sales through Euroset and mono-brand stores to 50%
YE 2012 3Q13 YE 2013
400
1,157 1,240
Owned Mono-brand Stores
33%
17%
50%
Monobrand (owned and franchises)
Euroset
Other retailers
Breakdown of Sales by Channel
3Q12 3Q13
21%
21% 58%

10
© V
impelC
om
Ltd
2013
537 514 461 475
507
40.4% 37.5% 37.5% 37.5% 40.6%
3Q12 4Q12 1Q13 2Q13 3Q13
891 922 838 871 886
68 78 50 56 40
370 369 341 339 325
3Q12 4Q12 1Q13 2Q13 3Q13
Italy 3Q13: Continued Market Outperformance
Total Revenues (EUR million)
-6% YoY Excl. MTR -1% YoY
EBITDA and EBITDA Margin (EUR million)
-6% YoY Excl. MTR -4% YoY
CAPEX* (EUR million)
Highlights:
• Continued outperformance in a highly competitive market environment
• Total revenues at EUR 1.25 billion down 6% YoY; excluding MTR impact, total revenues declined 1%
• EBITDA margin increased to 40.6%; EBITDA down 6%; excluding MTR impact, EBITDA down 4%
• Mobile subscriber base increased 4% YoY to 22.4 million
• Strong data revenue growth: mobile Internet up 44% YoY and fixed broadband up 8% YoY
Mobile revenues (excluding incoming)
Mobile incoming revenues
Fixed-line
905 824
17% 16%
FY12 3Q13 LTM**
1,329 1,369 1,229 1,250
* CAPEX excluding licenses ** CAPEX excludes EUR 136 million of non-cash increase in Intangible Assets related to the contract with Terna in relation to the Right of Way of WIND’s backbone in 1Q13
CAPEX CAPEX / Revenue EBITDA EBITDA Margin
1,266

11
© V
impelC
om
Ltd
2013
424 426 412 441
415
46.9% 45.5% 47.7% 48.5% 47.7%
3Q12 4Q12 1Q13 2Q13 3Q13
904 937 864
910 869
3Q12 4Q12 1Q13 2Q13 3Q13
Africa & Asia* 3Q13: Stable EBITDA Organically Despite Regulatory and Governmental Measures
Revenues (USD million)
-4% YoY Organic -1% YoY
EBITDA and EBITDA Margin (USD million)
-2% YoY Organic -1% YoY
CAPEX** (USD million)
Highlights:
• Revenue of USD 869 million, an organic decline of 1%, impacted by regulatory and governmental actions
• EBITDA declined 1% YoY organically, leading to an EBITDA margin of 47.7%
• Subscriber base increased 4% to 87.2 million
• CAPEX increased due to the network update and modernization in Pakistan
• Algeria: maintained market leadership despite ongoing limitations, with stable revenues YoY and EBITDA margin of 57.2%
• Pakistan: revenues up 5% YoY, impacted by governmental actions and a severe power black out with EBITDA margin of 43.1%
• Bangladesh: revenues declined 15% YoY, due to ongoing deactivation of suspected VoIP customers; EBITDA margin increased 7 p.p. to 36.3% as result of cost control measures and lower SIM tax subsidy
400 372
11% 10%
FY12 3Q13 LTM
* This segment includes our operations in Algeria, Pakistan, Bangladesh, Sub-Saharan Africa and South East Asia ** CAPEX excluding licenses
CAPEX CAPEX / Revenue EBITDA EBITDA Margin

12
© V
impelC
om
Ltd
2013
1.8 1.8
1.6 1.5 1.7
51.2% 52.5% 49.0% 48.0% 49.6%
3Q12 4Q12 1Q13 2Q13 3Q13
3.3 3.2 2.9 2.9 3.1
0.3 0.3 0.3 0.3 0.3
3Q12 4Q12 1Q13 2Q13 3Q13
Thousands
Ukraine 3Q13: Pressure on Results Whilst Taking Measures to Improve Performance
Revenues (UAH billion)
-7% YoY
EBITDA and EBITDA Margin (UAH billion)
-10% YoY
CAPEX* (UAH billion)
Highlights:
• Revenues decreased 7% YoY to UAH 3.4 billion due to YoY decline in mobile revenues, primarily as customers switched to lower priced bundled tariff plans and lack of up-selling
• EBITDA declined 10% YoY to UAH 1.7 billion, leading to an EBITDA margin of 49.6%
• Measures taken to improve performance
1.8 1.8
14% 14%
FY12 3Q13 LTM
CAPEX CAPEX / Revenue
3.6
EBITDA EBITDA Margin Mobile Fixed-line
3.2 3.5
* CAPEX excluding licenses
3.2 3.4

13
© V
impelC
om
Ltd
2013
440 449 412
441 471
38 38
38
41
42
3Q12 4Q12 1Q13 2Q13 3Q13
234 235 220
240 246
49.0% 48.1% 48.8% 49.8% 48.0%
3Q12 4Q12 1Q13 2Q13 3Q13
CIS* 3Q13: Continued Positive Performance
Revenues (USD million)
+7% YoY Organic +9% YoY
478
EBITDA and EBITDA Margin (USD million)
+5% YoY Organic +6% YoY
CAPEX** (USD million)
384 436
22% 23%
FY12 3Q13 LTM
* This segment includes our operations in Kazakhstan, Uzbekistan, Armenia, Kyrgyzstan, Tajikistan and Georgia
** CAPEX excluding licenses
482 488
451
Highlights:
• Revenues increased 9% YoY organically and EBITDA increased 6% YoY organically
• EBITDA margin declined 1.0 p.p to 48.0%
• Mobile subscribers increased 8% YoY to 24.9 million
• Mobile data subscriber base grew 16% YoY to 13.0 million; mobile data revenue growth of 57% YoY
• Kazakhstan: improved market position due to attractive value proposition in the market with bundles, resulting in strong revenue growth
CAPEX CAPEX / Revenue EBITDA EBITDA Margin Mobile Fixed-line
513

14
© V
impelC
om
Ltd
2013 Financial Highlights 3Q 2013
Henk van Dalen CFO

15
© V
impelC
om
Ltd
2013
BUSINESS UNITS
Revenue EBITDA
Organic FX and others
Reported Organic FX and others
Reported
Russia +1% -2% -1% 0% -2% -2%
Italy -6% +6% 0% -6% +6% 0%
Africa & Asia -1% -3% -4% -1% -1% -2%
Ukraine -7% 0% -7% -10% 0% -10%
CIS +9% -2% +7% +6% -1% +5%
Total -1% 0% -1% -2% 0% -2%
Financial Performance 3Q13
• Overall revenue decline on an organic basis was 1% YoY impacted by MTR cuts in Italy
• EBITDA decreased 2% YoY impacted by MTR cuts in Italy, deactivation of suspected VoIP customers in Bangladesh and USD 27 million in one-off charges
• Stable YoY Revenue and EBITDA excl. MTR cuts and one-offs
• EBIT decreased 2% YoY due to decline in EBITDA, impairment of Laos and equipment of in total USD 45 million, offset by the positive impact of declining amortization of intangible assets
• Net income attributable to VimpelCom shareholders decreased 53% YoY as a result of negative non-cash FX ($54m), higher finance costs ($31m) and higher tax expenses due to deferred tax provision related to future intercompany dividends from OJSC VimpelCom ($124m)
GROUP
(USD million) 3Q13 3Q12 YoY
Revenues 5,685 5,747 -1%
EBITDA 2,474 2,530 -2%
D&A/Other (1,241) (1,275) -3%
EBIT 1,233 1,255 -2%
Financial income / expenses (526) (472) 11%
FX and Other (42) 19 n.m.
Profit before tax 665 802 -17%
Tax (390) (225) 73%
Non-controlling interest (20) (39) n.m.
Net income* 255 538 -53%
* Net Income attributable to VimpelCom shareholders

16
© V
impelC
om
Ltd
2013
27,386 (4,764)
22,622 471 634 96 288 972 (93) (2,505) 22,485
5,081 27,566
Key Components
* LTM stands for “last twelve months” to reporting date
Net Cash Flow From Operating Activities (USD billion)
Debt, Cash and Ratios
2.0 2.3 1.35 1.4 1.7
7.3 6.7
3Q12 4Q12 1Q13 2Q13 3Q13 FY12 3Q13
LTM
(USD million)
Sep 30, 2013
Cash, Cash Equivalents and deposits 5,081
Total Assets 53,051
Gross Debt 27,566
-Short-term 1,714
-Long-term 25,852
Shareholders' equity 14,255
Gross Debt/Assets 0.5
Net Debt 22,485
3Q13 LTM EBITDA 9,693
Pro-forma ratios LTM 3Q13* Sep 30,
2013
Net Debt/ EBITDA 2.3
EBITDA/ Financial Income 4.8
and Expenses
Gross Debt/ EBITDA 2.8
Consolidated Cash and Net Debt Development Actual 3Q 2013 (USD million)
Opening gross debt
Opening cash
& deposits
Opening net debt
Net FX effect
(Cash + Debt)
Net Interest
Paid
Other Cash tax
paid
Cash CAPEX
Change in working capital
Cash flow from
operations
Closing net debt
Closing cash
& deposits
Closing gross debt

17
© V
impelC
om
Ltd
2013
30%
48%
20%
2%
USD
EUR
RUB
Other
30%
49%
19%
2%
4Q13 2014 2015 2016 2017 2018 2019 2020 2021 2022 2023 >2023
Wind
GTH
VimpelCom/OJSC
2.6
0.8 1.3
0.2
1.5 2.4
9.3
6.0
0.8 1.0 0.6 1.0
Well Balanced Debt Composition and Maturity Profile
During 3Q13
• Repayment of Ruble Bond by OJSC VimpelCom for RUB 10 billion (USD 0.3 billion).
Available headroom under committed revolving credit facilities per September 2013:
• EUR 250 million (USD 338 million) for Wind
• RUB 15 billion (USD 464 million) for Russia
• EUR 205 million (USD 277 million) and USD 225 million for VIP HQ
Group Debt Maturity Schedule per 30 September 2013
Debt Composition by Currency**
Other information
* Maturing OJSC debt of USD 0.1 bn in 4Q13 and USD 0.4 bn in 2014 has been financed by the Eurobonds issued in 1Q13
** After effect of cross currency swaps
2Q13 3Q13
* *

18
© V
impelC
om
Ltd
2013 Conclusion
Jo Lunder CEO

19
© V
impelC
om
Ltd
2013
Stable Underlying Results Impacted by Regulatory Measures and Market Slowdown
• Revenues impacted by competitive pressure, market slowdown, regulatory and governmental measures
• Strong mobile data revenue growth
• Russian operational developments on track
• Continued outperformance in Italy
• High EBITDA margin and solid cash flow*
• Interim 2013 dividend of USD 0.45 per share
* Net cash from operating activities

20
© V
impelC
om
Ltd
2013
Analyst & Investor Conference 2014, London
September 10, 2013: VimpelCom became listed on NASDAQ October 29, 2013: VimpelCom included in NASDAQ 100 Index
London The Savoy Hotel January 28th - 29th
2014

21
© V
impelC
om
Ltd
2013 Q&A

22
© V
impelC
om
Ltd
2013
Further information
Investor Relations
Claude Debussylaan 88 1082 MD Amsterdam
The Netherlands
T: +31 20 79 77 234 E: [email protected]
Install VimpelCom iPad App
Visit our new website www.vimpelcom.com

23
© V
impelC
om
Ltd
2013 Thank you!

24
© V
impelC
om
Ltd
2013 Appendices

25
© V
impelC
om
Ltd
2013
Source: National Banks of the respective countries, Company calculations
FOREX Development
3Q13 3Q12 YoY 3Q13 FY12 Delta
Russian Ruble 32.80 32.00 -2.4% 32.35 30.37 -6.1%
Euro 0.75 0.80 6.0% 0.74 0.76 2.5%
Algerian Dinar 80.66 80.76 0.1% 81.69 78.94 -3.4%
Pakistan Rupee 102.97 94.53 -8.2% 106.06 97.14 -8.4%
Bangladeshi Taka 77.74 81.67 5.1% 77.67 79.78 2.7%
Ukrainian Hryvnia 7.99 7.99 0.0% 7.99 7.99 0.0%
Kazakh Tenge 152.91 149.67 -2.1% 153.62 150.74 -1.9%
Armenian Dram 408.77 410.88 0.5% 405.29 403.58 -0.4%
Kyrgyz Som 48.84 47.03 -3.7% 48.62 47.40 -2.5%
Average rates Closing rates

26
© V
impelC
om
Ltd
2013
Reconciliation Tables
* Income statement 2Q12 and HY12 has been amended to reflect classification of certain operating costs at the Group level without any impact on net income and performance of the business unit
Reconciliation of consolidated EBITDA of VimpelCom* USD mln 3Q13 3Q12 9M13 9M12
Unaudited
EBITDA 2,474 2,530 7,247 7,322
Depreciation (726) (721) (2,240) (2,168)
Amortization (441) (507) (1,333) (1,561)
Impairment loss (45) - (67) -
Loss on disposals of non-current assets (29) (47) (43) (131)
EBIT 1,233 1,255 3,564 3,462
Financial Income and Expenses (526) (472) (1,548) (1,391)
- including finance income 21 35 70 116
- including finance costs (547) (507) (1,618) (1,507)
Net foreign exchange (loss)/gain and others (42) 19 (46) 53
- including Other non-operating (losses)/gains 5 (29) 22 (31)
- including Shares of loss of associates and joint ventures accounted for using the equity method (29) 12 (112) (16)
- including Net foreign exchange gain (18) 36 44 100
EBT 665 802 1,970 2,124
Income tax expense (390) (225) (807) (711)
Profit/(loss) for the year 275 577 1,163 1,413
(Profit)/loss for the year attributable to non-controlling interest (20) (39) 73 (69)
Profit for the year attributable to the owners of the parent 255 538 1,236 1,344

27
© V
impelC
om
Ltd
2013
Reconciliation of consolidated net debt of VimpelCom
Reconciliation Tables
USD mln3Q12 2Q13 3Q13
Net debt 22,681 22,622 22,485
Cash and cash equivalents 3,241 4,551 4,890
Long - term and short-term deposits 715 213 191
Gross debt 26,637 27,386 27,566
Interest accrued related to financial liabilities 451 574 430
Fair value adjustment 28 - -
Unamortised fair value adjustment under acquisition method of accounting 817 718 696
Other unamortised adjustments to financial liabilities (fees, discounts etc.) 69 38 43
Derivatives not designated as hedges 429 474 489
Derivatives designated as hedges 178 172 218
Total other financial liabilities 28,609 29,362 29,442